


Non-technical Summary
Organismal morphology was at the core of study of biodiversity for millennia before the formalization of the concept of evolution. In the early to mid-twentieth century, a strong theoretical framework was developed for understanding both pattern and process of morphological evolution. The 50 years since the founding of this journal capture a transformational period for the study of evolutionary morphology, in both how it is measured and how changes through time are reconstructed. We are now at another key transition point in the study of morphological evolution, with the availability of vast amounts of high-resolution data sampling living and extinct species allowing “omics”-scale analysis. Artificial intelligence is accelerating the pace of phenomic (high-dimensional, organism-wide) data collection. This new reality, in which the ability to obtain data is quickly outpacing the ability to analyze it with robust, realistic evolutionary models, brings a new set of challenges. Fully transitioning the study of morphological evolution into the omics era will involve the development of tools to automate the extraction of meaningful, comparable morphometric data from images, integrate fossil data into large phylogenetic trees and downstream evolutionary analyses, and generate models that accurately reflect the complexity of evolutionary processes and are well-suited for high-dimensional data. Combined, these advancements will solidify the emerging field of evolutionary phenomics and appropriately center it around the analysis of deep-time data.
Introduction
The study of morphological evolution is, in a sense, as old as biology, with pre-Darwinian attempts to classify the world—from the scala naturae, or Great Chain of Being, to early representations of the tree of life—being based on an intuitive sense of the hierarchy of anatomical complexity (Gontier Reference Gontier2011). For millennia, the study of morphology was relatively qualitative and descriptive, although often insightful, but more quantitative approaches began appearing in the nineteenth century, with the first descriptions of phenomena such as Cope’s rule (Cope Reference Cope1885a,Reference Copeb,Reference Copec), which proposed an evolutionary trend toward increased body size in lineages. Many of the key foundational concepts for the quantitative study of morphological evolution appeared during the modern synthesis of the mid-twentieth century, from adaptive landscapes to radiations (Wright Reference Wright1932; Dobzhansky Reference Dobzhansky1937; Simpson Reference Simpson1944). Since then, quantification of morphology has benefited from many transformational shifts. Computational power is one, and phylogenetics is another, allowing for explicit analysis of change along lineages. Coupled with access to seemingly limitless amounts of data, advancements in paleobiology, as well as in molecular and developmental biology, have spurred new understanding of how, when, and why morphologies evolve.
As a result of these advancements, there has been a huge increase in interest and work in the field of morphological evolution over the last few decades, with increasing numbers of publications using the term “morphological evolution” or “evolutionary morphology” year after year (Fig. 1). Many of the foundational concepts in the study of morphological evolution were laid down in a period coincident with the founding of this journal (Gould Reference Gould1966, Reference Gould1970, Reference Gould1971, Reference Gould1980; Lewontin Reference Lewontin1966; Raup Reference Raup1966; Eldredge and Gould Reference Eldredge, Gould and Schopf1972; Van Valen Reference Van Valen1973; Pilbeam and Gould Reference Pilbeam and Gould1974; Lande Reference Lande1976; Gould and Eldredge Reference Gould and Eldredge1977; Gould and Lewontin Reference Gould and Lewontin1979). A transition point in the study of morphological evolution can be identified around 1990, closely following the paleobiological revolution (Sepkoski and Ruse Reference Sepkoski and Ruse2015) and the establishment of analytical paleobiology. Fittingly, the 1990s saw the publication of some of the most influential papers in the areas of macroevolution, disparity, and morphological evolution published (Gould Reference Gould1988, Reference Gould1991; Arnold Reference Arnold1992; Foote et al. Reference Foote, Gould, Lee, Briggs, Fortey and Wills1992; Foote Reference Foote1993a,Reference Footeb, Reference Foote1994, Reference Foote1997a,Reference Footeb; Wills et al. Reference Wills, Briggs and Fortey1994; Fortey et al. Reference Fortey, Briggs and Wills1996; Jablonski et al. Reference Jablonski, Chaloner and Hallam1997).
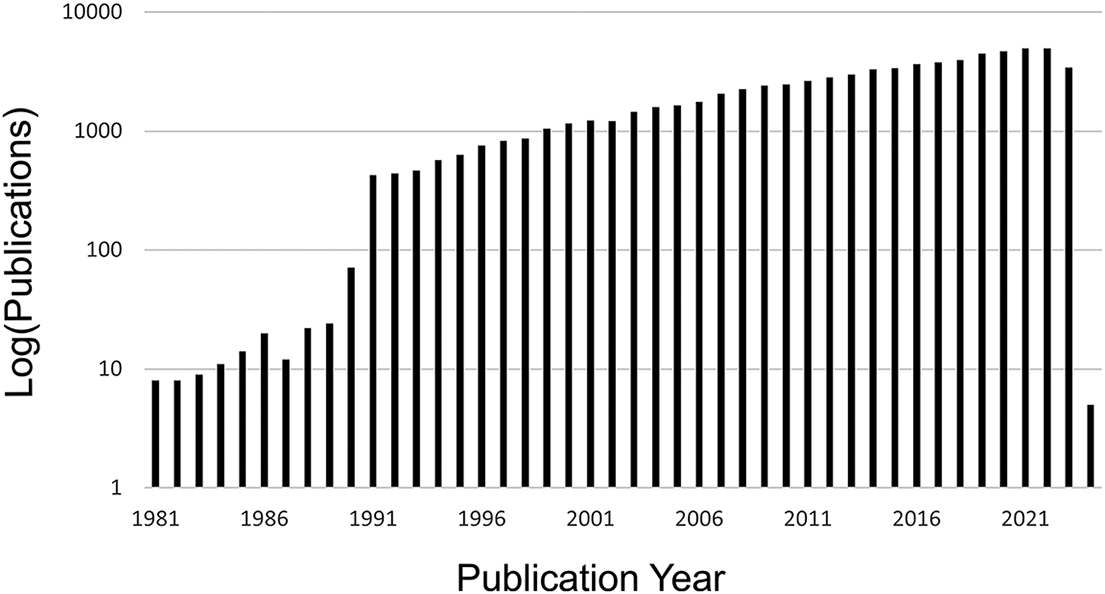
Figure 1. Increasing number of publications using the term “morphological evolution” or “evolutionary morphology” according to Web of Science (data downloaded on October 30, 2023). A transition point is visible around 1990, with a marked increase in use of these terms in publications after that time.
Recent years have heralded in many ways another transition point in the study of morphological evolution. The explosion of imaging tools and online databases for capturing organismal form in unprecedented detail (Houle et al. Reference Houle, Govindaraju and Omholt2010; Goswami Reference Goswami2014; Boyer et al. Reference Boyer, Gunnell, Kaufman and McGeary2016; Davies et al. Reference Davies, Rahman, Lautenschlager, Cunningham, Asher, Barrett and Bates2017) represents a new leap forward in the study of morphology, bringing the study of phenotype firmly into the “omics” age. The integration of morphometrics and evolutionary modeling over the past few decades is now reaching a new stage of innovation, as large-scale multivariate analyses are increasingly achievable (e.g., Clavel et al. Reference Clavel, Escarguel and Merceron2015; Cooney et al. Reference Cooney, Bright, Capp, Chira, Hughes, Moody, Nouri, Varley and Thomas2017; Arbour et al. Reference Arbour, Curtis and Santana2019; Price et al. Reference Price, Friedman, Corn, Martinez, Larouche and Wainwright2019; Booher et al. Reference Booher, Gibson, Liu, Longino, Fisher, Janda and Narula2021; Coombs et al. Reference Coombs, Felice, Clavel, Park, Bennion, Churchill, Geisler, Beatty and Goswami2022; Goswami et al. Reference Goswami, Noirault, Coombs, Clavel, Fabre, Halliday and Churchill2022; Navalón et al. Reference Navalón, Bjarnason, Griffiths and Benson2022). These innovations bring new possibilities for improving our understanding of the evolution of organismal form and diversity, as well as broadening the availability of free tools and open data to a wider pool of global scientists (Revell Reference Revell2012; Goswami Reference Goswami2014; Boyer et al. Reference Boyer, Gunnell, Kaufman and McGeary2016; Rolfe et al. Reference Rolfe, Pieper, Porto, Diamond, Winchester, Shan, Kirveslahti, Boyer, Summers and Maga2021). Here, we review major areas of interest in the study of morphological evolution, focusing on new methods and their impact on the field. We demonstrate with a worked example how better data and methods can improve our understanding of the tempo and mode of morphological evolution, both through refined modeling of complex scenarios and greater resolution in empirical analyses. In total, we present a view of a field in its prime, with evolutionary phenomics presenting huge potential for transforming our understanding of life on Earth in the past, present, and future.
Quantifying Morphology
Morphology can and has been measured in numerous ways. For centuries, discrete (usually binary), meristic, and univariate traits have dominated, and in many ways still do. Discrete traits continue to be the primary morphological data for phylogenetic analysis, particularly those incorporating taxa without molecular data available, which includes nearly all extinct species (Lee and Palci Reference Lee and Palci2015). Discrete and meristic data also form the primary data for much of the foundational and continuing work on morphological disparity and evolutionary tempo (Briggs et al. Reference Briggs, Fortey and Wills1992; Foote Reference Foote1992a, Reference Foote1994, Reference Foote1995, Reference Foote1999; Wills et al. Reference Wills, Briggs and Fortey1994; Brusatte et al. Reference Brusatte, Benton, Ruta and Lloyd2008; Halliday and Goswami Reference Halliday and Goswami2016; Halliday et al. Reference Halliday, Upchurch and Goswami2016; Deline and Ausich Reference Deline and Ausich2017; Clark et al. Reference Clark, Hetherington, Morris, Pressel, Duckett, Puttick, Schneider, Kenrick, Wellman and Donoghue2023), as they offer the benefit of being readily applicable to incomplete taxa or those with preservational deformation, as well as being better suited to taxa with variable numbers of elements or those without clear homology across structures (Briggs et al. Reference Briggs, Fortey and Wills1992). Univariate data similarly offer numerous benefits, including being more directly comparable across disparate taxa; faster to capture, which often translates into larger sample sizes; and easier to measure, even with preservational differences, particularly for soft-bodied taxa or spirit-preserved specimens. As a result, traits like body size continue to dwarf other measures of morphological evolution (Gould Reference Gould1966; Jablonski Reference Jablonski, Jablonski, Erwin and Lipps1996; Butler and Goswami Reference Butler and Goswami2008; Venditti et al. Reference Venditti, Meade and Pagel2011; Evans et al. Reference Evans, Jones, Boyer, Brown, Costa, Ernest and Fitzgerald2012; Clavel and Morlon Reference Clavel and Morlon2017; Benson et al. Reference Benson, Hunt, Carrano and Campione2018; Cooney and Thomas Reference Cooney and Thomas2021; Burin et al. Reference Burin, Park, James, Slater and Cooper2023). Linear measurements of specific structures also offer the benefit of being more readily translatable to developmental, functional, and biomechanical properties, such as lever arms or hydrodynamics (Wainwright Reference Wainwright2007; Cardini and Polly Reference Cardini and Polly2013; Price et al. Reference Price, Friedman, Corn, Martinez, Larouche and Wainwright2019, Reference Price, Friedman, Corn, Larouche, Brockelsby, Lee and Nagaraj2022). Even with the explosion of omics in molecular analyses, studies linking morphological and molecular evolution on a macroevolutionary scale frequently use full genomes but only one or a handful of univariate or discrete phenotypic traits (Fondon and Garner Reference Fondon and Garner2004; Lartillot and Poujol Reference Lartillot and Poujol2011; Zhang et al. Reference Zhang, Li, Li, Li, Larkin, Lee and Storz2014; Levy Karin et al. Reference Levy Karin, Wicke, Pupko and Mayrose2017; Partha et al. Reference Partha, Chauhan, Ferreira, Robinson, Lathrop, Nischal, Chikina and Clark2017, Reference Partha, Kowalczyk, Clark and Chikina2019; Wu et al. Reference Wu, Yonezawa and Kishino2017; Yuan et al. Reference Yuan, Zhang, Zhang, Liu, Wang, Gao and Hoelzel2021; Christmas et al. Reference Christmas, Kaplow, Genereux, Dong, Hughes, Li and Sullivan2023), despite the capacity to capture dense shape data with geometric approaches and its frequent usage in microevolutionary analyses, such as quantitative trait locus studies (e.g., Alexandre et al. Reference Alexandre, Vrignaud, Mangin and Joly2015; Maga et al. Reference Maga, Navarro, Cunningham and Cox2015; Fruciano et al. Reference Fruciano, Franchini, Kovacova, Elmer, Henning and Meyer2016).
Comparison of forms via geometric differences also has a long history (Thompson Reference Thompson1917), but this has proliferated in recent decades with the development of geometric morphometrics (i.e., landmark- and semilandmark-based morphometrics; Gower Reference Gower1975; Mardia et al. Reference Mardia, Kent and Bibby1979; Bookstein Reference Bookstein1986, Reference Bookstein1991; Mardia and Dryden Reference Mardia and Dryden1989; Rohlf and Bookstein Reference Rohlf and Bookstein1990; Dryden and Mardia Reference Dryden and Mardia1992; Adams et al. Reference Adams, Rohlf and Slice2013; Gunz and Mitteroecker Reference Gunz and Mitteroecker2013; Mitteroecker and Schaefer Reference Mitteroecker and Schaefer2022), as well as other multivariate quantifications of shape, from outlines (Rohlf Reference Rohlf1986; Foote Reference Foote1993a; Crampton Reference Crampton1995; Bookstein Reference Bookstein1997; Haines and Crampton Reference Haines and Crampton2000; Hopkins Reference Hopkins2014) to surfaces (Wang et al. Reference Wang, Sudijono, Kirveslahti, Gao, Boyer, Mukherjee and Crawford2019; Kirveslahti and Mukherjee Reference Kirveslahti and Mukherjee2021). Geometric approaches offer several benefits over linear morphometrics, including explicitly capturing shape and allowing more precise identification of points of difference between specimens. However, there are also drawbacks to geometric approaches, including limitations in identifying homologous points in disparate organisms and sensitivity to registration approach (e.g., covariation induced by Procrustes superimposition; Zelditch and Swiderski Reference Zelditch and Swiderski2023) and deformation (Angielczyk and Sheets Reference Angielczyk and Sheets2007). There are several recent overviews of geometric morphometric approaches (Adams et al. Reference Adams, Rohlf and Slice2013; Mitteroecker and Schaefer Reference Mitteroecker and Schaefer2022), and so a full review is not provided here, but despite the shortcomings (and indeed, all methods have shortcomings), it is uncontroversial that the capacity to capture and compare complex shapes, particularly in three dimensions, has revolutionized the study of morphological evolution and produced novel understanding of the primary axes of variation across diverse organisms.
It is in this realm of 3D morphometrics that we have seen the most gains in recent years. At present, the most common approaches to studying morphology remain length measurements or small numbers of landmarks, which utilize only an infinitesimal amount of the possible data available in these images. This constraint is due largely to the time requirements and accessibility of tools for imaging, segmentation, and morphometric data collection. However, high-resolution imaging has become increasingly accessible, with photogrammetry (e.g., Falkingham Reference Falkingham2011; Mallison and Wings Reference Mallison and Wings2014) and surface scanners proving low-cost options, and micro-computed tomography and even synchrotron scanning becoming more widely available. Possibly even more influential is the rapid growth of online databases for 3D images (Goswami Reference Goswami2014; Boyer et al. Reference Boyer, Gunnell, Kaufman and McGeary2016; Cross Reference Cross2017; Davies et al. Reference Davies, Rahman, Lautenschlager, Cunningham, Asher, Barrett and Bates2017), which provides access to scans across the globe without the need to travel for primary data collection. The scale of generation of new scans has also increased with the introduction of robotic arm systems to autoload specimens and allow for mass scanning of specimens (Rau et al. Reference Rau, Marathe, Bodey, Petersen, Batey, Cippicia, Li and Goswami2021). Computational power to process large numbers of images has similarly increased, with computer vision and deep learning approaches to segmentation making rapid image analysis of massive tomographic datasets entirely feasible (Lösel et al. Reference Lösel, van de Kamp, Jayme, Ershov, Faragó, Pichler and Jerome2020; Shu et al. Reference Shu, Yang, Wu, Xin, Pang, Kavan and Liu2022; Toulkeridou et al. Reference Toulkeridou, Gutierrez, Baum, Doya and Economo2023; He et al. Reference He, Mulqueeney, Watt, Salili-James, Barber, Camaiti and Hunt2024a; He et al. Reference He, Camaiti, Roberts, Mulqueeney, Didziokas and Goswami2024b; Mulqueeney et al. Reference Mulqueeney, Searle-Barnes, Brombacher, Sweeney, Goswami and Ezard2024b). These advancements mean that the time constraint in quantitative analysis of evolutionary morphology will imminently shift from obtaining and processing images to collecting morphometric data from those images.
There have also been some promising forays using computer vision and deep learning analysis of images to capture established types of morphometric data, including 2D outlines and 3D volumes and surface areas (Hsiang et al. Reference Hsiang, Nelson, Elder, Sibert, Kahanamoku, Burke, Kelly, Liu and Hull2018) and placement of landmarks in 2D (Porto and Voje Reference Porto and Voje2020) and 3D (Percival et al. Reference Percival, Devine, Darwin, Liu, van Eede, Henkelman and Hallgrimsson2019; Devine et al. Reference Devine, Aponte, Katz, Liu, Vercio, Forkert, Marcucio, Percival and Hallgrímsson2020; Porto et al. Reference Porto, Rolfe and Maga2021). The geometric morphometric applications, while promising, have been applied primarily within individual species, and it remains to be seen whether automated landmark placement can be successfully scaled up to datasets with higher levels of variation (He et al. Reference He, Mulqueeney, Watt, Salili-James, Barber, Camaiti and Hunt2024a). Moreover, the desire to fully leverage the data in high-resolution 3D images is reflected in the outpouring of new methods that sample shape more densely than the more established approaches noted earlier, for example, through surface sliding semilandmarks (Gunz and Mitteroecker Reference Gunz and Mitteroecker2013; Bardua et al. Reference Bardua, Felice, Watanabe, Fabre and Goswami2019), pseudolandmarks (Boyer et al. Reference Boyer, Puente, Gladman, Glynn, Mukherjee, Yapuncich and Daubechies2015), or entirely landmark-free approaches. Some of the landmark-free approaches available for comparative biological analysis include generalized Procrustes surface analysis (Pomidor et al. Reference Pomidor, Makedonska and Slice2016), deterministic atlas analysis in Deformetrica (Durrleman et al. Reference Durrleman, Prastawa, Charon, Korenberg, Joshi, Gerig and Trouvé2014; Bône et al. Reference Bône, Louis, Martin, Durrleman, Reuter, Wachinger, Lombaert, Paniagua, Lüthi and Egger2018; Toussaint et al. Reference Toussaint, Redhead, Vidal-García, Vercio, Liu, Fisher, Hallgrímsson, Tybulewicz, Schnabel and Green2021), spherical harmonics (McPeek et al. Reference McPeek, Shen, Torrey and Farid2008; Shen et al. Reference Shen, Farid and McPeek2009), eigenshapes (MacLeod Reference MacLeod1999), and topological transforms (Wang et al. Reference Wang, Sudijono, Kirveslahti, Gao, Boyer, Mukherjee and Crawford2019; Kirveslahti and Mukherjee Reference Kirveslahti and Mukherjee2021), as well as alphashapes for shape complexity (Gardiner et al. Reference Gardiner, Behnsen and Brassey2018). These approaches have various strengths and weaknesses, as expected (Bardua et al. Reference Bardua, Felice, Watanabe, Fabre and Goswami2019; Goswami et al. Reference Goswami, Watanabe, Felice, Bardua, Fabre and Polly2019; Marshall et al. Reference Marshall, Bardua, Gower, Wilkinson, Sherratt and Goswami2019; Mulqueeney et al. Reference Mulqueeney, Ezard and Goswami2024a), and the choice of what kind of morphometric data to use is invariably dependent on the goal of a given study and the challenges and limitations of the study system. While semilandmark approaches provide high-resolution descriptors of morphology, they can be time-consuming to implement (Bardua et al. Reference Bardua, Felice, Watanabe, Fabre and Goswami2019). Although there are some automated options for intraspecific analyses (Porto et al. Reference Porto, Rolfe and Maga2021; Devine et al. Reference Devine, Vidal-García, Liu, Neves, Vercio, Green and Richbourg2022), as noted earlier, most implementations for analyses spanning species will require at least some manual placement of landmarks and curves, with an automated procedure to place surface semilandmarks based on the positions of the former (e.g., as in the R package Morpho; Schlager Reference Schlager, Zheng, Li and Szekely2017). One the other hand, the ability to isolate shape changes in specific regions or to look at integration across different regions is one key factor that may argue against using methods that are not pinned to homologous points, such as pseudolandmark and other landmark-free approaches. Of course, to be biologically meaningful, all of these approaches should be applied to structures that are homologous, even if individual pseudolandmarks or control points are not, and there are undeniable benefits to the speed and detail provided by methods that do not require manual collection of morphometric data. These approaches may also benefit studies of ontogenetic and soft-tissue datasets, in which homologous points are difficult to trace even in unambiguously homologous structures (Toussaint et al. Reference Toussaint, Redhead, Vidal-García, Vercio, Liu, Fisher, Hallgrímsson, Tybulewicz, Schnabel and Green2021; Lanzetti et al. Reference Lanzetti, Chrouch, Miguez, Fernandez and Goswami2022). Figure 2 demonstrates a sample of the range of morphometric approaches available, from linear morphometrics, through geometric morphometrics with landmarks and curve and surface sliding semilandmarks, and finally to two landmark-free approaches—deterministic atlas analysis and alphashapes—showing the difference in resolution of data but also the relationship to homology in each approach.
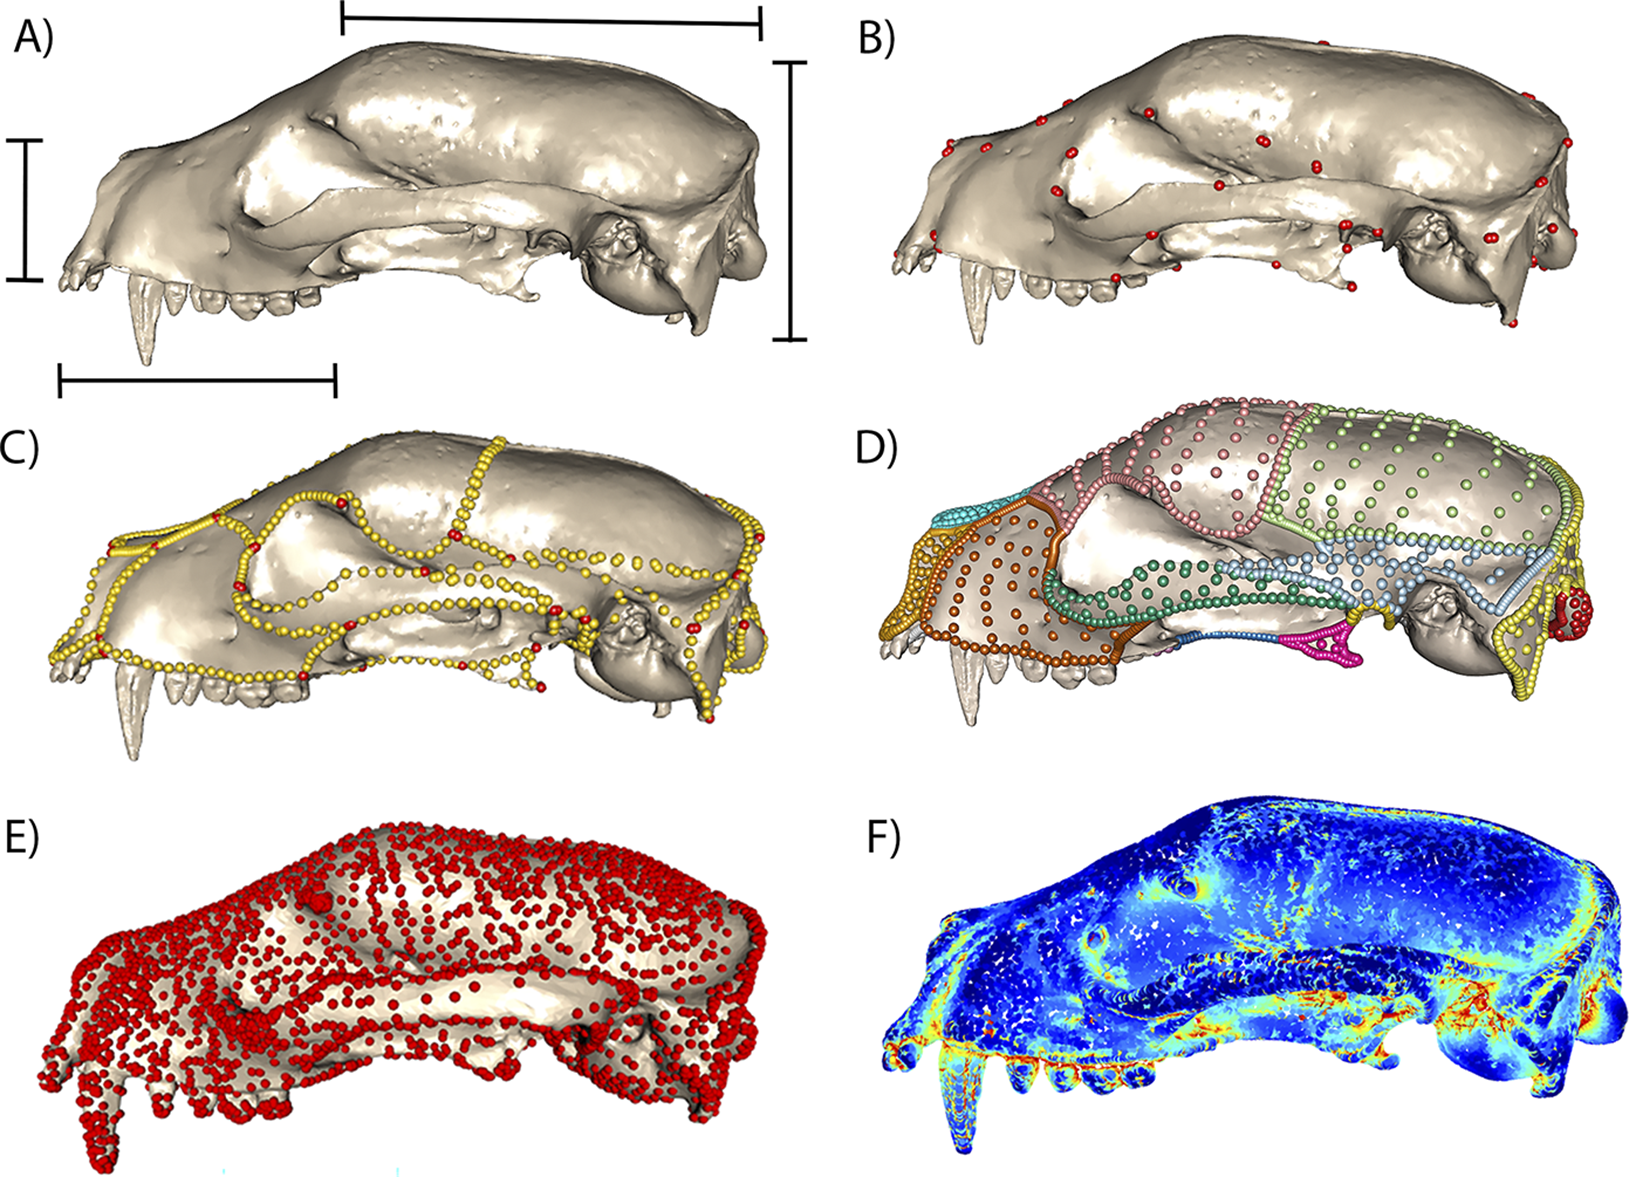
Figure 2. Linear, geometric, and landmark-free morphometric approaches, demonstrated on a 3D mesh of a mammal skull, Arctictis bintuong (MNHN 1936-1529). A, Common linear measurements, which often span elements and cannot be further localized, but are faster to obtain, more easily comparable across disparate taxa, and potentially more translatable to some aspects of function. B, Type 1 and type 2 3D landmarks, manually placed on points of unambiguous biological homology (Rohlf and Bookstein Reference Rohlf and Bookstein1990; Bookstein Reference Bookstein1991). C, Sliding semilandmark curves (gold) manually placed to link landmarks (red) and defining element boundaries, which can add substantial shape information over landmarks alone (Gunz and Mitteroecker Reference Gunz and Mitteroecker2013; Bardua et al. Reference Bardua, Felice, Watanabe, Fabre and Goswami2019; Goswami et al. Reference Goswami, Watanabe, Felice, Bardua, Fabre and Polly2019). D, Surface sliding semilandmarks, here defining individual cranial elements, automatically placed using a template and based on position relative to manually placed landmarks and curves (Gunz and Mitteroecker Reference Gunz and Mitteroecker2013; Bardua et al. Reference Bardua, Felice, Watanabe, Fabre and Goswami2019). E, Deterministic atlas analysis, which uses control points (red) to represent points of high variation across a sample and quantifies deformations from the mean shape as momenta from a flow field (Durrleman et al. Reference Durrleman, Prastawa, Charon, Korenberg, Joshi, Gerig and Trouvé2014; Bône et al. Reference Bône, Louis, Martin, Durrleman, Reuter, Wachinger, Lombaert, Paniagua, Lüthi and Egger2018; Toussaint et al. Reference Toussaint, Redhead, Vidal-García, Vercio, Liu, Fisher, Hallgrímsson, Tybulewicz, Schnabel and Green2021). F, Alphashapes, which measure a shape’s complexity as the level of refinement needed to match an original shape (Gardiner et al. Reference Gardiner, Behnsen and Brassey2018).
These innovations are pushing the study of phenotype fully into the omics age, in which the quality and density of morphological data are approaching that of molecular data, with resultant improvements in our ability to understand the evolution of morphology. What remains unclear is how comparable these different approaches and the results from their analyses are. A number of studies have demonstrated that analyses using, for example, relatively few landmarks versus dense landmarks differ in the phylogenetic, ecological, and allometric signals captured (Marshall et al. Reference Marshall, Bardua, Gower, Wilkinson, Sherratt and Goswami2019; Wimberly et al. Reference Wimberly, Natale, Higgins and Slater2022). Others demonstrate that landmark-free approaches may capture overall shape to a similar level as geometric morphometric approaches when the elements of a structure do not substantially shift in their relationships, but can diverge markedly when there are large changes in the contributions of individual elements to the overall shape of a structure. For example, deterministic atlas analysis of mammal skulls (Fig. 2E; Mulqueeney et al. Reference Mulqueeney, Ezard and Goswami2024a) captured the classic brachycephalic to dolichocephalic axis of mammal skull variation that linear morphometric analysis supports (Cardini and Polly Reference Cardini and Polly2013), but failed to capture the axes of shape variation returned with sliding semilandmarks that discriminate individual cranial elements, which have markedly different contributions to overall skull shape in different clades (Goswami et al. Reference Goswami, Noirault, Coombs, Clavel, Fabre, Halliday and Churchill2022, Reference Goswami, Noirault, Coombs, Clavel, Fabre, Halliday and Churchill2023). We fully expect that these approaches will continue to develop and proliferate with the expansion of interest, data, and automated tools, allowing for unprecedented detail in the analysis of evolutionary morphology and the formalization of the field of evolutionary phenomics.
Morphospaces and Morphological Diversity
Macroscale study of diversity has long been the domain of species numbers, for many reasons. Uncertainty about what qualifies as a species notwithstanding (Zachos Reference Zachos and Zachos2016), taxonomic diversity is easier to measure, particularly across different organisms (Sepkoski et al. Reference Sepkoski, Bambach, Raup and Valentine1981; Benton Reference Benton1995; Benson et al. Reference Benson, Butler, Close, Saupe and Rabosky2021). Yet, there is an inherent appreciation that evolution is not just a matter of numbers but also of kinds or varieties (Thomas and Reif Reference Thomas and Reif1993). A clade with a large number of fairly similar species has likely experienced a very different evolutionary history than a clade with a small number of highly dissimilar species. Moreover, morphology reflects numerous aspects of an organism’s biology, and thus morphological diversity provides novel understanding of ecological, physiological, and developmental diversity and of organism–environment interactions, among many other important topics. As such, the study of morphological diversity, or disparity, is one that has reshaped the study of morphological evolution, particularly during the pivotal period of the 1990s that saw an explosion of macroevolutionary studies of morphology. The continuing interest in disparity stems from its broad relevance; quantifying the distribution of morphological variation in the past and present informs numerous topics, from key innovations to developmental and functional constraints to extinction selectivity and response (Briggs et al. Reference Briggs, Fortey and Wills1992; Wills et al. Reference Wills, Briggs and Fortey1994; Jernvall et al. Reference Jernvall, Hunter and Fortelius1996; Foote Reference Foote1997a; Eble Reference Eble2000; Hopkins Reference Hopkins2014; Hughes et al. Reference Hughes, Gerber and Wills2015; Goswami et al. Reference Goswami, Randau, Polly, Weisbecker, Bennett, Hautier and Sánchez-Villagra2016; Halliday and Goswami Reference Halliday and Goswami2016; Benson et al. Reference Benson, Hunt, Carrano and Campione2018; Puttick et al. Reference Puttick, Guillerme and Wills2020; Dickson et al. Reference Dickson, Clack, Smithson and Pierce2021; Burin et al. Reference Burin, Park, James, Slater and Cooper2023; Clark et al. Reference Clark, Hetherington, Morris, Pressel, Duckett, Puttick, Schneider, Kenrick, Wellman and Donoghue2023; Wang and Zhou Reference Wang and Zhou2023). Analysis of disparity, particularly using variance-based metrics (Foote Reference Foote1997a), may also be less susceptible to sampling bias than is taxonomic diversity, and thus may be better suited for accurate representation of patterns in deep time, which inevitably sample only a fraction of past life (Foote Reference Foote1993a,Reference Footeb, Reference Foote1996, Reference Foote1997a,Reference Footeb). As with quantification of morphology, there are many approaches to quantification of disparity, all of which have pros and cons that have been recently reviewed (Guillerme et al. Reference Guillerme, Cooper, Brusatte, Davis, Jackson, Gerber and Goswami2020a,Reference Guillerme, Puttick, Marcy and Weisbeckerb).
Most studies of morphological disparity begin with a morphospace. Morphospaces have long been used to represent variation in biological form, both realized and theoretical. As such, they are useful for many topics of interest, from identifying physical mechanisms of (and constraints on) shape formation (Raup Reference Raup1966; Chirat et al. Reference Chirat, Moulton and Goriely2013; McGhee Reference McGhee2015; Gerber Reference Gerber2017) to identifying gaps in observed morphologies to quantifying shifts in organismal variation through time (Foote Reference Foote1994, Reference Foote1995; Holliday and Steppan Reference Holliday and Steppan2004; Wesley-Hunt Reference Wesley-Hunt2005; Halliday and Goswami Reference Halliday and Goswami2016) to estimating adaptive landscapes (McGhee Reference McGhee2006; Chartier et al. Reference Chartier, Jabbour, Gerber, Mitteroecker, Sauquet, von Balthazar, Staedler, Crane and Schönenberger2014; Dickson et al. Reference Dickson, Clack, Smithson and Pierce2021; Jones et al. Reference Jones, Dickson, Angielczyk and Pierce2021). Morphospaces can be constructed from just a few traits or can use dimensionality reduction approaches such as principal components analysis (PCA) to synthesize vast numbers of traits into a much smaller number of primary axes of variation, which can then be meaningfully interrogated and understood. Morphospaces are now common in quantitative studies of morphology, but they have important limitations that depend both on the type of data being input and the use of the morphospace for further analysis (Mitteroecker and Huttegger Reference Mitteroecker and Huttegger2009; Polly and Motz Reference Polly and Motz2016; Gerber Reference Gerber2017; Polly Reference Polly2023). Thus, it is critical to carefully consider whether input data are appropriate for visualization or further analysis using a morphospace approach. For example, traits that are not independent or that lack a common scale or scale relationship can create patterns that are not biologically meaningful (Mitteroecker and Huttegger Reference Mitteroecker and Huttegger2009). However, for most studies of evolutionary morphology, a morphospace will be the first port of call and often provides unexpected insights into macroevolutionary patterns, particularly for understudied clades.
While examples of morphospaces in evolutionary studies abound, the most famous is undeniably Raup’s (Reference Raup1966) shell coiling morphospace, which used four parameters to define a theoretical morphospace for all shelled invertebrates and plotted their empirical (largely estimated) distributions within it. Its influence endures because it is generally recognized to be both the first explicit use of this approach to understand the distribution of organismal form and the first interrogation of the factors underlying that distribution. As such, its impact stretches from evo-devo to paleobiology (Mitteroecker and Huttegger Reference Mitteroecker and Huttegger2009; Gerber Reference Gerber2017; Polly Reference Polly2023). Equally influential, however, are the iconic stacked morphospaces from Foote’s series of studies in the 1990s, which used discrete trait data to quantify and track changes in morphological variation through time in various clades of marine invertebrates (Foote Reference Foote1993b, Reference Foote1994, Reference Foote1995, Reference Foote1999). These morphospaces, and the associated disparity metrics, provided new perspective on the evolution of morphological diversity and for understanding how its relationship with taxonomic diversity provides novel insights into evolutionary processes (Foote Reference Foote1992b, Reference Foote1993a,Reference Footeb, Reference Foote1997b). High taxonomic diversity but low morphological diversity is suggestive of a constraint or radiation driven by isolation or habitat contraction (Fig. 3A, top left), whereas high morphological diversity with low taxonomic diversity suggests an early burst of morphological evolution (Fig. 3A, top center), compared with unhindered, trend-free morphological diversification in line with taxonomic diversification (Fig. 3A, top right). Shifts in disparity and morphospace occupation that result in decreases in morphological diversity later in clade evolution (as indicated in the bottom two rows of Fig. 3A and in 3B,C) also provide insight into whether and how evolutionary processes are selective or not selective. For example, Foote’s analysis of blastoids (Foote Reference Foote1993b) demonstrates diffusion through morphospace (Fig. 3B) and matched increases in taxonomic and morphological diversity early in clade evolution (Fig. 3C). Later declines in taxonomic diversity are not accompanied by reductions in disparity, suggesting that taxonomic extinctions were nonselective for morphology (Foote Reference Foote1993b).
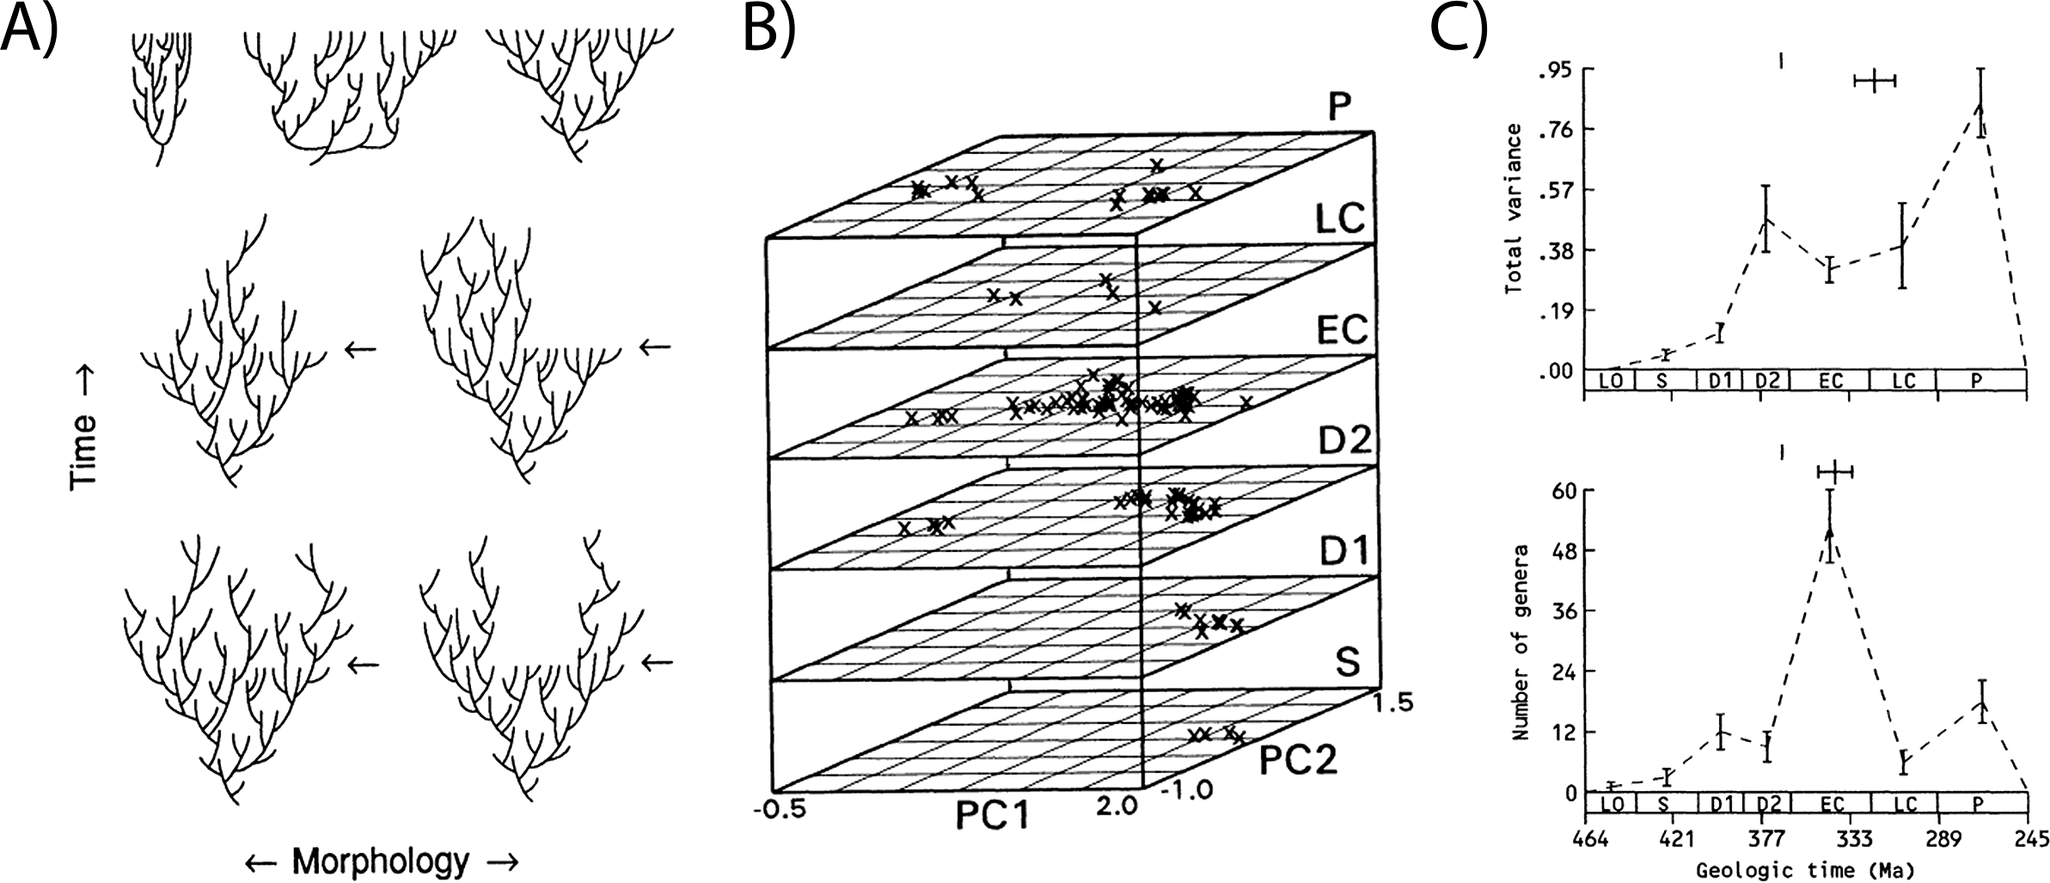
Figure 3. The relationship between morphological and taxonomic diversity provides insight into evolutionary processes, as described in Foote (Reference Foote1993b). A, Foote Reference Foote1993b: fig. 1: Idealized diversity histories of a clade under different scenarios of diversification (top row) and decline (middle and bottom row). B, Foote Reference Foote1993b: fig. 2: Stacked morphospaces showing shifts in blastoid morphology through the Paleozoic. C, Foote Reference Foote1993b: fig. 3: showing concordant early increases and discordant later declines in disparity (top) and taxonomic diversity (bottom). Figure reproduced from Foote (Reference Foote1993b).
The expected amount of disparity in a clade is intimately linked to the evolutionary process, which involves both the diversification dynamic, such as the rate of turnover in lineages, and how traits have evolved in lineages. This interplay can complicate interpretation of patterns of disparity, as a homogeneous process of trait evolution can shows changes in disparity through time that reflect solely the effects of speciation and extinction events (i.e., the branching pattern in a tree; see, for instance, O’Meara et al. Reference O’Meara, Ané, Sanderson and Wainwright2006: fig. 2). One way to capture this aspect is to focus on the contributions of subclades to overall disparity (Foote Reference Foote1993a, Reference Foote1997b). While it is possible to assess this aspect without a resolved phylogenetic tree (Foote Reference Foote1993a), this is more robustly accomplished with methods quantifying disparity through time using an explicitly phylogenetic framework. The most commonly applied approach at present is subclade disparity (Harmon et al. Reference Harmon, Schulte, Larson and Losos2003) as implemented in the R package geiger (Harmon et al. Reference Harmon, Weir, Brock, Glor and Challenger2008; Slater and Harmon Reference Slater and Harmon2013), which measures how the partitioning of morphological variation has changed through a clade’s evolution. Phylogeny-based approaches also allow the benefit of point estimates of disparity, rather than binning taxa into coarse time intervals, which may introduce additional biases into analyses (Guillerme and Cooper Reference Guillerme and Cooper2018). Another benefit of a phylogenetic framework is that also allows for ancestral-state estimation at internal nodes (Halliday and Goswami Reference Halliday and Goswami2016) and comparisons with expectations under different evolutionary models (Harmon et al. Reference Harmon, Schulte, Larson and Losos2003; Slater et al. Reference Slater, Price, Santini and Alfaro2010; Slater and Harmon Reference Slater and Harmon2013). For example, using a recently published morphometric dataset of placental mammal skulls (Goswami et al. Reference Goswami, Noirault, Coombs, Clavel, Fabre, Halliday and Churchill2022), we plotted first the empirical data (322 species spanning the Eocene to Recent; black dots in Fig. 4) using a stacked PCA binned by Cenozoic epochs. We then ran 100 simulations estimating disparity using a Brownian motion (BM) model and a dated phylogeny for the sample and binned these into the same time bins (red dots in Fig. 4, left). While the empirical and simulated data are largely similar, it is apparent that the empirical data have not diffused through morphospace as a strict BM model would estimate. Rather, placental mammals have stayed largely constrained into a single region of morphospace, with the exception of a distinct “whale” space, suggesting that convergence (or constraint) has dominated placental mammal evolution (Goswami et al. Reference Goswami, Noirault, Coombs, Clavel, Fabre, Halliday and Churchill2022). As discussed and demonstrated further later in this paper, although most simulations of disparity expectations rely on a simple BM model (Harmon et al. Reference Harmon, Schulte, Larson and Losos2003; Slater et al. Reference Slater, Price, Santini and Alfaro2010), more complex models can also be applied, as in Figure 4 (right, green dots), in which disparity was instead simulated using a variable-rate BM model with a lambda tree transformation, estimated from analysis in BayesTraits v. 3 (Venditti et al. Reference Venditti, Meade and Pagel2011; Goswami et al. Reference Goswami, Noirault, Coombs, Clavel, Fabre, Halliday and Churchill2022). From these brief introductory examples, it is clear that analysis of disparity is one of many areas that has been transformed by the development of phylogenetic comparative methods (PCMs).
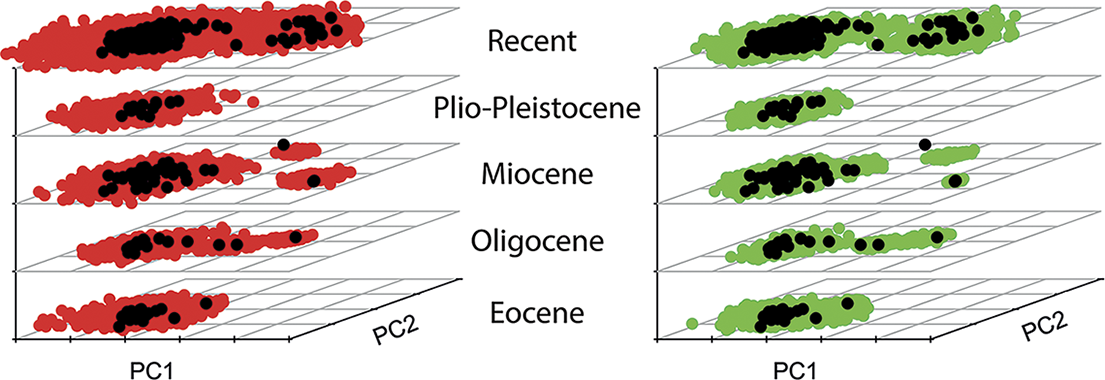
Figure 4. Stacked principal component analyses (PCAs) showing empirical (black dots) and simulated disparity through Cenozoic epochs for a sample of placental mammal skulls (Goswami et al. Reference Goswami, Noirault, Coombs, Clavel, Fabre, Halliday and Churchill2022). Left: simulations (n = 100) of a single-rate Brownian motion (BM) model (red dots). Right: simulations (n = 100) with a variable-rate BM model with lambda tree transformation (green dots).
Enter Phylogeny and the Rise of PCMs
Ever since Darwin sketched the first explicitly evolutionary tree (Darwin Reference Darwin1859), reconstructing the relationships among organisms has been a primary concern for biologists. While morphological data had been the cornerstone of phylogenetic analysis for decades (Hennig Reference Hennig1965), the advent of molecular phylogenetics saw a rapid increase in the number and stability of evolutionary trees for extant taxa, while overturning some long-held hypotheses of relationships among even well-studied clades. As evolutionary trees became more available, it became increasingly possible to incorporate understanding of relationships into estimation of evolutionary patterns and processes. Incorporating phylogeny into comparative analyses is particularly critical for the study of morphology, because it is well understood that organisms share evolutionary history and thus cannot be treated as wholly independent data points in a statistical analysis (Felsenstein Reference Felsenstein1985).
The past two decades have seen a surge in the development of PCMs dedicated to the study of morphological evolution. These methods are increasingly applied to reconstructing trait evolution, including that of complex shapes, and identifying the factors underlying their evolution across short to large timescales. There are several recent reviews of this topic (Hernández et al. Reference Hernández, Rodríguez-Serrano, Avaria-Llautureo, Inostroza-Michael, Morales-Pallero, Boric-Bargetto, Canales-Aguirre, Marquet and Meade2013; Pennell and Harmon Reference Pennell and Harmon2013; Garamszegi Reference Garamszegi2014; Goolsby Reference Goolsby2015; Cooper et al. Reference Cooper, Thomas and FitzJohn2016; Cornwell and Nakagawa Reference Cornwell and Nakagawa2017; Adams and Collyer Reference Adams and Collyer2018, Reference Adams and Collyer2019; Uyeda et al. Reference Uyeda, Zenil-Ferguson and Pennell2018; Clavel and Morlon Reference Clavel and Morlon2020; Harmon et al. Reference Harmon, Pennell, Henao-Diaz, Rolland, Sipley and Uyeda2021; Soul and Wright Reference Soul and Wright2021), and thus we focus here on a key aspects: incorporation of fossil data and extension to multivariate data and to more complex evolutionary models.
Fossils Are Critical for Accurate Estimation of Evolution
The molecular revolution, the increasing availability of robust, dated phylogenies for many clades, and the development of phylogenetic comparative approaches have fostered the studies of morphological evolution and macroevolution in general over the past few decades. However, one negative side effect of the explosion of molecular phylogenetics is the reduced use of morphological data in large-scale phylogenetic analyses. This in turn has hindered incorporation of fossils into large evolutionary trees and prevented the widespread integration of fossil data in phylogenetic comparative studies, despite recognized benefits (Slater and Harmon Reference Slater and Harmon2013). There has been substantial progress in dating fossil and mixed extant and fossil cladograms (Stadler Reference Stadler2010; Bapst Reference Bapst2013; Luo et al. Reference Luo, Duchêne, Zhang, Zhu and Ho2020) and incorporating fossil taxa using morphological information along with molecular data using “total evidence” approaches (Pyron Reference Pyron2011, Reference Pyron2017; Ronquist et al. Reference Ronquist, Klopfstein, Vilhemsen, Schulmeister, Murray and Rasnitsyn2012; Álvarez-Carretero et al. Reference Álvarez-Carretero, Goswami, Yang and Dos Reis2019), as well as the recently developed “metatree” approach (Lloyd and Slater Reference Lloyd and Slater2021). Morphometric data may also assist with resolving these issues, with development of new approaches to estimating divergences using both molecular and morphometric data, while accounting for population-level variance and trait covariances (Álvarez-Carretero et al. Reference Álvarez-Carretero, Goswami, Yang and Dos Reis2019). There are also established approaches for incorporating partial information from fossils into phylogenetic comparative studies (Slater et al. Reference Slater, Harmon and Alfaro2012a,Reference Slater, Harmon, Wegmann, Joyce, Revell and Alfarob). Nonetheless, there are still significant barriers to generating phylogenetic trees that include fossils at the same scale as those for extant taxa, including continuing conflict between molecular and morphological (extant and fossil) trees in both topology and divergence estimation (Foley et al. Reference Foley, Springer and Teeling2016; Sauquet and Magallón Reference Sauquet and Magallón2018; Lyson and Bever Reference Lyson and Bever2020), and much work needs to be done to integrate fossils into large phylogenetic trees and downstream analyses. Fortunately, most PCMs are known to be relatively robust to unresolved trees (Martins Reference Martins1996; Martins and Housworth Reference Martins and Housworth2002; Stone Reference Stone2011), and extensions to a general time-variable model allow for analysis of trends in continuous character evolution without a fully resolved phylogeny (Hunt Reference Hunt2006, Reference Hunt2007b; Finarelli and Goswami Reference Finarelli and Goswami2013; Raj Pant et al. Reference Raj Pant, Goswami and Finarelli2014).
It is crucial that these barriers to the inclusion of fossils are overcome, because there is extensive evidence that fossil data are critical for accurate analysis of macroevolutionary patterns (Slater et al. Reference Slater, Harmon and Alfaro2012a; Finarelli and Goswami Reference Finarelli and Goswami2013; Slater and Harmon Reference Slater and Harmon2013; Raj Pant et al. Reference Raj Pant, Goswami and Finarelli2014), for many reasons. Fossils provide unique factual observations in analyses, in contrast to reconstructed states, which typically cannot, for example, estimate states outside the sampled (i.e., extant) range, although we know that trait distributions change markedly through a clade’s history (Finarelli and Goswami Reference Finarelli and Goswami2013; Raj Pant et al. Reference Raj Pant, Goswami and Finarelli2014). The impact of these effects is seen in analysis of evolutionary trends, such as Cope-Depéret’s rule of body-size increases over time (Finarelli and Goswami Reference Finarelli and Goswami2013; Bokma et al. Reference Bokma, Godinot, Maridet, Ladevèze, Costeur, Solé, Gheerbrant, Peigné, Jacques and Laurin2016; Benson et al. Reference Benson, Hunt, Carrano and Campione2018). In fact, identifying a trended BM model requires fossil data. Not only does the incorporation of fossils help in assessing evolutionary processes, but it also allows improved estimation of parameters (Ané Reference Ané2008; Slater et al. Reference Slater, Harmon and Alfaro2012a; Ho and Ané Reference Ho and Ané2014a), specifically by constraining their estimation (reduced variation around parameters) compared with studies on extant-only datasets (Finarelli and Goswami Reference Finarelli and Goswami2013). For instance, the ancestral-state estimate in a BM process (although it is unbiased) is said to not be consistent because it is not improved by increasing the sample size (i.e., the variance around the parameter estimate is not reduced with infinitely large phylogenies of extant taxa). Instead, only the incorporation of fossil data improves ancestral-state estimates and detection of shifts in traits (Ané Reference Ané2008). Similarly, in an Ornstein-Uhlenbeck (OU) process, a modified random walk in which a trait evolves toward an optimum value, estimating the primary optimum value and the ancestral state is possible only with fossils (Ho and Ané Reference Ho and Ané2013, 2014a; Fig. 5). The ability to detect time-dependent models, in which the rate changes as a function of time—such as in an early burst model, in which rate decreases through time, as is hypothesized for adaptive radiations, or an accelerated change (AC) model, in which rates increase exponentially through time (Blomberg et al. Reference Blomberg, Garland and Ives2003)—may also be severely affected by exclusion of fossils (Slater et al. Reference Slater, Harmon and Alfaro2012a).
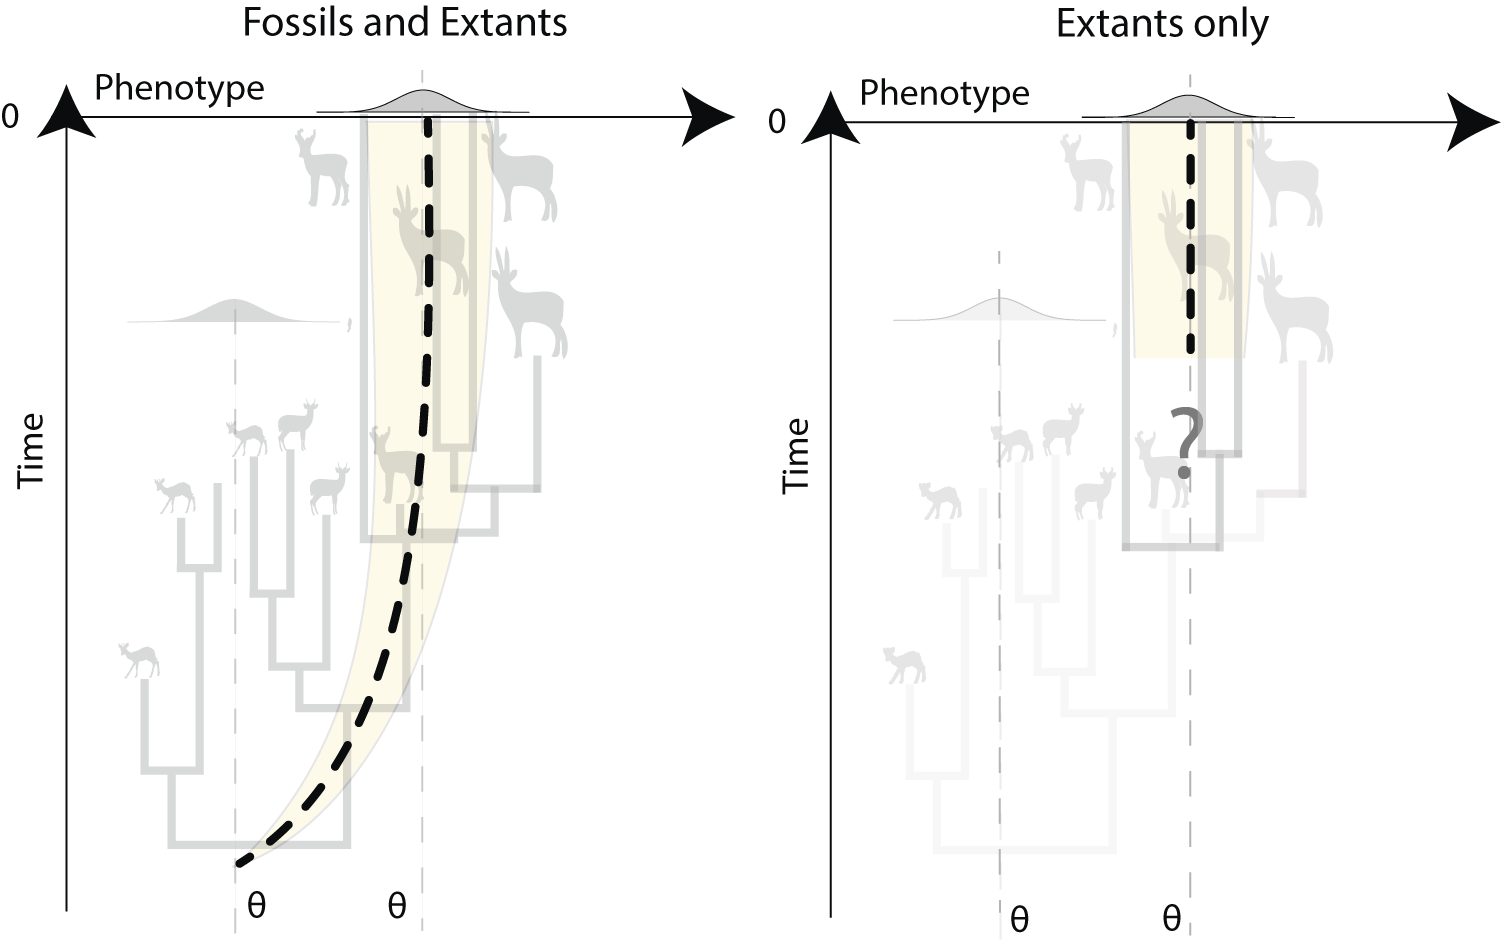
Figure 5. Inference of Ornstein-Uhlenbeck (OU) processes using trees with both fossil and extant species (non-ultrametric trees) vs. trees with extant species only (ultrametric trees). Inference based on extant species only will miss evolutionary trends (e.g., Cope’s rule or Depéret’s rule) from the ancestral phenotype to the primary optimum value. This can lead to inaccurate estimation of ancestral states, incorrect reconstruction of evolutionary dynamics, and thus spurious interpretations.
Fossil data not only assist in estimating and constraining the parameters of evolutionary models, but they are also critical for distinguishing different processes. For example, consider the OU process and the AC models mentioned earlier. The expected covariance matrices for both of these models are proportional on ultrametric trees (trees in which all tips are equidistant from the root, as in extant-only trees; Uyeda et al. Reference Uyeda, Caetano and Pennell2015). Because of that, they have identical likelihoods and thus cannot be distinguished. However, they can be distinguished on non-ultrametric trees (i.e., trees that include fossils; Slater et al. Reference Slater, Harmon and Alfaro2012a). Similarly, changes in evolutionary dynamics (e.g., shifts from constrained evolution to radiation, such as after an extinction event), are also largely identifiable only with trees incorporating fossils (Slater and Harmon Reference Slater and Harmon2013; Clavel et al. Reference Clavel, Escarguel and Merceron2015). For example, we can simulate an ecological release model (or the related, but slightly more complex release-and-radiate model), in which a clade is governed by an OU process due to some extrinsic constraint such as competition until a shift point, after which a BM model dominates (Fig. 6). This model was applied by Slater (Reference Slater2013) to mammalian body-size evolution before and after the end-Cretaceous mass extinction, to test the hypothesis that non-avian dinosaurs constrained body-size evolution in mammals before the dinosaur extinction. In our simulations (Fig. 6), we observe that the log-likelihood profile is almost flat around the simulated value (alpha = 2, dashed line in Fig. 6B) of the OU process for all simulated datasets when an ultrametric tree (extant only) is used. This indicates that with comparative datasets made only of extant species, such a scenario cannot be retrieved. In contrast, with non-ultrametric (fossil + extant) trees, the (negative) log-likelihood profile shows an optimum around the simulated value, allowing recovery of the shift in processes through the evolutionary history of the clade.
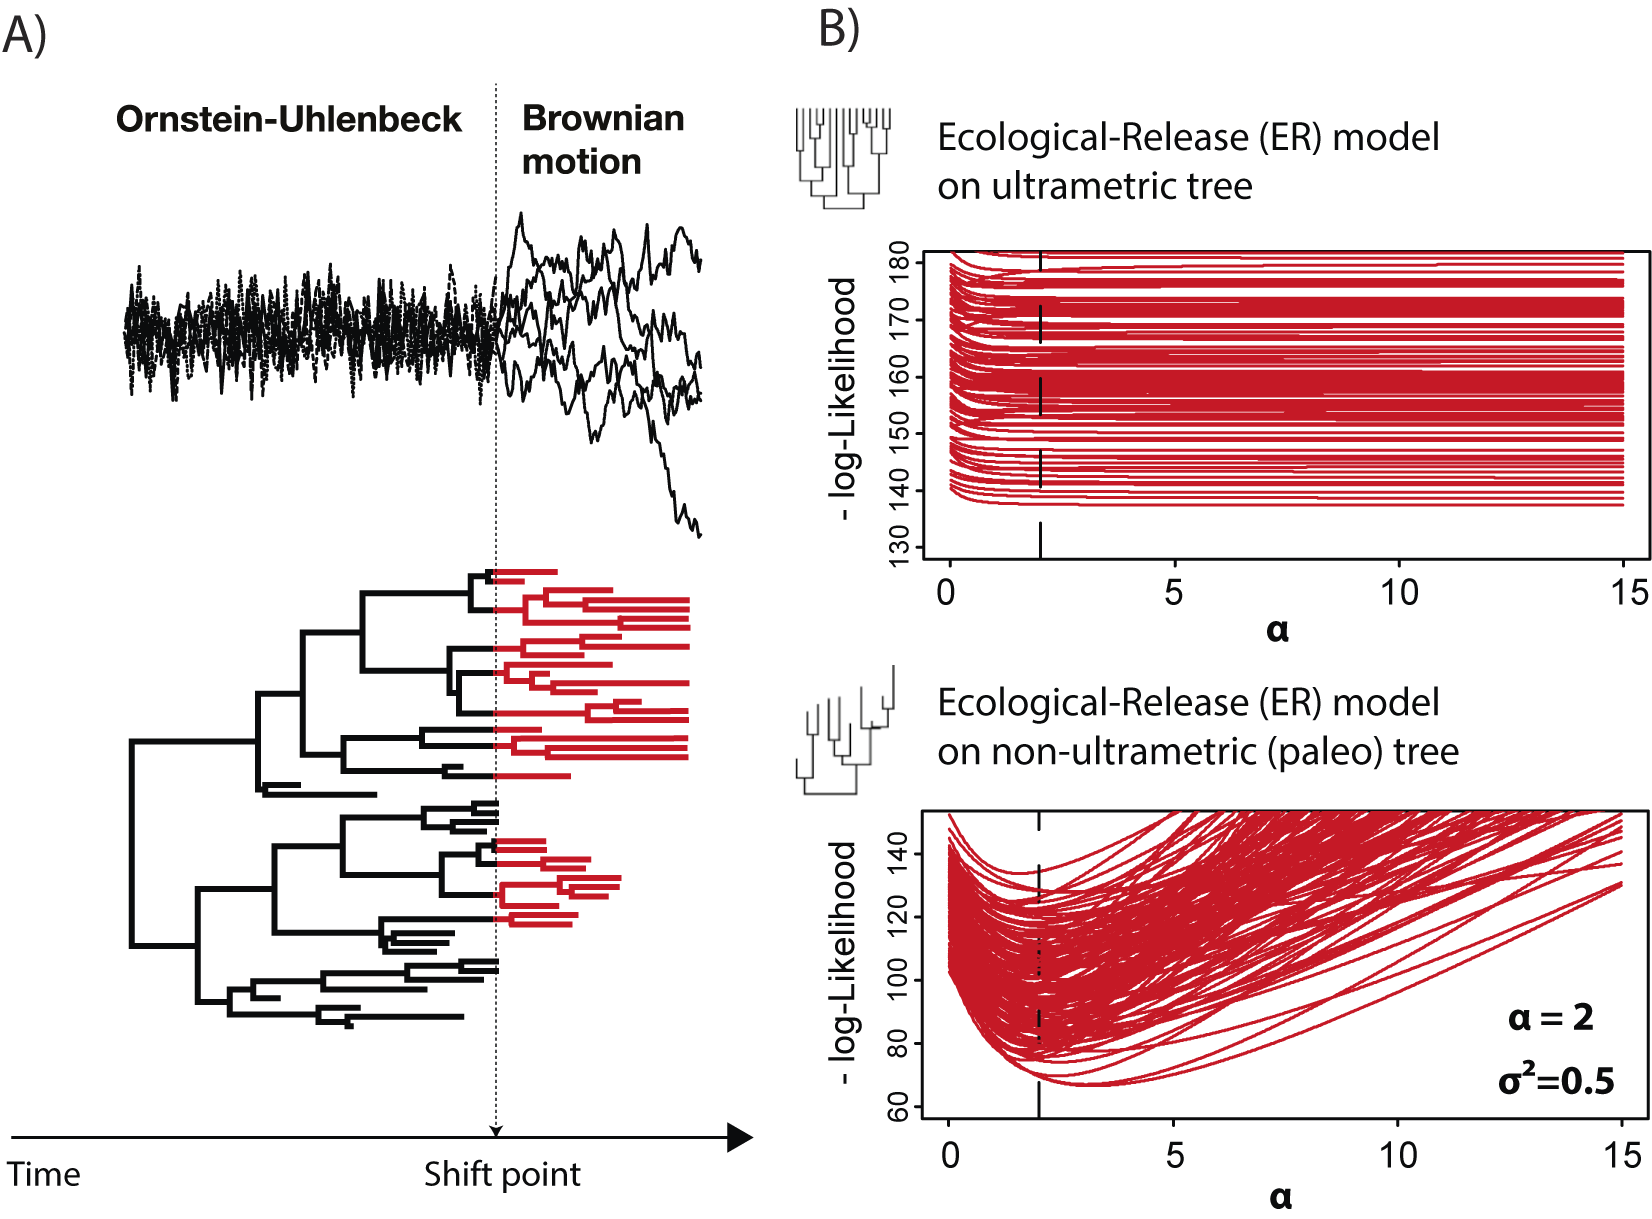
Figure 6. Identifiability of processes changes with fossil data. In A, we depict a release-and-radiate model (Slater Reference Slater2013; Clavel et al. Reference Clavel, Escarguel and Merceron2015), in which phenotypic evolution is modeled as an Ornstein-Uhlenbeck (OU) process representing constrained evolution up to a shift point, after which it switches to a Brownian motion (BM) process (radiating phase). This model was used to test whether the mammals experienced an increase in body-size diversity after the Cretaceous/Paleogene extinction (Slater Reference Slater2013). In B, we show the log-likelihood profile from the ecological release model simulations (100 datasets) when fit with ultrametric trees (top; extant only) and non-ultrametric (bottom; fossil + extant species) trees. Figure adapted from Clavel et al. (Reference Clavel, Escarguel and Merceron2015).
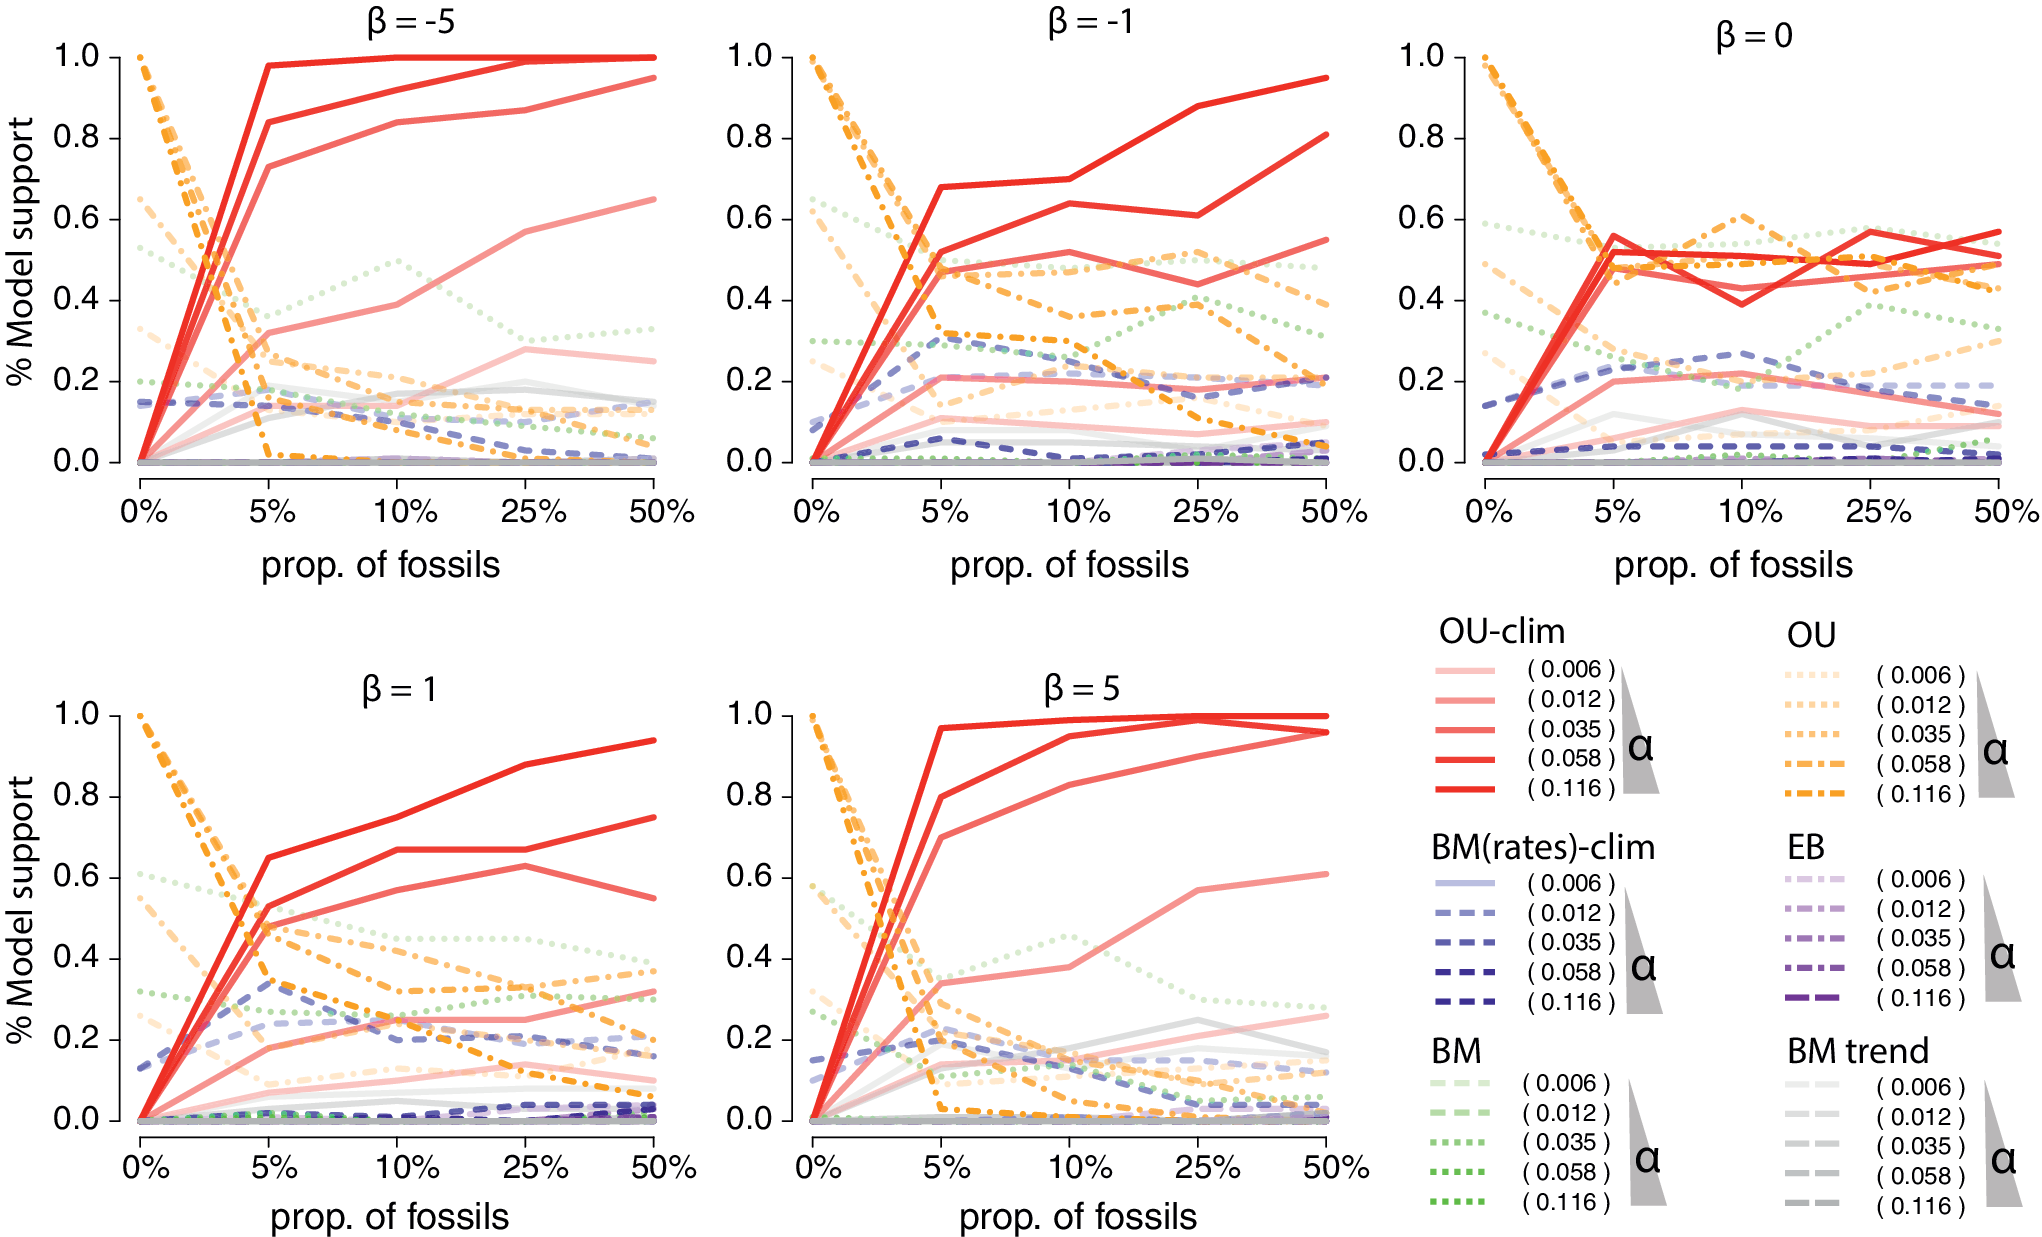
Figure 7. Simulations showing the power to detect the climatic-Ornstein-Uhlenbeck (OU) process (Troyer et al. Reference Troyer, Betancur-R, Hughes, Westneat, Carnevale, White and Pogonoski2022) with various proportions of fossils included in simulated trees. The climatic-OU process was simulated on birth–death trees subsampled to 164 species with various proportions of fossils (from 0%, i.e., only extant species, to 50% of fossils). On each tree, the traits were simulated with combinations of increased strength of selection (α = [0.006, 0.012, 0.035, 0.056, 0.116] corresponding to various phylogenetic half-lives from 0.5 to 10) represented by lines’ opacity in the plot, and varying strengths of association with the temperature curve, from negative to positive (β = [−5,−1, 0, 1, 5]), represented in the separate insets. The plot shows the proportion of time the climatic-OU process was favored over alternative processes according to the corrected Akaike information criterion (AICc) across 100 simulated datasets for each parameter combinations.
As shifts in evolutionary dynamics are often driven by extrinsic events, such as mass extinctions or global warming/cooling, these examples and simulations demonstrate that fossil data will be critical for understanding how species respond to changes in their environments. Nonetheless, while the importance of including fossils into macroevolutionary analyses is clear, the challenge of doing so may appear daunting given the issues noted earlier with producing comprehensive phylogenetic trees, as well as well-known issues with sampling and preservation of fossil material, especially for 3D morphometric studies. There is hope here as well, though, as previous studies have shown that the incorporation of even a small proportion of fossil data into comparative studies is sufficient to differentiate competing evolutionary scenarios (Slater et al. Reference Slater, Harmon and Alfaro2012a; Clavel et al. Reference Clavel, Escarguel and Merceron2015; Uyeda et al. Reference Uyeda, Caetano and Pennell2015). We demonstrate this effect here with simulations of a modified OU process that introduces a powerful new approach to modeling factors that may influence morphological evolution through deep time.
Some of our recent work has focused on explicitly considering variation in extrinsic factors, such as temperature or precipitation, into models of morphological evolution by allowing parameters to track the extrinsic factor as it changes through time (Clavel and Morlon Reference Clavel and Morlon2017; Brinkworth Reference Brinkworth2019). This approach has previously been described for a BM model in which the evolutionary rate is not constant and instead is dependent upon a continuous climatic variable (Clavel and Morlon Reference Clavel and Morlon2017). The relationship between evolutionary rate and the climatic variable (which can be any variety of extrinsic factors) could be linear or exponential, or indeed could better relate to a derivative of the factor (i.e., tracking change or rate of change, rather than a raw value). Here, we describe an extension of this climatic model wherein the model of trait evolution corresponds instead to a generalized OU process (also called Hull-White model) of the form $ dX(t)=\unicode{x03B1} \left[\unicode{x03B8} (t)-X(t)\right] dt+\unicode{x03C3} dB(t) $
, where
$ dX(t)=\unicode{x03B1} \left[\unicode{x03B8} (t)-X(t)\right] dt+\unicode{x03C3} dB(t) $
, where $ \unicode{x03B1} $
controls the strength of selection toward a moving optimum
$ \unicode{x03B1} $
controls the strength of selection toward a moving optimum $ \unicode{x03B8} (t) $
, and
$ \unicode{x03B8} (t) $
, and $ \unicode{x03C3} $
controls the generation of random fluctuations (as applied in Troyer et al. Reference Troyer, Betancur-R, Hughes, Westneat, Carnevale, White and Pogonoski2022). The optimum in this climatic-OU simulation changes through time according to the following linear equation:
$ \unicode{x03C3} $
controls the generation of random fluctuations (as applied in Troyer et al. Reference Troyer, Betancur-R, Hughes, Westneat, Carnevale, White and Pogonoski2022). The optimum in this climatic-OU simulation changes through time according to the following linear equation: $ \unicode{x03B8} (t)={\unicode{x03B8}}_0+\unicode{x03B2} \times T(t) $
, where
$ \unicode{x03B8} (t)={\unicode{x03B8}}_0+\unicode{x03B2} \times T(t) $
, where $ {\unicode{x03B8}}_0 $
is the optimum at the root of tree,
$ {\unicode{x03B8}}_0 $
is the optimum at the root of tree, $ T(t) $
is a climatic function, for instance, the temperature curve estimated from benthic foraminifera oxygen isotopes (e.g., Cramer et al. Reference Cramer, Miller, Barrett and Wright2011; Westerhold et al. Reference Westerhold, Marwan, Drury, Liebrand, Agnini, Anagnostou and Barnet2020; as applied in Troyer et al. Reference Troyer, Betancur-R, Hughes, Westneat, Carnevale, White and Pogonoski2022); and
$ T(t) $
is a climatic function, for instance, the temperature curve estimated from benthic foraminifera oxygen isotopes (e.g., Cramer et al. Reference Cramer, Miller, Barrett and Wright2011; Westerhold et al. Reference Westerhold, Marwan, Drury, Liebrand, Agnini, Anagnostou and Barnet2020; as applied in Troyer et al. Reference Troyer, Betancur-R, Hughes, Westneat, Carnevale, White and Pogonoski2022); and $ \unicode{x03B2} $
is the parameter controlling the relationship and the effect of the climate/environment on the optimum trajectory (Brinkworth Reference Brinkworth2019). Note that when
$ \unicode{x03B2} $
is the parameter controlling the relationship and the effect of the climate/environment on the optimum trajectory (Brinkworth Reference Brinkworth2019). Note that when $ \unicode{x03B2} =0 $
, this model reduces to a classical OU process with a fixed optimum.
$ \unicode{x03B2} =0 $
, this model reduces to a classical OU process with a fixed optimum.
In the simulations displayed in Figure 7, the climatic OU process was simulated on birth–death trees subsampled to 164 species with various proportions of fossils (from 0%, i.e., only extant species, to 50% fossils). The tree height was scaled to 60 Ma before simulating the trait process to represent an optimum chasing climate change over a major part of the Cenozoic period. On each tree, the traits were simulated with combinations of increased strength of selection ( $ \unicode{x03B1} =\left[0.006,0.012,0.035,0.056,0.116\right] $
corresponding to various phylogenetic half-lives (from 0.5 to 10, represented by line opacity in the plot) and varying strengths of association with the temperature curve, from negative to positive (
$ \unicode{x03B1} =\left[0.006,0.012,0.035,0.056,0.116\right] $
corresponding to various phylogenetic half-lives (from 0.5 to 10, represented by line opacity in the plot) and varying strengths of association with the temperature curve, from negative to positive ( $ \unicode{x03B2} =\left[-5,-1,0,1,5\right] $
). Our results show the proportion of time the climatic-OU process was favored over alternative processes (BM, OU, early burst (EB), trended BM, and climatic-BM) according to the corrected Akaike information criterion (AICc). As expected, with
$ \unicode{x03B2} =\left[-5,-1,0,1,5\right] $
). Our results show the proportion of time the climatic-OU process was favored over alternative processes (BM, OU, early burst (EB), trended BM, and climatic-BM) according to the corrected Akaike information criterion (AICc). As expected, with $ \unicode{x03B2} =0 $
, we see that the OU and climatic-OU share the model support (~50%). In the other simulations, we observe increased support for the climatic-OU model with both increased effects (
$ \unicode{x03B2} =0 $
, we see that the OU and climatic-OU share the model support (~50%). In the other simulations, we observe increased support for the climatic-OU model with both increased effects ( $ \unicode{x03B2} =-5 $
or
$ \unicode{x03B2} =-5 $
or $ \unicode{x03B2} =5 $
) and strength of the
$ \unicode{x03B2} =5 $
) and strength of the $ \unicode{x03B1} $
parameter. Importantly, for the largest effects, only 5% of fossils in the tree were sufficient for detecting the climatic-OU process. In stark contrast, when the analyses are conducted on extant species only, the climatic-OU is never recovered as the best-fitting model. This is evident in the solution (the expected value, or optimum, for each lineage in the tree) to this generalized OU given by the following equation:
$ \unicode{x03B1} $
parameter. Importantly, for the largest effects, only 5% of fossils in the tree were sufficient for detecting the climatic-OU process. In stark contrast, when the analyses are conducted on extant species only, the climatic-OU is never recovered as the best-fitting model. This is evident in the solution (the expected value, or optimum, for each lineage in the tree) to this generalized OU given by the following equation:
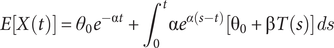 $$ E\left[X(t)\right]={\theta}_0{e}^{-\unicode{x03B1} t}+{\int}_0^t\unicode{x03B1} {e}^{\alpha \left(s-t\right)}\left[{\unicode{x03B8}}_0+\unicode{x03B2} T(s)\right] ds $$
The integral on the right part of this equation is going from 0 (the root) to t (the tip value) and shows that when species are all contemporary, the changes in the optimum (expected value) through time will not be identifiable. This example thus definitively illustrates the need to incorporate even a small number of fossils in comparative studies to identify complex evolutionary scenarios, including those of particular relevance to the current environmental crisis.
Big Phenomes, Big Analytical Headaches
As detailed earlier, there have been numerous advances in the collection of 3D images and in collecting dense morphometric data from specimens, catapulting the study of morphological evolution fully into the omics arena. However, as evidenced by many recent studies of body-size evolution, and all of the examples presented earlier, the vast majority of work modeling morphological evolution has focused on univariate data. Some approaches to rectify the methodological discordance between multivariate data and univariate methods include reducing multivariate data to individual principal components (PCs), but this is problematic if only one or a few principal components are analysed (Uyeda et al. Reference Uyeda, Caetano and Pennell2015; Clavel and Morlon Reference Clavel and Morlon2020). Methods are increasingly being developed that are suited to multivariate data (Revell and Collar Reference Revell and Collar2009; Bartoszek et al. Reference Bartoszek, Pienaar, Mostad, Andersson and Hansen2012; Clavel et al. Reference Clavel, Escarguel and Merceron2015; Caetano and Harmon Reference Caetano and Harmon2017; Goolsby et al. Reference Goolsby, Bruggemann and Ané2017; Bastide et al. Reference Bastide, Ané, Robin and Mariadassou2018), as well as extensions of conventional multivariate statistical approaches to account for phylogenetic relatedness (Revell and Harrison Reference Revell and Harrison2008; Revell Reference Revell2009; Clavel and Morlon Reference Clavel and Morlon2020). Applying these methods to multivariate data, however, does bring challenges. Morphometric datasets using 2D and 3D landmarks are often described as high-dimensional, because the number of descriptors (coordinates) p is often greater than the number of individual observations n. Most conventional multivariate statistical approaches, such as multivariate regressions and multivariate analyses of variance (MANOVAs), suffer from low statistical performances when p approaches n, or cannot be used at all when p > n. Geometric morphometric datasets bring additional challenges, because the steps of the Procrustes superimposition (rotation, translations, and scaling) used to align specimens to a common conformation lead to the loss of several dimensions (four for 2D and seven for 3D data; Rohlf Reference Rohlf1999) irrespective of the number of variables. For these reasons, dimensionality of the shape space (or tangent space) is often either reduced to a handful of PCs that are used in downstream analyses, or the complete set of coordinates is analyzed using simpler statistics (e.g., the Procrustes analysis of variance [ANOVA] of Goodall [Reference Goodall1991], which assumes that the variance is isotropic and identical at each landmark).
Multivariate PCMs, including evolutionary model-fitting procedures, also suffer from high dimensionality, because the traditionally used likelihood techniques are not applicable (Clavel et al. Reference Clavel, Escarguel and Merceron2015). Moreover, the use of data-reduction techniques, such as PCA, may lead to biased estimates and affect model comparison or statistical tests in PCMs (Uyeda et al. Reference Uyeda, Caetano and Pennell2015; Clavel and Morlon Reference Clavel and Morlon2020), as well as biasing analyses of datasets containing autocorrelations (Bookstein Reference Bookstein2012). Phylogenetic PCA (Revell Reference Revell2009; Polly et al. Reference Polly, Lawing, Fabre and Goswami2013) can rescue these issues but is essentially limited to the Brownian motion process at present. In recent years, there have been several attempts at developing model-fitting approaches and statistics that are directly applicable to these high-dimensional comparative datasets using different strategies (Adams Reference Adams2014a,Reference Adamsb; Goolsby Reference Goolsby2016; Adams and Collyer Reference Adams and Collyer2018; Tolkoff et al. Reference Tolkoff, Alfaro, Baele, Lemey and Suchard2018; Clavel et al. Reference Clavel, Aristide and Morlon2019; Clavel and Morlon Reference Clavel and Morlon2020; Hassler et al. Reference Hassler, Gallone, Aristide, Allen, Tolkoff, Holbrook, Baele, Lemey and Suchard2022). For instance, “distance”-based techniques were proposed to circumvent the constraints of the huge covariance matrices used in likelihood-based approaches (Adams Reference Adams2014a,Reference Adamsb; Adams and Collyer Reference Adams and Collyer2018). However, as in related techniques such as the permutational multivariate analysis of variance (PERMANOVA) used in ecology or the Procrustes ANOVA discussed earlier (Goodall Reference Goodall1991; Anderson Reference Anderson2001), distance-based PCMs ignore the covariances in multivariate datasets when computing their statistics and are limited to Brownian motion. In consequence, these approaches are highly sensitive to departure from these assumptions (Warton et al. Reference Warton, Wright and Wang2012; Clavel and Morlon Reference Clavel and Morlon2020). The pseudo-likelihood technique proposed by Goolsby (Reference Goolsby2016), or more precisely the pairwise composite likelihood (PCL), allows for extension beyond classical Brownian motion process by offering a likelihood-based technique to infer parameters and compare alternative evolutionary models. PCL is efficient and fast (Goolsby Reference Goolsby2016; Clavel et al. Reference Clavel, Aristide and Morlon2019), but it is not invariant to rotation and is thus not applicable to geometric morphometric datasets because of the arbitrary orientation of the baseline shape (Rohlf Reference Rohlf1999; Adams and Collyer Reference Adams and Collyer2018). Penalized-likelihood (PL) techniques also allow estimating and fitting alternative models and can alleviate issues related to rotation invariance (Clavel et al. Reference Clavel, Aristide and Morlon2019; Clavel and Morlon Reference Clavel and Morlon2020). These approaches show performances comparable to the PCL for estimating parameters and outperform conventionally used data-reduction techniques or distance-based approaches, but they are computationally costly and may not scale easily to datasets composed of more than 2000–4000 dimensions (a common situation with the use of sliding semilandmarks or pseudolandmarks in 3D geometric morphometrics). In asymptotic conditions (when n >> p), the PL approach reduces to the classical likelihood techniques. Recently, Bartoszek et al. (Reference Bartoszek, Fuentes-González, Mitov, Pienaar, Piwczyński, Puchałka, Spalik and Voje2023) showed that better-defined algorithms and use of appropriate corrections after data transformations (e.g., rotation of the data) can be used to circumvent some issues linked with working with large multivariate datasets. However, these recommendations do not necessarily apply to the specific case of geometric morphometric data, because there is no reference orientation one can use to devise a correction term.
Phylogenetic factor analysis was also recently proposed as an efficient way to model complex high-dimensional datasets using a handful of latent factors (Tolkoff et al. Reference Tolkoff, Alfaro, Baele, Lemey and Suchard2018; Hassler et al. Reference Hassler, Gallone, Aristide, Allen, Tolkoff, Holbrook, Baele, Lemey and Suchard2022). This technique uses a promising probabilistic framework for data reduction; however, it is also currently limited to Brownian motion and might suffer from rotation-invariance issues such as those faced by classical factor analysis. These methods are in ongoing development to address these issues. For instance, several algorithms have been proposed to improve and speed up the computation of multivariate likelihood in PCMs (Pybus et al. Reference Pybus, Suchard, Lemey, Bernardin, Rambaut, Crawford and Gray2012; Ho and Ané Reference Ho and Ané2014b; Clavel et al. Reference Clavel, Escarguel and Merceron2015; Goolsby et al. Reference Goolsby, Bruggemann and Ané2017; Bastide et al. Reference Bastide, Ané, Robin and Mariadassou2018; Caetano and Harmon Reference Caetano and Harmon2019; Mitov et al. Reference Mitov, Bartoszek, Asimomitis and Stadler2020), and further techniques (e.g., machine learning approaches) might be envisioned to study high-dimensional datasets, such as geometric morphometric datasets, with the various constraints, such as rotation invariance, accompanying these datasets.
Another key aspect to consider is the trade-off between the morphological complexity captured by modern morphometrics and the number of parameters that must be estimated by the models to improve biological realism and interpretability. To avoid overfitting and difficulties in optimizing parameter-rich models, most developments for high-dimensional comparative datasets mentioned earlier are based on simpler assumptions—for instance, that multivariate OU has a simple structure with same parameter shared across traits, sometimes called the “scalar OU model” (Bastide et al. Reference Bastide, Ané, Robin and Mariadassou2018; Clavel et al. Reference Clavel, Aristide and Morlon2019)—than state of the art multivariate models. While some maximum-likelihood implementations allow the estimation of rates or adaptive optimum in different lineages or clades across traits in multivariate datasets (Revell and Collar Reference Revell and Collar2009; Bartoszek et al. Reference Bartoszek, Pienaar, Mostad, Andersson and Hansen2012; Clavel et al. Reference Clavel, Escarguel and Merceron2015; Caetano and Harmon Reference Caetano and Harmon2017), these approaches usually require that the parts of the tree where the shift occurred be known a priori (mapped) or for those areas of the tree to be reconstructed independently. More recently, maximum-likelihood and PL implementations have been proposed that can detect the position of these shifts automatically in multivariate datasets (Khabbazian et al. Reference Khabbazian, Kriebel, Rohe and Ané2016; Bastide et al. Reference Bastide, Ané, Robin and Mariadassou2018). Similarly, some Bayesian implementations using reversible jumps with Markov chain Monte Carlo algorithms (RJMCMC; e.g., in RevBayes [Höhna et al. Reference Höhna, Landis, Heath, Boussau, Lartillot, Moore, Huelsenbeck and Ronquist2016] and BayesTraits [Venditti et al. Reference Venditti, Meade and Pagel2011]) relax these assumptions by allowing the estimation of rates changes in different parts of the tree without any prior knowledge on the position of the shifts. As a prior on the number of shifts is, however, usually needed, these methods are based on the Occam’s razor principle that a limited number of changes are needed to model the data. A model with branch-specific trait changes has previously been developed (Lemey et al. Reference Lemey, Rambaut, Welch and Suchard2010), but has not—to the best of our knowledge—been applied to morphometric datasets. Although these RJMCMC approaches are more flexible, it should be noted that to cope with the rapid increase in number of parameters, all of these approaches also make some simplifying assumptions—just as with the methods for high-dimensional datasets described previously—compared with the full models employed in “mapped trees” methods. For instance, none of these approaches can be employed on high-dimensional datasets without relying on some sort of data-reduction techniques; they either assume that traits evolved independently of each other (Khabbazian et al. Reference Khabbazian, Kriebel, Rohe and Ané2016) or that the evolutionary correlations between traits are homogeneous across the tree (Lemey et al. Reference Lemey, Rambaut, Welch and Suchard2010; Venditti et al. Reference Venditti, Meade and Pagel2011; Höhna et al. Reference Höhna, Landis, Heath, Boussau, Lartillot, Moore, Huelsenbeck and Ronquist2016; Bastide et al. Reference Bastide, Ané, Robin and Mariadassou2018) and that rate changes are shared across traits.
Future developments will have to overcome these various challenges imposed by parameter-rich models and high dimensionality of modern datasets, because at present, our ability to generate high-quality, phenomic-scale data, as discussed earlier, is outpacing the capacity of evolutionary analyses, most of which rely on relatively simple models of evolution or are only suited to univariate or low-dimensional data. Nonetheless, even with existing methods, we already have the means to assess the processes underlying observed patterns with more complexity and accuracy than is usually applied, as we demonstrate by returning to the topic of disparity.
Expectations of Disparity under Alternative Evolutionary Models
It is intuitive that there is a close relationship between morphological disparity and the evolutionary processes unfolding along a tree or a time series. Hunt (Reference Hunt2012) showed that the rate of phenotypic evolution in time-series data necessarily depends on the generating process. Relatedly, O’Meara et al. (Reference O’Meara, Ané, Sanderson and Wainwright2006) showed that the expected disparity under a homogeneous Brownian motion can depend on the dynamics of speciation and extinction, that is, the branching pattern or shape of the tree, as the accumulated variance depends on species’ coalescence times. And yet, although they are ultimately inseparable, we often find discrepancies between rate and disparity in empirical datasets (Goswami et al. Reference Goswami, Smaers, Soligo and Polly2014; Felice et al. Reference Felice, Randau and Goswami2018). Part of understanding this inconsistency requires us to confront our expectations—specifically, our Brownian expectations. As discussed earlier, disparity through time (DTT) plots have become ubiquitous in studies of morphological evolution, and for good reason: they provide a clear picture of how the distribution of morphological variation changes through time. As noted earlier, when paired with an understanding of evolutionary relationships, DTT plots provide insight into the evolutionary dynamics of a clade, by measuring whether disparity is concentrated between clades (subclade disparity approaches 0) or within clades (subclade disparity approaches 1). In most implementations, the empirical DTT plot is compared with a Brownian expectation (e.g., Slater et al. Reference Slater, Price, Santini and Alfaro2010; Navalón et al. Reference Navalón, Bjarnason, Griffiths and Benson2022). While modeled disparity cannot take into account factors such as selective extinction, there are many reasons why disparity may depart from a Brownian expectation, the simplest being that the Brownian model is a poor model for the data. Thus, it is sensible to model disparity using a model that better fits the data. We have mentioned a variety of models, from a single-rate BM model to various implementations of OU processes to time-dependent models, including both AC and EB models. In the following section, we consider some of these models as we demonstrate the impact of evolutionary model on expectations of disparity with a worked example from our recent study of mammal skulls (Goswami et al. Reference Goswami, Noirault, Coombs, Clavel, Fabre, Halliday and Churchill2022).
Estimating Disparity under Different Evolutionary Models: A Worked Example of Mammal Evolution
DTT plots (Harmon et al. Reference Harmon, Schulte, Larson and Losos2003) were computed on 67 PCs that captured 95% of the total variance for a dataset of 322 placental mammals, with skull shape quantified with 66 landmarks and 688 sliding semilandmarks (black curve on Fig. 8). The DTT curves were estimated on 1 Myr time bins (mean binned subclade disparity) using modified codes from Navalón et al. (Reference Navalón, Bjarnason, Griffiths and Benson2022). We estimated through simulations the 95% confidence envelope for the DTT under four alternative models (BM, OU, EB, and a variable-rate BM model with a lambda tree transformation) to compare it to that of the empirical DTT. For each process, 100 datasets were generated with the simulate function with parameters from model fit by PL using the mvgls function in mvMORPH R package v. 1.1.8 (Clavel et al. Reference Clavel, Escarguel and Merceron2015). The variable-rate lambda model was estimated in a previous study (Goswami et al. Reference Goswami, Noirault, Coombs, Clavel, Fabre, Halliday and Churchill2022) using the RJMCMC algorithm implemented in BayesTraits v. 3 (Venditti et al. Reference Venditti, Meade and Pagel2011). To simulate the data under that process, we first used the average branch-specific rates from the BayesTrait MCMC output to scale the branch lengths of the placental phylogenetic tree. This branch length–transformed tree was then used in mvgls to fit a multivariate “lambda” model and to simulate new datasets using the simulate function. Because the parameter that describes the decay in rate in the EB model was estimated close to zero on the empirical data—that is, the process behaves like BM—we further simulated DTT with various strengths of early burst to illustrate more standard expectations (Fig. 8A). To do so, we simulated decays representing 2, 5, and 10 half-lives elapsing over the 80 Myr of the placental tree used in the analysis. That is, a mild early burst with a rate that decays by half after 40 Myr (2 half-lives) or a strong EB with a rate that decays by half after only ~8 Myr (10 half-lives). Overall, we can see that the EB (Fig. 8A) and OU processes (Fig. 8B) show a low fit to the empirical DTT and that their trajectories tend toward the opposite corners of the DTT plot. Specifically, the EB model predicts greater disparity between clades than is observed for most of the Cenozoic, while the OU model tends to homogenize variation across clades. The BM process is reasonable in capturing the main disparity pattern, but it misses some bursts in disparity and does not appropriately accommodate the disparity near the present (Fig. 8C), in contrast to the BM variable-rate model (Fig. 8D). This example demonstrates how we can already accommodate complex models into well-established analyses, such as morphological disparity, and how doing so may relieve some of the perceived incongruence of evolutionary rate and disparity and more accurately identify where disparity diverges from more accurate expectations. This is, of course, important, because not all differences observed in rates and disparity are due to methodological oversimplification; some of the incongruence is an accurate reflection of underlying biological factors, as discussed later.
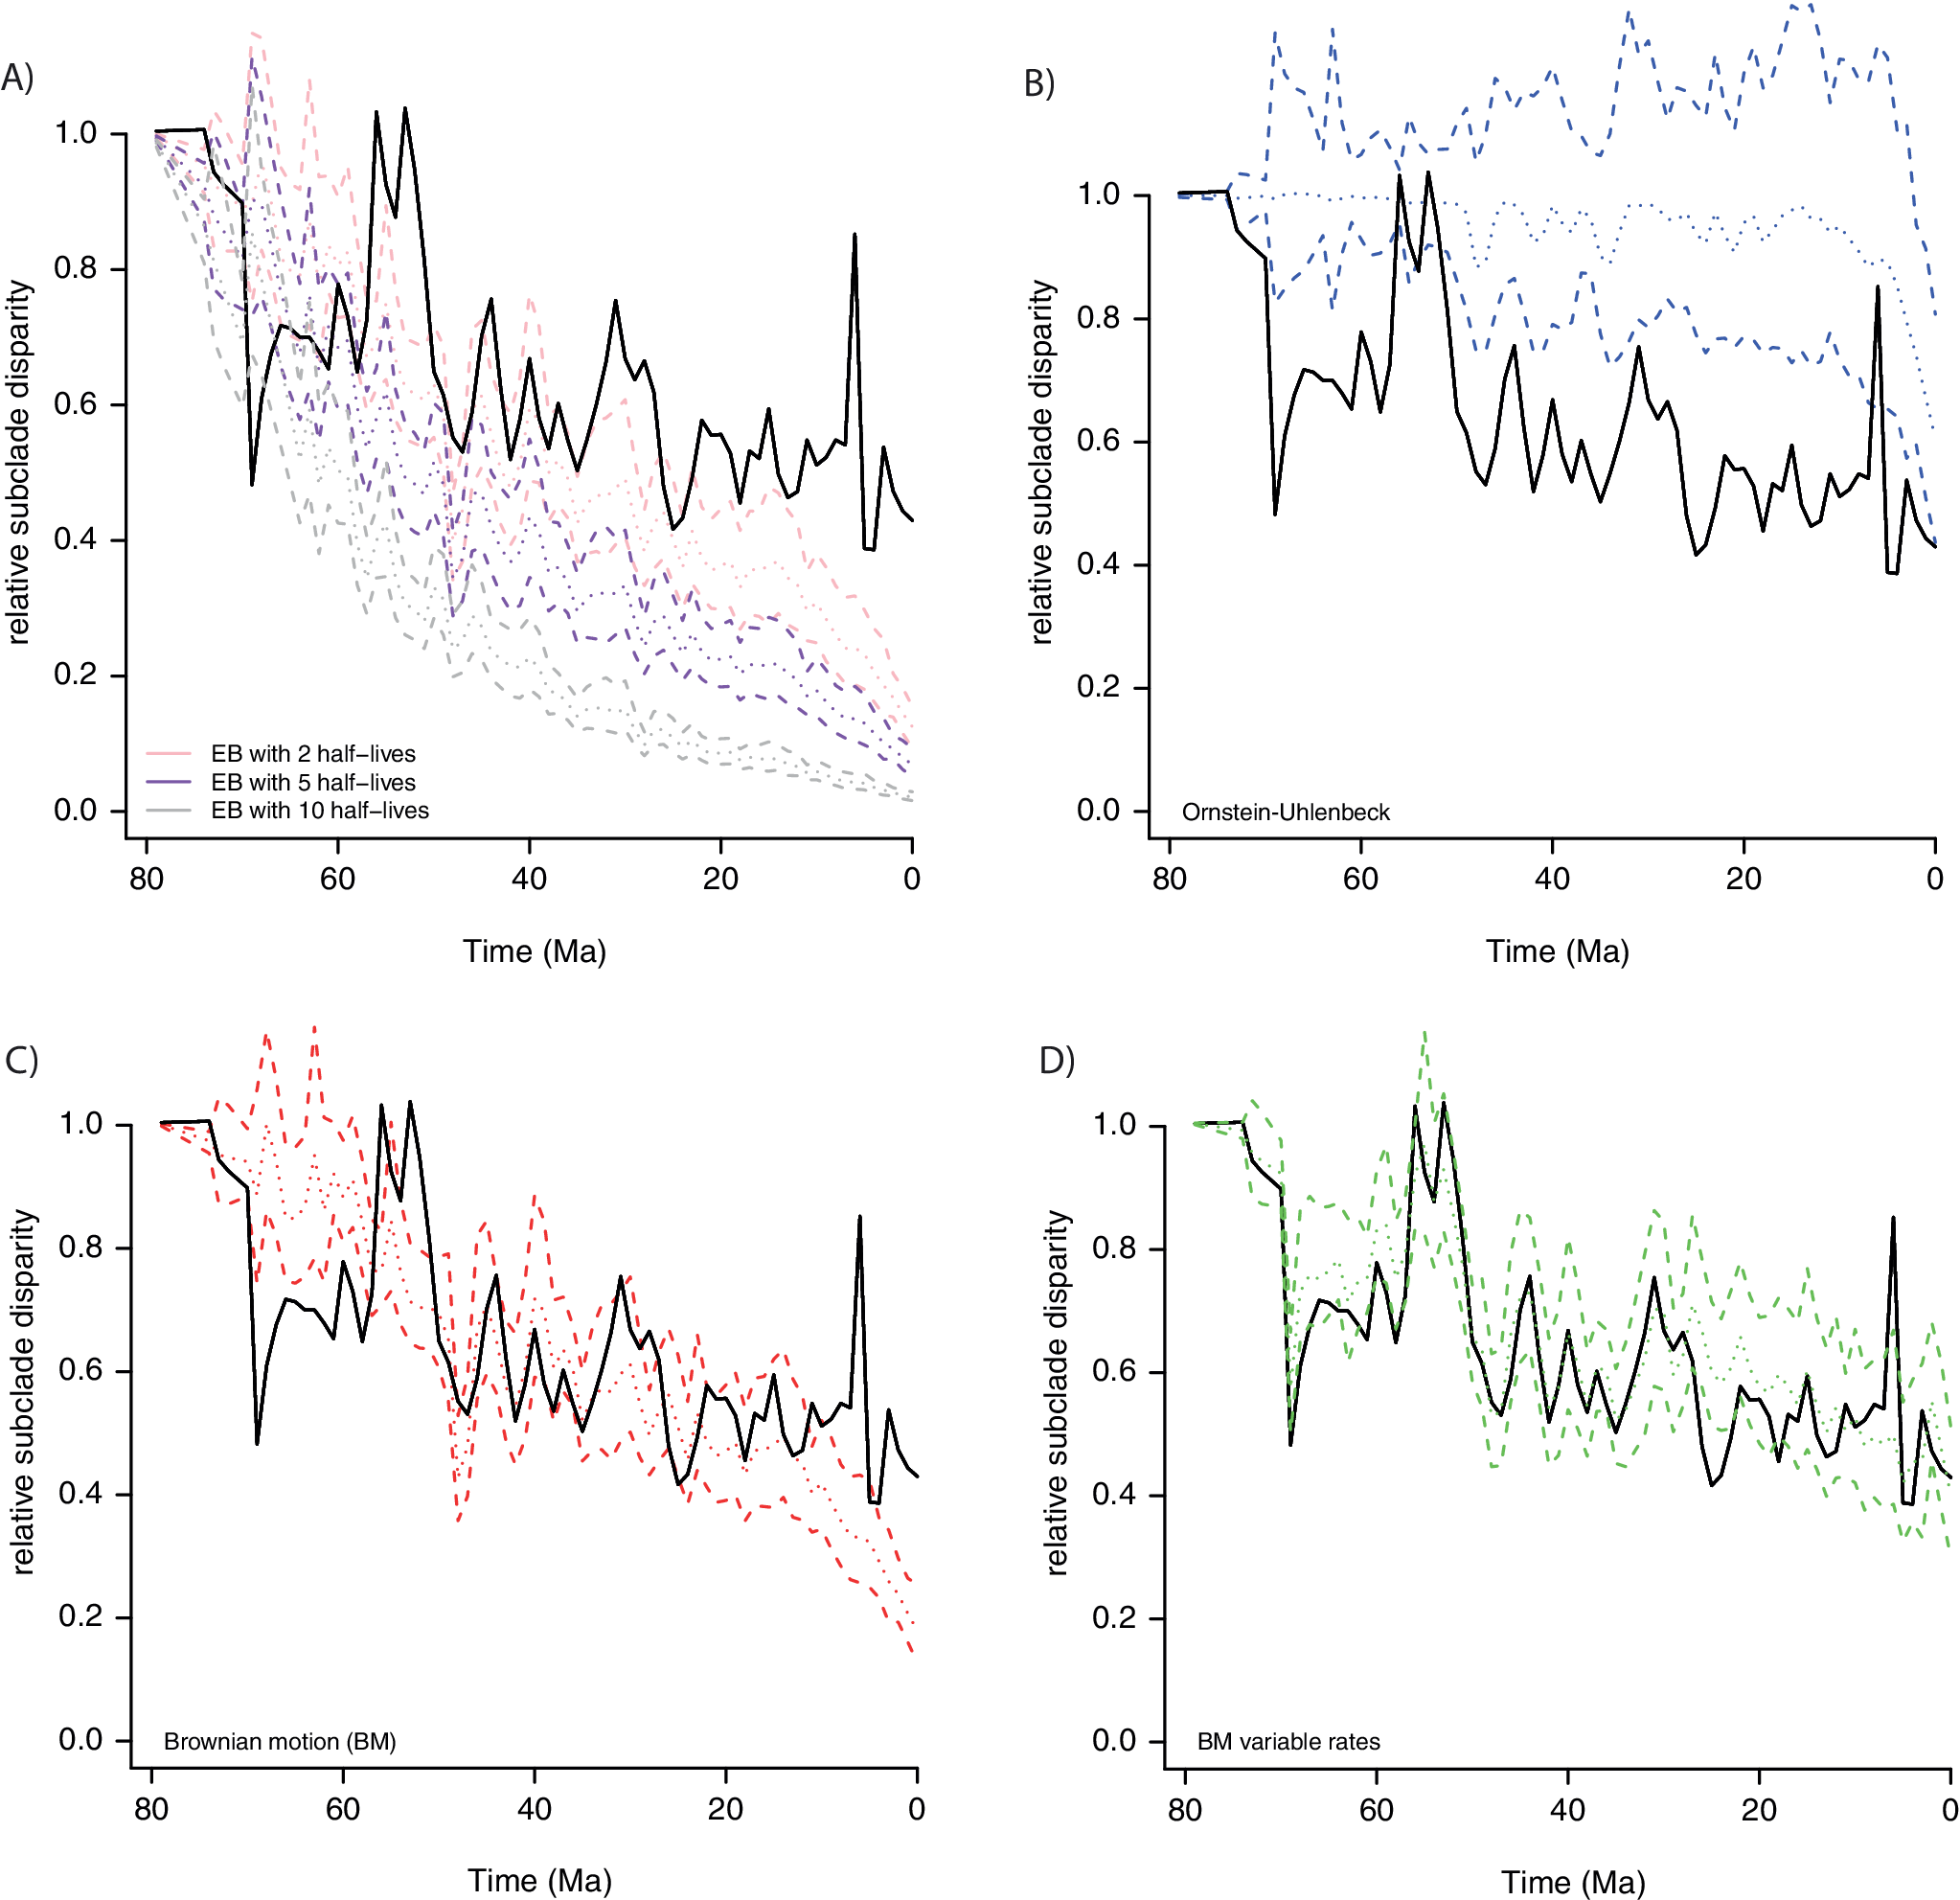
Figure 8. Empirical (black line) vs. expected disparity (relative subclade disparity) for placental mammal skull evolution simulated under four evolutionary models: A, Early burst with three alternative parameterizations; B, Ornstein-Uhlenbeck (OU); C, single-rate Brownian motion (BM); D, variable-rate BM with a lambda tree transformation, estimated in Goswami et al. (Reference Goswami, Noirault, Coombs, Clavel, Fabre, Halliday and Churchill2022). Dashed lines are 95% confidence intervals, and dotted lines are the mean expectation.
From Pattern to Process
Quantifying morphology and changes in it across clades, space, or time is inherently interesting, but is rarely the goal of a study. Rather, we generally seek to understand why certain morphologies exist, why they vary, and how they change. We can discriminate this into two key areas, determining which factors are associated with morphological variation and which processes underlie morphological variation. Factors associated with morphological variation can be both intrinsic to the organism, such as ecology, life history, function, or physiology, or extrinsic, such as environment and competition (Baab et al. Reference Baab, Perry, Rohlf and Jungers2014; Goswami et al. Reference Goswami, Randau, Polly, Weisbecker, Bennett, Hautier and Sánchez-Villagra2016; Arbour et al. Reference Arbour, Curtis and Santana2019; Felice et al. Reference Felice, Tobias, Pigot and Goswami2019a; Fabre et al. Reference Fabre, Bardua, Bon, Clavel, Felice, Streicher, Bonnel, Stanley, Blackburn and Goswami2020; Bardua et al. Reference Bardua, Fabre, Clavel, Bon, Das, Stanley, Blackburn and Goswami2021). The associations of these various factors and morphology can be assessed statistically using regressions, including the phylogenetic regressions discussed earlier, in which specimens are phylogenetically structured and a phylogeny is available (Goswami et al. Reference Goswami, Noirault, Coombs, Clavel, Fabre, Halliday and Churchill2022). Biotic interactions are another key factor driving trait evolution, but although there are many methods for integrating species interactions into models of trait evolution for univariate traits (Drury et al. Reference Drury, Clavel, Manceau and Morlon2016; Bartoszek et al. Reference Bartoszek, Glémin, Kaj and Lascoux2017; Clarke et al. Reference Clarke, Thomas and Freckleton2017; Manceau et al. Reference Manceau, Lambert and Morlon2017; Quintero and Landis Reference Quintero and Landis2020), there are none at present for high-dimensional data.
These associations can provide deep insight into the drivers of morphological variation, disparity, and change, but they often provide little information on the specific pathways of that change. For that, we need to access information on how morphology is generated, which requires understanding of genetic and developmental patterning of morphology. While much early work on comparative development laid the foundations for this topic (Thompson Reference Thompson1917), the rise of comparative genomics and evolutionary developmental biology has provided novel insights into how morphologies form and change (Noden Reference Noden1983; Sears Reference Sears2004; Sears et al. Reference Sears, Goswami, Flynn and Niswander2007; Brugmann et al. Reference Brugmann, Powder, Young, Goodnough, Hahn, James, Helms and Lovett2010; Young et al. Reference Young, Chong, Hu, Hallgrímsson and Marcucio2010, Reference Young, Hu, Lainoff, Smith, Diaz, Tucker, Trainor, Schneider, Hallgrímsson and Marcucio2014; Zhang et al. Reference Zhang, Li, Li, Li, Larkin, Lee and Storz2014; Green et al. Reference Green, Fish, Young, Smith, Roberts, Dolan and Choi2017; Bouwman et al. Reference Bouwman, Daetwyler, Chamberlain, Ponce, Sargolzaei, Schenkel and Sahana2018; Claes et al. Reference Claes, Roosenboom, White, Swigut, Sero, Li and Lee2018; Salzburger Reference Salzburger2018; Jebb et al. Reference Jebb, Huang, Pippel, Hughes, Lavrichenko, Devanna and Winkler2020; Yuan et al. Reference Yuan, Zhang, Zhang, Liu, Wang, Gao and Hoelzel2021; Zhou et al. Reference Zhou, Shearwin-Whyatt, Li, Song, Hayakawa, Stevens and Fenelon2021; Brandon et al. Reference Brandon, Almeida and Powder2022; Carbeck et al. Reference Carbeck, Arcese, Lovette, Pruett, Winker and Walsh2023). Now, it is plausible to quantify shape changes through time and tie them to specific changes in genetic architecture or developmental pathways. The opposite is equally possible—starting from a quantification of development and estimating what morphologies could and could not evolve, similar to Raup’s (Reference Raup1966) coiling morphospace but with far greater resolution (Young et al. Reference Young, Hu, Lainoff, Smith, Diaz, Tucker, Trainor, Schneider, Hallgrímsson and Marcucio2014). Linking phylogeny and developmental data in comparative analysis also allows estimation of ancestral developmental pathways, essentially creating hypotheses of developmental patterning for taxa that will likely never be sampled directly (White et al. Reference White, Tucker, Fernandez, Miguez, Hautier, Herrel, Urban, Sears and Goswami2023).
Of course, the vast majority of biological diversity is extinct. While extracting genomes for species that went extinct in the last few million years is increasingly possible, the fact remains that there is almost no record of genetic or developmental data for the millions of fossil species that have inhabited this planet before modern times, or even for most species alive today. How then can we access this information to link pattern to process across the diversity of living and extinct species? Morphological integration and phenotypic modularity are concepts that are inherently about the relationships among traits but are of widespread interest because those relationships reflect the underlying developmental and genetic architecture of those traits (Wagner Reference Wagner1996; Wagner and Altenberg Reference Wagner and Altenberg1996; Klingenberg Reference Klingenberg2013; Zelditch and Goswami Reference Zelditch and Goswami2021). Integration refers to the relationships among components within a structure, and modularity refers to the decomposition of a structure into quasi-autonomous, highly integrated modules. Thus, quantitative analysis of the covariances among phenotypic traits allows one to access the intrinsic processes generating those traits, even when direct genetic or developmental data are not available, as is the case for the vast majority of extinct and rare species. Linking trait integration and modularity to specific processes is complicated by overlapping effects (Hallgrímsson et al. Reference Hallgrímsson, Jamniczky, Young, Rolian, Parsons, Boughner and Marcucio2009), but even where the precise cause of a pattern of integration and modularity is not identifiable, phenotype alone, even from fossil species, is sufficient to estimate those relationships and then identify where in evolutionary history those relationships and their underlying architecture have changed (e.g., Goswami Reference Goswami2006; Webster and Zelditch Reference Webster and Zelditch2011a, Reference Webster and Zelditchb; Goswami et al. Reference Goswami, Binder, Meachen and O’Keefe2015; Felice et al. Reference Felice, Watanabe, Cuff, Noirault, Pol, Witmer, Norell, O’Connor and Goswami2019b; Love et al. Reference Love, Grabowski, Houle, Liow, Porto, Tsuboi, Voje and Hunt2022).
These relationships among traits also have important consequences for the evolution of species, and, by extension, the evolution of biodiversity, as trait covariances are a primary influence on the variation of individual traits. Strong integration among traits can limit the ability of individual traits to vary and evolve in some directions, while facilitating their evolution in other directions (Schluter Reference Schluter1996; Steppan Reference Steppan1997; Steppan et al. Reference Steppan, Phillips and Houle2002; Marroig and Cheverud Reference Marroig and Cheverud2005; Renaud et al. Reference Renaud, Auffray and Michaux2006, Hunt Reference Hunt2007a; Rhoda et al. Reference Rhoda, Haber and Angielczyk2023). This tendency will leave some areas of morphospace unexplored, while likely promoting homoplasy and convergence in other areas (Goswami et al. Reference Goswami2014; Felice et al. Reference Felice, Randau and Goswami2018). Importantly, this constraint on direction of evolution does not necessarily similarly limit pace of evolution and thus trait integration is one biological cause for discordance between evolutionary rate and disparity, as described by the fly-in-the-tube model of evolution for integrated phenotypes (Felice et al. Reference Felice, Randau and Goswami2018).
This effect of trait integration has led to the hypothesis that modularity has increased over evolutionary time to circumvent these potentially constraining effects. There is, however, no conclusive analysis on trends in modularity at present, although there is certainly variation in modularity across major clades (e.g., Goswami Reference Goswami2006; Felice et al. Reference Felice, Watanabe, Cuff, Noirault, Pol, Witmer, Norell, O’Connor and Goswami2019b). It is likely that modularity, like complexity (Marcot and McShea Reference Marcot and McShea2007), fails to show biased evolution when rigorously assessed, despite reasonable hypotheses for a trend toward increased modularity (Wagner and Altenberg Reference Wagner and Altenberg1996), but this remains to be tested with sufficient comparative data. One of the major hindrances in assessing trends in modularity and integration is that many of the major shifts in patterns of modularity are observed between large clades, with a high degree of conservation in pattern (if not in magnitude) within major vertebrate clades (Goswami Reference Goswami2006; Porto et al. Reference Porto, de Oliveira, Shirai, De Conto and Marroig2009; Felice et al. Reference Felice, Watanabe, Cuff, Noirault, Pol, Witmer, Norell, O’Connor and Goswami2019b; Watanabe et al. Reference Watanabe, Fabre, Felice, Maisano, Müller, Herrel and Goswami2019; Bardua et al. Reference Bardua, Fabre, Bon, Das, Stanley, Blackburn and Goswami2020; Fabre et al. Reference Fabre, Bardua, Bon, Clavel, Felice, Streicher, Bonnel, Stanley, Blackburn and Goswami2020; Navalón et al. Reference Navalón, Marugán-Lobón, Bright, Cooney and Rayfield2020). Assessing trends in modularity thus requires robust comparisons across long-diverged clades, which is difficult with standard geometric morphometric approaches because of the paucity of homologous landmarks in disparate taxa. Moreover, as the key shifts occurred in stem taxa or early representatives of major extant clades, testing this hypothesis requires assessing phenotypic modularity and integration with sufficiently large sample sizes of individual fossil species. This is because it is at the species level where those trait relationships shape variation and, ultimately, evolutionary trajectories (rather than at the level of evolutionary modularity and integration, where the effect, but not the cause, may be discerned). This is but one of many fundamental questions on the drivers and constraints on morphological evolution that will hopefully be addressed by better approaches to quantifying and comparing morphology on macroevolutionary scales and with direct data from extinct species.
Shifting Bottlenecks, Beyond Data Limitations to Methods Limitations
Centuries of study have provided a rich theoretical framework for the study of evolutionary morphology, but just in the past decade, a monumental shift has occurred in its analysis. Whereas the limiting factor has been data collection and quality, access to online databases and imaging tools is making it increasingly possible to gather multivariate data from thousands of specimens within a few years. Ready access to high-performance computing clusters and stable freeware is an equally important factor for the explosion in scale of evolutionary morphology studies. The rise of artificial intelligence and the application of deep learning and computer vision to image data are already pushing the timescales for data collection from several years to a few hours, although there are still significant issues to resolve for ensuring biologically meaningful comparisons of shape. We can now foresee a day in just a few years when it will be possible to obtain dense morphometric data for hundreds of thousands of species and marry these data with phylogenetic, ecological, life-history, biotic, and geographic information. Where then are the new bottlenecks and next frontiers for the study of morphological evolution? It is undeniable that the size and complexity of phenomic-scale datasets are presently outpacing the ability of analytical tools to robustly reconstruct morphological evolution with high-dimensional data, particularly those that sample a large number of species in a phylogenetic framework. In this regard, the scale and quality of morphological data are rapidly catching up with their molecular counterparts and presenting new opportunities for robust analysis of the genome–phenome relationship. Going forward, the key areas for improving the study of morphological evolution will be automating the extraction of meaningful, comparable morphometric data from images, integrating fossil data into large phylogenetic trees and downstream evolutionary analyses, generating robust models that accurately reflect the complexity of evolutionary processes, and developing methods that are well suited for high-dimensional data. Combined, these advancements will solidify the emerging field of evolutionary phenomics and appropriately center it around the analysis of unambiguously critical deep-time data.
Acknowledgments
This work was influenced by numerous conversations over the past few decades with dozens of brilliant and inspiring colleagues, mentors, and students, to whom we are immensely grateful. We are also grateful for the guitar shops that keep Julien coming back to London. We thank J. Mulqueeney and M. Caimati for assistance with Figure 2. This work was supported by funding from European Research Council grant STG-2014-637171 (to A.G.) and Horizon 2020 MCSA Fellowship IF 797373-EVOTOOLS (to J.C.). The authors acknowledge Research Computing at the James Hutton Institute for providing computational resources and technical support for the “UK’s Crop Diversity Bioinformatics HPC” (BBSRC grants BB/S019669/1 and BB/X019683/1), use of which has contributed to the results reported within this paper.
Competing Interests
The authors declare no competing interests.
Data Availability Statement
All data and novel code used in this manuscript are freely available at: https://github.com/JClavel/Morphological-evolution-in-a-time-of-Phenomics.


 Open access