


Chronic kidney disease (CKD) is a significant global public health issue, defined as kidney abnormalities that persist for more than 3 months. The prevalence of CKD is substantial, with a global median prevalence of 9·5 % across 73·9 % of countries(Reference Bello, Okpechi and Levin1). Measuring substances present in plasma, such as creatinine (Cr) and cystatin C (Cys), to calculate the estimated glomerular filtration rate (eGFR) is the most widely used method for evaluating renal function. CKD is classified into stages based on the severity of kidney damage and function, ranging from stage 1 (mildest) to stage 5 (most severe), according to eGFR levels(2).
CKD is associated with higher morbidity and mortality. People with CKD frequently suffer from CVD, such as heart failure and may die from these issues before reaching end-stage kidney failure. Additionally, hypertension and type 2 diabetes are commonly associated with CKD. While medications such as angiotensin-converting enzyme inhibitors, angiotensin II receptor blockers and statins are commonly used in CKD management, they often come with side effects including hyperkalaemia, hypotension and adverse effects on cardiovascular health and kidney function(Reference Smetana, Romeo and Rosas3–Reference Fletcher, Jongs and Chertow5). Due to the relatively lower burden of side effects, dietary modification is considered a key strategy for preventing and managing CKD(Reference Kushner, Khunti and Cebrián6).
Emerging evidence suggests that oxidative stress, a condition where the body’s antioxidant defenses are overwhelmed by excess free radicals, can accelerate CKD progression and exacerbate kidney damage(Reference Daenen, Andries and Mekahli7). Some foods, particularly those rich in antioxidants, such as tea, cheese, oily fish and vegetarian diet rich in antioxidant compounds, may help protect against CKD by reducing oxidative stress, a key factor contributing to kidney damage(Reference Fernández-Lázaro, Arribalzaga and Gutiérrez-Abejón8–Reference Cases, Cigarrán-Guldrís and Mas11). Therefore, identifying and understanding modifiable dietary factors that protect against CKD is of great clinical and public health significance for establishing effective preventive measures.
Currently, many assessments of dietary risk or protective factors rely on animal experiments, cross-sectional studies and retrospective analyses. However, these methodologies may struggle to effectively isolate and exclude other potential confounders that could affect experimental outcomes. The UK Biobank, which contains genetic and health-related information from over 500 000 European volunteers, includes diets-related data for several aspects. Mendelian randomisation (MR) analysis offers a powerful tool that uses instrumental variables (IV) and summary-level data to explore causal relationships while minimising confounding and reverse causality biases(Reference Burgess, Davey Smith and Davies12). Understanding the impact of dietary factors on eGFRcr, eGFRcys levels and CKD can help to develop dietary intervention strategies that contribute to the prevention and management of CKD. Therefore, this study employed two-sample MR to analyse the causal effects of various dietary factors on eGFRcr, eGFRcys levels and CKD. Our findings will significantly aid in the development of tailored dietary strategies for individuals with CKD.
Methods
The present study followed the Strengthening the Reporting of Observational Studies in Epidemiology (STROBE) MR checklist (online Supplementary Materials 1: Table 1)(Reference Skrivankova, Richmond and Woolf13). This study utilised only publicly available summary data, which had been approved for human experimentation by an ethics committee. Therefore, no additional ethical approval was necessary for this study. MR employs genetic variants to explore causal relationships within observational data(Reference Burgess, Scott and Timpson14–Reference Che, Yuan and Wang16). The foundation lies in Mendelian laws of inheritance and IV estimation methods, allowing for the estimation of causal effects even when unobserved confounding factors are present. The relationships among exposure factors (dietary factors), IV and the outcome (CKD, eGFR) are shown in Figure 1. The flowchart for this two-sample MR study and the three fundamental assumptions were considered when conducting MR analysis as follows:
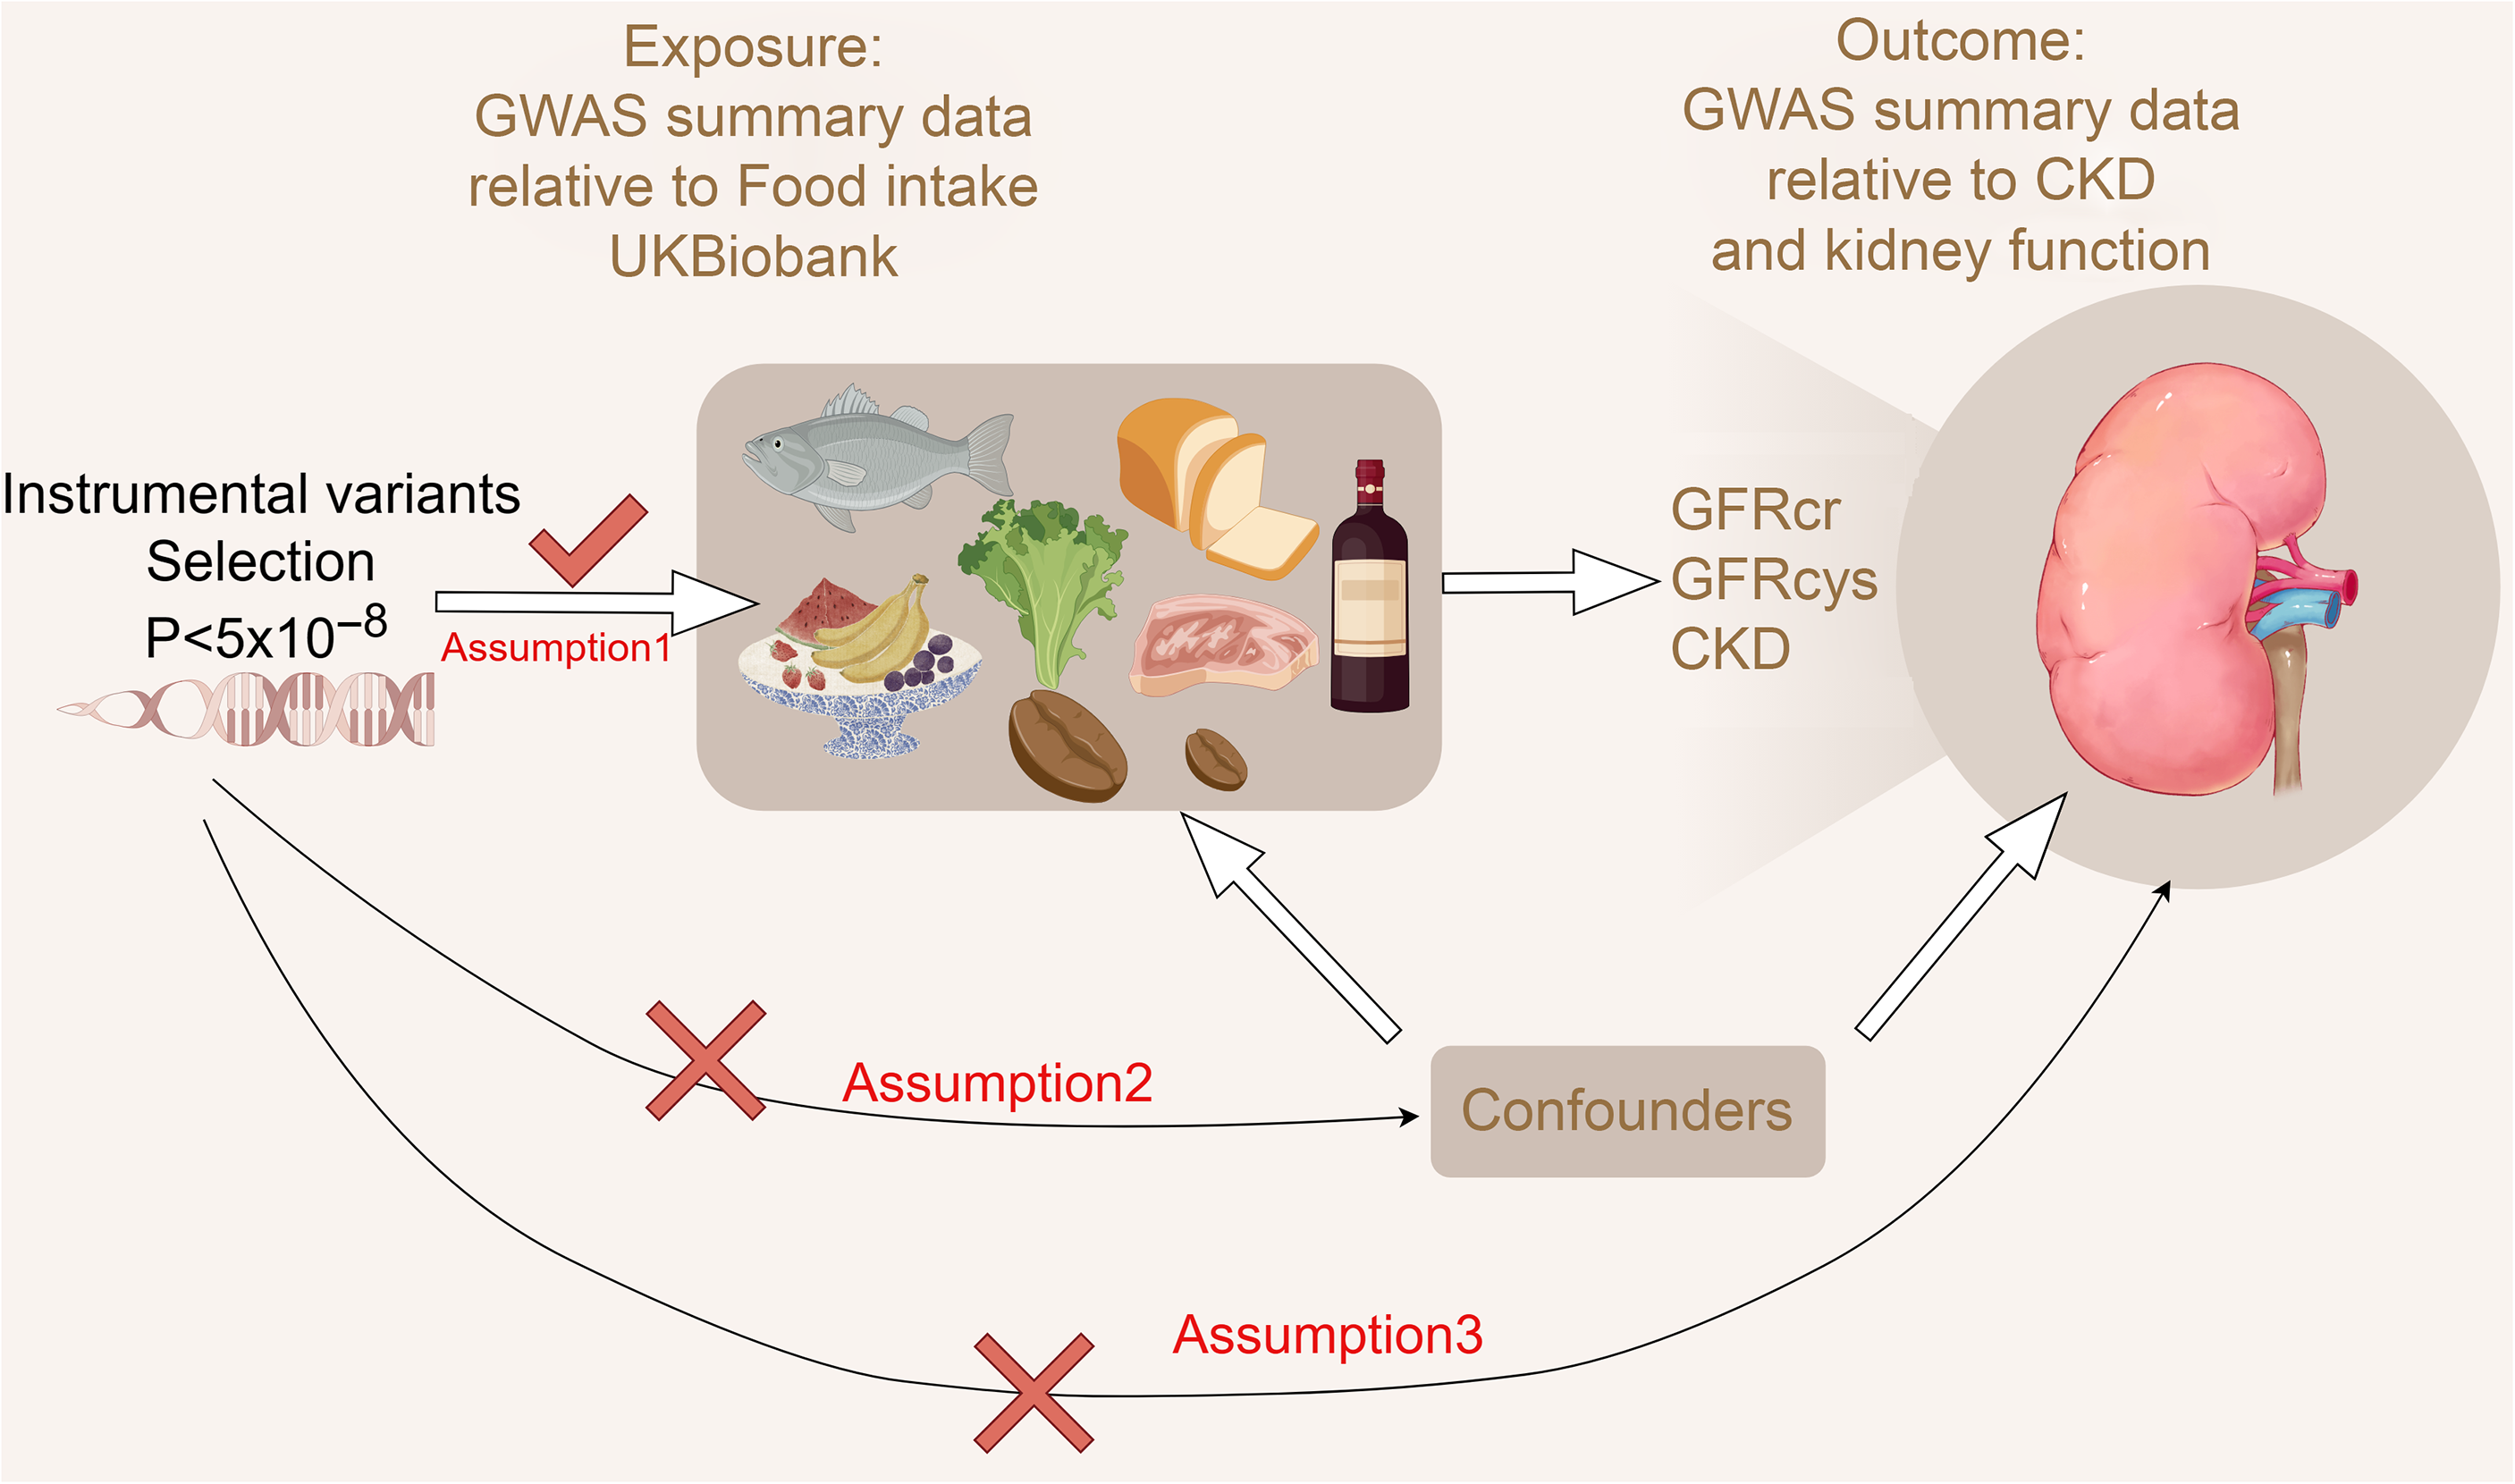
Figure 1. Flow chart for two Mendelian randomisation (MR) study for dietary factors and chronic kidney disease and kidney function. The three assumptions of the MR study (created by Figdraw).
(1), the IV is strongly associated with exposure.
(2), the IV are not associated with potential confounders of the exposure or outcome association.
(3), the IV do not affect outcome independently of exposure.
Data sources
To avoid potential bias caused by sample overlap and population differences, all genome-wide association study (GWAS) data are European ancestry without a known sample overlap(Reference Burgess, Davies and Thompson17).
Exposure data concerning food intake were sourced from the UK Biobank (UKB), a large-scale prospective study encompassing genetic and phenotypic information from more than 500 000 individuals aged 40–69 years across the UK. We included food intake-related GWAS data covering eighteen items, including cheese intake, processed meat intake, poultry intake, beef intake, non-oily fish intake, oily fish intake, pork intake, lamb/mutton intake and alcohol intake frequency, which were categorised as categorical variables, whereas bread intake, cooked vegetable intake, tea intake, fresh fruit intake, cereal intake, salad/raw vegetable intake, coffee intake, dried fruit intake and average weekly red wine intake were treated as continuous variables. Detailed information on how these variables were categorised can be found in online Supplementary Materials 1: Table 2, and further specifics are available at the following link: https://biobank.ndph.ox.ac.uk/ukb/label.cgi?id=100050. The data ID are all available from the IEU open GWAS database (Table 1, https://gwas.mrcieu.ac.uk/).
Table 1. Exposure and outcome phenotypic data
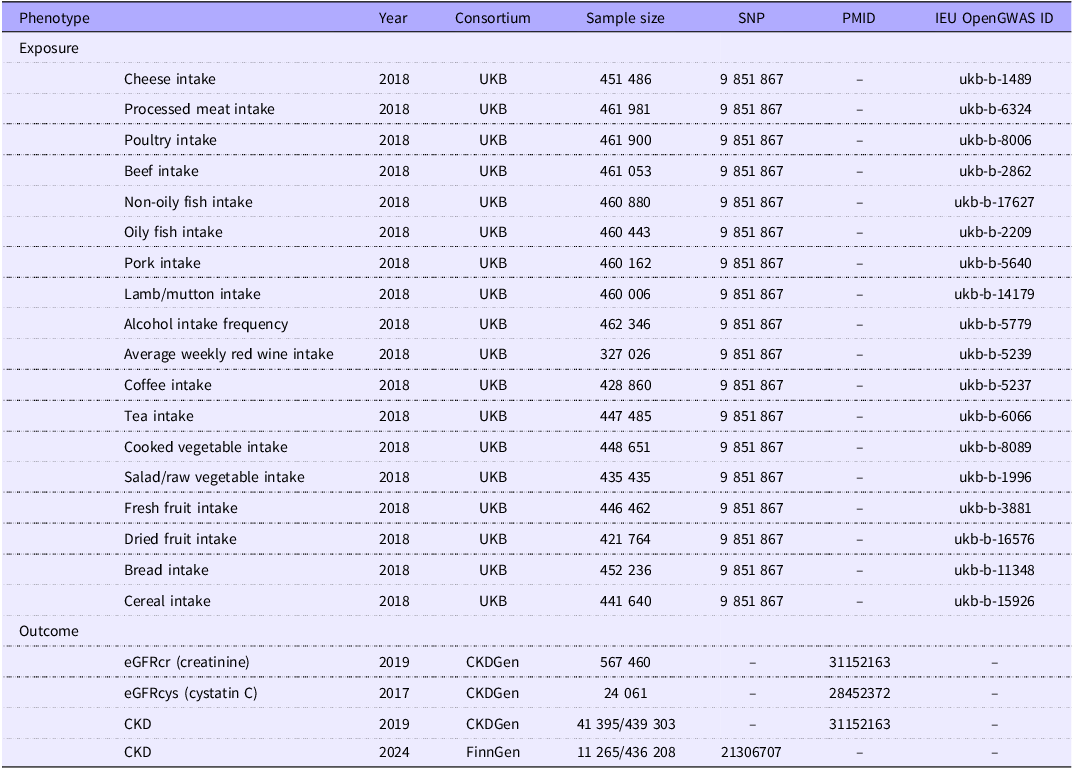
The CKD outcome data were collected from the FinnGen (eleventh release including 11, 265 cases and 436 208 controls) and CKDgen (European-ancestry including 41 395 cases and 439 303 controls)(Reference Kurki, Karjalainen and Palta18,Reference Wuttke, Li and Li19) (Table 1).
Because eGFRcr and eGFRcys are of great significance for the early diagnosis, disease monitoring and management of CKD, we also obtained eGFRcr and eGFRcys GWAS data from the CKDGen European-ancestry meta-analysis(Reference Wuttke, Li and Li19,Reference Gorski, van der Most and Teumer20) . Each study fitted sex- and age-adjusted linear regression models to log(eGFR).
Outcome phenotype definition
Creatinine values obtained with a Jaffé assay before 2009 were calibrated by multiplying them by 0·95. For adults over 18 years of age, eGFR was calculated using the Chronic Kidney Disease Epidemiology Collaboration (CKD-EPI) equation, by using the R package nephro. For individuals who were 18 years old or younger, the Schwartz formula was used. eGFRcys was estimated using the formula 76·7*(serum cystatin C) −1·19(Reference Stevens, Coresh and Schmid21). To manage extreme values, eGFR was winsorised at 15 and 200 ml/min per 1·73 m2. CKD was defined as an eGFR below 60 ml/min per 1·73 m2(Reference Kurki, Karjalainen and Palta18,Reference Wuttke, Li and Li19) .
Instrumental variables selection
All statistical analyses were performed using R software (version 4.4.0; https://www.r-project.org/) and the TwoSampleMR package, ensuring thorough and robust data evaluation.
Firstly, SNP significantly associated with the exposure phenotype were identified using a selection criterion where only those with a P-value < 5 × 10⁻⁸ were considered. This threshold is consistent with common practice in MR to reduce the risk of weak instruments. Secondly, a linkage disequilibrium threshold of R2 < 0·001 and a window size greater than 10 000 kb were applied during the IV clumping procedure to minimise the possibility of selecting correlated SNP that could undermine the validity of the instruments. The strength of the association between the IV and exposure factors was assessed using the F statistic. To mitigate bias stemming from weak IV, our criteria included only SNP with an F statistic > 10. Detailed information regarding the data can be found in online Supplementary Materials 2.
To prevent confounding from secondary phenotypes, such as BMI, hypertension and diabetes, we further screened the selected SNP using the LDlink tool (https://ldlink.nih.gov/?tab=ldtrait). This ensured that the SNP influenced the outcome through the exposure of interest rather than through potential confounders.
Mendelian randomisation analysis
The standard inverse-variance weighted (IVW) method with a random-effects model was the primary analysis approach and was used to estimate the causal relationship. This method assumes that all IV are valid and provide high efficiency. To further validate our results, we also applied MR Egger(Reference Bowden, Davey Smith and Burgess22), weighted median methods(Reference Bowden, Davey Smith and Haycock23), simple mode and weighted mode(Reference Hartwig, Davey Smith and Bowden24) as additional analyses. MR Egger operates under the assumption that all IV are invalid, whereas the weighted median method requires that at least half of the IV are valid. Simple mode uses the most common effect (or a simple average effect) of all IV as an estimate of the causal effect. Weighted mode adjusts for genotype frequency differences by weighting each genotype according to its frequency or effect size. These supplementary methods help to assess the robustness of our findings.
All statistics were processed with a 95 % CI. The causal effects of dietary factors on the risk of CKD were analysed using OR with 95 % CI. Since eGFRcys and eGFRcr levels were continuous data, the estimated effect values were assessed as β (95 % CI).
Sensitivity analysis
Cochran’s Q test was employed to evaluate the heterogeneity of the analysed results, while the Egger intercept test was utilised for the pleiotropy analysis. To address the potential influence of horizontal pleiotropy on the reliability of our findings in the MR analysis, MR-Presso with NbDistribution set to 10 000 was applied to identify and mitigate outlier SNP. Moreover, any positive findings from the two-sample MR analyses were subjected to additional leave-one-out analyses to assess their robustness.
Results
After screening of IV, the analysis incorporated a range of IV numbering between 8 and 93, all possessing an F-statistic > 10 (10·07–569·92; online Supplementary Materials 2).
The IVW approach was selected as the primary method based on a P< 0·05, and the results were analysed without horizontal pleiotropy except for dried fruit intake and eGFRcr (online Supplementary Materials 2: P value of pleiotropy analysis = 0·016). We determined that a more frequent alcohol intake cheese intake, tea intake and dried fruit intake were associated with the incidence of CKD. Oily fish intake and dried fruit intake were associated with eGFRcys levels. Salad/raw vegetable intake, cereal intake and dried fruit intake were associated with eGFRcr levels. The results suggest that they are risk/protective factors for CKD (Figure 2).
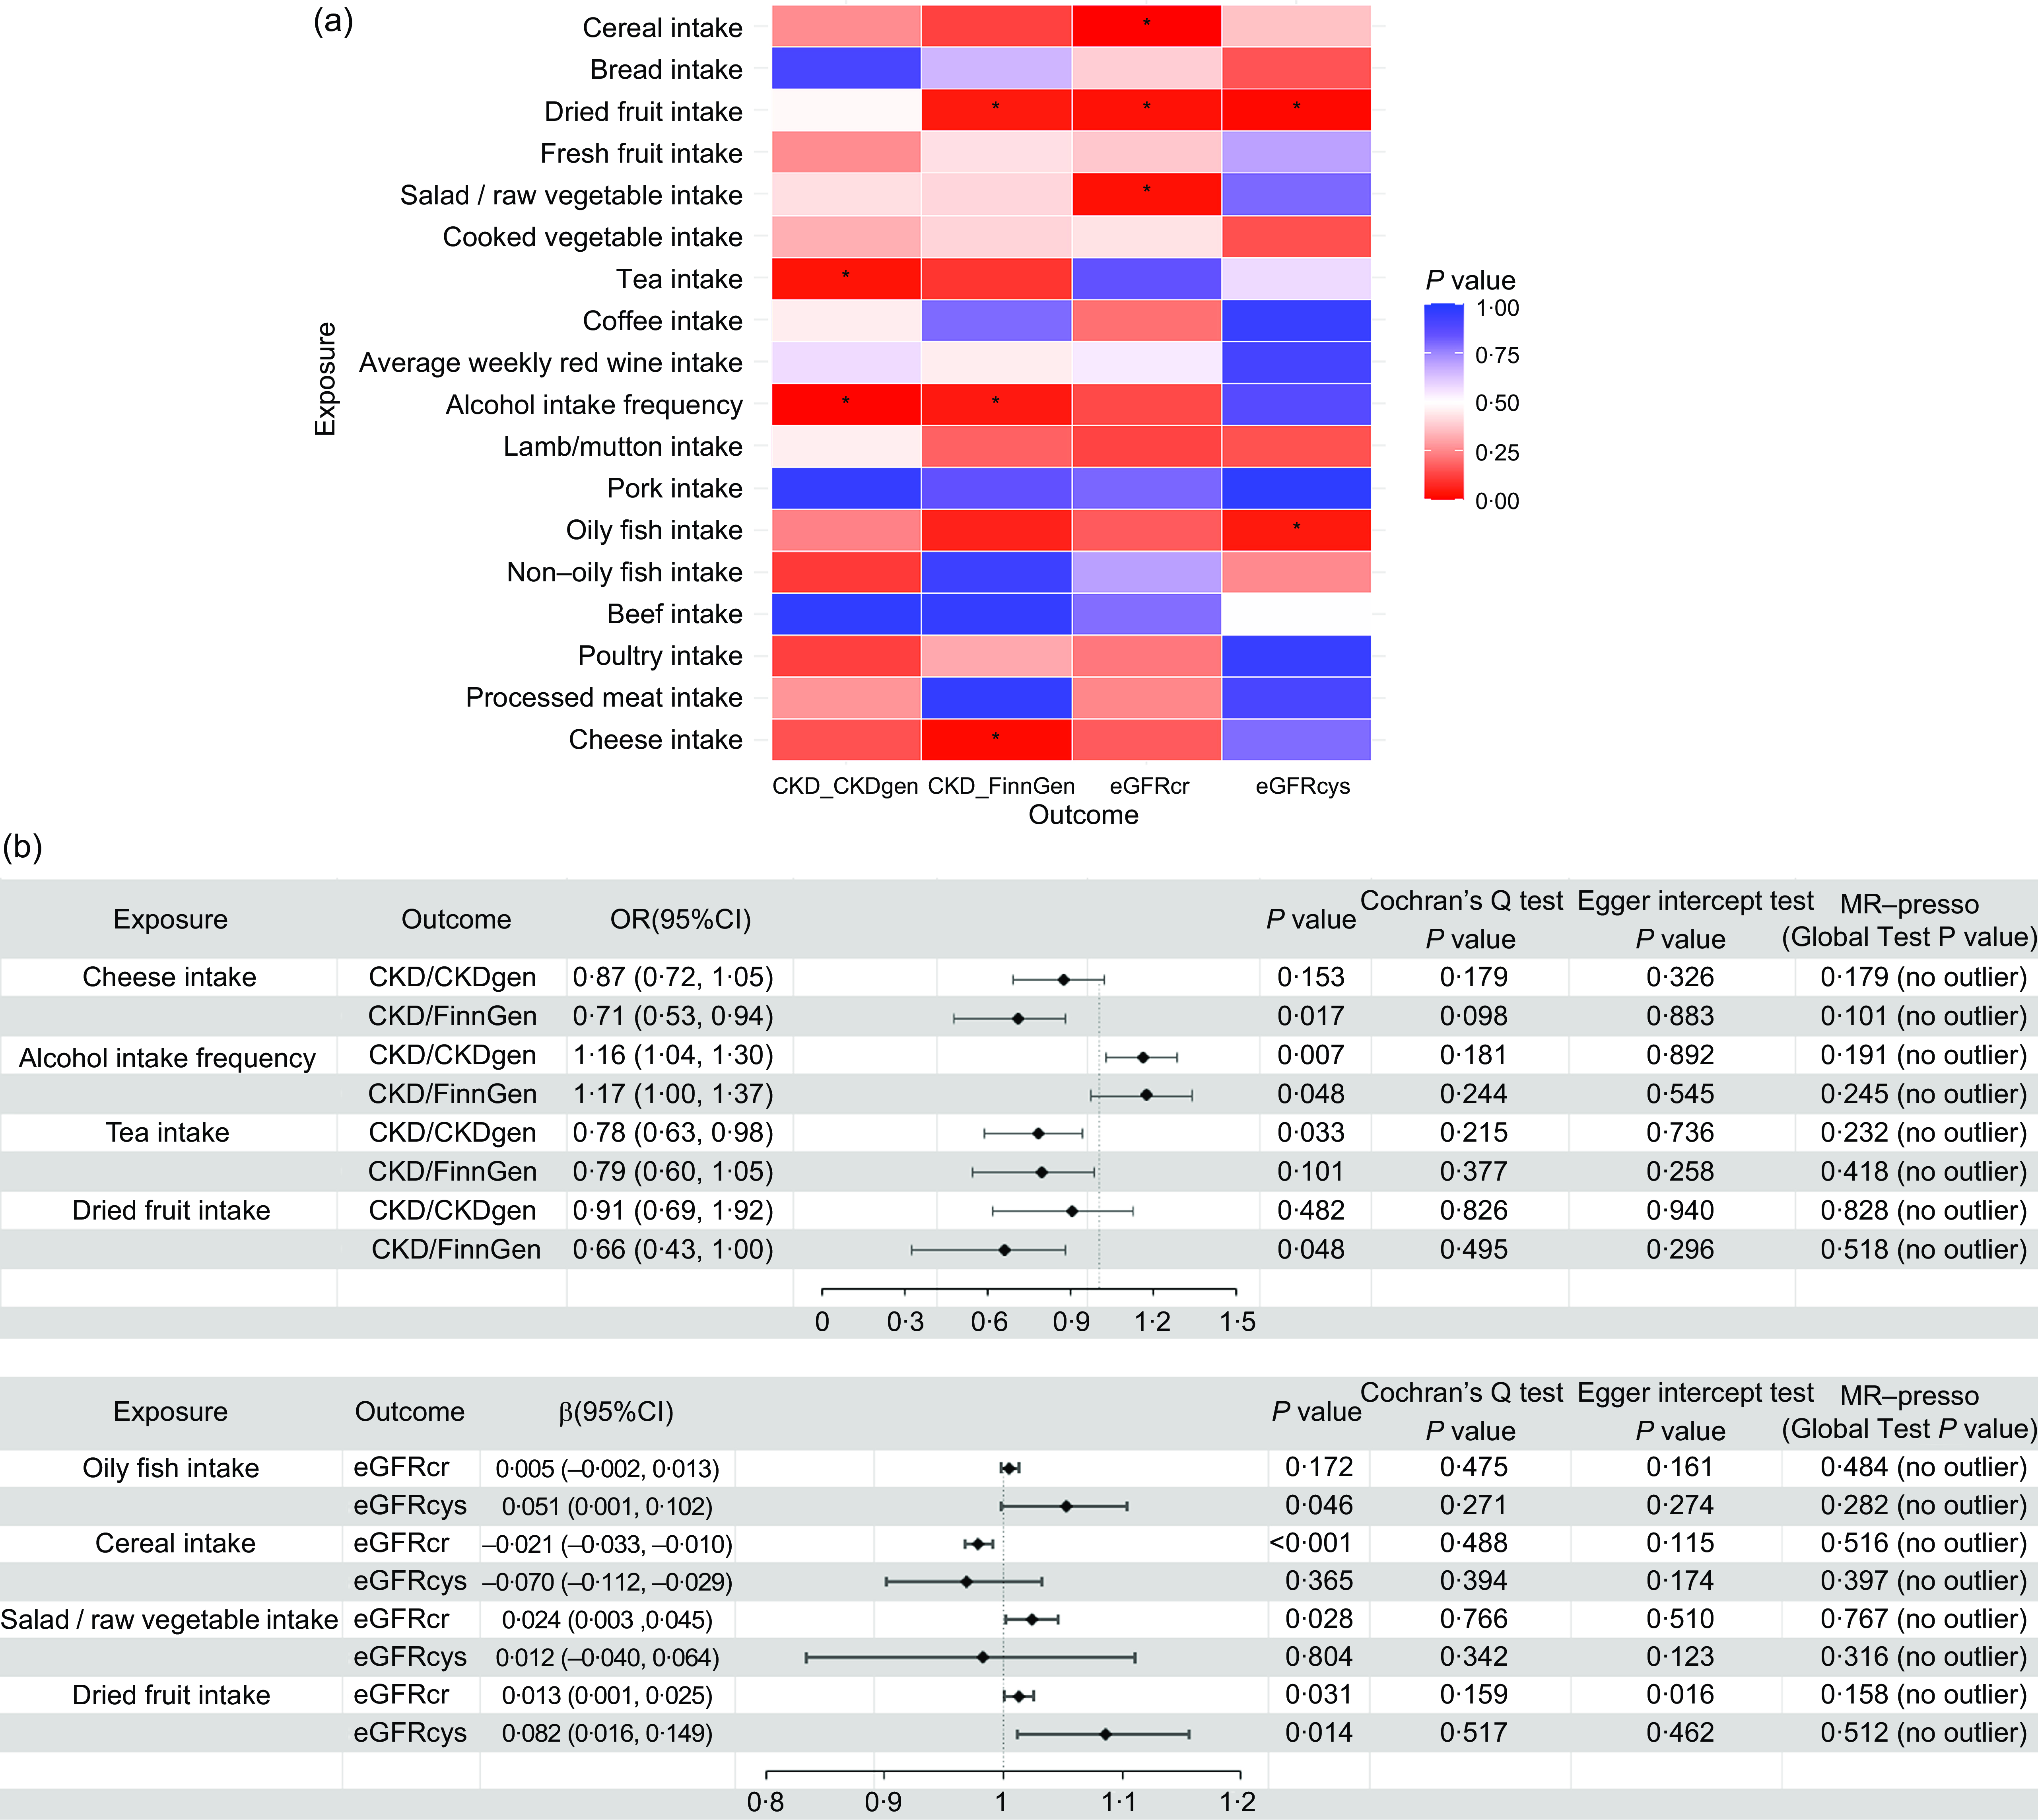
Figure 2. Risk/protective factor analysis of dietary intake based on IVW method: (a) Heat map of the correlation between dietary factors and eGFRcr, eGFRcys or CKD (*, P< 0·05); (b) MR analysis of risk/protective factors associated with eGFRcr, eGFRcys and CKD, along with the results of sensitivity analyses. CKD, chronic kidney disease; IVM, inverse variance weighting; MR, Mendelian randomisation.
Causality between cheese intake, alcohol intake frequency, tea intake and chronic kidney disease
A total of fifty-six SNP were included in the analysis after screening. The IVW method revealed that cheese intake is associated with a reduced risk of CKD (P= 0·017), with an estimated OR of 0·707. Supplementary analysis methods depicted in Figure 3 consistently supported the direction of effect observed with the IVW method. The leave-one-out analysis plot in Figure 4 suggests robustness in the derived SNP analysis results.
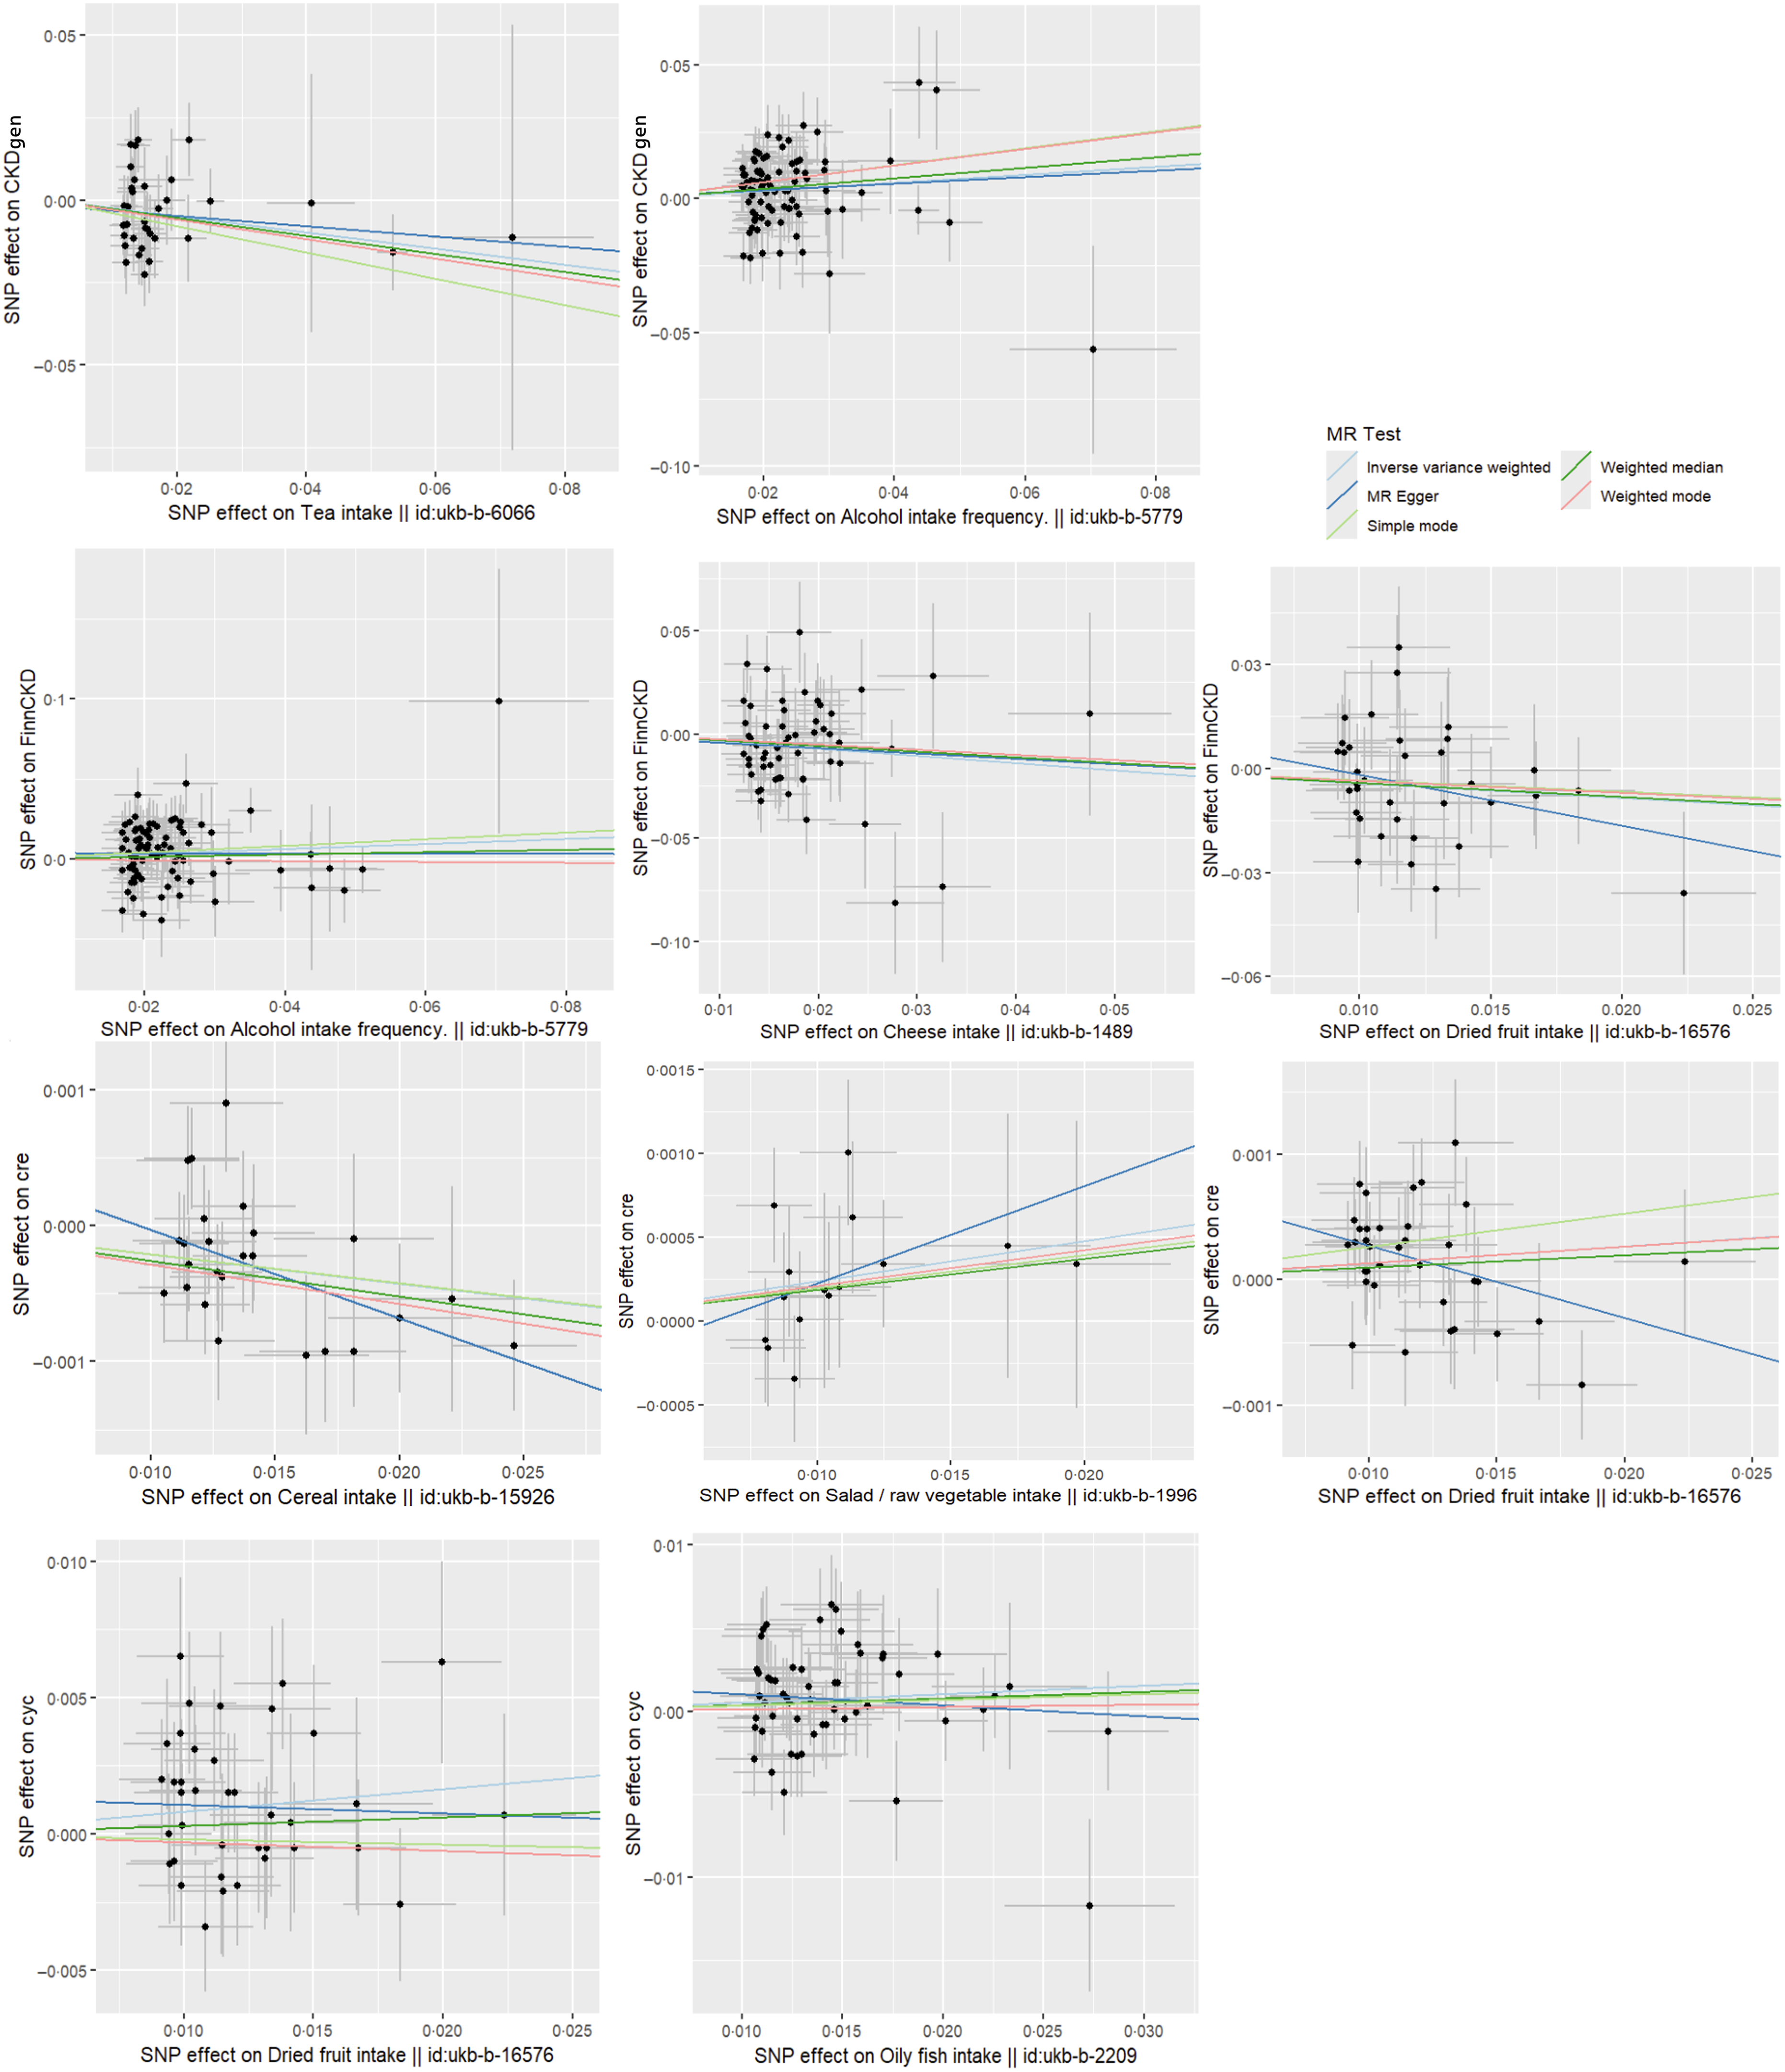
Figure 3. Scatter plots of MR analysis of dietary factors significantly associated with eGFRcr, eGFRcys or CKD (based on IVW, MR Egger, weighted median, simple mode and weighted mode). CKD, chronic kidney disease; IVM, inverse variance weighting; MR, Mendelian randomisation.
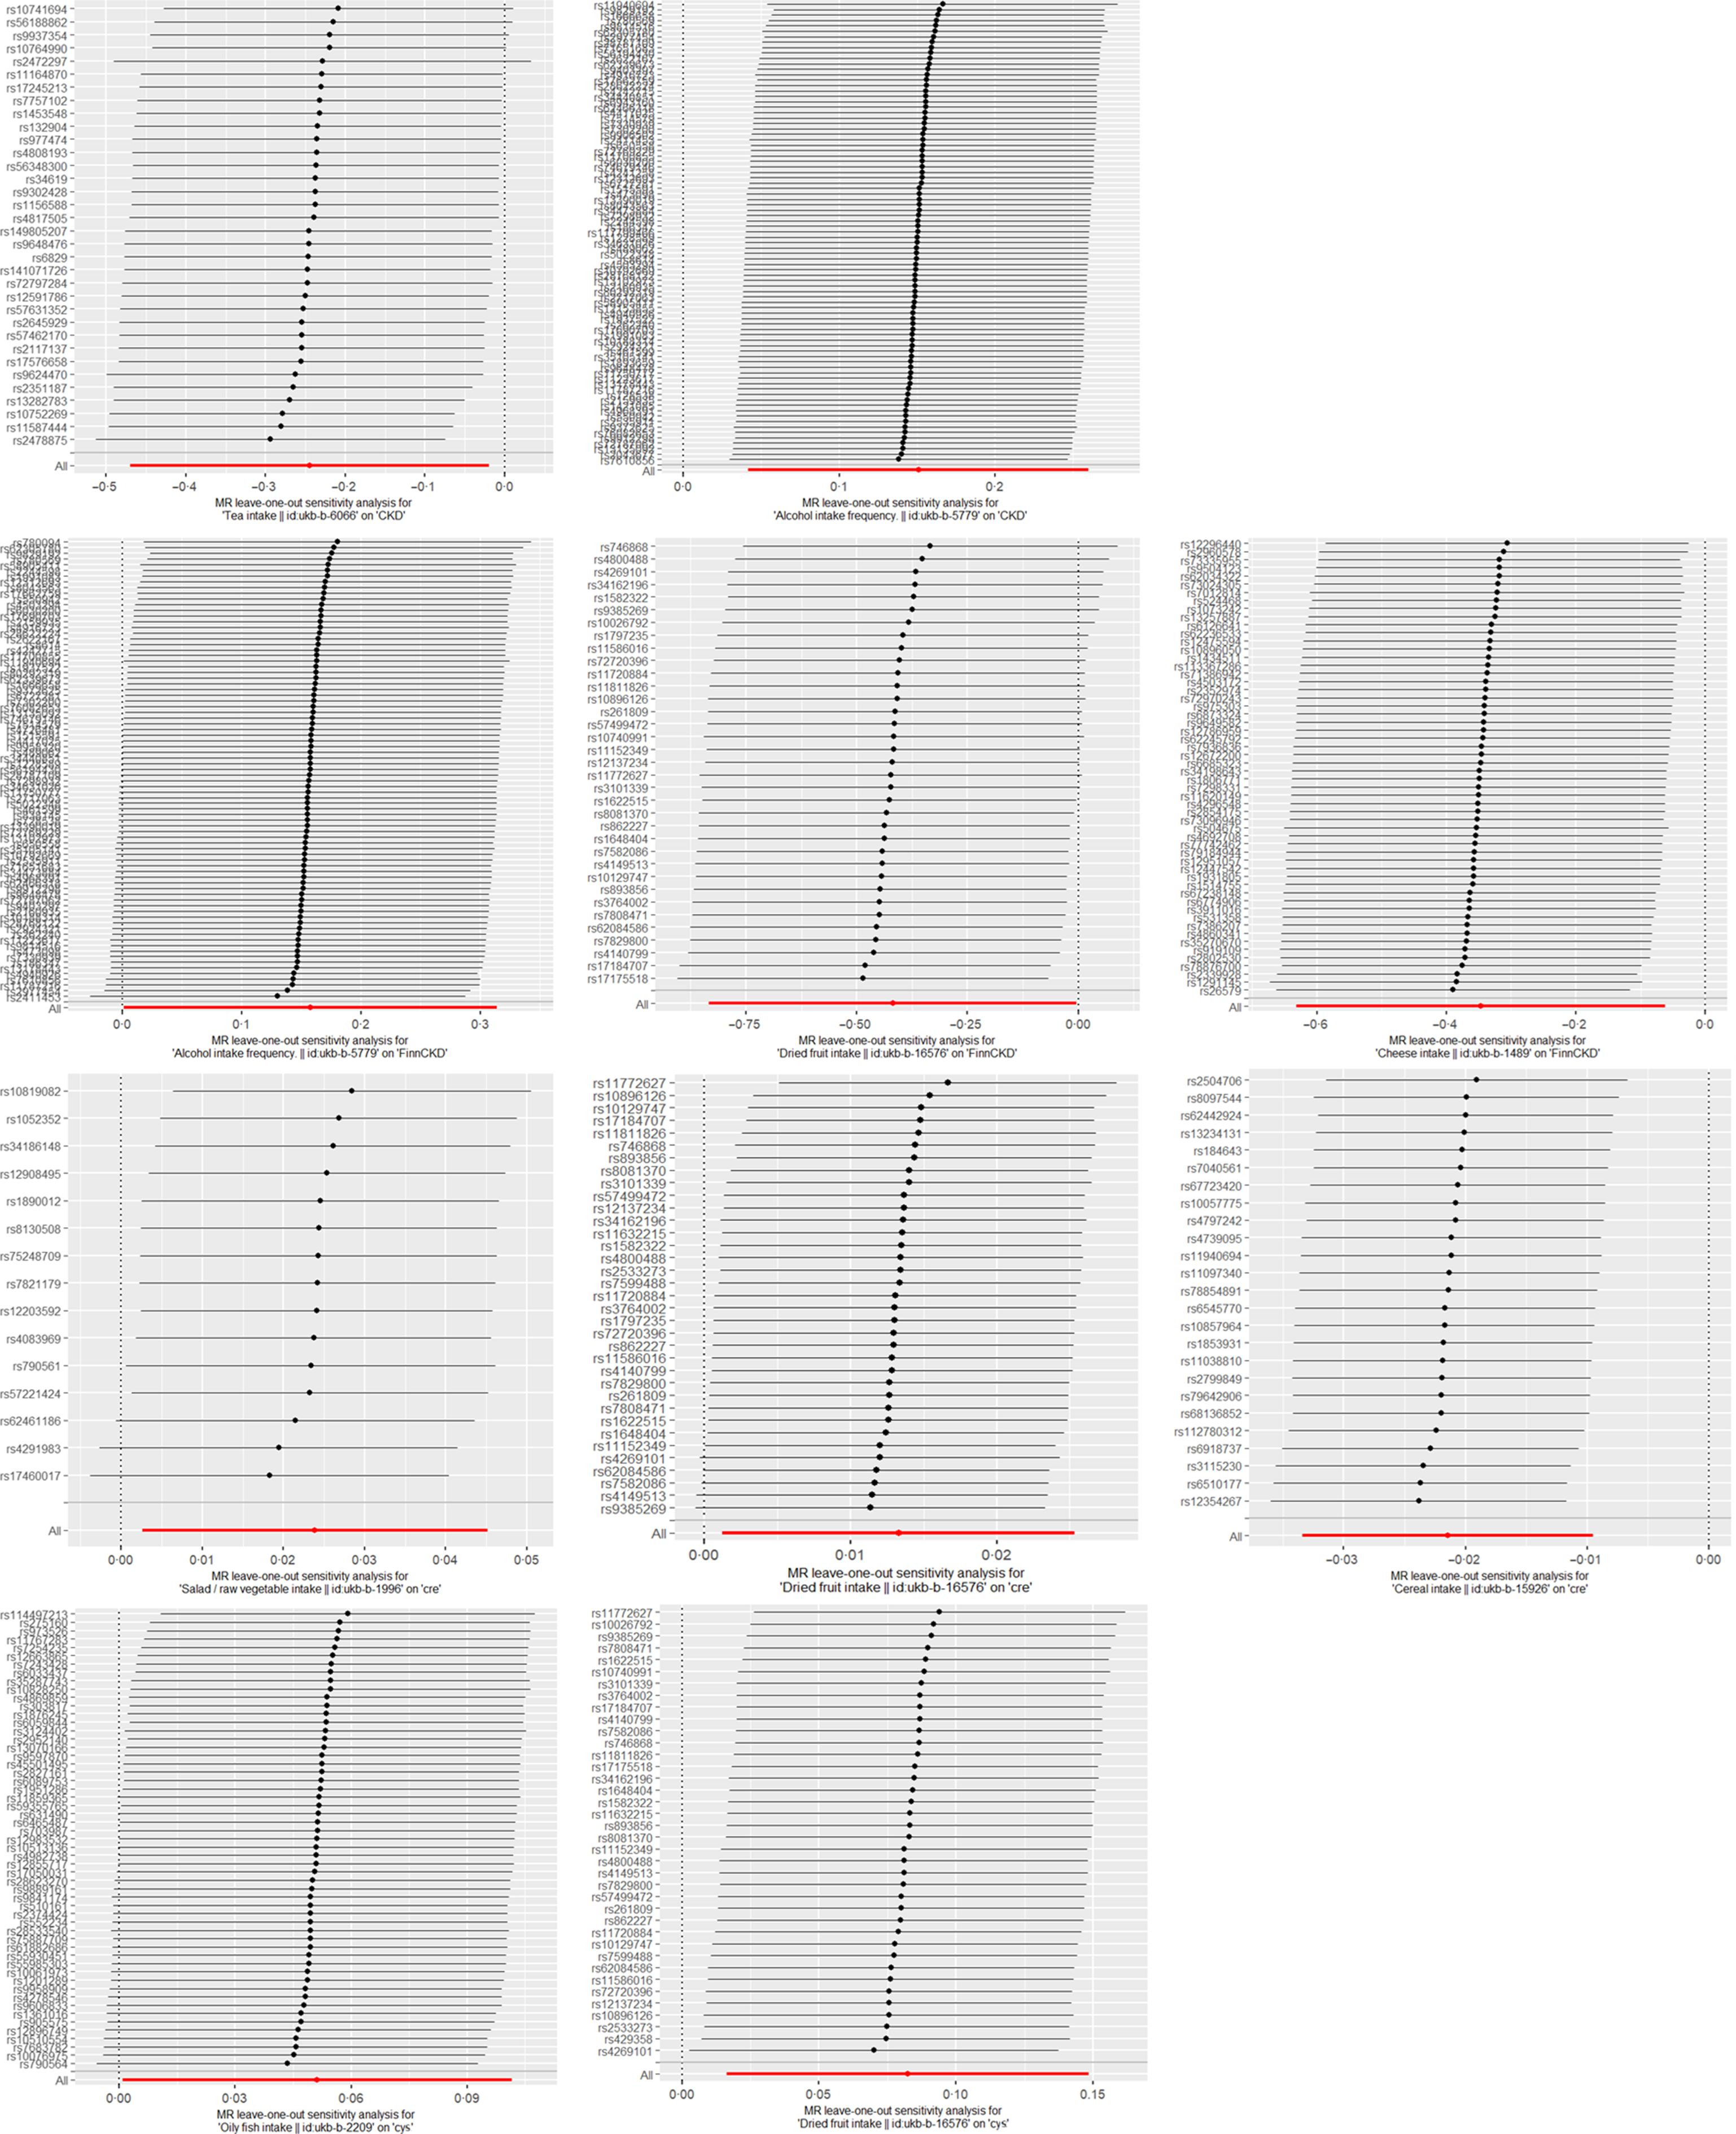
Figure 4. Leave-one-out sensitivity analysis of dietary factors significantly associated with eGFRcr, eGFRcys or CKD. (Each line represents the estimated effect value and its CI after excluding a specific SNP. The ‘ALL’ in the bottom row reflects the combined estimated effect value and CI, considering all SNP.). CKD, chronic kidney disease.
Alcohol intake frequency was found to be associated with the risk of CKD (P= 0·007, 0·048) based on the causal inference from eighty-five and eighty-one screened SNP derived from CKDgen and FinnGen, respectively. The estimated effect value OR of 1·163, 1·171 suggested that alcohol intake frequency was a risk factor for CKD attacks, with a 1·163, 1·171-fold increase in the risk of CKD attacks for every 1-unit increase in Alcohol intake frequency. Figure 3 consistently supported the direction of effect observed with the IVW method in CKDgen. However, when analysed by the complementary method (MR Egger and weighted mode) in FinnCKD, inconsistent directions of the effect value were found (Figure 3). The leave-one-out analysis suggested the overall robustness of the analysis (Figure 4).
Tea intake was found to be associated with a reduced risk of CKD (P= 0·033), with the causal inference of thirty-four screened SNP-derived CKDgen. The estimated effect value of OR is 0·783. The leave-one-out analysis suggested the overall robustness of the analysis (Figure 4). Consistent directions of the effect were found by the complementary method (Figure 3).
Causality between oily fish intake and eGFRcys level
After the screening, a total of fifty-five SNP were included in the causal analysis examining the relationship between oily fish intake and eGFRcys level. Analysis using the IVW method indicated a significant association between oily fish intake and elevated eGFRcys level (P= 0·046). The estimated effect value (β = 0·051) suggests that for every 1-unit increase in oily fish intake, eGFRcys level increases by approximately 1·053 units. The leave-one-out analysis plot in Figure 4 suggests robustness in the results derived from these fifty-five SNP. The supplementary analysis method MR-egger depicted in Figure 3 showed an inconsistent direction of effect observed with the IVW method.
Causality between cereal intake, salad/raw vegetable intake and eGFRcr level
After the screening, twenty-five SNP were included in the causal analysis examining the relationship between cereal intake and eGFRcr level. Analysis using the IVW method indicated a significant association between cereal intake and decreased eGFRcr levels (P= 0·028). The estimated effect values (β = –0·022) suggest that for every 1-unit increase in cereal intake, eGFRcr decreases by approximately 0·978 units. The supplementary analysis methods depicted in Figure 3 showed a consistent direction of effect observed with the IVW method. The leave-one-out analysis plot in Figure 4 suggests robustness in the results derived from these twenty-five SNP.
After screening, fifteen SNP were included in the causal analysis examining the relationship between salad/raw vegetable intake and eGFRcr level. Analysis using the IVW method indicated a significant association between salad/raw vegetable intake and elevated eGFRcr levels (P= 0·028). The estimated effect values (β = 0·024) suggest that for every 1-unit increase in salad/raw vegetable intake, eGFRcr increases by approximately 1·024 units. The supplementary analysis methods depicted in Figure 3 showed a consistent direction of effect observed with the IVW method. The leave-one-out analysis plot in Figure 4 suggests robustness in the results derived from these fifteen SNP.
Causality between dried fruit intake and eGFRcr, eGFRcys level and chronic kidney disease
After screening, thirty-five and thirty-eight SNP were included in the causal analysis examining the relationship between dried fruit intake and eGFRcr and eGFRcys levels. Analysis using the IVW method indicated a significant association between dried fruit intake and elevated eGFRcr and eGFRcys levels (P= 0·048, 0·031). The estimated effect values (β = 0·013, 0·082) suggest that for every 1-unit increase in salad/raw vegetable intake, eGFRcr increases by approximately 1·013, 1·086 units. The leave-one-out analysis plot in Figure 4 suggests robustness in the results. However, the analysis method MR Egger depicted in Figure 3 showed an inconsistent direction of effect observed with the IVW method. Additionally, for eGFRcys, the directions of effect in simple mode and weighted mode were also inconsistent with those observed in IVW.
Dried fruit intake was found to be associated with a reduced risk of CKD (P= 0·048), with the causal inference of thirty-five screened SNP derived FinnCKD. The estimated effect value of OR is 0·658. The leave-one-out analysis suggested the overall robustness of the analysis (Figure 4). Consistent directions of the effect value were found by the complementary methods (Figure 3).
Discussion
We conducted an MR investigation to examine the causal associations between dietary habits and the risk of kidney function-related indices (eGFRcr, eGFRcys) as well as CKD. This study found that a more frequent alcohol intake was associated with an increased risk of CKD, whereas cheese intake, tea intake and dried fruit intake were protective factors against the incidence of CKD (Figure 2). This study found that oily fish intake (β = 0·051, (95 % CI: (0·001, 0·102)), P= 0·046) and dried fruit intake (β = 0·082, (95 % CI: 0·016, 0·149), P = 0·014) were associated with elevated eGFRcys levels. Salad/raw vegetable intake (β = 0·024, (95 % CI: 0·003, 0·045), P= 0·028) and dried fruit intake (β = 0·013, (95 % CI: 0·001, 0·031), P= 0·014) were factors for elevated eGFRcr levels, while cereal intake (β = −0·021, (95 % CI: −0·033, −0·010), P< 0·001) was associated with decreased eGFRcr levels (Figure 4).
Currently, there is a notable lack of extensive randomised controlled trials examining the correlation between dietary intake and the incidence of CKD. Instead, the majority of existing research predominantly relies on cross-sectional and retrospective survey methods. Consistent with our findings, specific dietary patterns have been shown to reduce the risk of CKD and elevate eGFR levels. Interestingly, the protective foods identified in our study, such as tea, cheese, dried fruits, oily fish and vegetarian diets are rich in antioxidant compounds(Reference Fernández-Lázaro, Arribalzaga and Gutiérrez-Abejón8–Reference Cases, Cigarrán-Guldrís and Mas11). These antioxidants may contribute to their protective effects by reducing oxidative stress, which is a factor in the progression of CKD. A cross-sectional survey from China showed that two dietary patterns rich in plant-derived foods (cereals, fruits and vegetables) have proven to be beneficial for kidney function(Reference Mao and Cheng25). One aspect that contrasts with our research results because our results showed that increasing the frequency of cereal consumption decreased eGFRcr. This may be due to the differences in the ingredients of cereal products in Europe and China, and this study was based on European samples. Potassium additives are widely distributed in processed foods and therefore pose a risk of hidden sources of potassium in CKD dietary management. According to a study analysing the labelling of 715 products from France, Germany and Spain, the frequency of potassium additives in processed foods is notably high. The food categories that showed the greatest presence of additives were breaded products, meat derivatives, non-alcoholic beverages, ready-to-eat products and cereal derivatives(Reference Martínez-Pineda, Vercet and Yagüe-Ruiz26).
Recently, an MR study reported a causal relationship between an extra cup of tea per day and a reduced risk of CKD, involving 117 165 participants with 12 385 cases from the CKDGen consortium(Reference Zhang, Xiong and Shen27). This is consistent with our findings, which included 439 303 participants with 41 395 cases from the CKDGen consortium. Tea consumption (camellia sinensis) has been correlated with a lower incidence of chronic pathologies. The health benefits attributed to tea consumption are believed to be associated with their high content of bioactive ingredients, such as polyphenols(Reference Peluso and Serafini28). Studies have shown that the natural polyphenol epigallocatechin-3-gallate (EGCG), found in green tea, can reduce oxidative stress and modulate epigenetic changes, thereby attenuating arsenic-induced cytotoxicity and fibrogenic changes in kidney epithelial cells(Reference Iheanacho, Kandel and Roy29). Another study also demonstrated that EGCG protects against medial arterial calcification in CKD via modulation of the JunB-dependent Ras/Raf/MEK/ERK signalling pathway(Reference Li, Fang and Yin30).
Besides tea consumption, we also found other dietary habits that may have protective effects against CKD, such as cheese intake. The cheese maturation process is notable for producing bioactive peptides due to the action of enzymes produced by lactic acid bacteria. In addition to being proteins with high biological value due to their excellent amino acid profiles, peptides from some types of cheese possess functional properties such as anti-hypertensive, antioxidant and zinc-binding activities(Reference Rangel, Bezerra and Sales31). In a preclinical study, consumption of probiotic-enriched Mina’s cheese (Lact. acidophilus La-05) suggested a promising cardioprotective effect and was able to downregulate superoxide dismutase activity in a rat model of CKD(Reference da Silva Costa, de Araujo and da Silva Melo32).
Using the main MR analysis, IVM method, we found that oily fish intake was a factor for elevated eGFRcys levels. In contrast, the results analysed by the MR Egger method showed a different direction of the effect value. Although the existence of a causal relationship cannot be concluded based on the results of the current analyses, however, fish oil, rich in n-3 fatty acids, may play a crucial role in preventing CKD. After adjusting for key confounders, habitual use of fish oil was linked to a significantly reduced risk of developing CKD, with a hazard ratio of 0·90 (95 % CI, 0·87, 0·95) compared with non-use in the UK Biobank(Reference Liu, Ye and Yang33). Another study showed that fish oil supplementation can reduce the inflammatory factor IL-1β in non-dialysis CKD patients(Reference Deike, Bowden and Moreillon34). A cross-sectional study conducted in Japan found that higher dietary fish intake was associated with higher serum levels of n-3 PUFA. Participants in the higher PUFA tertiles had non-significantly higher eGFRcr and significantly higher eGFRcys. They reported that eGFRcys might be more useful than eGFRcr when investigating the relationship between eGFR and PUFA profiles, as muscle mass could be an important factor influencing the relationship between serum PUFA and eGFR(Reference Higashiyama, Kubota and Marumo35). This may explain why no such association was found with eGFRcr levels.
Although our MR analysis identified some dietary risk factors associated with CKD, a more nuanced interpretation of these results is necessary. For example, cereal intake was analysed as a risk factor for decreased eGFR levels. While cereals are generally considered healthy due to their high fibre content and essential nutrients, it is important to recognise that some processed cereals can contain high levels of potassium additives. These additives pose a hidden risk for individuals with CKD, as excessive potassium intake can exacerbate kidney dysfunction and elevate serum potassium levels. Therefore, the interpretation of this result should be limited to processed cereals that may contain higher levels of potassium additives, which could negatively impact kidney function. Similarly, while dried fruits are rich in nutrients beneficial to health and may have a positive impact on CKD patients, the potential risk of mycotoxin contamination needs to be taken seriously. To reduce health risks for CKD patients, it is important to choose dried fruit products that have undergone strict quality control and pay attention to the origin and storage conditions of the dried fruits to minimise mycotoxin intake(Reference González-Curbelo and Kabak36). However, it is crucial to note that the supplement methods revealed inconsistencies in the direction of the effect. In addition, horizontal pleiotropy analysis indicated eGFRcr level may be affected by other pathways, not just the exposure factor of dried fruit intake. This discrepancy calls for caution in interpreting the causality of dried fruit intake and oily fish on eGFR levels. In the CKDgen database, both the IVW and MR Egger methods consistently show a significant association between alcohol intake and CKD risk. Previous studies present that chronic ethanol consumption correlates with significantly increased renal oxidative stress(Reference Harris, Roy and Coughlan37). However, in the FinnCKD database, although IVW indicates significance, MR Egger and weighted mode methods show a different direction, possibly due to different alcohol consumption patterns, genetic variations and environmental factors.
These results emphasise the complexity of diet–disease relationships. The protective effects of dietary factors such as tea, cheese, dried fruits and oily fish are likely due to their antioxidant properties, which help reduce renal oxidative stress. Additionally, bioactive compounds including polyphenols, bioactive peptides and n-3 fatty acids, may provide anti-inflammatory and cytoprotective benefits, further supporting kidney health. We recommend a balanced and varied diet that includes protective foods such as cheese, dried fruits, tea, salad/raw vegetables and oily fish, as these may help support kidney function and potentially reduce the risk of CKD. On the other hand, reducing alcohol consumption and limiting cereal intake are important to lower the risk of CKD. While these dietary habits may offer protection, patients with CKD should work with dietitians to adjust these recommendations to their individual needs and ensure proper monitoring, particularly in the case of processed foods.
It is crucial to acknowledge the limitations of our study. As our MR analysis is based on large-scale GWAS data, it is subject to the constraints of its study design. Notably, our research instrument could not differentiate between processed and unprocessed forms of certain foods (e.g., cereals, dried fruits), which may have led to an oversimplification of the observed associations. Additionally, our findings are primarily based on data from European populations, limiting the generalisability of the results to other ethnic groups. Furthermore, the causal relationship identified through the MR analysis represents the impact of long-term exposure, meaning that short-term exposure may lack clinical significance. Another limitation is that we were unable to distinguish causal effects at different time points; for example, patients with CKD may consciously adjust their eating habits after being diagnosed. Therefore, our findings may not apply to patients with early kidney disease or those who change their eating behaviours quickly after being diagnosed. Finally, while we analysed data from two CKD databases, most dietary factors showed significance in only one of the two databases, with alcohol intake being the exception. However, it is important to note that the direction of the OR values was consistent across both databases by IVM methods, providing some reassurance about the robustness of the findings. Future studies should differentiate between processed and unprocessed food forms and include more diverse populations, account for potential confounders such as lifestyle factors and environmental influences to improve the accuracy of dietary recommendations related to kidney health and enhance the applicability of the results across different genetic backgrounds.
Conclusion
In conclusion, our study successfully identified several dietary factors associated with CKD risk and eGFRcr. Frequent alcohol intake was found to increase CKD risk in CKDgen consortium. Protective factors included cheese, tea and dried fruit. Additionally, salad/raw vegetable intake was linked to higher eGFRcr levels, while cereal intake was associated with lower eGFRcr levels. These findings align with existing observational studies and offer valuable insights for optimising dietary strategies to manage CKD and improve renal function.
Acknowledgements
We want to acknowledge the participants and investigators of the FinnGen, UK Biobank, CKDgen and other investigators’ study for contributing to summary-level data in this study. This work was supported by the Key Laboratory of Functional Molecular Imaging of Tumor and Interventional Diagnosis and Treatment of Shaoxing City, Shaoxing People’s Hospital (2020ZDSYS01).
Huang Ya’nan and Tang Wei designed the study. Huang Ya’nan contributed to data acquisition. Huang Ya’nan, Tang Wei and Zhao Zhenhua contributed to the data analysis and interpretation. Huang Ya’nan performed the statistical analysis. Huang Ya’nan, Tang Wei and Yang Jianfeng contributed to drafting and revising the manuscript critically for the important intellectual content of the manuscript together. All authors read and approved the final manuscript. Huang Ya’nan and Tang Wei contributed to the work equally.
The authors declare no competing interests.
The exposure data ID are all available from the IEU open GWAS database (https://gwas.mrcieu.ac.uk/). GWAS outcome date of summary statistics for CKD, eGFRcys and eGFRcrea from the CKDGen European-ancestry meta-analysis (https://ckdgen.imbi.uni-freiburg.de/). GWAS outcome data of CKDfinn for this study is available from FinnGen (https://storage.googleapis.com/finngen-public-data-r11/summary_stats/finngen_R11_N14_CHRONKIDNEYDIS.gz).
Supplementary material
For supplementary material/s referred to in this article, please visit https://doi.org/10.1017/S0007114525000765


 Open access