


Statement of research significance
Research question: This study compared the psychometric performance of two Rey Complex Figure (CF) recognition tasks: the 4-choice Emory CF Recognition (based on 10 streamlined scoring elements) and the 24-item yes/no task developed by Meyers and Lange (1995; M&L). Key CF Recognition differences included item saliency, response format, and task length.
Main findings: Both tasks distinguished healthy controls from patients with movement disorders, but the Emory task showed larger effect sizes. Despite being shorter, Emory CF Recognition demonstrated better sensitivity at lower cognitive levels and more effective group discrimination. The M&L task, which combines target identification and foil rejection, was less precise, more multidimensional, and more prone to response biases. d-prime scoring did not improve its diagnostic value.
Study contributions: Results support the Emory 4-choice task as a more efficient and psychometrically sound measure of CF recognition memory, particularly in cognitively impaired populations, due to its unidimensionality and improved sensitivity.
Introduction
The Rey CF is a widely utilized assessment tool for evaluating visual constructional skills and visual memory (Rabin et al., Reference Rabin, Paolillo and Barr2016). Introduced in 1941 (Corwin & Bylsma, Reference Corwin and Bylsma1993; Rey, Reference Rey1941), the CF originally included only a copy and single free recall memory condition. Rey’s scoring system assigned two points each to four core elements of the figure (diamond, circle, and two line groups) and one point to remaining segments, totaling 47 points. Osterrieth subsequently revised the scoring to reduce scoring burden by focusing on 18 larger CF components, each of which were scored for accuracy and placement resulting in a maximum of 36 points (Osterrieth, Reference Osterrieth1944). Osterrieth’s scoring method is the most widely used approach for CF scoring for both copy and memory recall conditions (Zhang et al., Reference Zhang, Lv, Min, Wang, Zhao and Li2021).
Although common in clinical assessments, the CF was not originally developed as a standardized test, with varying administration protocols yielding different performance patterns (Loring et al., Reference Loring, Martin, Meador and Lee1990). To enhance its clinical utility, Meyers and Lange (M&L; Meyers & Lange, Reference Meyers and Lange1994; Meyers & Meyers, Reference Meyers and Meyers1995) developed a standardized administration protocol that includes a copy trial, 3-minute free recall, 30-minute delayed recall, and normative data for each condition. They also introduced a recognition task to help determine whether poor free recall is due to retrieval deficits. This recognition task includes 12 Osterrieth scoring elements from the Rey Figure (targets) with 12 scoring elements from the Taylor Figure (a parallel CF; Taylor, Reference Taylor1969) resulting in a 24-item yes/no recognition test.
To both simplify scoring complexity and decrease the scoring time associated with Osterrieth’s 18-element CF scoring system, we developed a streamlined approach for copy and memory conditions using only 10 CF components (Loring et al., Reference Loring, Simama, Sanders, Saurman, Zhao, Lah and Goldstein2024). Unlike the M&L recognition that combines components from two different CFs into a yes/no recognition task, Emory CF recognition includes the same 10 CF copy and memory scoring elements using a 4-choice recognition format. CF distractors were designed based on errors observed in patients with lateralized right temporal lobe epilepsy during free recall (Loring et al., Reference Loring, Lee and Meador1988), which are also commonly encountered across a range of neurological diagnoses in clinical practice.
The current study contrasts M&L 24-item, yes/no CF Recognition performance with performance on the Emory 10-item, 4-choice Recognition task in a large cohort of cognitively healthy research participants and in patients with various movement disorders undergoing neuropsychological evaluation for deep brain stimulation(DBS) or focused ultrasound. Given their elevated risk for memory and other cognitive impairments, individuals with movement disorders offer an ecologically valid clinical context in which to assess the relative utility of the M&L and Emory recognition tasks (Loring et al., Reference Loring, Simama, Sanders, Saurman, Zhao, Lah and Goldstein2024).
Recognition memory performance can vary substantially depending on factors such as distractor saliency, response format (yes/no vs. forced-choice), and the number of test items. Tasks with distractors closely resembling target items demand greater cognitive discrimination and are typically more difficult, while less salient distractors make recognition easier. Similarly, the format of the recognition task influences underlying cognitive processes. Yes/no recognition requires individuals to make an independent judgment about each item, a process susceptible to response bias and confidence effects. In contrast, forced-choice formats mitigate these influences by requiring direct comparisons among options (Kroll et al., Reference Kroll, Yonelinas, Dobbins and Frederick2002). Additionally, the number of items affects the psychometric robustness of the task, with larger item sets generally offering greater reliability (Downing, Reference Downing2004). To investigate performance differences, we apply logistic regression(LR), item factor analysis, and item response theory (IRT). Building on prior findings, we also employ d-prime scoring, which we have previously shown to effectively distinguish individuals with amnestic mild cognitive impairment (aMCI) who are positive for Alzheimer’s disease (AD) biomarkers (amyloid-β, tau) from those who are biomarker-negative (Goldstein et al., Reference Goldstein, Loring, Thomas, Saleh and Hajjar2019). Accordingly, we examine group-level differences in M&L CF Recognition using d-prime, based on hit and false alarm rates.
Method
Healthy volunteers
There were 1056 participants from the Emory Healthy Brain Study (EHBS). EHBS is a longitudinal AD‘ biomarker discovery project to identify predictors of cognitive trajectories of normal and pathological aging, with EHBS study visits scheduled every 2 years after enrollment (Goetz et al., Reference Goetz, Hanfelt, John, Bergquist, Loring, Quyyumi, Clifford, Vaccarino, Goldstein, Johnson, Kuerston, Marcus, Levey and Lah2019), with cognitive testing conducted at each study time point. This project was approved by the Emory University Institutional Review Board in accordance with the Declaration of Helsinki, and all participants provided written informed consent.
Movement disorder patients
Movement disorder patients were 223 referrals for neuropsychological testing as part of their preoperative evaluation for DBS or for independent diagnostic characterization as part of a specialty Comprehensive Care Clinic. Diagnoses included 51 (60.7%) patients with Parkinson’s disease (PD), 25 (29.8%) patients with Essential Tremor (ET), 1 (1.1%) mixed PD/ET patient, 4 (4.8%) patients with cervical dystonia, and one patient (1%) each with blepharospasm, tremor associated with normal pressure hydrocephalus, or tardive dyskinesia.
Cognitive testing
Cognitive testing was conducted in person or via telehealth (Hewitt & Loring, Reference Hewitt and Loring2020) Cognitive testing was conducted via telehealth for the majority of EHBS participants (telehealth: n = 898; in-person: n = 158), whereas all but one Movement Disorder patient had face-to-face evaluations. Although different assessment protocols were employed, both included the Montreal Cognitive Assessment (MoCA) (Nasreddine et al., Reference Nasreddine, Phillips, Chertkow, Rossetti, Lacritz, Cullum and Weiner2012) and the Rey CF (Lezak et al., Reference Lezak, Howieson and Loring2004; Loring et al., Reference Loring, Simama, Sanders, Saurman, Zhao, Lah and Goldstein2024). Equivalence of telehealth evaluation has been demonstrated for MoCA testing (Loring et al., Reference Loring, Lah and Goldstein2023). Emory CF Recognition was obtained after M&L Recognition to prevent any potential unknown performance influences on the latter since M&L CF performance is included as part of the formal EHBS research protocol. There were no tests of visual memory or visual perceptual function administered between CF copy and the delayed memory conditions.
Meyers and lange (M&L) Complex Figure recognition
The M&L recognition task is a 24-item yes/no recognition test that incorporates 12 of the 18 Osterrieth CF scoring elements with 12 (of 18) scoring elements from the Taylor CF. CF Recognition is assessed after the copy, immediate recall, and delayed CF recall trials. Between 4 and 9 CF elements are presented on a single page and participants indicate which elements are recalled from the Rey CF. The primary Recognition memory score is calculated as the sum of correctly identified Rey CF target items and correctly rejected Taylor CF foil items, yielding a maximum possible score of 24.
Emory Complex Figure recognition
The Emory CF Recognition task employs a 4-choice recognition paradigm to evaluate the 10 scoring elements defined by the Emory CF system to characterize CF copy and memory performances (see Supplementary File for Emory CF Recognition Stimuli), Target items and distractors are presented in distinct spatial positions using the “Union Jack” as a frame of reference to serve as a visual anchor for all stimuli (see Supplementary File for Recognition Stimuli and scoring form). Emory Recognition prioritizes spatial configural memory, a domain considered sensitive to right hippocampal dysfunction (Breier et al., Reference Breier, Plenger, Castillo, Fuchs, Wheless, Thomas, Brookshire, Willmore and Papanicolaou1996).
Analysis
Primary analyses consist of 2 (group) × 2 (CF method) mixed-design ANOVAs, followed by pairwise comparisons to examine differences across CF scoring approaches. To further assess group discrimination, we also independently applied d-prime scoring to the M&L Recognition task using hit and false alarm rates, and applied an independent t-test to evaluate mean d-prime differences across groups. d-prime, derived from signal detection theory, provides an unbiased estimate of recognition performance by separating true memory sensitivity from response bias (Yonelinas, Reference Yonelinas1994). While comparing clinical group performance to that of healthy controls is an indirect method of evaluating construct validity, the extent to which a task differentiates between groups, particularly with varying effect sizes, serves as an indicator of its sensitivity to disease-related cognitive changes. Patients with movement disorders represent a relevant clinical population in which the CF is included as a standard component of neuropsychological assessment protocols.
To better understand differences between measures, we will then explore individual item contributions to group discrimination using LR, and through IRT-based analyses. In these analyses, we use IRT as a strictly descriptive tool, recognizing that either (or both) of the measures could possess some multidimensionality, thus rendering the unidimensional IRT trait a weighted composite of the multiple dimensions (see e.g., Reckase, Reference Reckase2009, pp.126 – 127). One useful outcome from IRT analysis is the test information function, which is derived from the slopes of the estimated individual item response curves and ultimately quantifies the precision of the latent trait estimates at different levels of the latent trait (test information is inversely related to measurement error). Test information functions provide a useful way of comparing measures, not only with respect to their absolute levels of measurement precision, but also according to the relative measurement precision they provide at different locations along the latent trait continuum.
Results
The average EHBS MoCA score was 26.8/30 (SD = 2.4). Age ranged from 50.1 years to 81.9 years (M = 66.0, SD = 6.7). Education varied between 11 – 22 years (M = 16.8, SD = 2.0). There were 670 (63.4%) women and 386 (36.6%) men, and included 833 White participants (78.9%), 188 Black participants (17.8%), 15 Asian participants (1.4%), 3 American Indian or Alaska Native (0.3%), 4 Native Hawaiian or Other Pacific Islander (0.4%) with 13 (1.2%) not further characterized.
The average Movement Disorder MoCA score was 24.3/30 (4.0), which is significantly lower than EHBS participants (p < .0001), Cohen’s d = 0.92). The average age was 66.8 years (SD = 10.5), ranging from 20.9 to 88.5, which did not differ significantly from EHBS participants (p = .180, Cohen’s d = 0.09). Movement Disorder education ranged from 8-20 years (M = 15.4, SD = 2.5) which was significantly lower than healthy volunteers (p < .0001, Cohen’s d = 0.62). There were 73 women (32.7%) and 150 men (67.30%), which included 203 White (91.0%) patients, 13 Black (5.8%) patients, 1 Asian (0.4%), and 8 Asian Indian (2.7%) patients.
Complex Figure performance
Table 1 presents the mean performance scores for the EHBS and Movement Disorder groups, along with d-prime values for M&L Recognition. CF performance for M&L and Emory scoring approaches was analyzed using a 2 (group) × 2 (scoring approach) mixed-design ANOVA. The d-prime index is calculated as Z_HIT-Z_FA, where Z_HIT and Z_FA denote the inverse cumulative normal (i.e., z) values associated with the proportion correct on target items (i.e., hits) and the proportion incorrect on foil items (i.e., false alarms), respectively. As these Z values are infinitely high when the proportion of hits is 1 and infinitely low when the proportion of false alarms is 0, we followed convention in replacing such proportions by (n TARGET −.5)/n TARGET and .5/n FOIL respectively (Macmillan & Kaplan, Reference Macmillan and Kaplan1985), prior to calculating the Z values, where n TARGET = n FOIL = 12 for the M&L assessment.
Table 1. EHBS versus Movement disorder group differences
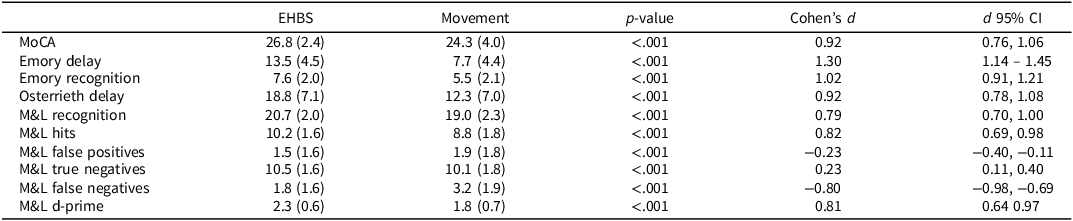
Note: By convention, d = 0.2 is considered a small effect, d = 0.5 a moderate effect, d = 0.8 a large effect, d ≥ 1.0 a very large effect.
When contrasting M&L and Emory CF performances, a statistically significant interaction effect was found for Recognition (p = .045), indicating differential group sensitivity, with an even stronger interaction effect observed for delayed CF free recall (p = .018). These interactions were further examined using simple main effects analyses contrasting group differences for each CF measure individually. As shown in Table 1, significant group differences were observed for both CF scoring methods, each associated with large effect sizes (Cohen’s d). The largest effect sizes were for Emory CF delayed free recall and Emory Recognition, both with Cohen’s d values greater than 1.0, indicative of very large group differences. Significant differences were also present for Osterrieth delayed free recall and M&L Recognition also showed significant group differences, though with smaller, yet still large, effect sizes. Using confidence intervals to compare effect sizes, the d-prime scoring of the M&L task also demonstrated statistically significant group discrimination, though the effect size was comparable to that obtained with traditional M&L scoring. Emory Delayed Recall produced a larger effect size than the MoCA, while no other statistically significant differences in group-level effect sizes were observed. Figure 1 displays empirical histograms of d-prime for the M&L task across the EHBS and Movement Disorder groups.
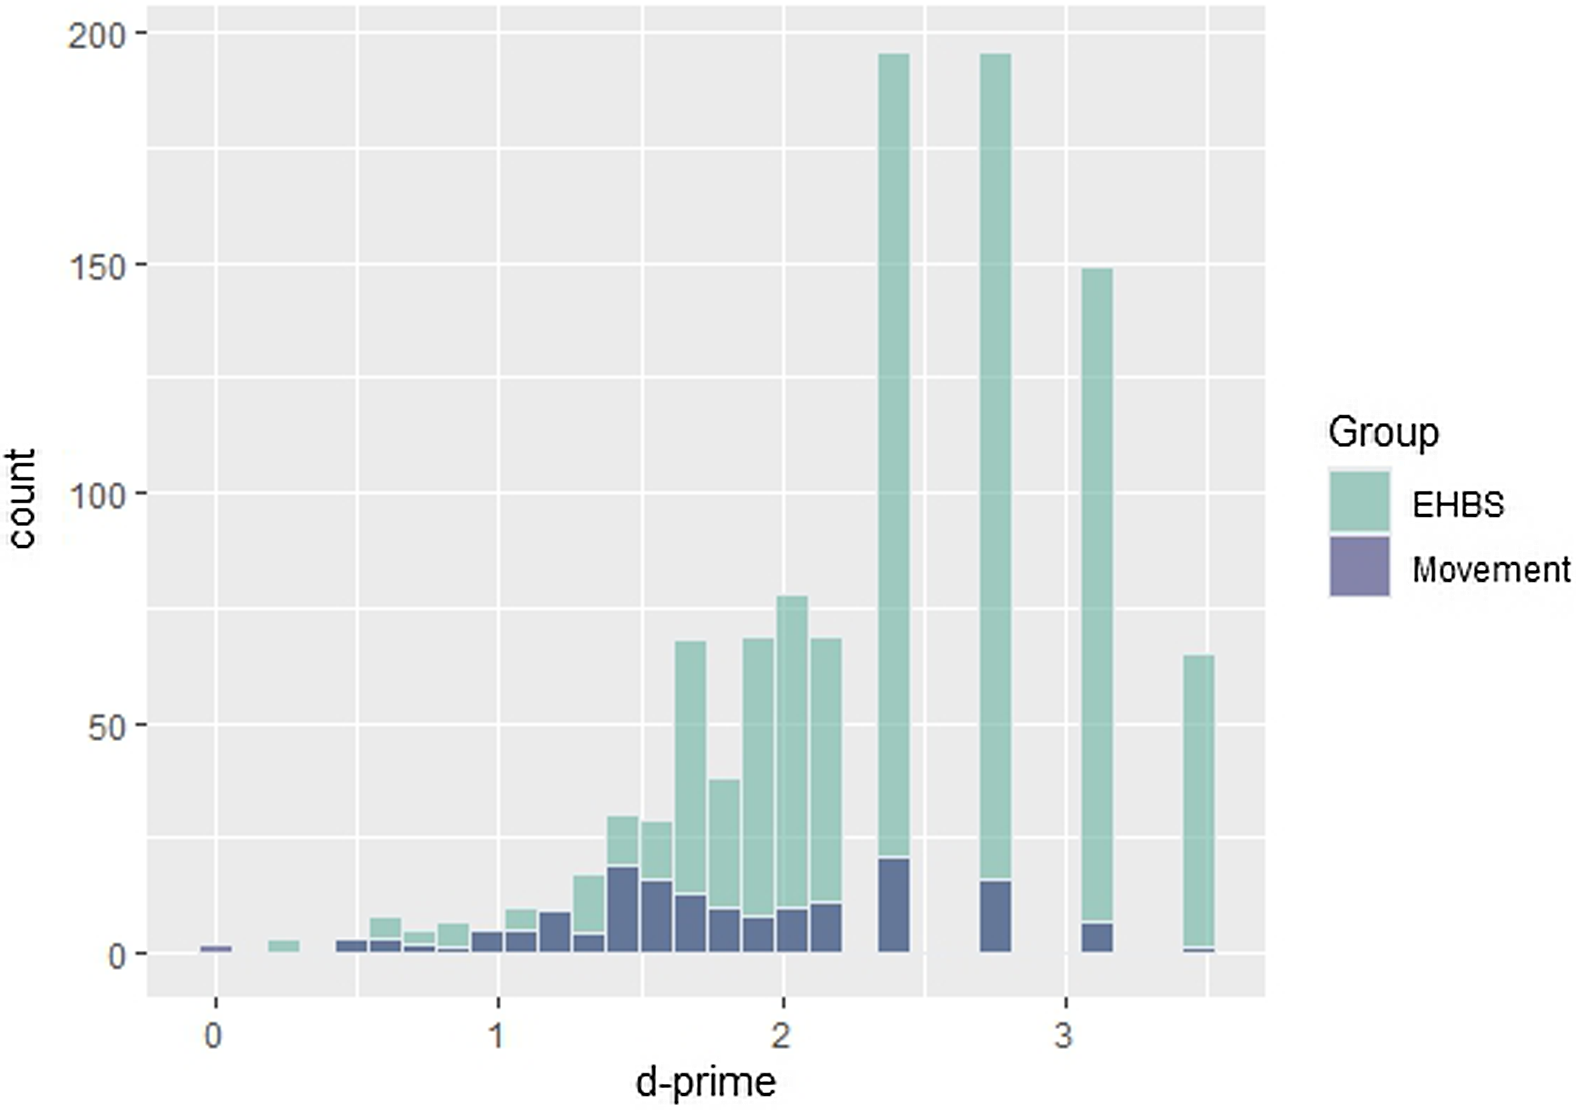
Figure 1. Histogram representing d-prime distribution of EHBS and movement disorder participants.
Group Prediction. Each recognition item’s contribution to group identification was analyzed independently for both recognition approaches using LR. Item discriminability was evaluated both through univariate analyses, which predict the significance of each item if entered as a sole predictor of group membership, and through multivariate logistic regression (MLR), where the functioning of individual items toward group prediction are evaluated in the simultaneous presence of all other items as predictors. Despite anticipated multicollinearity, the MLR analysis was viewed as a useful way of further contrasting measures according to the extent to which individual items provided incremental prediction in distinguishing groups. As shown in Table 2, all 10 Emory Recognition Elements are predicted to successfully distinguish group membership, with the Bowling Ball item exhibiting the highest anticipated individual discriminability. In contrast (Table 3), individual M&L CF Recognition score coefficients are more variable and often small, with many failing to reach statistical significance. Distractor elements from the Taylor figure exhibit the lowest values, and compared to the Emory Recognition Elements, M&L Target elements frequently have coefficients of smaller magnitude.
Table 2. Emory recognition item group discrimination including logistic regression analyses predicting group membership (Healthy volunteer vs. movement disorder)
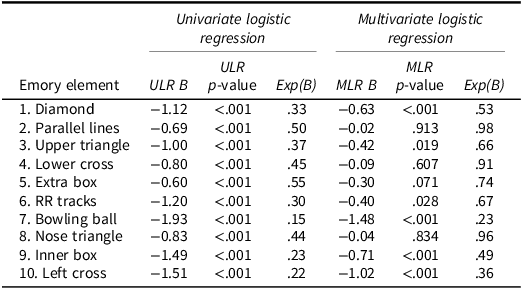
Note: The Univariate Logistic Regression coefficients correspond to a model with only the studied item as predictor of group (Healthy Volunteer = 0 vs. Movement Disorder = 1). The Multivariate Logistic Regression coefficients correspond to a model with all items as predictors (Cox & Snell R 2 = .161; Nagelkirke R 2 = .267). The regression coefficients (B) are evaluated for significance using z-tests.
Table 3. M&L recognition item discrimination using logistic regression analyses predicting group membership (Healthy volunteer versus movement disorder)
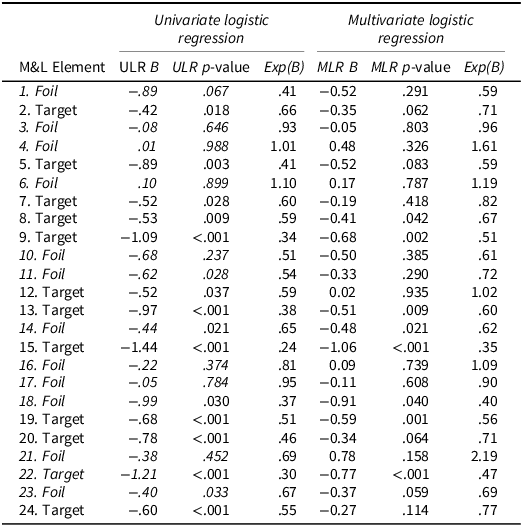
Note: The Univariate Logistic Regression coefficients correspond to a model with only the studied item as predictor of group (Healthy Volunteer = 0 vs. Movement Disorder = 1). The Multivariate Logistic Regression coefficients correspond to a model with all items as predictors (Cox & Snell R2 = .122; Nagelkirke R2 = .202). The regression coefficients (B) are evaluated for significance using z-tests.
A similar conclusion is reached from the MLR analysis. Although the ability to meaningfully isolate individual item predictive effects is likely affected by intercorrelations among items and thus multicollinearity, we use the MLR analysis as a means of evaluating the extent to which the entire collection of items is contributing to group differentiation. In this regard, nearly all Emory items remain significant contributors to predicting clinical status, whereas more elements for M&L Recognition are identified as nonsignificant (Tables 2 & 3). The effect sizes for the LR coefficients (exp(B)), which represent the change in relative odds of group membership given a correct versus incorrect response (i.e., a B value of 1 represents no effect), tend to be lower for Emory compared to M&L items, likewise suggesting greater discrimination from Emory items. Individuals who score correct on the items consistently have a lower odds of being in the movement disorder group relative to the EHBS control group. Collectively, the M&L elements provide less predictive accuracy (i.e, lower R2s) than the Emory items, despite there being more M&L items. These findings indicate that the Emory Recognition offers a more efficient approach to evaluating clinical status.
Measurement precision
To further evaluate the psychometric performance of CF items, we applied unidimensional two-parameter logistic (2PL) models using the multidimensional item response theory (mirt) package in R (Chalmers, Reference Chalmers2012). The 2PL provides descriptive information about item discrimination and difficulty against a latent unidimensional recognition proficiency as defined collectively by the items from each measure. The analyses also yield test information functions, providing quantifications of measurement precision (test information is inversely related to measurement error) in relation to the underlying construct (recognition proficiency, denoted as Theta; see Figure 2). For each recognition method, a two-group (EHBS Healthy Volunteer vs. Movement Disorder) model was specified such that the latent proficiency Theta is assigned a mean 0 and variance of 1 in the EHBS Healthy Volunteer group. This information function indicates how measurement precision (recognition proficiency/ Theta) varies across the proficiency continuum.
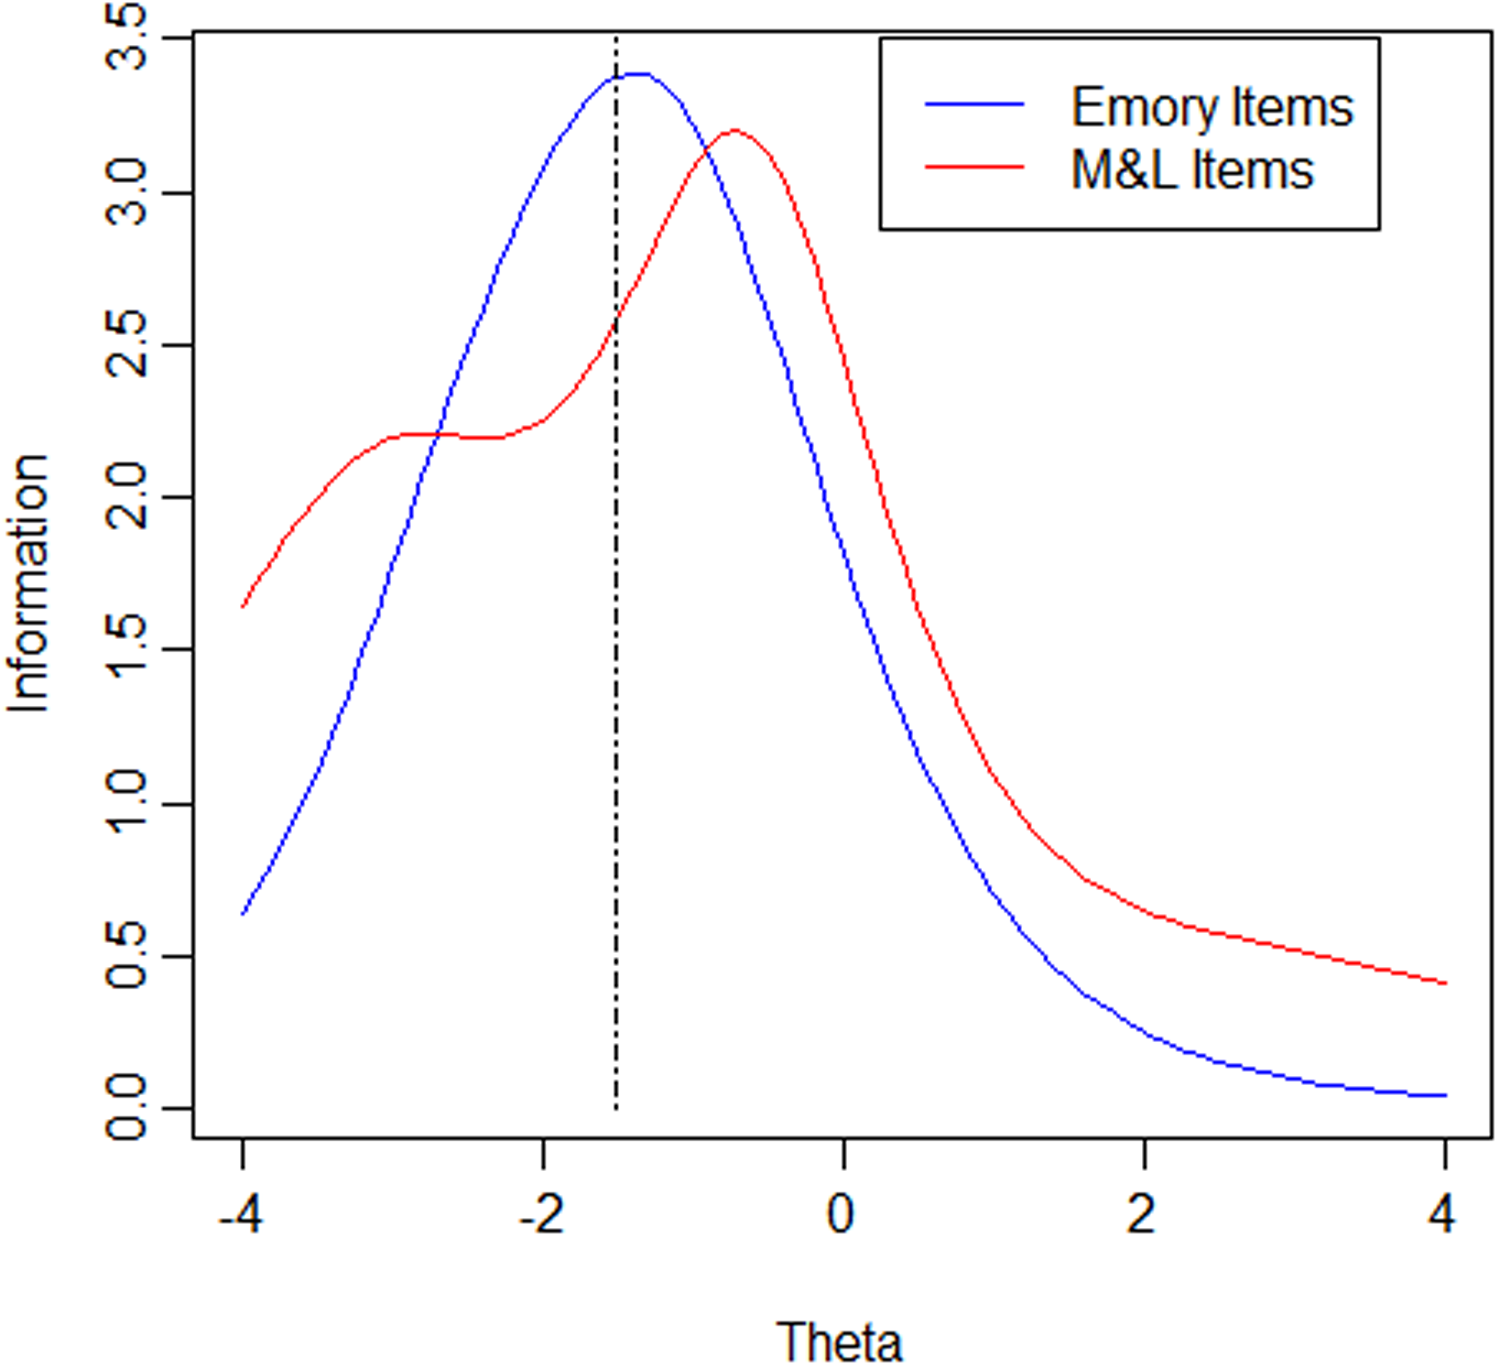
Figure 2. Comparison of test information functions. Note: test information functions showing measurement precision across levels of recognition proficiency (Theta). Theta reflects underlying recognition ability, scaled to have a mean of 0 and variance of 1 in the EHBS group. Higher curves indicate greater precision (lower measurement error) at that level of proficiency.
Item parameter estimates for the Emory and M&L items are shown in Tables 4 and 5, respectively. The 2PL model includes a Discrimination Parameter (a), which indicates how well an item discriminates different levels of recognition proficiency (greater more positive a indicates a greater sensitivity of the item to the latent proficiency, implying better measurement) and a Difficulty Parameter (b), the latent proficiency (Theta) level associated with a 50% probability of correctly answering the item (higher b values reflecting greater item difficulty). Due to the scaling of Theta mentioned above, items with larger more positive a’s and b’s close to −1.5 can be viewed as ideal given the goal of precise measurement at the cut point of classification (1.5 standard deviations below the mean).
Table 4. 2PL item parameter estimates for the emory items

Table 5. 2PL item parameter estimates for the M&L elements
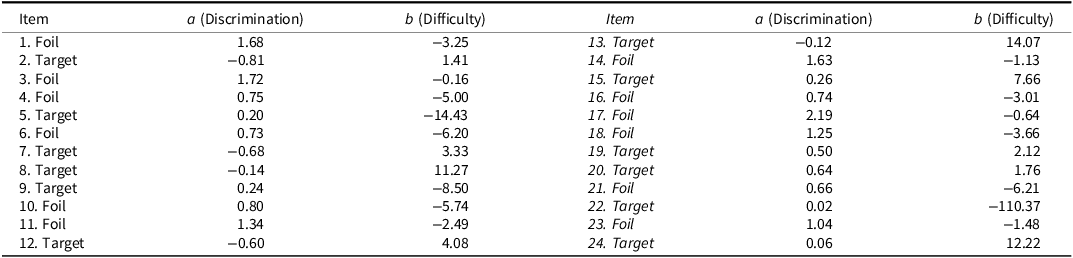
The 2PL item parameter estimates for the Emory Recognition items, presented in Table 4, indicate consistently positive discrimination parameters (a), generally large in magnitude, and difficulty parameters (b) clustered near −1.5. One slight exception is Emory Item 5 (Extra Box), although its a is still positive. By contrast, the M&L items frequently show items with a’s close to, and in many instances below, 0, suggesting a number of the items are not functioning well in measuring a common underlying latent proficiency. More commonly it is the target items that appear to be functioning poorly, suggesting a latent dimension more closely associated with successful performance on the foil items. While the b’s are also quite variable, their interpretation is complicated by the low item a’s.
Figure 1 displays the test information functions associated with the IRT analyses above. In addition to the two analyses above, the figure also shows the estimated test information when an IRT analysis is applied to only the Target M&L items. While the underlying proficiencies associated with each IRT analysis are likely not the same, we draw each function against a common Theta metric to illustrate differences in the psychometric functioning of the instruments.
Emory Recognition demonstrates greater information than M&L Recognition at lower proficiency levels and, importantly, maximizes its information near proficiency levels critical for diagnosis (e.g., −1.5 SD, equivalent to Theta = −1.5). In contrast, the M&L Recognition scale provides considerably less information at the lower end of the proficiency spectrum, with its peak information occurring at higher proficiency levels. This distinction underscores the Emory Recognition’s potential for more effectively identifying respondents above or below the diagnostic threshold. Furthermore, despite its significantly shorter length (10 items compared to 24), the Emory scale delivers greater information at its point of maximum precision than M&L Recognition.
Factor analysis
To better understand the poorer discrimination of M&L items, a multidimensional IRT analysis, also referred to as an item factor analysis, was conducted. Standardized Root Mean Square Residual (SRMR) reflects the average difference between the observed and model-implied correlation matrices, indicating how well the latent factor structure explains the relationships among items. SRMR values range from 0 to 1, with lower values indicating better fit ( ≤ 0.05 very good model fit, SRMR 0.05 – 0.08 suggests acceptable fit, and SRMR >0.08 indicates a poor model fit). A single unidimensional factor model resulted in a poor fit for M&L Recognition items (SRMR = .14), with Emory Recognition items demonstrating a good model fit (SRMR = .04). The primary cause of the multidimensionality in M&L Recognition appears due to dimensional distinctions between correct target recognition and correct foil rejections.
We next performed a two-factor IRT model assigning targets and foils items to separate factors. This model demonstrated improved fit for the M&L items (SRMR = .09). Despite improved model fit, the model continues to be a poor fitting model (i.e., SRMR >0.08) but helps confirm the target/foil distinction as a primary cause of the multidimensionality. Table 6 displays the resulting coefficients for this model, where a1 represents item discrimination in relation to the first latent trait (i.e., target proficiency), with higher values indicating that the item is more effective at differentiating between individuals at different target proficiency levels. Similarly, a2 represents the item discrimination in relation to the second latent trait (i.e., foil proficiency), while d reflects item difficulty, scaled such that larger, more positive values indicate easier items. When the M&L items are separated this way, all items exhibit positive discrimination on their respective proficiencies. However, the correlation between dimensions (r = −0.31) is negative, suggesting that individuals who perform well on target item identification tend to perform worse on rejecting foil items, and vise versa. In other words, those with high proficiency in correctly identifying target items are also more likely to mistakenly classify a foil item as part of the CF. This multidimensionality undoubtedly played a primary role in the poorer item performance seen for the M&L items in the unidimensional IRT analysis.
Table 6. Item parameter estimates from confirmatory two-dimensional IRT model of M&L elements
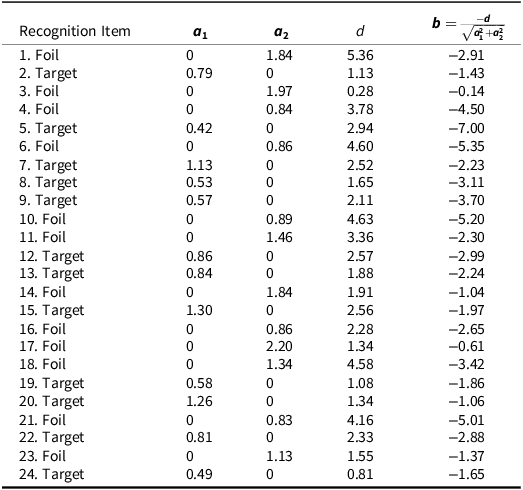
Note: Item parameters from the 2PL-2D model: a1 indicates discrimination along the target proficiency dimension (higher values = better differentiation by proficiency); a1 reflects discrimination on the foil proficiency dimension; d denotes multidimensional item difficulty, with larger positive values indicating easier items. Because each item measures only one latent proficiency, item difficulty can also be reported using the b parameter of traditional unidimensional IRT.
This pattern suggests the presence of a response set (Cronbach, Reference Cronbach1950) to the M&L items in which respondents appear disproportionately prone toward either yes or no responses regardless of the target/foil distinction. The effect appears so strong that better performance on the target proficiency dimension is actually associated with poorer performance on the foil proficiency dimension. Such a response set interpretation would also explain the poor item performance seen for many of the M&L items in both the earlier LR and 2PL IRT analyses.
Discussion
The Emory CF recognition task demonstrates better group discrimination between cognitively healthy volunteers and patients with various movement disorders compared to the popular M&L Recognition task. Applying d-prime analysis of hits and false-positive recognition to M&L recognition did not meaningfully improve group discrimination. Importantly, when examined across all study participants, Emory CF Recognition demonstrates better psychometric properties, particularly in measuring lower cognitive proficiency levels. Emory CF Recognition’s superior group discrimination is attributed to its improved item discrimination and unidimensionality compared to the M&L test, which suffers from multidimensionality and less sensitivity at lower proficiency levels.
Larger group effects sizes were present for delayed CF recall using each scoring approach compared to their associated CF recognition performances. This pattern reflects a common memory retrieval deficit seen in movement disorders, which is characteristic of a “subcortical” cognitive profile. Individuals with this profile typically show impaired free recall but demonstrate significant improvement when recognition-based memory tasks are used. Such a discrepancy suggests that the primary issue lies in memory retrieval, rather than in encoding or storage, consistent with the known cognitive effects of subcortical dysfunction.
There is a clear empirical statistical distinction between performance on targets and foils in M&L Recognition. The negative relationship observed between the underlying dimensions of these item sets strongly suggests response set heterogeneity. This may arise from differences in prior beliefs about the proportion of targets versus foils in the assessment or from variations in response thresholds based on confidence in identifying an item as a target. Alternatively, it may reflect response bias related to confidence when identifying whether an element was present in the figure or not. In yes-no recognition memory testing, response set bias can influence the likelihood of identifying an element as being a target. This bias may stem from individual differences in response tendencies, such as a general inclination to endorse items as previously seen or, conversely, a more conservative approach that limits affirmative responses. Such biases can distort recognition performance by affecting hit and false alarm rates in parallel, making it difficult to distinguish genuine memory ability from response tendencies. Thus, response set bias can impact the overall reliability of recognition assessments by introducing systematic variability unrelated to true memory performance. Regardless of the underlying cause, this distinction appears to hinder M&L Recognition to provide a singular measure of recognition proficiency. We consider it likely that the 4-choice recognition helps address this concern regarding false positives in recognition memory and provides a more homogeneous measure of recognition memory.
Performance on recognition memory tasks can be influenced by factors unrelated to the construct being assessed. Cronbach (Cronbach, Reference Cronbach1950) highlighted how individual response sets and response biases can affect tests, potentially decreasing the validity of the assessment. In recognition memory tasks, factors such as confidence in response accuracy, expectations about the proportion of correct versus incorrect responses, and the saliency of correct versus incorrect elements may shape performance. Additionally, clinical factors such as impaired executive function can increase the likelihood of false-positive responses, particularly in yes/no recognition designs, further influencing likelihood of item selection. Response set bias may influence differences in recognition test formats, particularly regarding confidence thresholds when determining whether an item has been previously encountered in yes-no or true-false formats. Cronbach suggests that multiple-choice formats are less prone to response set bias, as they require a response for every item. This approach also helps minimize intrusion errors.
The M&L approach in combining hits and true negatives into a single memory score assumes that false positives reflect impaired memory function, although false-positive errors in recognition memory testing are also often linked to executive function difficulties. As a result, combining both scores may underestimate memory in individuals whose actual recognition memory is intact but whose executive impairments distort their performance, and decreased executive function is associated across a variety of movement disorder diagnoses. This conflation of executive and memory deficits complicates clinical interpretation, highlighting the need for independent response characterization.
Signal detection theory, and specifically the use of d-prime, has been proposed as a valuable method for characterizing recognition memory performance. A meta-analysis of recognition memory in schizophrenia found that d-prime produced more informative effect sizes than traditional accuracy metrics alone (Pelletier et al., Reference Pelletier, Achim, Montoya, Lal and Lepage2005). In the present study, d-prime analysis of M&L Recognition data effectively differentiated group membership; however, the observed effect size (Cohen’s d = 0.81) was not larger than that obtained using the traditional M&L scoring method, which combines correct target identifications and correct foil rejections (Cohen’s d = 0.82). These findings suggest that, at least for this AVLT-based recognition measure, d-prime analysis does not appear to provide incremental benefit over conventional scoring.
It is important to recognize that the type of bias revealed in our MIRT analysis, and that we frame in relation to response sets, is commonly observed in recognition task measures. MIRT models can also be formulated to explicitly capture multidimensionality in terms of latent d-prime and bias dimensions, effectively representing a rotation of the MIRT solution we examined. The interested reader is referred to Thomas et al. (Reference Thomas, Brown, Gur, Moore, Patt, Risbrough and Baker2018) and DeCarlo (Reference DeCarlo2011) for illustration. One advantage of such models is their potential to clarify how items may differentially reflect sensitivity to d-prime bias. As our goal was primarily one of understanding the poorer performance of M&L in relation to Emory Recognition under traditional forms of scoring, we did not pursue such an analysis here, but recognize its value, especially if d-prime were applied in routine scoring of the M&L clinical assessment.
M&L item discrimination estimates (a’s) are frequently near 0, indicating an item is not discriminating with respect to a unidimensional latent proficiency. Such items contribute little to IRT information, thus explaining why overall test information is not greater for M&L. Also apparent is the tendency for a large number of items with greater a’s to have b’s above 0 (implying more difficult items). This indicates that many of the M&L items are of high difficulty even for a normal proficiency population, making the scale less useful in measuring individuals with low levels of proficiency.
In conclusion, both CF recognition measures effectively distinguished between groups, but the Emory CF Recognition demonstrated a larger effect size than the M&L Recognition, even when the latter was scored using signal detection theory to account for hits and false positives, surpassing the MoCA as well. Despite its shorter length, the Emory Recognition measure showed superior psychometric properties, particularly in its precision and unidimensionality at lower levels of cognitive functioning. These qualities make it a more effective tool for diagnostic use, especially in populations with cognitive impairment.
Supplementary material
For supplementary materials referred to in this article, please visit https://doi.org/10.1017/S135561772510115X
Acknowledgments
This research was supported by funding from the National Institute of Aging (Emory Healthy Brain Study: R01-AG070937, J.J. Lah, M.D., Ph.D. Principal Investigator).
The authors have no competing interests or conflicts of interest to report.
A preliminary version of the report was presented at the 2025 Meeting of the International Neuropsychological Society, New Orleans, Louisiana, February 13, 2025.
Norms for Emory Complex Figure System and Recognition Task are available at https://med.emory.edu/departments/neurology/_documents/emory_cf_scaled_score_norms.pdf.


 Open access