


Introduction
In the 2010 South Carolina gubernatorial election, Republican state representative Nikki Haley defeated Democratic state senator Vincent Sheheen by 4.4 percentage points. This outcome was notable for two reasons. First, the 2010 midterms were the most pro-Republican election cycle in a generation. Pre-election polls indicated that Haley would win by approximately 11 percentage points, in line with Haley’s scandal-embattled predecessor, Republican Governor Mark Sanford, who had won his 2006 re-election by 10.4 percentage points. Second, Haley’s support across the state varied noticeably from her predecessor; she lost several reliably Republican rural and coastal counties, but far outperformed Sanford’s vote shares in western South Carolina.
On the other side of the country in New Mexico, Republican gubernatorial candidate Susana Martinez comfortably defeated Democratic lieutenant governor Diane Denish, 53%–47%. Her win reversed a Democratic landslide in 2006 and did not notably differ from previous Republican wins in the state.Footnote 1
This dramatic discrepancy in support for two women candidates from the same party in the same election cycle begs the question: How does the local context – which we define as the political, cultural, and socioeconomic environment of a geographic area – affect the representation of women? Previous research suggests that voters in some areas may be more “women friendly” (Pyeatt and Yanus Reference Pyeatt and Yanus2016b) or that there may be “female political subcultures” (Ladam, Harden, and Windett Reference Ladam, Harden and Windett2018), but these theories do not adequately account for the potential role of candidate characteristics such as race and partisanship. Such a theoretical framework might help to explain the success or failure of future women candidates, particularly as more diverse candidates emerge in both the Republican and Democratic parties.
In this article, we set out a theoretical argument and subsequent expectations of how context, party, and race attenuate the performance of women candidates for statewide executive office. We then use an original dataset to explore the county-level general election performance of 264 women who ran for executive office in American states during the 10-year period between 2010 and 2019; our dataset includes a broad range of thirty unique offices. Our exploration of the data provides a clear illustration of the differences between the parties in terms of the number of women and women of color running for statewide executive offices, with Democrats outpacing Republicans in both areas by significant margins. Our empirical models also reveal important differences by party in how context affects electoral outcomes. Republican women gain far less from women-friendly contexts than Democratic women, particularly Democratic women of color.
These findings pose important questions for future scholarly analyses of recruitment, representation, and identity in American politics. Our findings also suggest incentives for strategic candidate entry and pose questions, both empirical and practical, about how parties, can overcome context-dependent barriers and recruit a more diverse candidate pool (see, for instance, Karpowitz, Monson, and Preece Reference Karpowitz, Monson and Preece2017).
The state of the literature
It is important to situate statewide executive candidates in the existing scholarly debates over women as candidates. In this section, we articulate the state of women candidates for executive office, discuss the importance of studying these roles, and consider how gender and race may affect expectations about how political context affects statewide executive elections.
Women as statewide executives
Voters in the United States elect more than 300 statewide executives, including governors and lieutenant governors, secretaries of state, treasurers, and attorney generals. Voters in some states also elect other executive branch officials, including land, labor, and public utility commissioners. The average state elects between five and six statewide officials; this ranges from a low of one – the governor – in New Hampshire and Tennessee to a high of thirteen in North Dakota.
Executive branch officials often enjoy broad latitude to shape their state’s public policy in a way that is consistent with their – and their party’s –ideal issue positions, increase the salience of niche issues, and shape regulatory agendas on matters of great significance to state economies. For instance, the 2020 presidential election and its aftermath illustrated in a dramatic way how critical lesser-known statewide officeholders – particularly secretaries of state – could be in the functioning of democracy (Mongtomery Reference Mongtomery2022). Moreover, running for and serving in an executive office can also be an important step in a progressively ambitious candidate’s political career, building name recognition and support, particularly among party elites, donors, and the politically engaged (Schlesinger Reference Schlesinger1966).
In 2024, 99 women held elected statewide office, constituting roughly one-third of the available positions (Center for American Women and Politics 2024).Footnote 2 Of these women, more than half were Democrats and roughly 20% were women of color. Twelve women served as governor, and 22 served as lieutenant governor. Further, twelve women served as secretary of state and attorney general, seven as treasurer, and nine as auditor. Finally, of thirteen states that elect their chief education official, seven were women.Footnote 3 These patterns are consistent with previous research showing that women are more likely to run for and win election to offices consistent with sex roles, traits, and issue stereotypes (Fox and Oxley Reference Fox and Oxley2003).
Women as candidates
Several existing studies examine the process of nominating women gubernatorial candidates (e.g., Windett Reference Windett2014), but a much more substantial body of research has documented the barriers women candidates face for nomination to legislative offices. Potential women candidates are more risk averse (Kanthak and Woon Reference Kanthak and Woon2015) and more likely than their male counterparts to underestimate their qualifications (Fox and Lawless Reference Fox and Lawless2010). Moreover, party elites have historically been reluctant to identify women as potential candidates (Crowder-Meyer Reference Crowder-Meyer2013; Sanbonmatsu Reference Sanbonmatsu2010) or have only chosen them as “sacrificial lambs” in uncompetitive elections (Canon Reference Canon1993; Stambough and O’Regan Reference Stambough and O’Regan2007). These barriers may be especially significant for Republican women; historically, far more women have been recruited and run (and, by extension, won) as Democrats than Republicans (Karpowitz, Monson, and Preece Reference Karpowitz, Monson and Preece2017; Kitchens and Swers Reference Kitchens and Swers2016; Och and Shames Reference Och and Shames2018; Thomsen Reference Thomsen2015; Thomsen and Swers Reference Thomsen and Swers2017).
After receiving their party’s nomination, women candidates must win voters’ support in the general election. Women’s probability of electoral success hinges heavily on voters’ perceptions, as well as political and social context. With respect to contextual factors, numerous studies have demonstrated that women – including gubernatorial candidates – are more likely to run and win in female political subcultures or areas with a history of electing women that share a set of sociodemographic characteristics, including liberalism, urbanization, and education (Ladam, Harden, and Windett Reference Ladam, Harden and Windett2018; Smith, Reingold, and Owens Reference Smith, Reingold and Owens2012; Silva and Skulley Reference Silva and Skulley2019). Other studies of state and national legislative politics underscore the importance of women-friendly districts (Palmer and Simon Reference Palmer and Simon2012; Pyeatt and Yanus Reference Pyeatt and Yanus2016a) and other contextual factors, particularly religiosity, for the emergence and success of female candidates (Merolla, Schroedel, and Holman Reference Merolla, Schroedel and Holman2007; Pyeatt and Yanus Reference Pyeatt and Yanus2020; Setzler Reference Setzler2016; Vandenbosch Reference Vandenbosch1996).
There is a scholarly consensus, both in the gender and politics literature and elsewhere, that contextual effects become entrenched over time and are internalized by voters. They can be attenuated by a party’s relative national support and the personal attributes of the candidate. A woman candidate’s probability of victory in an election for statewide executive office is, therefore, affected by both how receptive its voters are to women as civic leaders – the women friendliness of the electorate – and their party identification (Carey and Shugart Reference Carey and Shugart1995). If a woman candidate is strategic, she will employ the relatively more beneficial of the pair: If the context is women friendly but the party is unpopular, she will elevate her personal attributes, but if the context is unfriendly and the party is popular, she will tether her candidacy to the party. The general election vote is therefore influenced by the interchange of these factors.
Race and elections
Context and party may also be attenuated by another immutable characteristic: a candidate’s racial or ethnic identity. Many of the variables that have been shown to affect the emergence and success of female candidates also have similar, significant effects on candidates of color. Barriers to nomination, voters’ perceptions, and institutional arrangements are among the most significant predictors of non-white candidates’ success. Representation of non-white Americans, like representation of women, is also strongly affected by elite decision-making, especially in terms of candidate entry. Like women, potential Black candidates are less likely to consider running for office than their non-white peers (Fox and Lawless Reference Fox and Lawless2005; Moore Reference Moore2005). Minority candidates may also face greater barriers in fundraising and receiving endorsements from elected officials (Ocampo and Ray Reference Ocampo and Ray2020).
Political context also affects non-white candidates’ emergence and success. In particular, the most important predictor of Black and Hispanic candidate entry may be the size of the population of Black or Hispanic voters in their constituency (Doherty, Dowling, and Miller Reference Doherty, Dowling and Miller2019; Juenke and Shah Reference Juenke and Shah2015; Shah Reference Shah2014). The racial and ethnic diversity of the electorate may also be an important factor (Bejarano Reference Bejarano2013). Non-white candidates often struggle to be elected outside of majority–minority districts (Barker, Jones, and Tate Reference Barker, Jones and Tate1999; Canon and Posner Reference Canon and Posner1999; Walton, Smith, and Wallace Reference Walton, Smith and Wallace2020). Voters from areas with more traditionalistic political cultures may also be more reluctant to support non-white candidates (McDermott Reference McDermott1998).
Additionally, some white voters may have implicit biases or unrevealed motivations for voting against Black or Hispanic candidates, leading to those candidates underperforming in heavily white areas, even places that are otherwise quite liberal (Berinsky Reference Berinsky1999; McDermott Reference McDermott1998; Sigelman et al. Reference Sigelman, Sigelman, Walkosz and Nitz1995). These effects may be neutralized by partisanship; in a polarized political climate, voters tend to support candidates who share their party affiliation regardless of other sociodemographic considerations (Bejarano Reference Bejarano2013; Highton Reference Highton2004; Tate Reference Tate2018; Tesler and Sears Reference Tesler and Sears2010). The observable implication is that Black and Hispanic candidates may underperform in heavily white areas historically dominated by the opposite party.
In summary, these literatures suggest that political context, partisanship, and candidate identity are critical to understanding women’s and non-white candidates’ performance. We go one step further to argue that they are interactive: Democratic women candidates should benefit from political context to a much larger extent than Republican candidates. Similarly, non-white women candidates should benefit from the political context more than white women.
Hypotheses
Our initial exploration of this novel dataset of women candidates for statewide executive office in general election contests from 2010 to 2019 allows us to formulate several tentative hypotheses. Though we build on previous work on female candidacies and electoral outcomes, analyses of women statewide executives (particularly outside the governor’s office) are somewhat limited. For this reason, a major aim of the present analysis is simply to understand more about the types of women who run for these positions, particularly with respect to their party and racial and ethnic identity, as well as where they do and do not run for office.Footnote 4 We then explore the interaction between political context, party, and race to examine how these characteristics affect candidate success. We posit several baseline hypotheses for these preliminary empirical tests.
First, we expect that women candidates who win their party’s nomination will perform better electorally in more women-friendly areas. We expect to observe this relationship whether the candidate is successful or unsuccessful in the general election. Thus, we posit:
H1: Women candidates for statewide executive office will win a larger share of the general election vote in more women-friendly counties, holding statewide results constant.
Second, given the demographic bases of the parties – including growing divides between the parties by community type, age, and education – we also expect that the effect of women friendliness will be stronger among Democratic than Republican women.Footnote 5 Specifically, we propose:
H2: As a county becomes more women friendly, Democratic women candidates for statewide executive office will see their vote share increase at a faster rate than Republican women candidates.
Finally, we posit that these relationships will also be affected by women candidates’ racial and ethnic identities. Specifically, we expect that non-white women will perform better than their white co-partisans in the most women-friendly areas. Conversely, we expect non-white women will perform worse than their white co-partisans in the least women-friendly areas:Footnote 6
H3: Regardless of partisanship, as county women friendliness increases, non-white women candidates for statewide executive office will see their vote share increase faster than white women candidates.
Figure 1 visualizes our predicted effects.Footnote 7 We expect women statewide executive candidates of both parties to perform better in more women-friendly contexts. However, we expect Democratic women to outperform Republican women across the range of women friendliness. Within the party, we expect non-white women candidates to underperform compared to white women at lower levels of women friendliness and to overperform compared to white women at higher levels of women friendliness. Our expectation thus can be seen as an intercept shift by party and an interaction effect between race and context.
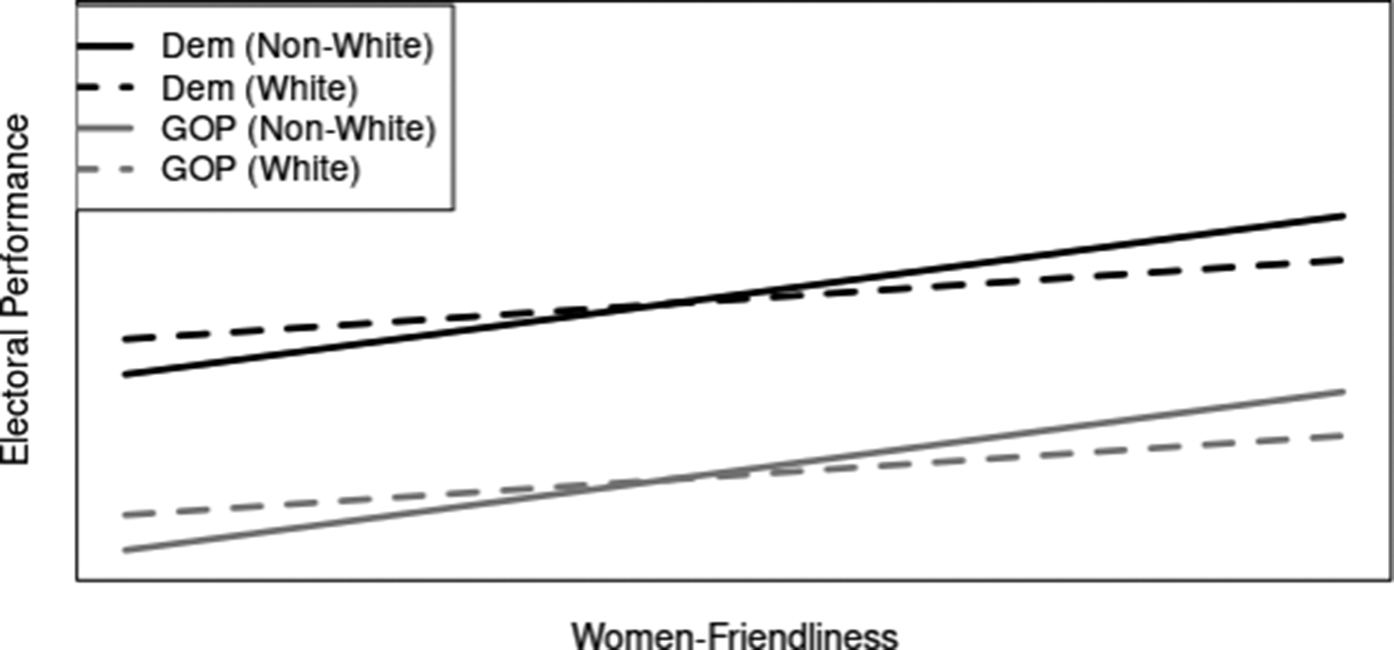
Figure 1. Visual demonstration of hypotheses.
Though our analysis represents a significant advancement in researchers’ knowledge about women candidates for statewide executive office, it has an important limitation: it only allows us to study women who ran for office in the general election. This constrains both the number and variety of women candidates we can observe, as well as where they run for office. This is a limitation as we know candidate entry and recruitment are nonrandom and driven by a series of idiosyncratic factors, including candidate motivations and the perceptions of the electorate (e.g., Crowder-Meyer Reference Crowder-Meyer2013; Niven Reference Niven1998). To consider how these factors affect the relationship between context, party, and race, we use two methods: matching as preprocessing (which allows us to compare different types of candidates across similar contexts) and subsetting the data to “competitive” and “safe” states. These analytical methods allow us to observe whether the hypothesized relationships between context, party, and race persist when we hold candidate entry decisions constant or whether the contextual and candidate effects observed by other scholars and expected here are attributable, in whole or in part, to strategic candidate recruitment and entry.
Data and descriptive statistics
As noted above, little is known about many statewide executive offices in the United States – or the women candidates who run for them. Beyond this, statewide executive offices also provide an interesting test for a deeper exploration of the interaction between context, party, and race. Unlike legislators vying for carefully drawn districts, state executives are expected to compete for the entire electorate. Yet, many of these contests are low salience, where voters rely heavily on perceptions and heuristic cues to help them make decisions at the ballot box. Finally, many statewide executive offices are perceived to be “masculine” and may pose additional barriers for women who contest those offices (Norris Reference Norris2010).
Thus, we test our expectations on a novel database of all 264 women candidates running in 330 general elections for statewide executive office from 2010 to 2019. This decade was chosen as it was a period of high partisan competition and an increasing number of women of color sought statewide office. The only female candidates we exclude are women who ran for lieutenant governor on a combined ticket with the governor (i.e., each voter casts a single vote for both offices). As we want to hold candidate gender constant, we do not consider the performance of men running for statewide office.Footnote 8
The unit of analysis is the county-election, producing a dataset of 22,174 observations. The most important reason why we measure context at the county level is because it provides a more precise measure of the context where voters live, work, and are socialized. We choose counties rather than congressional or legislative districts because they are fixed administrative boundaries rather than malleable political boundaries. But they are generally larger and more diverse than cities, towns, municipalities, census blocs, or precincts. Most observations (77%) are concentrated in the midterm election cycles of 2010, 2014, and 2018. Slightly under 10% (2,209) of observations represent gubernatorial candidates, and approximately 37% (8,113) represent the inner cabinet posts of attorney general, lieutenant governor, secretary of agriculture, and secretary of state. In total, 30 unique cabinet offices, including auditors, commissioners, comptrollers, and superintendents are represented in the dataset.
We illustrate the geographic distribution of our data in Figure 2. As illustrated in the figure, only four states – Virginia, Tennessee, Louisiana, and Utah – had zero women candidates for statewide executive office from 2010 to 2019. On the other extreme, Georgia (14 candidates), Oklahoma (13), Alabama (11), Idaho (11) – all have many candidates in our dataset. Thirteen states have six women candidates for statewide executive office: The mean (5.91), median (6), and mode (6) of the count of candidates variable reflects this clustering.Footnote 9 Yet, this obscures substantial disparities by race and party. Republican women candidates did not appear on any general election ballot in 11 states and non-white women of both parties did not run in general elections in 21 states.
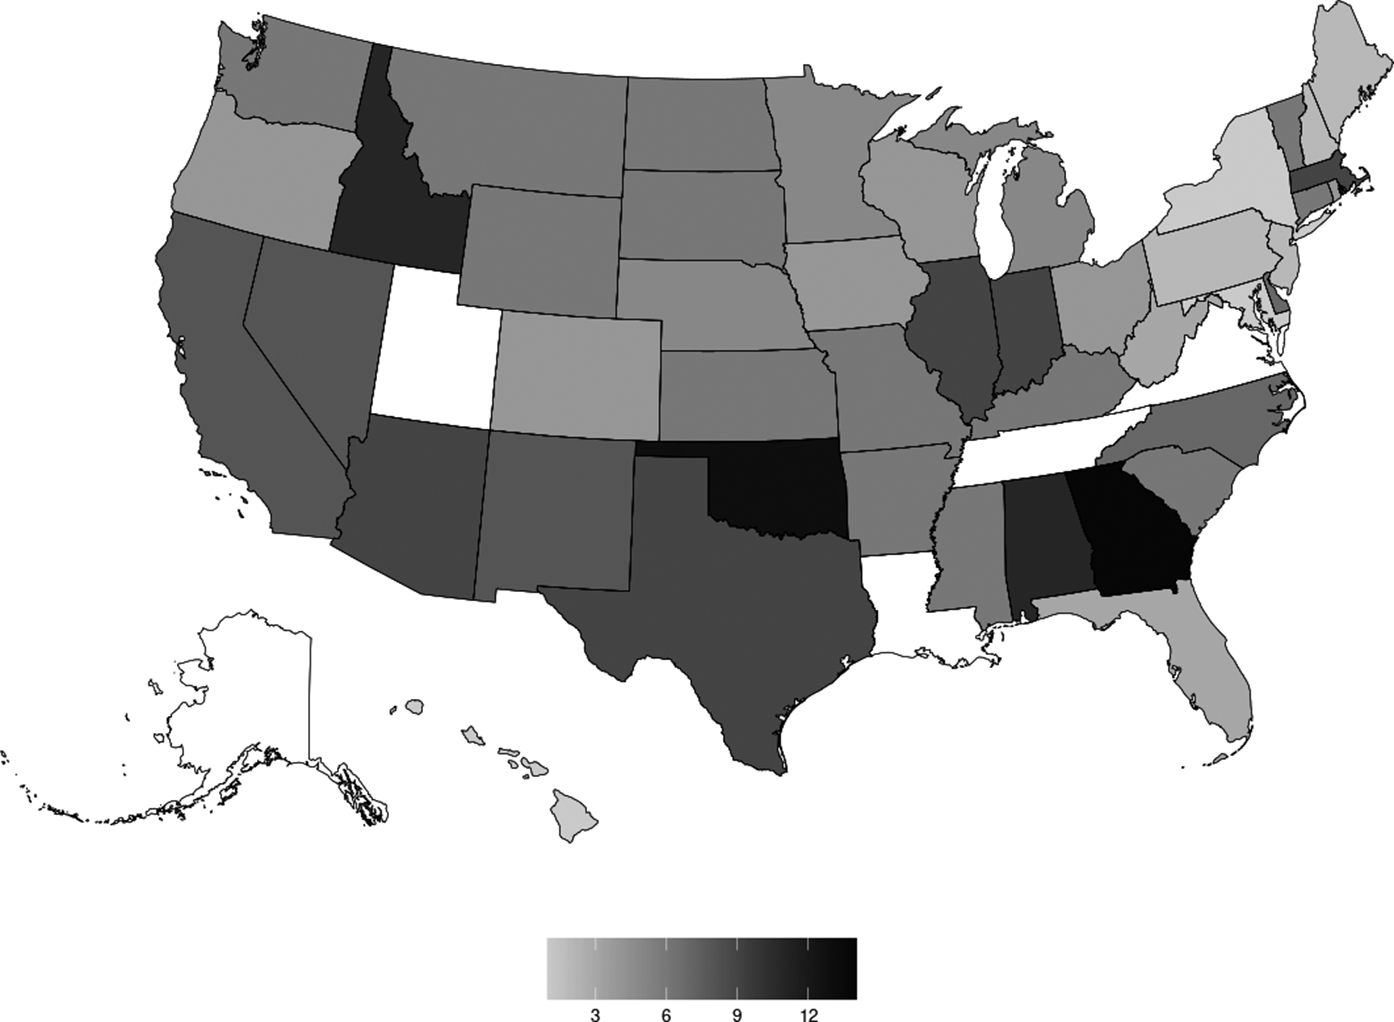
Figure 2. Number of women candidates for statewide office by state, 2010–2019.
Note: Darker colors refer to more women candidates; four states (VA, TN, LA, UT) had no women statewide executive candidates between 2010 and 2019.
Dependent variable
We seek to explain variations in women candidates’ performance as a result of the social and political context of a county. Therefore, our outcome variable is a woman candidates’ vote share at the county level with moments μ = 45.2, σ = 19.9 continuous from 1.1 to 100. County-level vote totals were gathered from state Boards of Elections or Secretaries of State websites. While a few states offered county vote totals by office in a single downloadable file, in most cases these data were collected and assembled by the authors.
As shown in Figure 3, there are clear variations in candidate performance within states and by county. For example, women candidates generally did poorly in Georgia, but there is a clear geographic pattern with women candidates doing better in and around Atlanta and in the southeast part of the state. This intrastate variation illustrates the need to study the phenomenon in a smaller geographic unit than the state. Not illustrated in the figure, but also worthy of note, non-white women candidates performed best in the Southwest, parts of Montana and South Dakota, and along the East Coast, but performed worse than white women candidates in the Midwest and the Southeast.Footnote 10 Looking at partisanship but not race, Democratic women perform best in the West, the Southwest, and in isolated pockets of the East. Republican woman candidates perform the best in the Mountain West and the rural Midwest (especially Wyoming and Kansas).
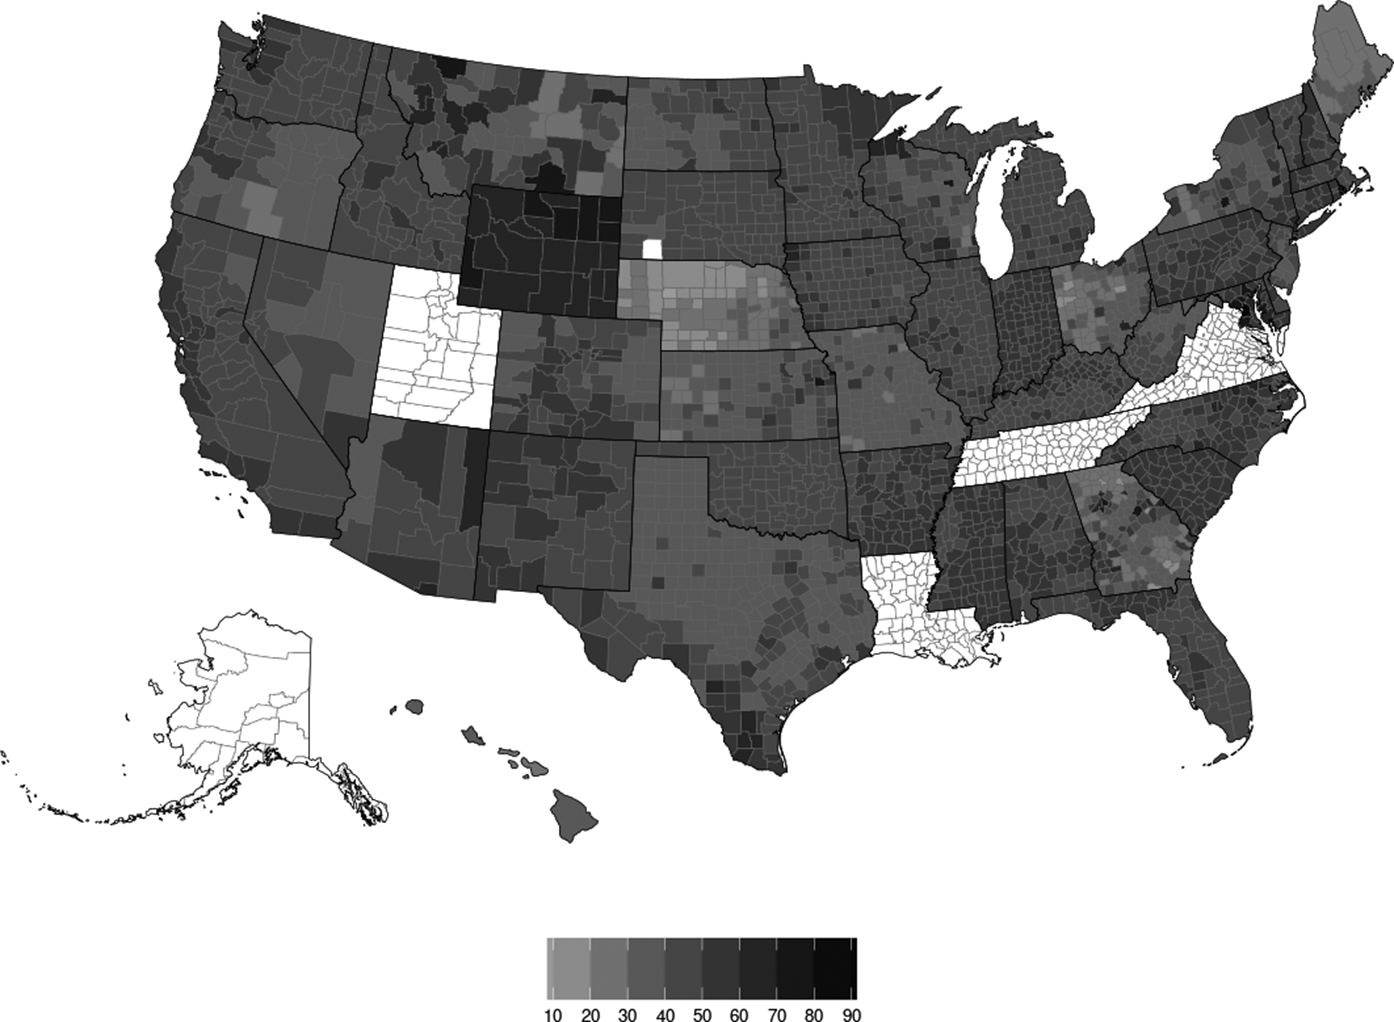
Figure 3. Vote share of women candidates for statewide executive office by county, 2010–2019.
Note: Darker colors refer to higher mean candidate vote share; four states (VA, TN, LA, UT) had no women statewide executive candidates between 2010 and 2019.
Predictor variables
Our individual-level predictor variables capture party, race and ethnicity, and political context. Information on women candidates’ parties and race and ethnicity was obtained from the candidates’ campaign or elected official websites or candidate-information services such as Project Vote Smart or the Center for American Women and Politics.
As shown in Table 1, our data yield a total of 173 Democrats (70%) and 91 Republicans. This breakdown is comparable to the partisan breakdown of both congressional and state legislative nominees in 2020 (Center for American Women and Politics 2021). That year, there were 298 women nominees for the House – 204 Democrats (68.5%) and 94 Republicans. At the state legislative level, there were 3,446 women candidates for state legislative seats, 2,315 Democrats (67.2%), and 1,105 Republicans.
Table 1. Summary statistics of women candidates by party and race
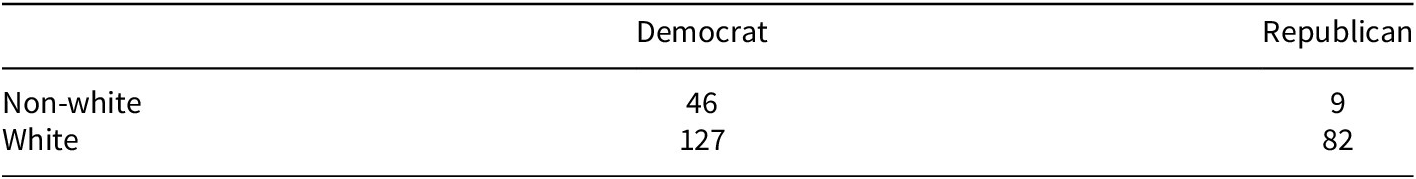
Data shown in Table 1 also reveals that 209 women statewide executive candidates were white (85%), and 55 were members of other racial or ethnic groups. Among the non-white candidates, there were 29 Black candidates (12%), thirteen Latino/Hispanic candidates (5%), eight Asian American or Pacific Islander (AAPI) candidates (3%), and six candidates of another race (2%). Most non-white candidates (83%) were Democrats (27% of all Democratic candidates); just 10% of Republican candidates were non-white.
To measure political context, we collected county-level data from the Census Bureau. These data were used to create a women-friendliness index (WFI), an additive scale considering racial, socioeconomic, and cultural factors shown to predict voters’ willingness to support women candidates (Palmer and Simon Reference Palmer and Simon2012; Pyeatt and Yanus Reference Pyeatt and Yanus2017).Footnote 11
Three components of our index measure racial and ethnic diversity: percent Black, percent Hispanic, and percent foreign born. To explore socioeconomic status, we use four indicators: median income, percent college educated, percent blue collar, and percent under age 18. Finally, three measures account for culture: percent urban, median age, and percent married.
To calculate a score for each county, each of these ten measures was dichotomized to reflect above or below the national average such that a county that scored a “1” for a college degree had more college graduates than the national average. The dichotomized values were added together to create a score ranging from 0 to 10. Higher scores should be more positive for women candidates. In the present analysis, the average county scored a 4.9.Footnote 12
To get a clearer sense of the distribution of our predictor variables, we consider candidate vote shares across the range of WFI scores, subset by race and party. As expected, partisan and racial disparities are evident in these data. As shown in Figure 4, the modal Republican woman ran in a county with a WFI score of 4, while the modal Democratic woman ran in a county with a WFI score of 5. Moreover, at low levels of women friendliness, Republican women candidates appear to outperform Democratic women candidates by 25 percentage points. This advantage disappears at high levels of women friendliness; in these contexts, Democratic and Republican women candidates receive approximately the same vote share.
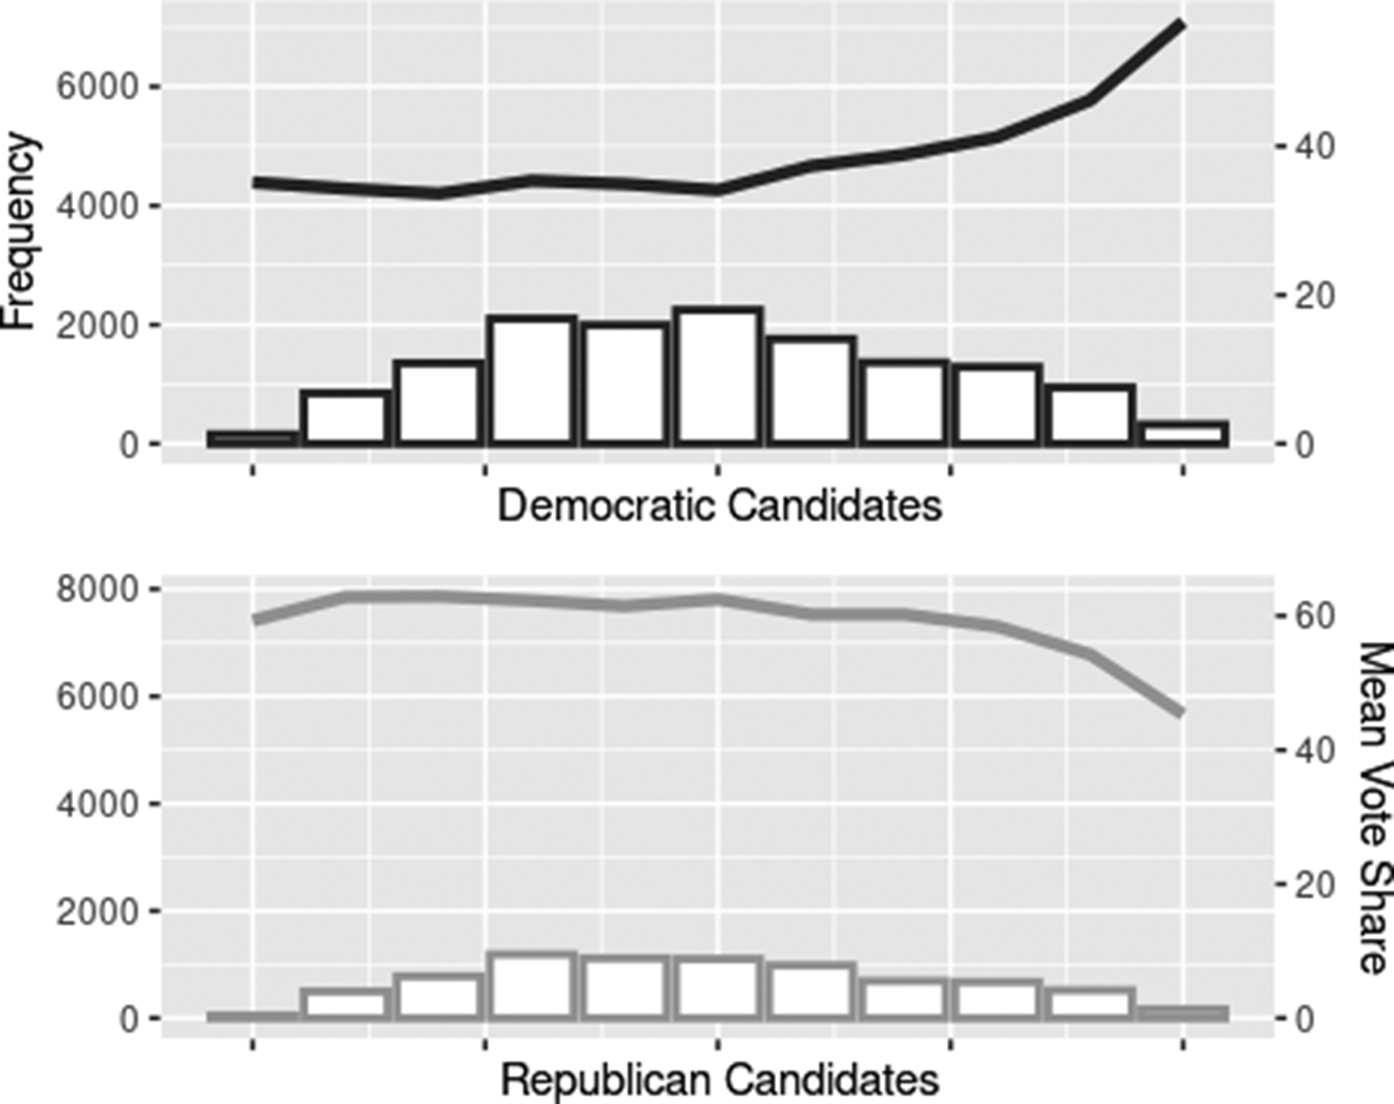
Figure 4. Candidate county level electoral performance by party and women friendliness.
Note: The line reports mean vote share for all candidates at each level of women friendliness, while the histogram reports the number of candidates at each level.
As shown in Figure 5, partisan trends persist but are compounded by race effects. At low levels of women friendliness, white women candidates appear to outperform non-white women candidates by approximately 10 percentage points, yet at high levels of women friendliness, non-white and white women candidates receive approximately the same share of the vote.
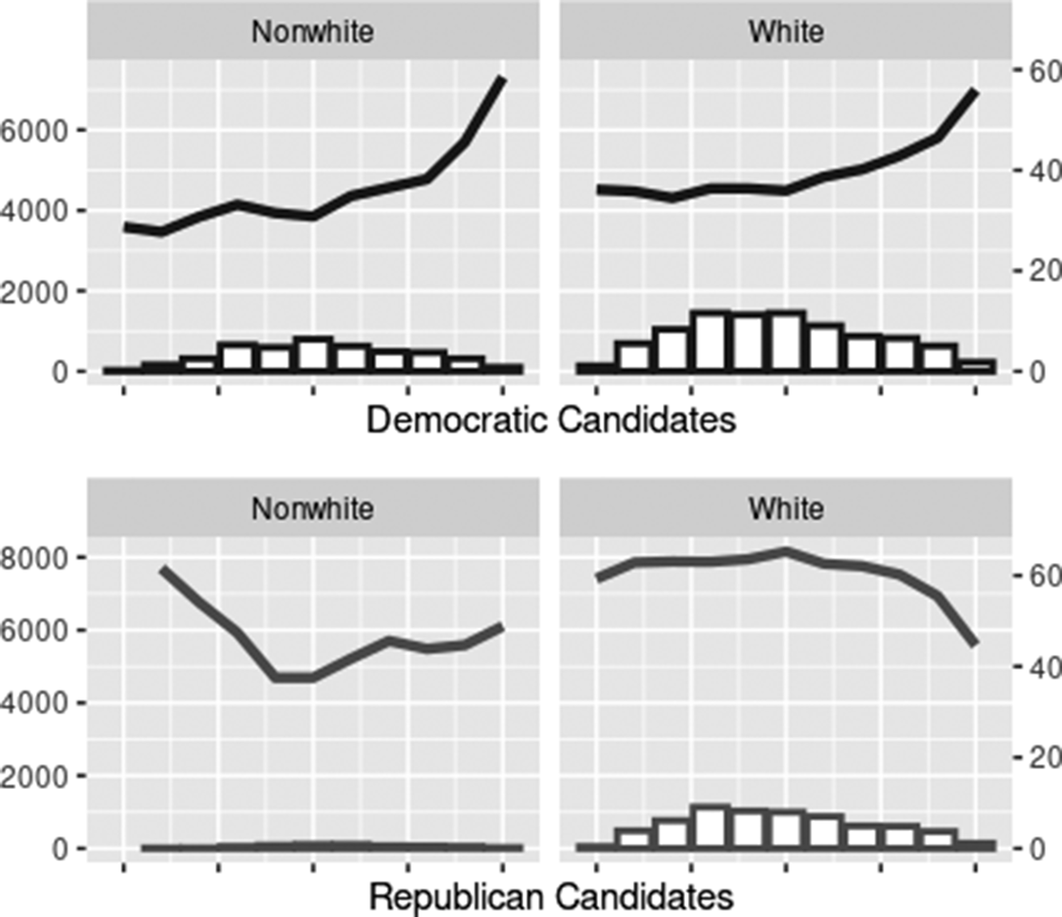
Figure 5. Candidate county level electoral performance by party, race, and women friendliness.
Note: The line reports mean vote share for all candidates at each level of women friendliness, while the histogram reports the number of candidates at each level.
There are two additional items to note in this visual. First, when the results are broken down by party and race, the graphics suggest a nonlinear relationship between the county’s WFI score and vote share. As the number of women friendly attributes in a county increases, Democratic women candidates’ average performance increases at a greater rate. In contrast, Republican women candidates’ performance declines at a greater rate as the county’s WFI score increases. The greatest differences appear to be among non-white Republican women candidates, who have an inverse quadratic relationship. Second, the mean Democratic vote share is substantially lower (37%) than the mean Republican vote share (61%). This is driven by the distribution of Democratic and Republican counties; Republicans win the “average” county by a large amount because the average county in the modern era is rural and substantially Republican.Footnote 13
Control covariates
To ensure that we have properly specified our model, we employ several covariates at the candidate, county, and state levels.Footnote 14 Our individual controls include a dichotomous measure of candidate incumbency and a dichotomous measure indicating the candidate’s post-baccalaureate education.Footnote 15 Our county covariates include the county-level performance of Democratic and Republican presidential candidates in the most recent presidential election,Footnote 16 estimated county-level ideology (Tausanovitch and Warshaw Reference Tausanovitch and Warshaw2013; see also Pettigrew Reference Pettigrew2016), women’s political participation (Institute for Women’s Policy Research 2017), the proportion of registered Democrats and Republicans, and estimated religiosity (Pyeatt and Yanus Reference Pyeatt and Yanus2020). Our state-level covariates include population and the vote share of the candidate statewide.
In nearly all models, we incorporate year-fixed effects as well as fixed effects for the three broad categories of office: gubernatorial, cabinet, and all other candidacies.Footnote 17
Model estimation
Fully specified, our model is
 $$ Y=\alpha +\left({X}_{WFI}+{X_{WFI}}^2\right)\times {X}_{Race}\times {X}_{Party}+{X}_{Controls}+\epsilon . $$
For the sake of interpretability, we disaggregate into four models: one for white Democrats, one for white Republicans, one for non-white Democrats, and one for non-white Republicans. This enables us to isolate the effect of the WFI across parties races.
Moreover, Figures 4 and 5 offer substantial support for using a squared predictor (McGrath Reference McGrath2013; Swift and VanderMolen Reference Swift and VanderMolen2016), even as it upends our original hypothesized expectations, which specified a linear relationship between WFI and vote share. These expectations are easily adjusted to reflect a quadratic relationship; candidates expected to outperform other candidates at high levels of WFI will do so by strictly increasing margins.
We employ three estimation approaches. First, to consider all cases as observed, we use ordinary least squares (OLS) regression with clustered standard errors for the regression tables and simulated bootstrapped standard errors for calculating marginal effects.
Second, to ensure we are equitably comparing the performance of our candidates, we use matching as preprocessing (Ho et al. Reference Ho, Imai, King and Stuart2007). Matching as preprocessing adjusts an existing dataset by matching each treated unit to a plausible counterfactual control unit. Using candidate race as a treatment enables us to find white and non-white candidates who differ along zero or few observable traits save their race, at the expense of reducing sample size. The pool of covariates used for matching consists of each of the component parts of the WFI and all control covariates. We employ 1:1 matching without replacement and a caliper of 2.05 standard deviations, minimizing covariate imbalance. After producing a balanced post-matching dataset, the new data are subset again by race and party to allow us to directly interpret estimated coefficients rather than rely on multidimensional multiplicative interactions. In effect, the post-match treated dataset of non-white candidates and the control dataset of white candidates are each divided by party; estimated coefficients permit us to compare vote performance among these subgroups. Given the small number of women of color in the sample, particularly Republicans, we carefully weigh the trade-off between the balance in the post-match dataset and the size of each subset of the data; the final post-matched dataset consists of 6,222 counties; 702 represent Republican candidates and 5,520 represent Democratic candidates.
Third, to further consider recruitment and strategic entry effects, we divide contexts into “competitive” and “safe” states. This allows us to consider how the effect of context varied when a woman candidate was in a close election, a likely winner or a likely loser. To calculate competitiveness, we averaged Democratic presidential vote for each state across the 2008, 2012, and 2016 presidential elections. States that supported Democrats by an average of 55% or higher were considered a safe Democratic state, states that averaged 45% or less were considered a safe Republican state, and states between 45% and 55% were considered competitive. The list of competitive states is surprisingly expansive – fifteen in all – likely owing to Democratic President Barack Obama’s large margin of victory in 2008 and strong performances by Republican President Donald Trump in 2016 in many previously safe Democratic states.
Findings
Testing our expectations
In the interest of space, we report the full results of each of our multivariate models in Appendix II of the Supplementary Material. In this article, we report our models’ most important coefficients and illustrate them using marginal effects plots. After discussing our main findings, we introduce our two techniques for producing like-case comparisons.
Interpreting coefficients from the regression table is relatively straightforward. In contrast to the linear model, the WFI and WFI2 coefficients must be interpreted together. For example, if the WFI coefficient is negative but the WFI2 coefficient is positive, then the overall association suggests a parabolic, increasing functional form. In Table 2, we see – consistent with our first hypothesis – that for all women candidates, the WFI coefficient is negative and WFI2 is positive and statistically significant; even after controlling for a host of covariates, women candidates win larger vote shares in more women-friendly counties.
Table 2. The effect of women friendliness on U.S. statewide executive woman candidate county-level vote share, 2010–2019, unmatched data
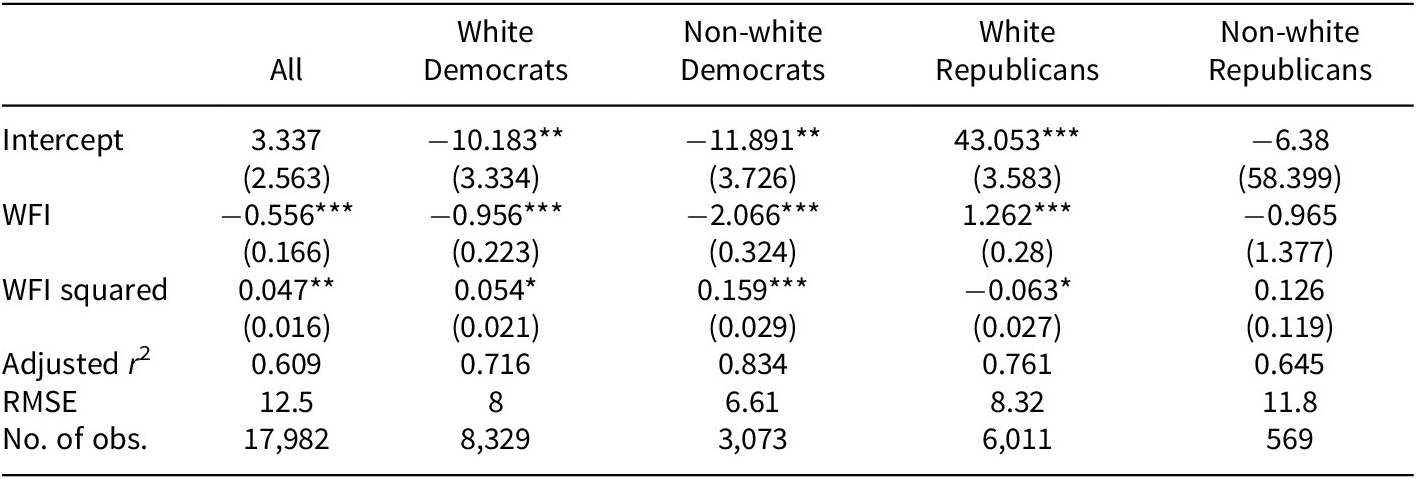
Note: Coefficients, main models. Covariates’ coefficients and year and office fixed effects reported in Appendix II of the Supplementary Material. + p < 0.1, * p < 0.05, ** p < 0.01, *** p < 0.001. County-clustered standard errors reported in parentheses.
However, consistent with the second hypothesis, there are also important partisan differences. For Democratic candidates, both white and non-white, the results look like those for the full model. In contrast, for white Republicans, the WFI coefficient is positive and WFI2 is negative and statistically significant. In other words, Republican white women candidates perform better in low-WFI areas, while Democratic women candidates – both white and non-white – perform better in high-WFI areas. We note that model fit statistics indicate that these models account for between 60% and 83% of the variance in candidate vote share.
In Figure 6, we report marginal effects, which calculate the effect of our squared predictor on the outcome across each value of women friendliness. With respect to the interaction between race and party, we find evidence – consistent with our descriptive analyses and our third hypothesis – that Democratic women of color outperform white Democratic women. As shown in the figure, white Democratic women candidates performed 10 percentage points better at the highest levels of women friendliness, while non-white Democratic women candidates gained nearly 25 percentage points. Among Republicans, white women performed on average 15 percentage points worse at the highest level of women friendliness than at the lowest level. In contrast, non-white Republican women gain vote share as women friendliness increases. However, given the very small number of cases, the confidence intervals are quite large, making it impossible to be certain if these findings are robust or the result of random chance.
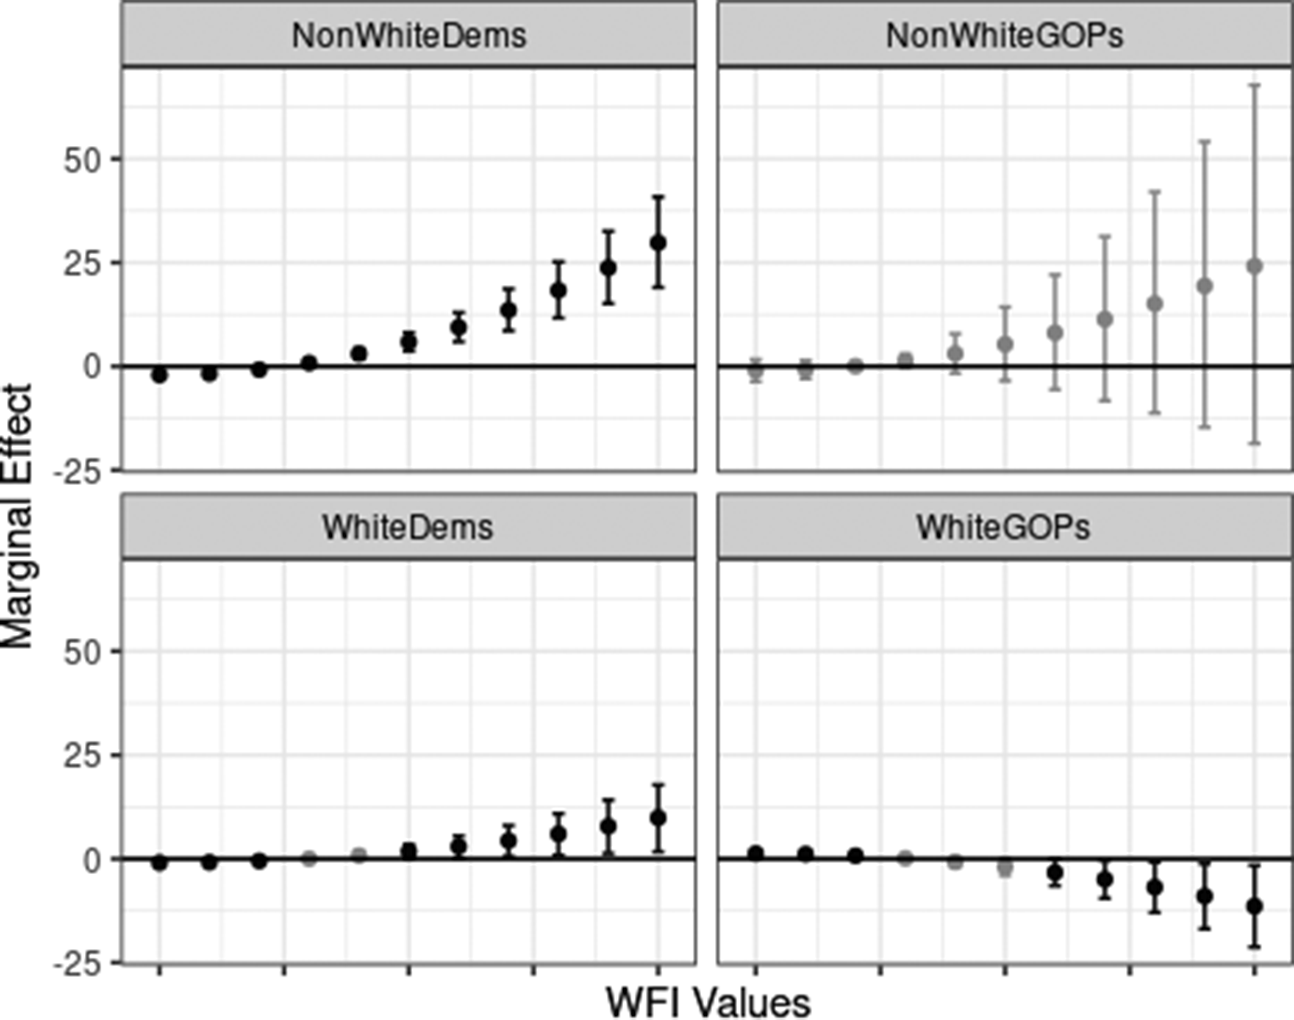
Figure 6. Estimated marginal effects of women friendliness on candidate performance, unmatched dataset.
Note: Each subgroup plotted with differing line types and shapes. Simulated bootstrapped 90% confidence intervals are reported in vertical bars around the estimated marginal effect. Black indicates the confidence interval is statistically significantly different from zero.
It would be reasonable to infer from these findings that women candidates pursuing statewide office – not unlike women running for legislative office – have distinct avenues for success. Democrats will somewhat underperform in counties with low WFI and overperform in counties with high WFI; states with more high-WFI counties are therefore places where Democratic women candidates should win more easily. This is consistent with the 2018 over-performance of Janet Mills (Maine) and Gretchen Whitmer (Michigan), as well as a close race for Laura Kelly (Kansas). By contrast, white Republican women candidates overperform in low-WFI counties and could potentially win more easily in states with lots of these counties. States with many low-WFI counties include those in the Southeast, the Midwest, and the Plains. This is consistent with the electoral performance of current Republican governors Kay Ivey (Alabama), Sarah Huckabee Sanders (Arkansas), Kim Reynolds (Iowa), and Kirsti Noem (South Dakota), all of whom comfortably won their races in 2022.
Like-case comparisons
As previously stated, we employ two techniques for like-case comparisons; these analyses allow us to move beyond the limitations of our dataset and offer preliminary conclusions on the potential effects of candidate recruitment, strategic entry, and other factors that may affect electoral outcomes, particularly for women and candidates of color. First, we use matching as preprocessing to focus on counties that are similar in all ways save race or ethnicity. Second, we subset our data by the competitiveness of the state to focus on candidates running in competitive states, safe Democratic states, or safe Republican states.
Matching as preprocessing slightly changes our results, amplifying the relationship between party and political context. Notable among the findings shown in Table 3 and Figure 7 is that the effects of WFI on white candidates’ performance are generally not statistically significant. Non-white Democrats benefit from high women friendliness; their vote share increases by nearly 25 percentage points across the range of WFI scores. But, non-white Republicans benefit from low women friendliness and – unlike in the non-matched data – see major declines in vote share at the highest levels of women friendliness. That said, given their small numbers in practice, it is important to exercise caution in the interpretation of this result.
Table 3. The effect of women friendliness on U.S. statewide executive woman candidate county-level vote share, 2010–19, matched data
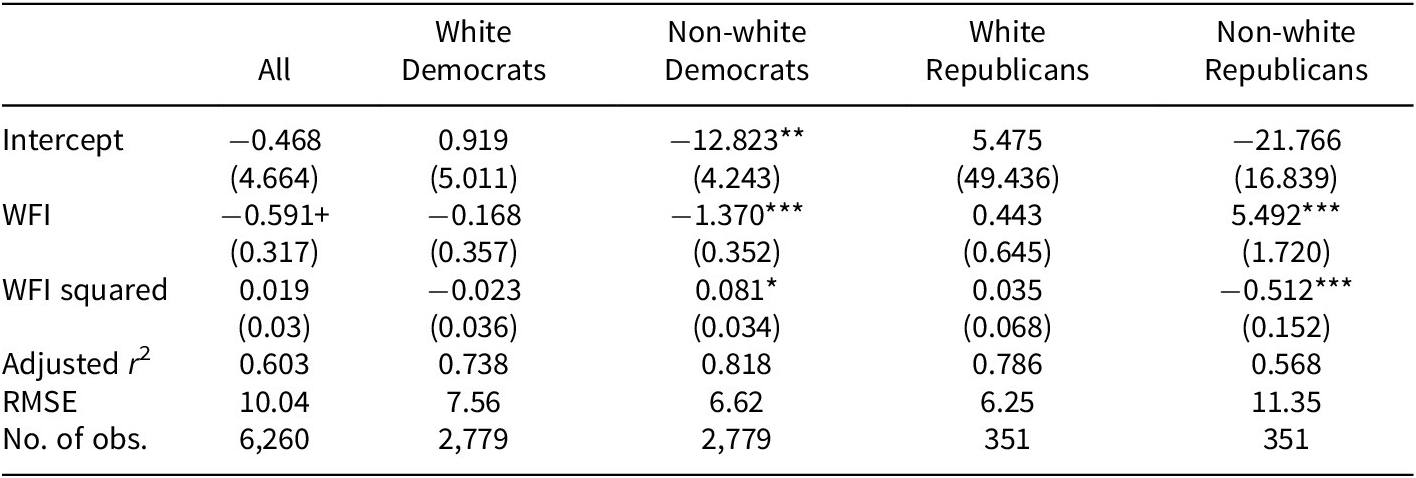
Note: Coefficients, main models. Covariates coefficients, and year-and-office fixed effects, reported in Appendix II of the Supplementary Material. + p < 0.1, * p < 0.05, ** p < 0.01, *** p < 0.001. County-clustered standard errors reported in parentheses.
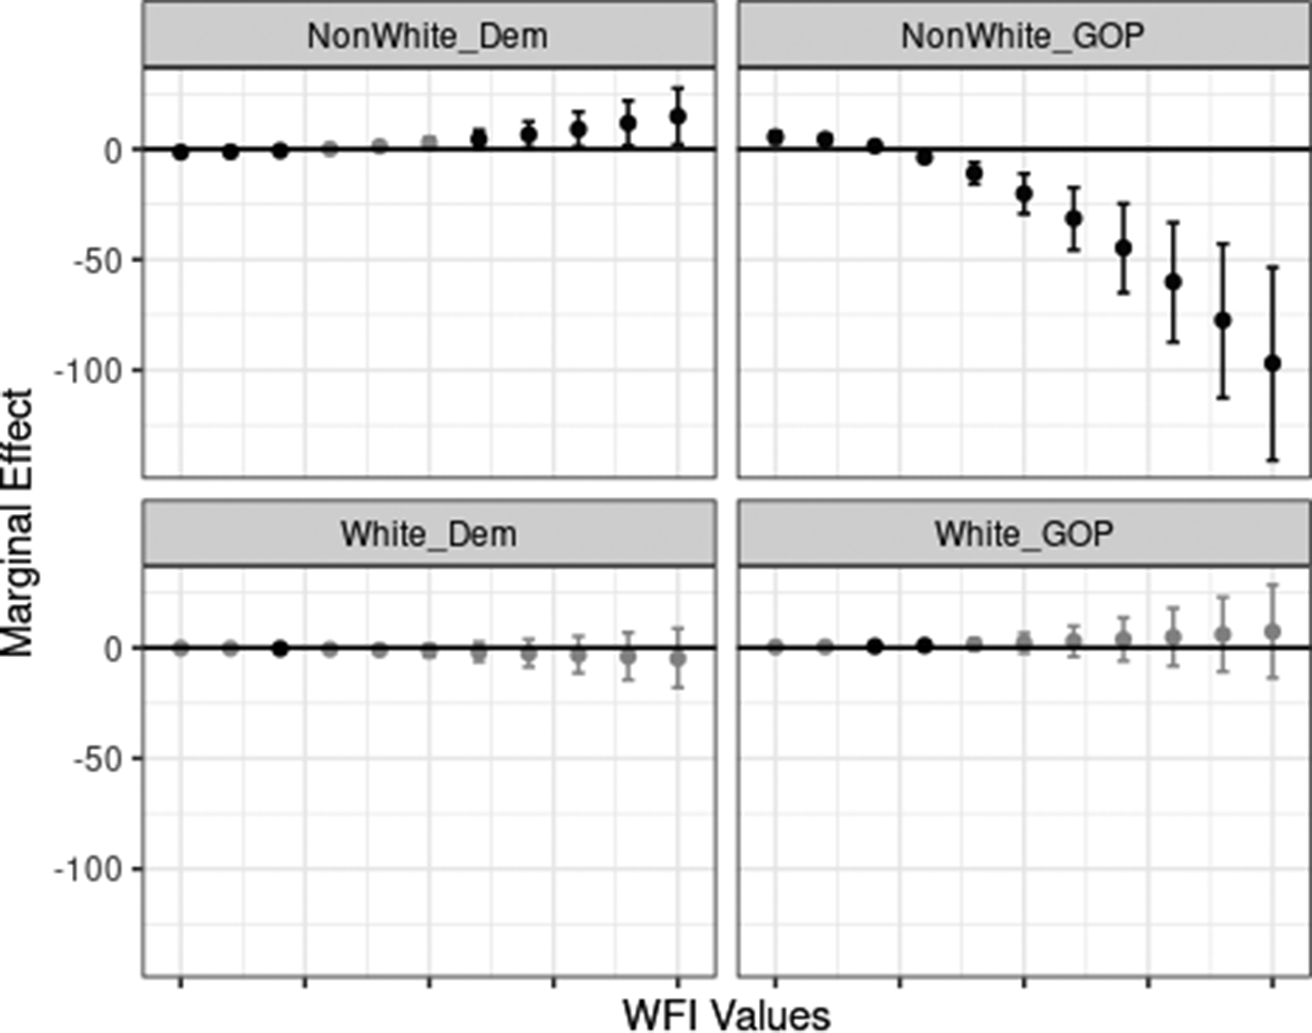
Figure 7. Estimated marginal effects of women friendliness on candidate performance, matched dataset.
Note: Each subgroup plotted with differing line types and shapes. Simulated bootstrapped 90% confidence intervals are reported in vertical bars around the estimated marginal effect. Black indicates the confidence interval is statistically significantly different from zero.
Next, we compare our expectations across competitive states, safe Democratic states, and safe Republican states. Like in the matched analysis, the marginal effects plots shown in Figure 8 reveal that in safe Republican states, Democratic women, regardless of race, lose vote share in the least women friendly areas. At higher levels of WFI, context exerts no statistically significant effect on white Democratic women’s vote share; non-white Democratic women experience significant gains. In contrast, Republican women in safe Republican states experience modest gains at middling levels of WFI but no statistically significant effects otherwise.Footnote 18
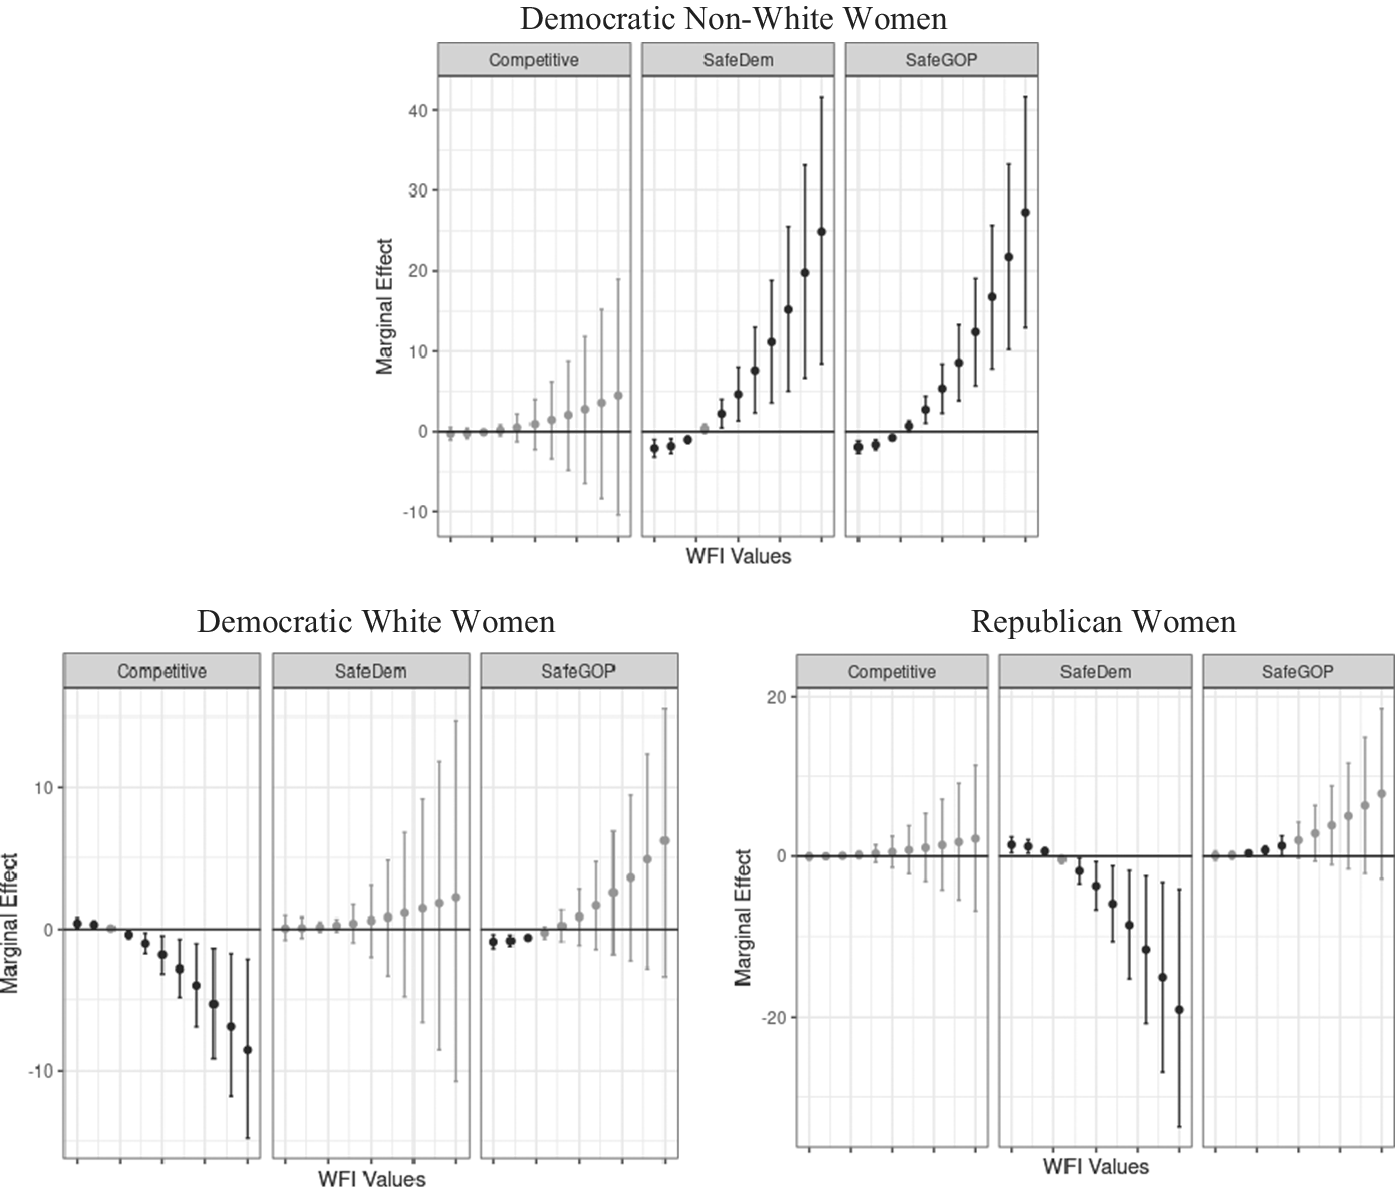
Figure 8. Estimated marginal effects of women friendliness on candidate performance by race and party.
Note: Subgroups represent mean statewide Democratic presidential vote, 2008–2016; “Competitive states” are those where averaged Obama 2008, Obama 2012, and Clinton 2016 statewide vote share was between 45% and 55%. “SafeDem” and “SafeGOP” states are those where the averages exceeded 55% or were under 45%, respectively. Each subgroup plotted with differing line types and shapes. Simulated bootstrapped 90% confidence intervals are reported in vertical bars around the estimated marginal effect. Black indicates the confidence interval is statistically significantly different from zero. Coefficient tables are found in the Supplementary Material.
In safe Democratic states, Democratic white women receive no significant contextual effects, while Republican women candidates’ vote share is significantly reduced in high-WFI counties in these states. Non-white Democratic women, however, experience a decrease in vote share at the lowest levels of WFI and significant increases at higher levels.
Finally, in competitive states, women candidates, regardless of race or party, experienced almost no significant contextual effect from increased women friendliness; only white Democratic women experienced small gains in vote share in the lowest WFI counties and significant decreases in high-WFI counties. The absence of effects in competitive states is likely driven by the emphasis placed on these states by candidates for more salient, up-ballot elections, including presidential and congressional candidates. These dynamics alter voter turnout and increase the salience of partisan cues over personal characteristics. Conversely, personal and identity politics may play a more powerful role in safer states.
Taken together, the alternate modeling specifications underscore, first, that contextual effects are highly situational and candidate dependent. Second, they provide some evidence of women candidates both engaging in strategic entry and functioning as “sacrificial lambs” for their party. The analyses of competitiveness reveal that white Democratic women may strategically be nominated by the party in competitive states in the hope of benefitting from the gender gap, while Republican women may be nominated in safe Democratic states, whether for the sake of appearances or to try to win over voters from the other party. In both cases, context does not appear to help these candidates overcome the political and electoral factors stacked against them.
Finally, these models clearly reveal that non-white Democrats have the most to lose, or to gain, from the electoral context. At low levels of women friendliness, non-white Democrats will underperform the most relative to other women candidates. But as WFI increases, non-white Democrats receive the greatest electoral benefits from the political context.
Discussion of findings and conclusion
This study builds on previous work (e.g., Windett Reference Windett2014) by creating a unique dataset of the more than 250 women candidates who ran for state executive office from 2010 to 2019. In addition to providing descriptive statistics about the partisan and racial identities of these women, as well as the contexts in which they ran and were successful, our empirical analyses make several important contributions to the broader literature on gender, intersectionality, and elections.
First, we provide further evidence of persistent partisan and racial gaps among women candidacies for statewide executive office (Hennings and Urbatsch Reference Hennings and Urbatsch2015). In our period of analysis, more than two-thirds of women candidates ran as Democrats. And, of the 55 non-white women candidates, 87% ran as Democrats.
Second, we demonstrate the continued importance of electoral context, particularly for women of color. Unlike their Democratic counterparts – and particularly Democratic women of color, who receive vote shares as much as 25 percentage points higher in women-friendly areas than in unfavorable contexts – Republican women candidates appear to receive very-little-to-no benefit (and often a penalty) from electoral context, depending on our method of analysis. This may affect campaign strategy as the Republican Party attempts to maintain and build upon recent gains in support among Latinos in South Florida and along the southern border. Though the Grand Old Party (GOP) may nominate women candidates in these areas, those candidates, at least in the short term, may accrue greater electoral advantages from their partisanship than their gender.
Finally, these partisan and contextual effects underscore the gender, racial, and ethnic divisions present in a polarized America. During the 10-year period we studied, no non-white women ran for statewide executive office in almost half of the states – a staggering number, given the increasing diversity of the nation’s population as documented in the 2020 census. The reluctance of many qualified women of color to step into or remain in positions of political leadership poses important questions about candidate recruitment, strategic entry (and exit), descriptive and substantive representation, and the structure of American political institutions that should be explored more deeply in future research. Anecdotally, former Atlanta Mayor Keisha Lance Bottoms, who did not seek re-election in 2021, has been very vocal about the challenges her identity posed throughout the racial and ethnic tensions in her city during her term (McCammond Reference McCammond2021).
There may be some hope for the future. Democratic parties, particularly in “Massachusetts, Virginia, South Carolina, North Carolina, Georgia, Tennessee, and New York,” are also placing a significant emphasis on recruiting Black women candidates at all levels of government (McCammond Reference McCammond2021). Given the partisan tilt of most of these states, our analysis suggests that these women candidates would likely receive contextual benefits on Election Day.
The success of similar efforts among Republicans may hinge on the future of a party that must reckon with a second Trump administration followed by defining its post-Trump identity. In addition to the extant barriers created by party elites and fundraising (e.g., Karpowitz, Monson, and Preece Reference Karpowitz, Monson and Preece2017; Kitchens and Swers Reference Kitchens and Swers2016), nominating non-white Republican candidates has been complicated in recent years by President Trump’s often xenophobic and anti-immigrant rhetoric. If the more moderate anti-Trump faction can seize control of party organizations, even at the state or local levels, the party may be able to attract a more diverse pool of candidates. And future analysis may now compare Hillary Clinton’s performance and Kamala Harris’ candidacies to determine whether our state-level findings hold for women presidential candidates.
Beyond these themes, the present analysis poses several additional questions about women state executives, both as candidates and policymakers. First, we would encourage researchers to consider the effect of macro-level political context on voters’ attitudes and behaviors and how that may affect their willingness to support a non-white woman candidate.
Second, our novel database provides opportunities for public administration and state politics scholars to link descriptive candidate characteristics to substantive policy outcomes to better understand how women, and especially non-white women, running for – and winning – statewide office may affect public policy and other social and cultural outcomes. Such studies should not only examine issues of gender, racial, and ethnic equality, but also ask whether women statewide executives, like legislators and judges (Anzia and Berry Reference Anzia and Berry2011), may be more effective administrators than their male counterparts.
Finally, while women (white and non-white) are not currently elected at numbers proportional to the population, there is a (very) slow trend toward greater parity. Extending the time horizon of this database and expanding it to include more information about candidate characteristics, voter attitudes, and institutional design could be useful for predicting and understanding where women run, for which offices, and their odds of victory, as well as if and how the effects of electoral context have changed over time. Such expanded data and analysis could also shed light on other potential causes of the macro-level trends observed here.
Supplementary material
The supplementary material for this article can be found at http://doi.org/10.1017/spq.2025.10004.
Data availability statement
Replication materials are available on State Politics & Policy Quarterly (SPPQ) Dataverse at https://dataverse.harvard.edu/dataset.xhtml?persistentId=doi:10.7910/DVN/JRUT1X (Fahey, Pyeatt, & Yanus 2025).
Funding statement
The authors received no financial support for the research, authorship, and/or publication of this article.
Competing interests
The authors declared no potential conflicts of interest with respect to the research, authorship, and/or publication of this article.
Author biographies
Kevin Fahey is an Associate Professor at the University of Nottingham, with a primary focus on quantitative methods and political institutions.
Nicholas Pyeatt is a Professor at Penn State – Altoona, with primary research interests in gender and elections.
Alixandra B. Yanus is a Professor of Political Science at High Point University, with primary interests in representation, interest groups, and gender and politics.


 Open access