Introduction
The occurrence of aflatoxins (Aflatoxin B1, or AfB1, is the most common example), a group of carcinogenic mycotoxins, in agricultural products appears to be unavoidable due to heat, drought, humidity, insect stresses, or combinations of these factors. Deactivation of the toxins in food and feed, and removal of the toxins during biofuel production as the last defensive measures are needed to prevent the harmful effects of aflatoxins on humans and animals. Many chemical, physical, and biological detoxification methods have been proposed but are used rarely in practice due to cost, side effects, or cultural acceptance barriers. One economically feasible and environmentally safe solution for aflatoxin detoxification is to use clays, especially bentonites, as aflatoxin binders (e.g. Magnoli et al., Reference Magnoli, Cabaglieri, Magnoli, Monge, Miazzo, Peralta, Salvano, Rosa, Dalcero and Chiacchiera2008; Masimango et al., Reference Masimango, Remacle and Ramaut1979; Phillips et al., Reference Phillips, Kubena, Harvey, Taylor and Heidelbaugh1988).
Over the last four decades, many adsorption experiments and animal and clinical trials have proved that bentonite clays can adsorb aflatoxins and can reduce the toxicity of aflatoxins to animals and humans (Awuor et al., Reference Awuor, Yard, Daniel, Martin, Bii, Romoser, Oyugi, Elmore, Amwayi, Vulule, Zitomer, Rybak, Phillips, Montgomery and Lewis2017; Colvin et al., Reference Colvin, Sangster, Haydon, Beaver and Wilson1989; Kubena et al., Reference Kubena, Harvey, Huff and Corrier1990; Maki et al., Reference Maki, Thomas, Elmore, Romoser, Harvey, Ramirez-Ramirez and Phillips2016; Mitchell et al., Reference Mitchell, Xue, Lin, Marroquin-Cardona, Brown, Elmore, Tang, Romoser, Gelderblom, Wang and Phillips2014; Pollock et al., Reference Pollock, Elmore, Romoser, Tang, Kang, Xue, Rodriguez, Dierschke, Hayes, Hansen, Guerra, Wang and Phillips2016). As smectites are the dominant clay mineral in bentonites, efforts have been made to reveal the most important mineralogical, physical, and chemical properties that determine the efficiency of smectites in aflatoxin detoxification (e.g. Barrientos-Velazquez et al., Reference Barrientos-Velazquez, Arteaga, Dixon and Deng2016a; Deng et al., Reference Deng, Liu, Barrientos-Velazquez and Dixon2012; Deng & Szczerba, Reference Deng and Szczerba2011). Studies have revealed a >10-fold difference in aflatoxin adsorption capacity among bentonites (Kannewischer et al., Reference Kannewischer, Tenorio, White and Dixon2006), and that the layer charge density, type of exchange cation, and origin of the layer charge source had determinative roles in aflatoxin binding efficiency (Barrientos-Velazquez et al., Reference Barrientos-Velazquez, Marroquin Cardona, Liu, Phillips and Deng2016b; Deng et al., Reference Deng, Liu, Barrientos-Velazquez and Dixon2012), whereas the type of octahedral sheets (dioctahedral vs. trioctahedral) showed little difference in their binding capacity (Barrientos-Velazquez et al., Reference Barrientos-Velazquez, Marroquin Cardona, Liu, Phillips and Deng2016b). Many efforts have been made to increase the binding capacity and selectivity of smectites in gastric fluids by heating, replacing the exchange cation, and pillaring with inorganic polycations or organic molecules (Barrientos-Velazquez & Deng, Reference Barrientos-Velazquez and Deng2020; Jaynes et al., Reference Jaynes, Zartman and Hudnall2007; Khan et al., Reference Khan, Akhtar, Akbar, Khan, Iqbal, Barrientos-Velazquez and Deng2022; Wang et al., Reference Wang, Tian, Zong, Zhou, Kang, Wang and Wang2017).
These experimental observations yield critical information about the mineralogical properties needed for aflatoxin binding. Retrieval from the experimental data of the optimal structural information about the binders is difficult due to limitations on specimen availability to cover the ranges of structural parameters for the test. To find optimal parameters that determine the adsorption selectivity and capacity of the smectites for aflatoxins, molecular modeling may be useful.
Preliminary molecular dynamics (MD) simulations on aflatoxin–smectite interactions demonstrated that molecular modeling was very useful in verifying and fine-tuning aflatoxin–smectite interaction mechanisms at the atomic level (Deng & Szczerba, Reference Deng and Szczerba2011), but only limited scenarios were simulated in that study. The objective of the current study was to simulate more systematically the influence of smectite charge density, exchange cation type, smectite charge origin, and water content on the adsorption of aflatoxin B1.
Methodology
Molecular Simulations
The following five factors were varied during the molecular dynamics simulation: charge origin (octahedral vs. tetrahedral), charge density, type of exchange cation, water content, and AfB1 loading level. The ranges of variation for each of these factors were as follows:
(1) Charge origin and layer charge density: six dioctahedral smectites were simulated in this study; three montmorillonites (Mnt) with octahedral-sheet charge densities of 0.3, 0.4, and 0.5 charge per half unit cell (cphuc) and three beidellites (Bei) with tetrahedral-sheet charge densities of 0.3, 0.4, and 0.5 cphuc. The exact chemical formulae of the 2:1 layers studied were (Al1.7Mg0.3)Si4O10(OH)2, (Al1.6Mg0.4)Si4O10(OH)2, (Al1.5Mg0.5)Si4O10(OH)2, Al2(Si3.7Al0.3)O10(OH)2, Al2(Si3.6Al0.4)O10(OH)2, and Al2(Si3.5Al0.5)O10(OH)2 for Mnt03, Mnt04, Mnt05, Bei03, Bei04, and Bei05, respectively.
(2) Type of exchange cations: Deng et al. (Reference Deng, Liu, Barrientos-Velazquez and Dixon2012) showed that divalent cation saturation of smectites led to greater aflatoxin adsorption than monovalent cation saturation, and Ba2+ saturation yielded the greatest AfB1 adsorption capacity. Ba2+ saturation was used in most of the simulations, therefore.
(3) To verify the effect of exchange cation, simulated montmorillonites of charge density 0.4 cphuc with Ca2+ and Na+ saturations were included in the simulation.
(4) Six levels of water contents in the smectites (0, 3.75, 7.5, 11.25, 15, and 18.75 mol/kg), and
(5) Six levels of the amount of AfB1 adsorbed (0, 0.185, 0.37, 0.555, 0.74, and 0.925 mol/kg) were used in the simulations.
In total, eight smectite models were taken into account and they were coded by the mineral species (Mnt and Bei), layer charge density (e.g. 03 for 0.3 cphuc), and the type of exchange cation: Mnt03_Ba, Mnt04_Ba, Mnt04_Ca, Mnt04_Na, Mnt05_Ba, Bei03_Ba, Bei04_Ba, and Bei05_Ba. For each of the eight smectite models, the combinations of water and AfB1 contents resulted in 36 simulations. A total of 288 molecular dynamics simulations were conducted for the various AfB1-smectite complexes.
In the simulations, the SPC force field was assumed for water molecules (Berendsen et al., Reference Berendsen, Postma, van Gunsteren, Hermans and Pullman1981), CLAYFF for smectites (Cygan et al., Reference Cygan, Liang and Kalinichev2004), and GAFF for AfB1 molecules (general AMBER force field; Wang et al., Reference Wang, Wolf, Caldwell, Kollman and Case2004). For each smectite model, a supercell was built as 8×4×2 unit cells in the a, b, and c crystallographic directions. The simulated aflatoxin-smectite system had a size of ~41.6 Å×36.1 Å×X Å, with the value of X dependent on the amounts of AfB1 and water in the interlayer spaces.
For these initial structures, energy minimizations were performed first, followed by NPT-ensemble MD simulations at 1 atm, in temperature cycles. During the first period of every temperature cycle, the temperature was set at 378 K and the simulation was run for 150 ps. Then the temperature was reduced to 298 K, and simulation continued for 300 ps. This MD simulation cycle was repeated three times in order to optimize distribution of molecules in the interlayer. The last period of simulation at 298 K was run for 600 ps from which the system properties were recorded for further analysis from the last 300 ps. The Langevin dynamics protocol was used to control the temperature and Langevin piston to control the pressure. The timestep was set at 1 fs and the dynamic trajectories and system properties were recorded every 1 ps. During the NPT simulations the relaxation of the simulation cell was performed in all a, b, and c crystallographic directions and the clay structure was allowed to be flexible and free to move in all directions to optimize positions of layers in the a-b plane. All the simulations were performed using the LAMMPS computer program (Plimpton, Reference Plimpton1995).
Analysis of the MD Simulation Results
For each hydration level, the energy of the aflatoxin molecule adsorption on smectite was calculated from the following equation (1):
where: 〈U(N)〉was the average potential energy of an equilibrium system with N aflatoxin molecules and a certain number of water molecules in the interlayer, and 〈U(0)〉 was the average potential energy of an equilibrated system containing only a certain number of water molecules, used as a reference state.
A similar equation was used for calculation of hydration of aflatoxin-clay complexes with the same AfB1 content but a variable number of water molecules: ΔU
![]() .
.
In addition, the energy of aflatoxin addition to various smectites was calculated taking the following reaction into account:
including all contributions (molecular, van der Waals, and electrostatic) to total potential energy. A specified amount of water and AfB1 was considered in the complex on the right side: 0.37 mol/kg of AfB1 and 7.5 mol/kg water.
For comparison, the energy of a single AfB1 molecule addition to water was also calculated:
This energy was generated by a separate calculation for a water box consisting of 500 molecules (NPT ensemble, 2 ns simulation).
Results and Discussion
Dependence of Basal Spacing on the Amount of Aflatoxin and Water in the Complex
In the ranges of water and aflatoxin contents simulated, the basal spacing of the smectite varied from 9.8 to 27 Å. Increasing the water or AfB1 contents generally led to an increase in basal d 001 spacing (Fig. 1). No significant difference was noted in terms of interlayer expansion for structures with small water contents (0 and 3.7 mol/kg H2O). This was due to the existence of empty void spaces between aflatoxin molecules in dry structures, which could be then filled with H2O. For larger amounts of AfB1 and H2O, the basal spacing increased linearly with the contents of both molecules. For these smectite structures, water molecules filled the space between AfB1 molecules, and the addition of new molecules led to expansion of interlayer distances.
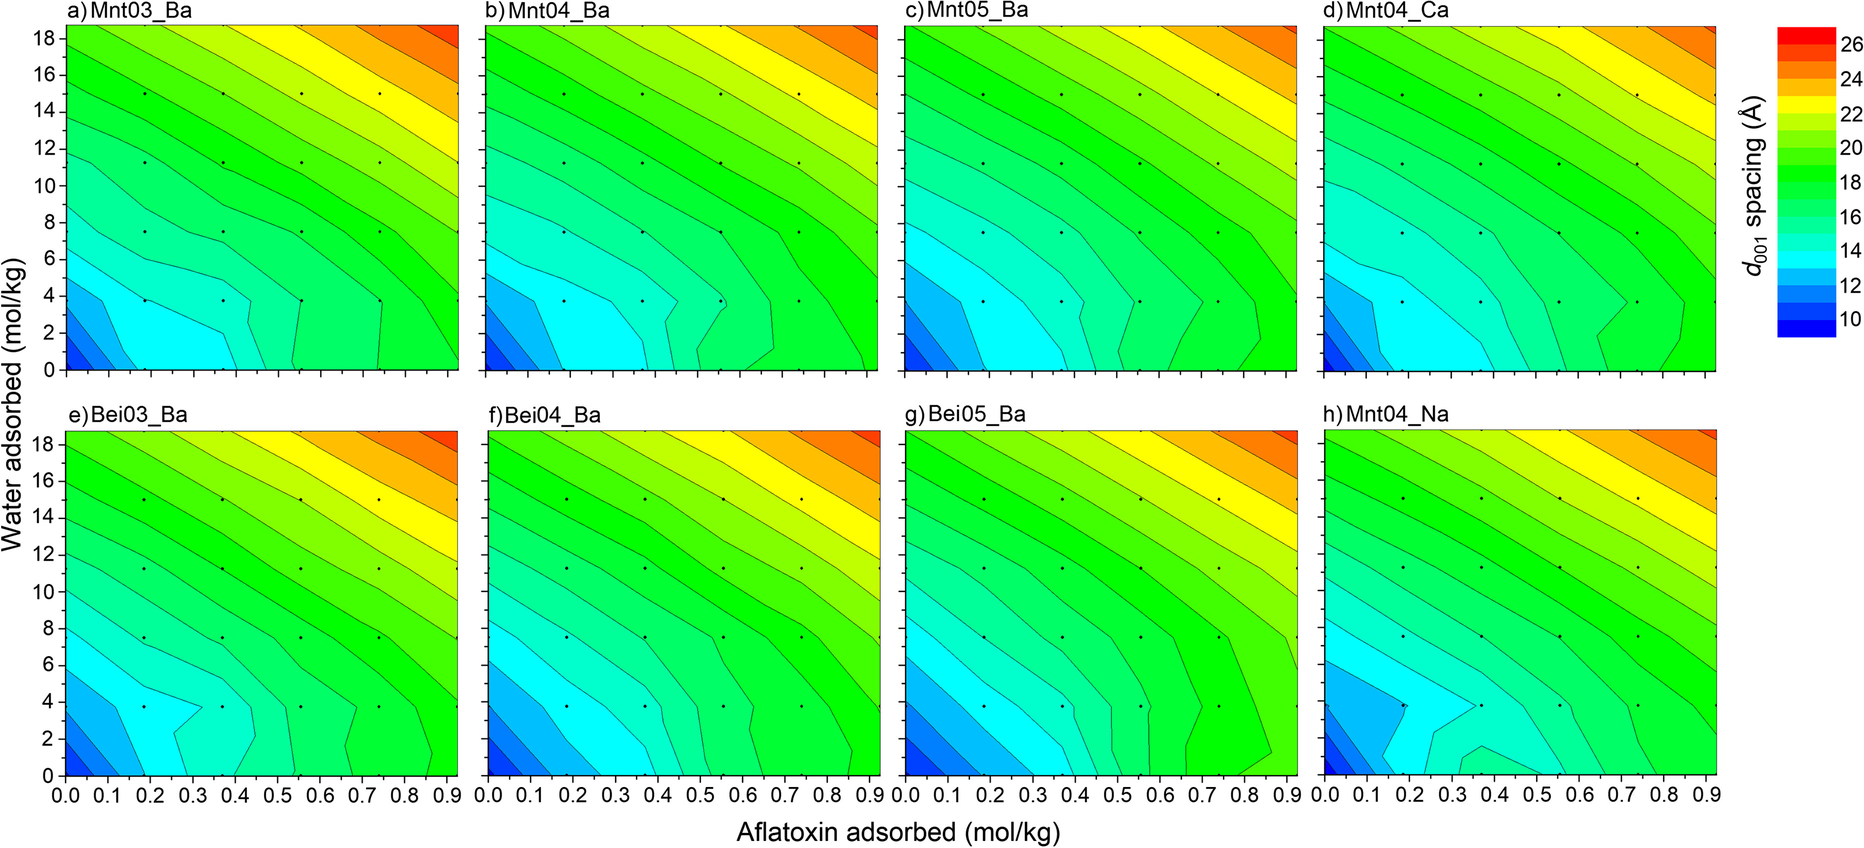
Fig. 1 Dependence of d 001 spacing of AfB1-smectite complexes on AfB1 and water content. The contour graphs were based on the 36 data points of molecular simulations
In the literature, the greatest d 001 spacing of air-dried AfB1-smectite complexes recorded at room temperature and ~60% humidity was ~15 Å (e.g. Deng et al., Reference Deng, Barrientos-Velazquez, Billes and Dixon2010). Basal spacings of >20 Å observed in high-water content conditions in these simulations offered more insight into to the AfB1-smectite interactions in solution. As most X-ray diffraction analyses of AfB1-smectite complexes were analyzed after drying the complexes, the d spacings of >20 Å in the presence of large amounts of water deserve experimental verification. Even at 0 mol/kg of water, the basal spacing of the AfB1-smectite could be expanded to >18 Å when AfB1 adsorption reached 0.9 mol/kg. Neither a large basal spacing like this nor this level of adsorption has been observed experimentally.
Influence of the Water Content on the Configurations of Adsorbed Aflatoxin in the Interlayer of Smectite
Water content affected to a great extent the orientations and configurations of the aflatoxin molecules adsorbed in the interlayer of the smectites. The individual aflatoxin molecules did not deform significantly from their nearly planar structure when the water content was varied, but the distribution of the AfB1 molecules varied drastically when the interlayer water content was increased. For example, at the 0.37 mol/kg AfB1 adsorption level, when the complexes were dry, the adsorbed AfB1 molecules were oriented nearly parallel to the basal surfaces of the smectites with only one layer of the AfB1 molecules scattered uniformly in the interlayer space (Fig. 2a). When the amount of water was increased to 7.5 mol/kg, AfB1 molecules formed two layers (Fig. 2b). For a water content of 18.75 mol/kg, the AfB1 molecules had more random orientations, and some of the aflatoxin molecules had inclination angles toward the basal surfaces of >60° (Fig. 2c). Introducing water into the AfB1-smectite complexes made both the exchange ions and aflatoxin molecules more mobile and more dispersed in the interlayer. For larger AfB1 loadings, some of AfB1 molecules can be disoriented from parallel orientation, also for structures without water (Supplementary Materials, Fig. S1a). Addition of water molecules led to more random orientations of AfB1 molecules for these structures (Fig. S1b, 1c), similarly as in the case of smaller AfB1 loadings.
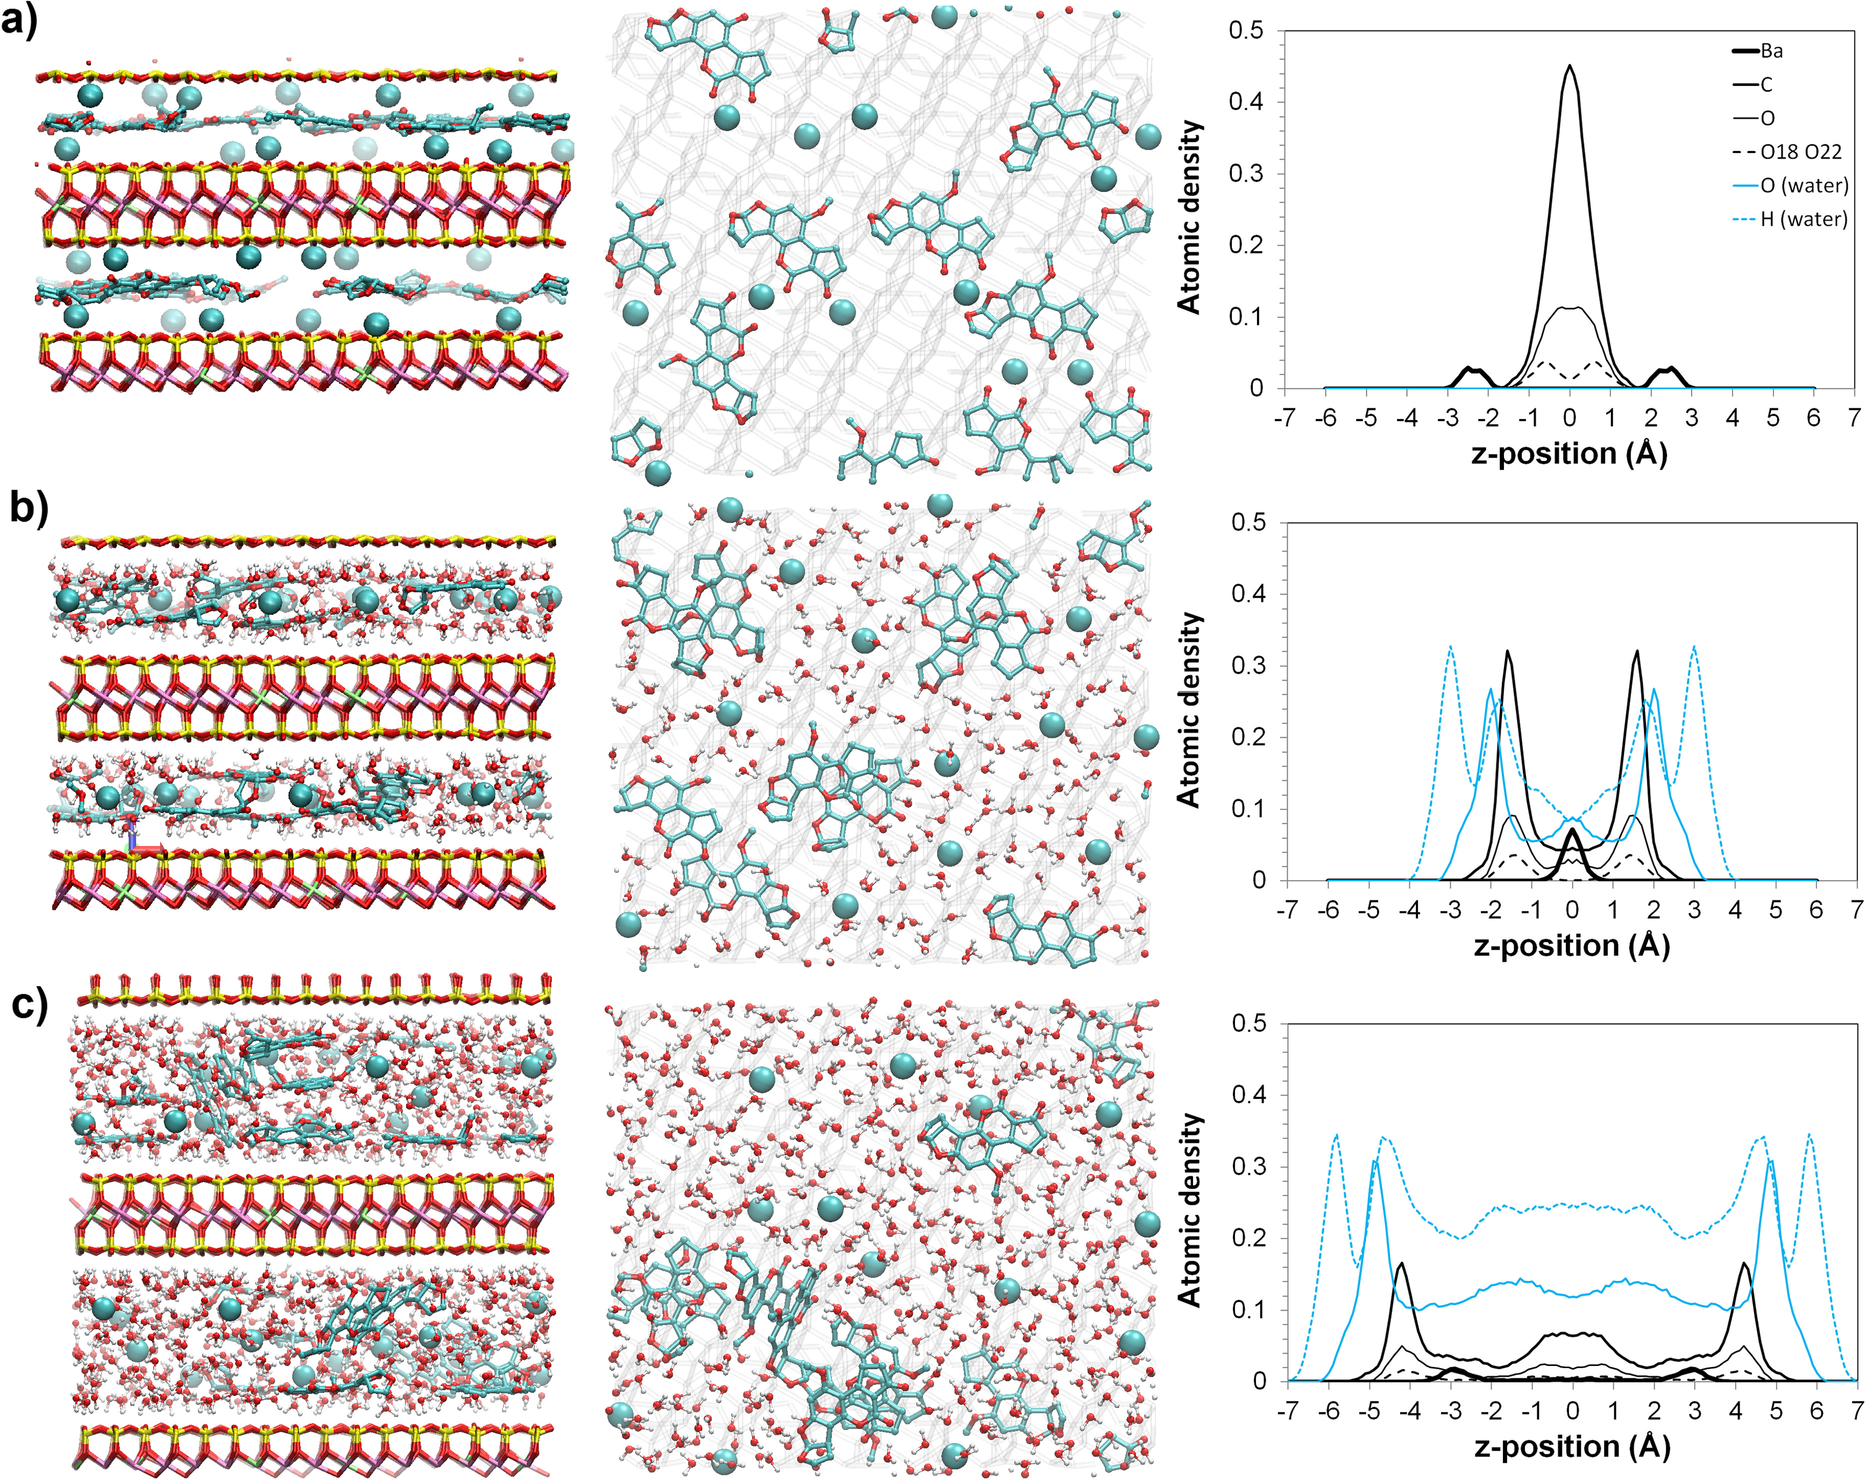
Fig. 2 Structure of Mnt04_Ba smectite with 0.37 mol/kg aflatoxin B1 adsorbed: a dry; b with 7.5 mol/kg water; c with 18.75 mol/kg water adsorbed. Side view, top view, and distribution of atoms are shown in consecutive columns from left to right. The formation of AfB1 π–π complexes for structures with water is visible
Aflatoxin molecules moved around in the interlayer and started stacking on each other at large water contents. They formed two-layer or even three-layer structures in some locations. A unique feature of self-association of aflatoxin molecules was observed on the structure corresponding to a larger amount of adsorbed water (Fig. 2b, c). In this self-associated AfB1 structure, the aflatoxin molecules could form π–π stacking complexes, and the self-associated AfB1 molecules excluded water to their surrounding spaces. With increasing numbers of water molecules, these π–π complexes could detach from the surface and disperse in the interlayer water (Fig. 2c). The self-association of AfB1 molecules in the interlayer of smectite appeared to be consistent with the low water solubility of the toxin of 20–30 mg/L. Such a feature would be difficult to detect experimentally with spectroscopic methods.
The simulations also showed that, as expected from the experimental IR data of Deng et al. (Reference Deng, Barrientos-Velazquez, Billes and Dixon2010, Reference Deng, Liu, Barrientos-Velazquez and Dixon2012), mainly water bridges were formed between ions and aflatoxin carbonyl oxygen atoms as indicated by the radial distribution function (RDF) and running coordination number (RCN) plots between interlayer Ba2+ cations and carbonyl oxygens (Fig. 3). The first peak at ~2.8 Å on the RDF patterns was due to the direct Ba-carbonyl ion–dipole interactions and the second peak at radius of ~4.8–5.3 Å was due to the formation of water bridges between the exchange cation and the carbonyl groups. The peaks on the RDF patterns corresponded to the growth of the RCN function. The simulated ratio between the amount of water-bridged Ba to directly coordinated Ba was ~5.5:1 at the 7.5 mol/kg water content, and 40:1 for a water content of 18.75 mol/kg (calculated based on data from Fig. 3). These calculations suggested the importance of water bridging for the adsorption of AfB1 by the wet smectites, but the simulation also suggested the direct ion–dipole interaction still made significant contributions to the bonding. The exchange cations can have the ion–dipole interactions with the oxygen atoms on the dihydrofuran rings (Fig. 2).

Fig. 3 Radial distribution function and running coordination number plots for Ba–Ocarbonyl of AfB1 for the Mnt04_Ba structure with 0.37 mol/kg of AfB1 and variable amounts of water adsorbed
The calculated energies of aflatoxin molecule adsorption (Eq. 1) of the AfB1-smectite complexes showed minima at water content levels of 7.5 mol/kg for all five montmorillonite structures that had layer charge which originated from the octahedral sheet (Fig. 4a, b, c, d, h). This amount corresponded to two layers of water in the interlayer of the smectites and gave a basal spacing of close to 15 Å. This basal spacing was in agreement with the experimental observation that the synthesized AfB1-smectite had a basal spacing of ~15 Å at room humidity (Deng et al., Reference Deng, Barrientos-Velazquez, Billes and Dixon2010). With either more or less water, energies of AfB1 molecule adsorption increased.
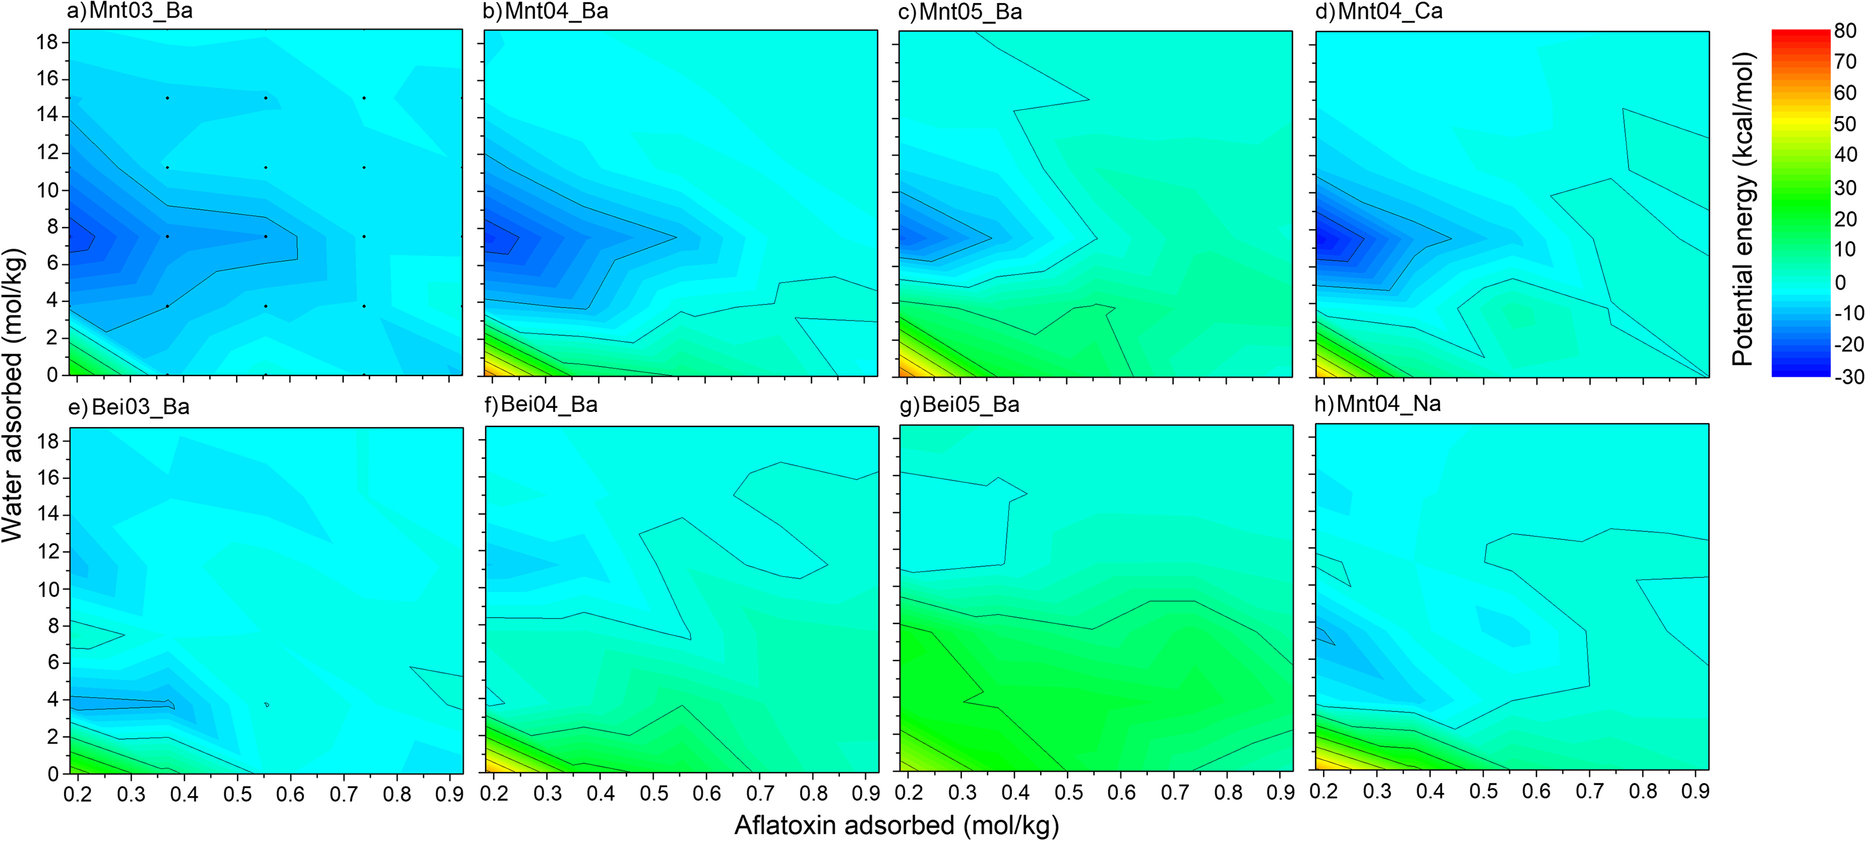
Fig. 4 Potential energies (kcal/mol) of adsorption of aflatoxin molecules on smectite structures. Smectite at a certain hydration level but without AfB1 molecules was used as a reference state; note, therefore, that the amount of AfB1 sorbed begins at 0.185 mol/kg
Although the grid for the energy plots was relatively sparse, it was still evident that the shapes of isoenergetic lines were not parallel to the abscissa axis but were inclined and corresponded partially to isolines of constant basal spacing (Fig. 1). The two water-layer structure of AfB1-water-smectite complex may thus be the most energetically preferable and stable one. The initial AfB1 molecules in the complex had the smallest (and preferable) energy of adsorption, but with increasing amounts of interlayer AfB1, addition of AfB1 molecules became less preferable (e.g. for Mnt04_Ba, 7.5 mol/kg H2O, and 0.185 mol/kg AfB1 it is –23 kcal/mol, but for 0.37 mol/kg AfB1 adsorbed it is –14 kcal/mol – Fig. 4).
The potential energies of water molecule adsorption, ΔU
![]() , on smectites with a constant number of AfB1 molecules showed that structures with 0.185 mol/kg of AfB1 had the smallest energies compared to all other AfB1 contents and also dry structures (blue lines in Fig. 5). With the increase in AfB1 contents, the addition of water molecules to the structure was energetically less favorable (green, orange, red, and brown lines in Fig. 5).
, on smectites with a constant number of AfB1 molecules showed that structures with 0.185 mol/kg of AfB1 had the smallest energies compared to all other AfB1 contents and also dry structures (blue lines in Fig. 5). With the increase in AfB1 contents, the addition of water molecules to the structure was energetically less favorable (green, orange, red, and brown lines in Fig. 5).
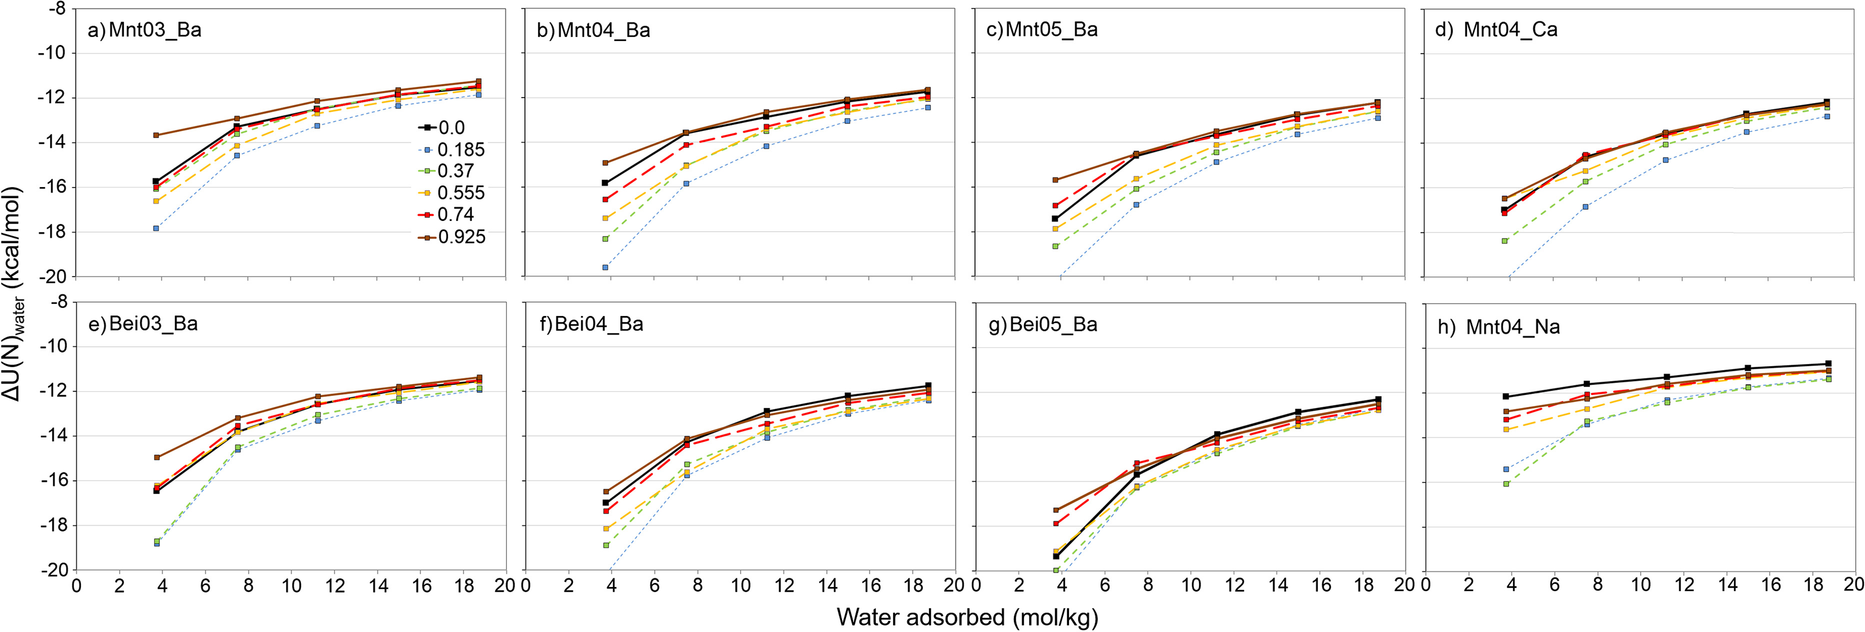
Fig. 5 Potential energies (kcal/mol) of water-molecule adsorption on smectite structures. Smectite with a certain number of AfB1 molecules but without water was used as a reference state for each line
The initial decrease in energies for 0.185 mol/kg AfB1 structures was related to expansion of interlayer space and the existence of vacuum easily accessible by H2O molecules. This led to easier access by water molecules to the interlayer ions. The increase in potential energies of adsorption was caused by relative hydrophobicity of AfB1 molecules. With increase in water content in the interlayers, the potential energy of H2O adsorption also increased, which was related mainly to filling of coordinating spheres of cations, around which water molecules were sorbed preferentially (e.g. Fig. 2b).
These molecular simulation results confirmed the assumption that in the interlayer space of smectite, AfB1 molecules filled the available surface area between those domains covered by the hydrated ions (Deng et al., Reference Deng, Liu, Barrientos-Velazquez and Dixon2012). Note, however, that the plots in Fig. 4 were received for a certain number of water molecules, which was a value that did not correspond directly to humidity. This was because, depending on the type of interlayer cation for the same humidity, the number of adsorbed water molecules was found to be different (e.g. Laird, Reference Laird2006).
Influence of Interlayer Cation on the Structure of Aflatoxin-clay Complex
The calculated energy plots of AfB1, ΔU(N)AfB1, and H2O molecule adsorption, ΔU
![]() , showed substantial differences between divalent (Ba2+ and Ca2+) and monovalent (Na+) cations (Figs. 4b, d, h and 5b, d, h). Both energies were much greater for monovalent ions for various AfB1 and water contents. For Ca2+ and Ba2+ the plots were approximately the same.
, showed substantial differences between divalent (Ba2+ and Ca2+) and monovalent (Na+) cations (Figs. 4b, d, h and 5b, d, h). Both energies were much greater for monovalent ions for various AfB1 and water contents. For Ca2+ and Ba2+ the plots were approximately the same.
The values of ΔU
![]() for the Mnt04_Na structure (Fig. 5h) showed less dependence on the absolute water content than structures with divalent ions (Fig. 5b, d). All these observations could be attributed mainly to the differences in hydration enthalpy of the ions: Na+, –406 kJ/mol; Ca2+, –1579 kJ/mol; and Ba2+, –1309 kJ/mol (Smith, Reference Smith1977), as H2O was mainly in the coordination spheres of interlayer cations (Fig. 2b, c).
for the Mnt04_Na structure (Fig. 5h) showed less dependence on the absolute water content than structures with divalent ions (Fig. 5b, d). All these observations could be attributed mainly to the differences in hydration enthalpy of the ions: Na+, –406 kJ/mol; Ca2+, –1579 kJ/mol; and Ba2+, –1309 kJ/mol (Smith, Reference Smith1977), as H2O was mainly in the coordination spheres of interlayer cations (Fig. 2b, c).
The differences for ΔU(N)AfB1 (Fig. 4b, d, h) were related rather to available space for AfB1 adsorption on the surface. The divalent cations form only outer-sphere complexes in the center of Mnt04 interlayers (Fig. 6b, d), while monovalent Na+ ions tended to form both outer-sphere and inner-sphere complexes at the surface (Fig. 6h). Thereby, Na+ ions are steric hindrances for hydrophobic AfB1 molecules (thick black lines in Fig. 6h – some Na+ ions are close to the surface). For the same number of AfB1 and H2O molecules, the maxima of carbon and oxygen atoms of AfB1 at the surface were slightly greater for divalent ions (thin black lines in Fig. 6b, d, h). In parallel, the plateau in the center of the interlayer for these atoms had greater atomic density for structures with Na+ ions (for the z-position around zero in Fig. 6b, d, h). The results above are in good agreement with experimental data which shows that smectites with divalent cations are much better adsorbers of AfB1. According to Deng et al. (Reference Deng, Liu, Barrientos-Velazquez and Dixon2012), this is related to a better size match between AfB1 molecules and the adsorbing sites on smectite; in the case of divalent cations the hydrophobic smectite surface is more accessible to AfB1 molecules and this is reflected in Fig. 6b, d, h.
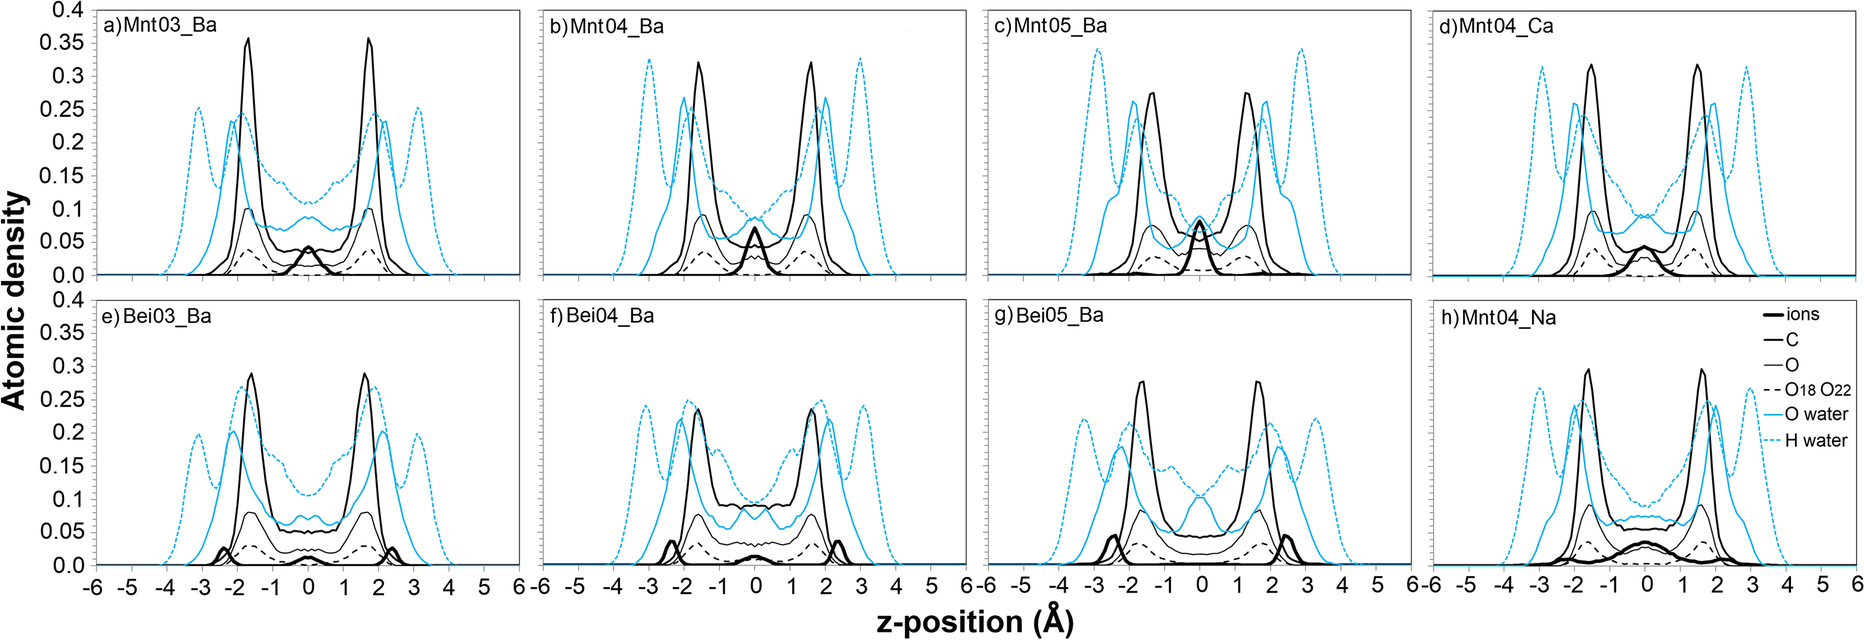
Fig. 6 Distribution of atoms in the interlayer for the structures studied with 0.37 mol/kg of AfB1 and 7.5 mol/kg of water contents. O18 and O22 are the carbonyl oxygens of AfB1
Calculation of RDFs and RCNs for structures corresponding to 0.37 mol AfB1 and 7.5 mol of water per kg of clay showed that differences in the hydration enthalpies of interlayer ions played an important role in the number of water bridges formed between ions and AfB1 molecules of the same valency (Fig. 7); the more negative the hydration enthalpy, the more water bridges form between AfB1 molecule and cations – in the case of Ba2+ ions there were clearly more direct ion–dipole interactions than for the Ca2+ form (as visible on RCN plots – Fig. 7a). For the Na+ form, the number of ion–dipole interactions was greater because of the larger number of ions in the interlayer, but the distances of water bridges were less localized (as visible on RDF plots – Fig. 7a). Considering the RDF and RCN for pairs: the ions (Ba, Ca or Na) and oxygens of water (Fig. 7b) showed 8-fold coordination of divalent cations and 4-fold coordination for the monovalent Na+ cation. This effect is clearly related to the water:ion ratio for the systems studied. Generally, the number of cations that coordinate carbonyl oxygens of AfB1 via direct ion–dipole interactions (RCN plot: Fig. 7a) was inversely proportional to the number of water molecules surrounding the cations in the first coordination spheres (RCN plot: Fig. 7b).
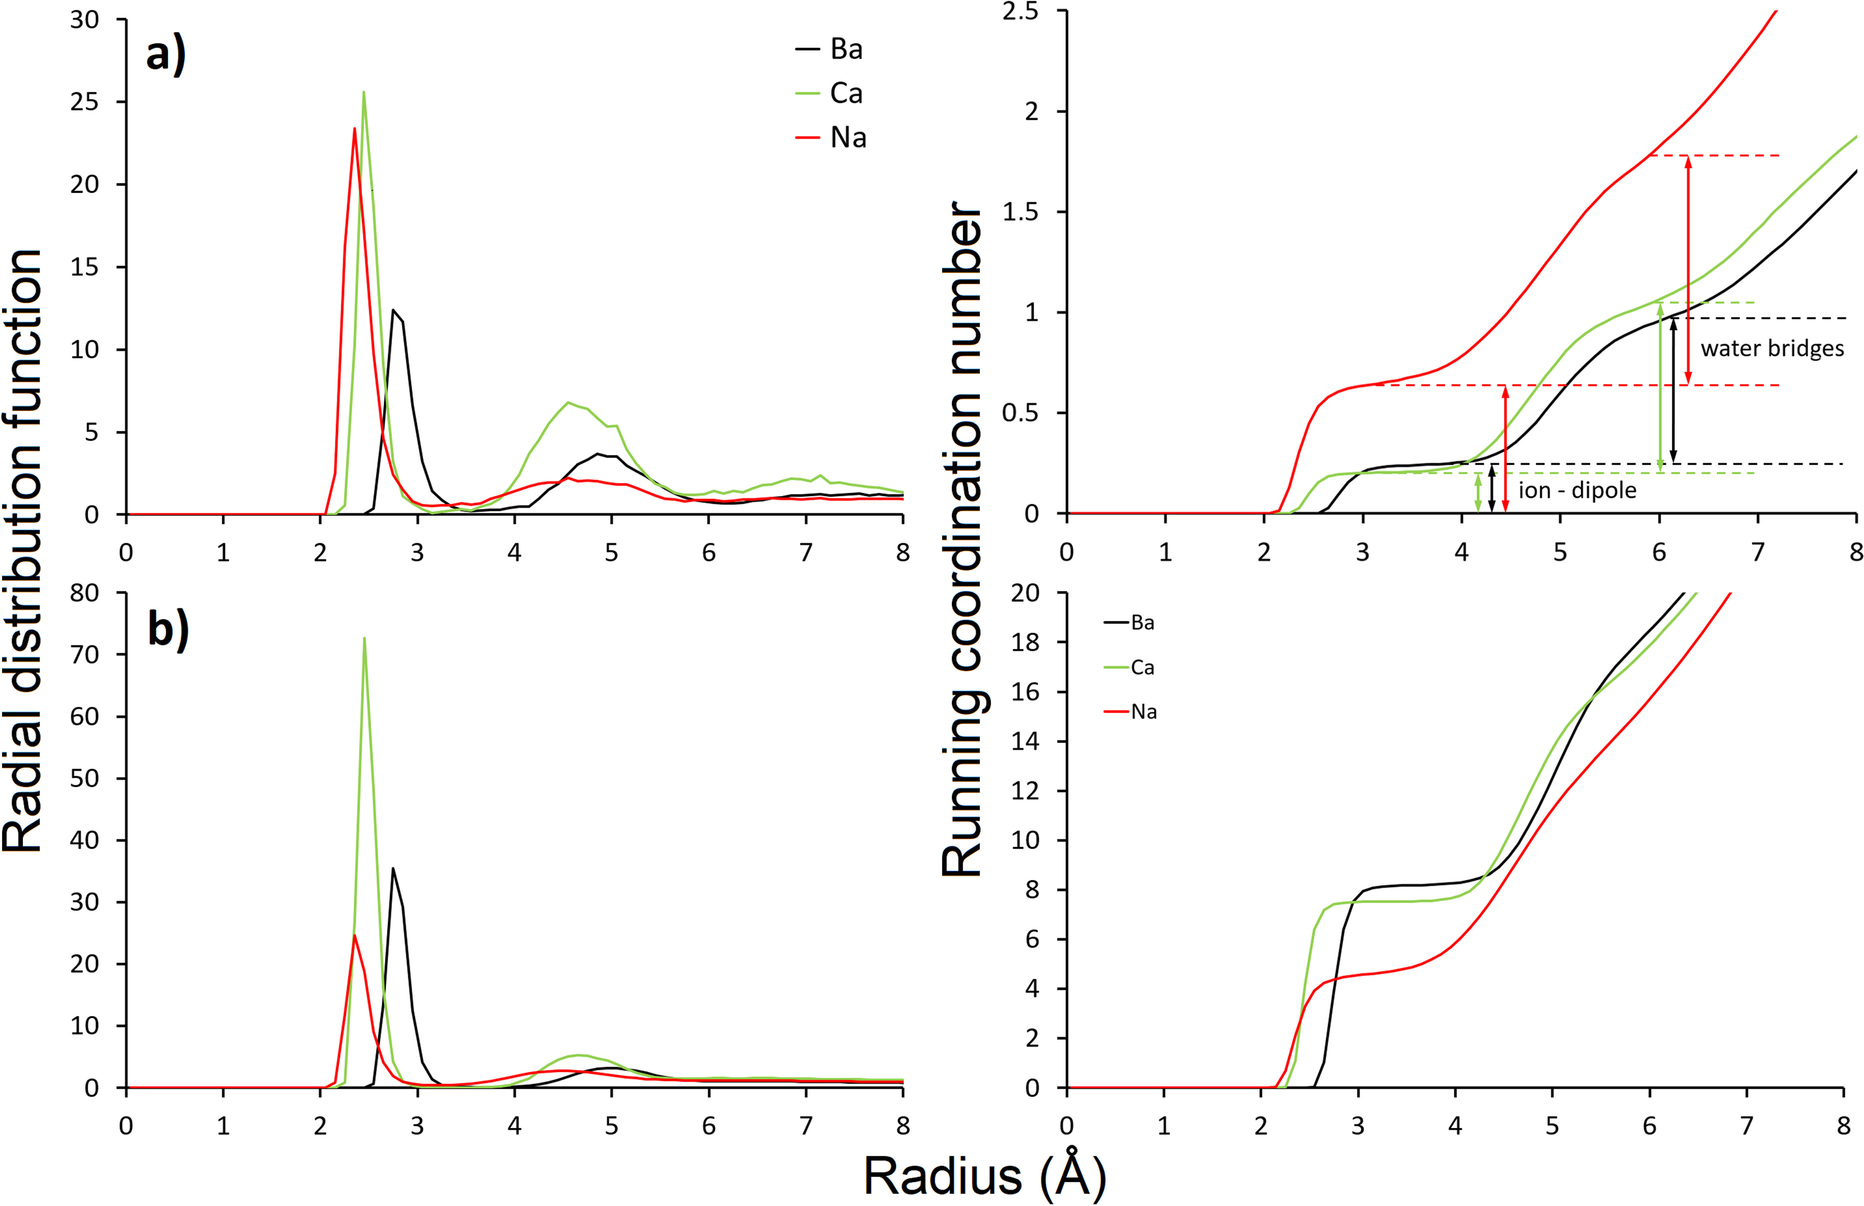
Fig. 7 Radial distribution functions and running coordination numbers for: a carbonyl oxygens–interlayer cations; b cations–oxygen of water molecules, for montmorillonite with a charge of 0.4 per O10(OH)2 substituted with different ions – 0.37 mol/kg AfB1 and 7.5 mol/kg of water sorbed
The potential energy of the addition of AfB1 to pure water was 9.5 kcal/mol. With an increasing number of water molecules in the interlayers, the potential energy of addition of AfB1 molecules to the structure had values less than addition of AfB1 to pure water (~0 kcal/mol; Fig. 4). For a hydration level of 7.5 mol/kg, the energy of addition of AfB1 molecules to a clay complex could even be <–20 kcal/mol for the first AfB1 molecules adsorbed (Fig. 4a, b, d).
To explain differences in energy of aflatoxin adsorption, the contributions of different energy terms to the total energy of AfB1 addition were calculated (Eqs. 2 and 3; Table 1). Clearly, the largest differences between smectites were in the electrostatic terms. A less negative term in Na-montmorillonite indicated weaker interactions between the ions, the atoms of the surface and the AfB1 molecules. These observations are in agreement with experimental results that showed poor AfB1 adsorption on Na-montmorillonites (Deng et al., Reference Deng, Liu, Barrientos-Velazquez and Dixon2012; Barrientos-Velazquez et al., Reference Barrientos-Velazquez, Marroquin Cardona, Liu, Phillips and Deng2016b).
Table 1 Energy contribution (kcal/mol) after addition of AfB1 molecules to montmorillonites with various cations along with the basal spacing of the complexes

*smectite structure assumes addition of 0.37 mol/kg of AfB1 and having 7.5 mol/kg of water
In the case of addition of AfB1 to smectite intercalates, a small deformation of molecular structure (the molecular energy term was 79.4–80.0 kcal/mol, similar for each cation) was observed compared to the addition of AfB1 to water (molecular energy term: 68.5 kcal/mol; Table 1). The introduction of AfB1 into smectites led to some deformation of the molecules, therefore, but AfB1 was retained in the interlayer through electrostatic + van der Waals interactions either with ions or with the surface.
Influence of Layer Charge Density of Montmorillonite on Aflatoxin B1 Adsorption
Aflatoxin adsorption energy, ΔU(N)AfB1, calculated from Eq. 1 for Ba-montmorillonites having layer charges of 0.3, 0.4, and 0.5 cphuc (Fig. 4a, b, c), showed that layer charge had a large influence on the thermodynamics of the addition of AfB1 to the structure. For less moist conditions, the energy of adsorption was substantially less for low-charge montmorillonite (Fig. 4a). The smallest energy values were observed when the water content was close to 7.5 mol/kg. With increasing numbers of water molecules in the interlayers, the potential energy of the addition of AfB1 molecules reached greater values; among Mnt_Ba structures, the highest energies were observed for Mnt05_Ba.
The calculated energy plots for adsorption of H2O molecules, ΔU
![]() , (Fig. 5a, b, c) showed that with an increase in layer charge, the energy of hydration became more negative. This was due to the first water molecules hydrating around ions being bonded more exothermally (e.g. Rudbeck, Reference Rudbeck2006). If, in the structure, there were more interlayer ions, then, statistically, more water would bond within the first shells of ions. On the other hand, with increasing numbers of water molecules, clay layers moved further apart. For higher charge-density smectites, clay layers tended to be closer to each other than for low-charge smectites, which could eventually lead to reduction of the amount of intercalated water molecules in experimental studies.
, (Fig. 5a, b, c) showed that with an increase in layer charge, the energy of hydration became more negative. This was due to the first water molecules hydrating around ions being bonded more exothermally (e.g. Rudbeck, Reference Rudbeck2006). If, in the structure, there were more interlayer ions, then, statistically, more water would bond within the first shells of ions. On the other hand, with increasing numbers of water molecules, clay layers moved further apart. For higher charge-density smectites, clay layers tended to be closer to each other than for low-charge smectites, which could eventually lead to reduction of the amount of intercalated water molecules in experimental studies.
Visualizations of distributions of atoms (Fig. 6a, b, c) showed lower intensity maxima of carbon and oxygen atoms of AfB1 at the surface for Mnt05_Ba, compared to Mnt03_Ba and Mnt04_Ba. The plateau in the center of the interlayer was, therefore, greatest for high-charge montmorillonite, indicating that AfB1 molecules were more disordered and farther from the surface for this smectite. The basal spacing was smaller for the high-charge montmorillonite, which indicated squeezing of interlayer molecules (Table 2). Another distinct difference in these complexes was the location of the interlayer cations; they stayed in the middle of the interlayer space in the lower charge-density montmorillonite, and they stayed both in the middle and closer to basal oxygens of montmorillonite with charge density of 0.5 per half unit cell.
Table 2 Energy contribution (kcal/mol) after addition of AfB1 molecules to smectites with various layer charges along with basal spacing of the complexes

*smectite structure assumes addition of 0.37 mol/kg of AfB1 and having 7.5 mol/kg of water
Analysis of the potential energy contribution showed differences in the electrostatic term (Table 2). With increase in smectite charge, the attraction between interlayer cations and the clay layer became much stronger and aflatoxin molecules were more squeezed within interlayer spaces, especially for montmorillonite. This resulted in an increase of the electrostatic term and a decrease in the van der Waals term, with increasing montmorillonite layer charge (Table 2). The effect of layer charge on AfB1 molecules suggested that the interlayer of high-charge smectites was not favored.
The layer charge on a montmorillonite was varied by Barrientos-Velazquez et al. (Reference Barrientos-Velazquez, Marroquin Cardona, Liu, Phillips and Deng2016b), who observed that an optimal layer charge was critical for maximum AfB1 adsorption. Increasing the exchange capacity to >85 cmol/kg decreased significantly the aflatoxin adsorption capacity of montmorillonite. All the results achieved with the modeling, therefore, agreed quite well with those from experiment.
Influence of Location of the Layer Charge on Aflatoxin B1 Adsorption
The influence of the location of the layer charge on aflatoxin B1 adsorption was investigated by comparing AfB1-beidellite with the AfB1-montmorillonite complexes. Plots of the energy of aflatoxin adsorption on beidellite (Fig. 4e, f, g) showed that adsorption of AfB1 on smectites with layer charge located in the tetrahedral sheet was much less favorable thermodynamically than if the charge was located in the octahedral sheet. This was because the interlayer ions tended to be located close to the basal surface in beidellites (thick black lines in Fig. 6e, f, g), while they tended to stay in the middle of the interlayers in montmorillonites (thick black lines in Fig. 6a, b, c). If the ions were located in the middle of the interlayer space, they had more freedom to adapt to optimal positions between AfB1 molecules, while if the cations were directly on the clay surface they could expel AfB1 molecules from the surface and formation of π–π stacking-complexes was more restricted. The distribution of the cations in the interlayer provides an explanation for the experimental AfB1 adsorption in montmorillonite and beidellite observed by Barrientos-Velazquez et al. (Reference Barrientos-Velazquez, Marroquin Cardona, Liu, Phillips and Deng2016b). Greater aflatoxin adsorption by octahedral charged smectites (hectorite and montmorillonite) was observed when compared to tetrahedral charged smectites (beidellite and nontronite).
Ba-montmorillonite with a different location of layer charge in comparison to Ba-beidellite showed generally less negative values of ΔU
![]() and, thus, a smaller gradual increase of ΔU
and, thus, a smaller gradual increase of ΔU
![]() with increase in the amount of adsorbed water (Figs. 5a, b, c vs. 5e, f, g). This is related to partial hydrophilicity of the beidellite surface in comparison to montmorillonite (Szczerba et al., Reference Szczerba, Kalinichev and Kowalik2020), which results in smaller values of ΔU
with increase in the amount of adsorbed water (Figs. 5a, b, c vs. 5e, f, g). This is related to partial hydrophilicity of the beidellite surface in comparison to montmorillonite (Szczerba et al., Reference Szczerba, Kalinichev and Kowalik2020), which results in smaller values of ΔU
![]() for smaller amounts of water in the structures.
for smaller amounts of water in the structures.
Comparison of energy contributions after addition of AfB1 molecules to beidellites (Table 2) showed large variations in the electrostatic contribution compared to montmorillonites. In the case of beidellites, the ions were located in the positions close to substitutions in the tetrahedral sheets, and closer to the smectite surface (Fig. 6e, f, g). Ions were less mobile, only partially hydrated in closed shell positions, and, therefore, the electrostatic term was much greater for high-charge beidellites (Table 2). Generally, van der Waals terms decreased with the increase in layer charge, but electrostatic terms increased much more, resulting in a net increase of potential energy for high tetrahedrally charged smectites. These results were confirmed by an experimental test in which the aflatoxin affinity was significantly lower in nontronite, which is a tetrahedrally charged smectite, compared to montmorillonite (Barrientos-Velazquez et al., Reference Barrientos-Velazquez, Marroquin Cardona, Liu, Phillips and Deng2016b).
Conclusions
In addition to verifying the effects of mineralogical properties on aflatoxin–smectite interactions observed experimentally, the molecular simulation offered more insight into the mechanisms that would be difficult to reveal experimentally. Five major conclusions on aflatoxin–smectite interactions were drawn from the molecular simulations:
(1) In all of the AfB1–smectite complexes studied, substantial amounts of organic molecules tended to be lying flat on the clay surface.
(2) With larger amounts of adsorbed AfB1 molecules in the structures and/or depending on water content, self-association of two AfB1 molecules bound by π–π interaction and with each of the molecules lying flat on the clay surface was thermodynamically favorable.
(3) With increasing water content, the interaction of AfB1 molecules with water tended to remove some of the molecules from the clay surface. Simultaneously, some π–π interactions could break. Locally, three or more AfB2 molecules could form the π–π stacking complexes in the interlayer under increased water-content conditions. This type of information could not be obtained by experimental methods as, in general, the AfB1-smectite complexes were characterized under dried conditions when spectroscopic or microscopic methods were employed.
(4) The thermodynamics of AfB1 adsorption on smectites depended heavily on the water content in the structure, but the adsorbed AfB1 molecules affected only slightly the thermodynamics of water adsorption. It could, therefore, be concluded that, depending on the humidity, the amounts of AfB1 adsorbed by smectite can vary.
(5) The potential energy of AfB1 adsorption on smectites was greater for high-charge smectites and for smectites for which the layer charge originated in the tetrahedral sheet, which reduced the aflatoxin adsorption.
Supplementary Information
The online version contains supplementary material available at https://doi.org/10.1007/s42860-023-00219-7.
Acknowledgements
We are very thankful for the helpful comments by the Editor-in-Chief, the Associate Editor, and by two anonymous reviewers. The authors acknowledge financial support from the United States Department of Agriculture. This work was also supported by the Polish Grid Infrastructure PL-Grid infrastructure.
Code Availability
Not applicable
Authors' contributions
Marek Szczerba: molecular simulations, analysis of results, writing manuscript, Youjun Deng: revision of data, writing manuscript, Mariola Kowalik: molecular simulations.
Funding
United States Department of Agriculture, PLGRID.
Data Availability
On request from Marek Szczerba.
Declarations
Conflicts of Interest
Not applicable.


