


Highlights
-
Intake of healthy foods such as vegetables, legumes and whole grains protects against type 2 diabetes (T2D).
-
The association between a healthy plant-based diet and T2D is almost linear.
-
Unhealthy plant-based diets are not beneficial and may even increase risk of T2D.
-
Limitation of unhealthy plant-based foods, even if they are of plant origin, is recommended.
Introduction
Type 2 diabetes (T2D) is a chronic metabolic disease with an estimated 537 million affected adults aged 20–79 years worldwide (namely, 10·5 % of all adults in this age group)(1). By 2030, projections show that 643 million, and by 2045, 783 million adults aged 20–79 years will be living with diabetes. Thus, while the world population is estimated to grow 20 % over this period, the number of subjects with diabetes is estimated to increase by 46 %(1). Diabetes aetiology is multifactorial with a number of non-modifiable factors, such as family history (genotype) and age, and several modifiable factors, including those related to lifestyle, that contribute to the onset of the disease(Reference Neuenschwander, Ballon and Weber2). Therefore, prevention of T2D through the promotion of a healthy lifestyle in the population is a very important public health strategy. Amongst lifestyle factors, diet plays an important role(Reference Ley, Hamdy and Mohan3–Reference Schwingshackl, Hoffmann and Lampousi5), and because analyses of single nutrients or foods cannot account for complex interactions, the assessment of dietary patterns has emerged as the most appropriate approach to examine the association between diet and T2D(Reference Hu6).
Plant-based dietary patterns have gained significant attention in recent years for their potential to prevent or manage several chronic diseases such as cancer, neurodegenerative, cardiovascular and metabolic diseases(Reference Agnoli, Baroni and Bertini7–Reference Qian, Liu and Hu13). Plant-based diets constitute a variety of dietary patterns that emphasise intake of foods derived from plant sources coupled with a lower consumption or the exclusion of animal products. Vegetarian diets form a subset of plant-based diets, which may exclude the consumption of some or all forms of animal foods(14). Indeed, vegetarian diets are classified according to the patterns of elimination of food groups such as fish, eggs and/or dairy from diet (i.e. pesco-, ovo-, lacto- and lacto-ovo-vegetarians, respectively). The vegan diet is the most restrictive as it excludes all animal-based products, including fish, dairy, cheese and eggs.
The potential beneficial effect of dietary restrictions for animal-derived foods on the incidence of T2D is yet to be confirmed and characterised. Depending on the dietary definition, vegetarian patterns may exclude not only some animal products such as red and processed meats, which are positively associated with T2D risk(Reference Micha, Michas and Mozaffarian15,Reference Shi, Huang and Schooling16) , but also others foods, such as dairy products and fish, which are potentially beneficial for human health, depending on the amount and their composition(Reference Gijsbers, Ding and Malik17–Reference Zhang, Picard-Deland and Marette20). A meta-analysis of observational studies(Reference Lee and Park21) suggests an inverse association between every vegetarian dietary pattern and risk of T2D, although the study was limited by the inclusion of twelve cross-sectional studies and only two prospective studies, both of which were conducted in a selected population (U.S. Seventh-day Adventists). Therefore, it is still difficult to draw conclusions about the effectiveness of plant-based dietary patterns in the primary prevention of T2D. Moreover, several earlier studies on vegetarian diets and T2D have categorised study populations dichotomously into participants who do or do not consume some or all animal foods, thus preventing a comprehensive assessment of this potential association.
An important issue from both a nutritional and public health perspective, however, is whether a concomitant decrease in animal food intake and a higher adherence to a plant-rich diet lowers the risk of T2D. In this context, ‘plant-based diet index’ (PDI) is a new parameter that has recently been adopted to evaluate dietary habits with a focus on plant food intake(Reference Trapp, Barnard and Katcher22). An important consideration that needs to be taken into account is the fact that not all plant foods are necessarily healthy in relation to T2D, as well as other health endpoints. Several plant foods, such as fruits, vegetables, whole grains and legumes, are favourable for the prevention of T2D(Reference Aune, Norat and Romundstad23–Reference Muraki, Imamura and Manson25), but other plant foods, such as refined grains, sweets and sugar-sweetened beverages, have undesirable effects on the development of T2D(Reference Halton, Willett and Liu26–Reference Soriguer, Colomo and Olveira30). Thus, three plant-based diet indices were developed to differentiate the quality of plant-based foods in a person’s diet: overall PDI, healthy PDI (hPDI) and unhealthy PDI (uPDI) in order to consider whether they have a different impact on health outcomes. A recent dose–response meta-analysis(Reference Qian, Liu and Hu13) used data from five prospective studies (Nurses’ Health Study, Nurses’ Health Study 2, Health Professionals Follow-Up Study, Singapore Chinese Health Study and Rotterdam Study) and showed a significant inverse and linear association between overall PDI and risk of T2D. However, this study did not perform a quantitative dose–response assessment stratified by adherence to hPDI or uPDI between increasing adherence and risk of diabetes. Conversely, a subsequent review reported an inverse association between PDI and hPDI with T2D risk(Reference Nikparast, Mirzaei and Tadayoni31). However, it included a lower number of studies, and the dose–response analysis was implemented using a different model, and it was also not performed for uPDI.
The aim of this systematic review is to assess how adherence to vegan, vegetarian and plant-based diets, with separate consideration of healthy and unhealthy plant-based diets, is associated with risk of T2D, and to comprehensively characterise the pattern of the association taking advantage of the availability of newly published studies and advances in statistical techniques to model the dose–response relationship between investigated dietary indices and T2D.
Methods
Protocol registration
We followed the Preferred Reporting Items for Systematic Reviews and Meta-Analysis 2020 guidance(Reference Page, McKenzie and Bossuyt32) to perform this review, and we registered the systematic review in PROSPERO database (no. CRD42022382022).
Literature search and screening
We performed online literature searches in PubMed/MEDLINE and EMBASE databases up until 10 July 2025, by using the MeSH terms and keywords related to ‘plant-based diet’, ‘vegetarian diet’, ‘vegan diet’ and ‘type 2 diabetes’. Details about the search terms are reported in online Supplementary Table S1. We also used citation chasing techniques to identify relevant studies through screening of reference lists as well as backwards and forward citations of included studies(33). We imported retrieved articles into Rayyan online application and duplicates were removed. Two authors (AM and TF) independently screened publication titles and abstracts and evaluated full-text publications for inclusion in the review. In case of disagreement, both authors performed a second review of the full text to determine eligibility for inclusion through a consensus-based discussion. If the two authors still disagreed, a third author (MV) was sought to resolve disagreement.
Eligibility criteria and study selection
We defined the following study inclusion criteria according to the Population, Exposure, Comparison, Outcome and Study Design (PECOS) statement: (1) adult population (not pregnant women); (2) adherence to a plant-based, vegetarian or vegan diet; (3) subjects with low adherence to investigated dietary patterns; (4) assessment of T2D risk in relationship to plant-based, vegetarian or vegan diet adherence (outcome assessment may be based on clinical data related to the diagnosis or treatment of T2D, or on biochemical data after blood sampling) and (5) observational study design (cohort, cross-sectional or case–control). We did not apply any language restrictions. When necessary, we also contacted authors of included studies to retrieve additional information for data analysis when not published in the report.
Risk of bias assessment
We assessed the quality of included studies using the Risk of Bias for non-randomised studies of exposures tool(Reference Morgan, Thayer and Santesso34). Seven domains were considered including: (1) bias due to confounding; (2) bias in selecting participants in the study; (3) bias in exposure classification; (4) bias due to departures from intended exposures; (5) bias due to missing data; (6) bias in outcome measurement and (7) bias in the selection of reported results. Online Supplementary Table S2 reports criteria for risk of bias evaluation. Two authors (AM and TF) performed the assessment, with any disagreements resolved by consultation with a third author (MV).
Data extraction
We (AM and SP) extracted the following data from eligible studies using a standardised spreadsheet in Excel software: (1) study type; (2) first author name; (3) publication year; (3) country; (4) period of observation; (5) follow-up period; (6) type of exposure assessment; (5) outcome of interest; (6) estimation unit of adherence; (7) exposure categories; (8) dose for each category of exposure (for studies that used dietary indices); (8) number of cases with T2D; (9) sample size at baseline, overall and divided by exposure category; age (10) and sex (11) of participants at baseline; (12) risk estimates, either hazard ratio (HR), odds ratio (OR), and risk ratio (RR), with their 95 % confidence interval (CI) and covariates from the most adjusted multivariable model. For studies that used dietary indices, we used the risk estimate that compared the highest with the lowest percentiles, which represent the best (highest percentile) and poorest (lowest percentile) adherence to the plant-based dietary pattern. For studies that compared an a priori defined dietary pattern, we considered the study risk estimates comparing diets that are most restrictive of animal-based foods (e.g. vegan and vegetarian diets) with the least restrictive, such as omnivorous diet.
Data analysis
First, we performed a forest-plot meta-analysis comparing vegetarian pattern/plant-based diet v. non-vegetarian dietary pattern and risk of T2D, using the non-vegetarian pattern as reference and comparing the highest v. the lowest category of exposure.
We then assessed the shape of the association between plant-based diet exposure and risk of T2D using a dose–response meta-analysis based on the one-stage approach(Reference Di Federico, Filippini and Whelton35,Reference Urbano, Vinceti and Wise36) . In this approach, we used the mean/median levels or the midpoint of each exposure category, depending on data availability, and if the highest and the lowest exposure boundaries were ‘open’, a 20 % higher or lower value from the closest cutpoint(Reference Cecchini, Filippini and Whelton37–Reference Verzelloni, Urbano and Wise39). We carried out this analysis by using a restricted cubic spline with three knots at fixed cutpoints (tenth, fiftieth and ninetieth percentiles) and a restricted maximum likelihood random effects model(Reference Orsini, Larsson, Salanti, Egger, Higgins and Davey Smith40,Reference Vinceti, Filippini and Malavolti41) . We used Stata-SE software (v19.0, Stata Corp., 2025) for all data analyses, specifically the ‘meta’, ‘mkspline’ and ‘drmeta’ routines.
Subgroup and sensitivity analyses
We stratified all analyses using definitions of plant-based diets. Specifically, for vegetarian diets, analyses were stratified by type of vegetarianism (e.g. vegan and lacto-ovo-vegetarian), while for studies that defined adherence to plant-based dietary patterns using plant-based dietary indices, the results were divided by index type, that is, overall PDI, hPDI and uPDI. Specifically, hPDI emphasises consumption of vegetables, legumes and whole grains, while uPDI emphasises the intake of refined grains, sweets and sugar-sweetened beverages of plant origin(14). Whenever possible, we also stratified the data by geographic region (namely Asian and Western countries, to account for differences in ethnic origin). We eventually performed sensitivity analyses by restricting the assessment to studies with cohort design only, with a duration of follow up equal to or above 10 years and excluding studies at high risk of bias.
Heterogeneity and small study bias assessment
We assessed heterogeneity among included studies using the τ2, I2 and H2 statistics in the forest plots(Reference Higgins, Thompson and Deeks42) when comparing vegetarian/non-vegetarian patterns. For the dose–response analysis, we assessed the influence of variation across included studies with the graphical overlay of study-specific trends using predicted curves in the dose–response analysis risk(Reference Crippa, Discacciati and Bottai43,Reference Murad, Verbeek and Schwingshackl44) . Finally, we assessed publication bias with the presence of small-study effects through graphical presentation in funnel plots and Egger’s test(Reference Egger, Davey Smith and Schneider45), and the trim-and-fill analysis(Reference Duval and Tweedie46).
Results
Study selection
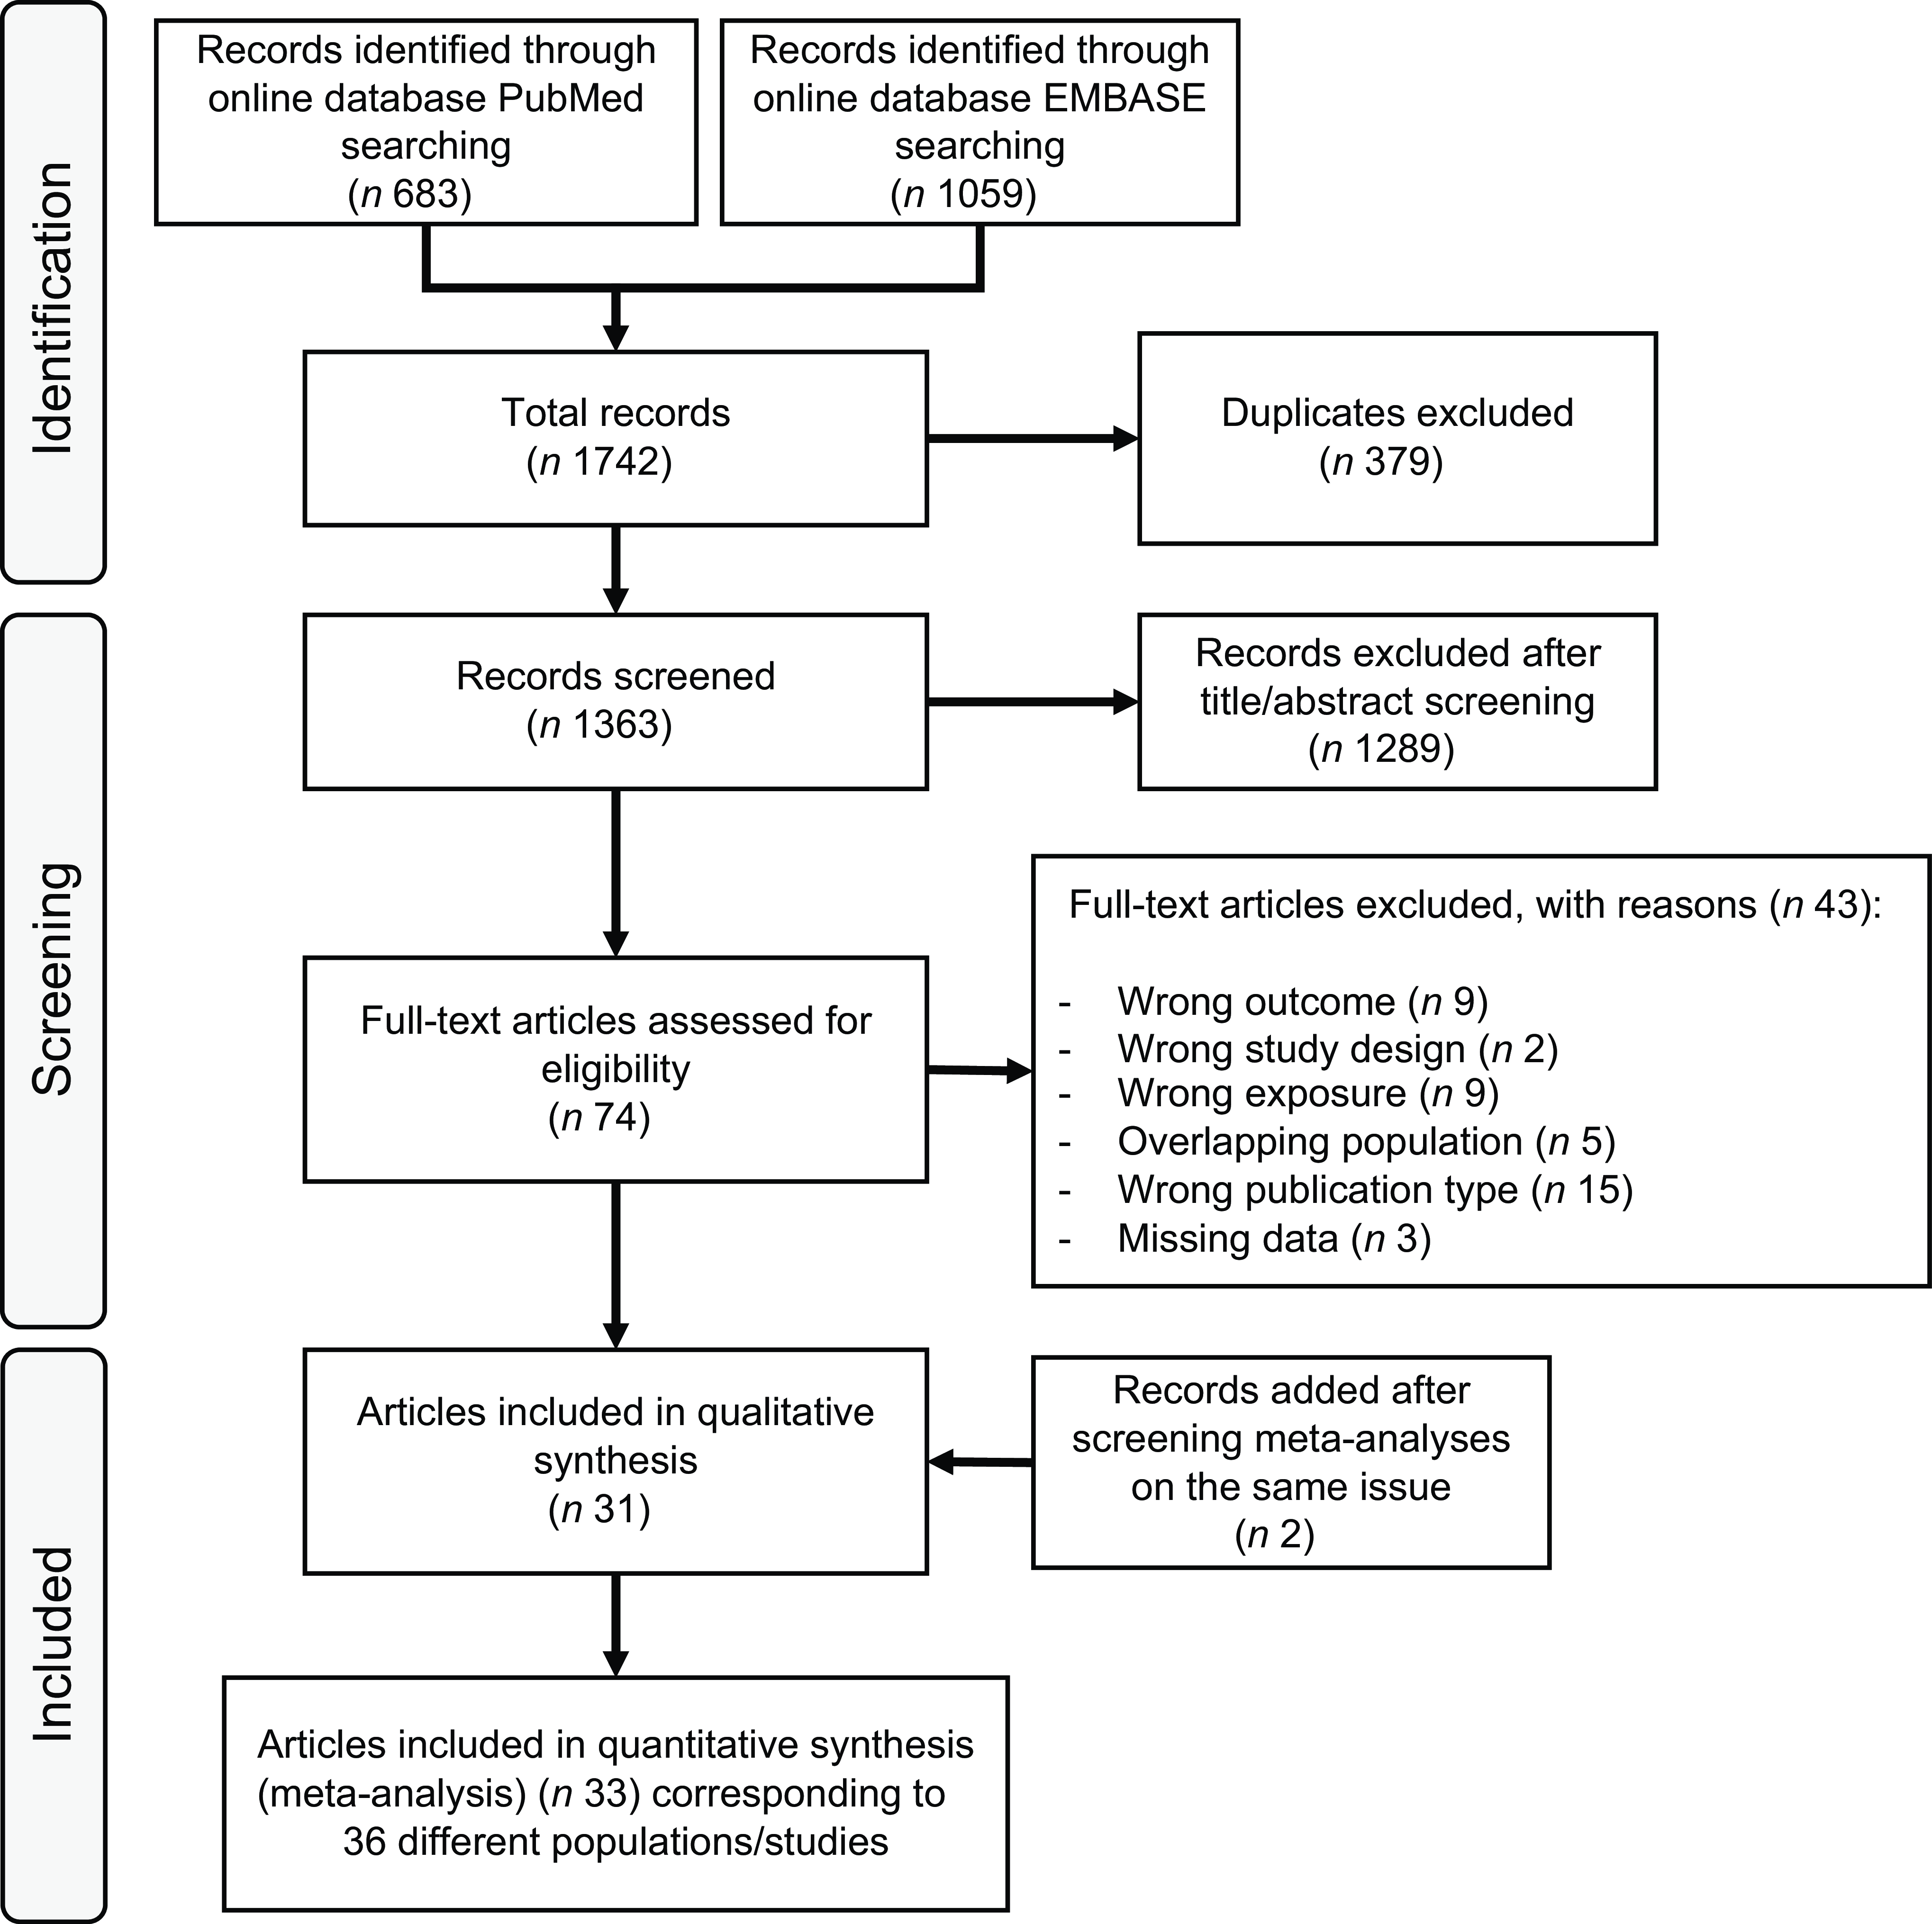
The Preferred Reporting Items for Systematic Reviews and Meta-Analysis flow chart of the literature search is presented in Figure 1. We retrieved 1363 articles after removal of duplicates, and we excluded 1289 articles after title and abstract screening. After full-text assessment of the remaining seventy-four articles, we further excluded forty-three articles because the outcome was not T2D (n 9); the exposure assessment did not include plant-based diet (n 9); the study design was based on a Mendelian randomisation method (n 2); some data were missing (n 3); the publication type (n 15) was wrong or there was a population overlap with some of the studies included (n 5). Two articles were added through backwards citation searching of included studies.

Figure 1. Flow chart of systematic literature search through 10 July 2025.
Characteristics of included studies
Summary characteristics of the thirty-three articles eventually included in this review are reported in Table 1 (Reference Agrawal, Millett and Dhillon47–Reference Zhang, Meng and Wang79). One article(Reference Satija, Bhupathiraju and Rimm70) included three studies (Nurses’ Health Study, Nurses’ Health Study 2 and Health Professionals Follow-Up Study) and another(Reference Jaacks, Kapoor and Singh61) included two cohorts (Centre for Cardiometabolic Risk Reduction in South-Asia and National Health and Nutrition Examination Survey), resulting in a total of thirty-six included studies. Overall, studies were published between 1999 and 2025, with most from Asia (n 14), followed by North America (n 13), Europe (n 7) and Central America (n 2). Of the thirty-six studies included in our analysis, nineteen are cohort(Reference Bhupathiraju, Sawicki and Goon49,Reference Boonpor, Petermann-Rocha and Parra-Soto50,Reference Chen, Koh and Neelakantan52,Reference Chen, Zuurmond and van der Schaft53,Reference Chiu, Pan and Lin55–Reference Flores, Heron and Kim57,Reference Kim and Giovannucci62–Reference Lv, Wu and Liu65,Reference Papier, Appleby and Fensom67,Reference Sullivan, Kim and Caulfield69,Reference Satija, Bhupathiraju and Rimm70,Reference Thompson, Candussi and Tresserra-Rimbau72,Reference Tonstad, Stewart and Oda73,Reference Vang, Singh and Lee75) and seventeen cross-sectional(Reference Agrawal, Millett and Dhillon47,Reference Bharati, Pal and Rekha48,Reference Brathwaite, Fraser and Modeste51,Reference Chiu, Huang and Chiu54,Reference Fraser58–Reference Jaacks, Kapoor and Singh61,Reference Misra, Balagopal and Raj66,Reference Ponzio, Mazzarini and Gasperi68,Reference Shridhar, Dhillon and Bowen71,Reference Tonstad, Butler and Yan74,Reference Yang, Li and Wang76–Reference Zhang, Meng and Wang79) . Regarding prospective studies, the duration of follow-up ranged from 2 to more than 20 years.
Table 1. Characteristics of the included studies divided by design (cohort and cross-sectional)
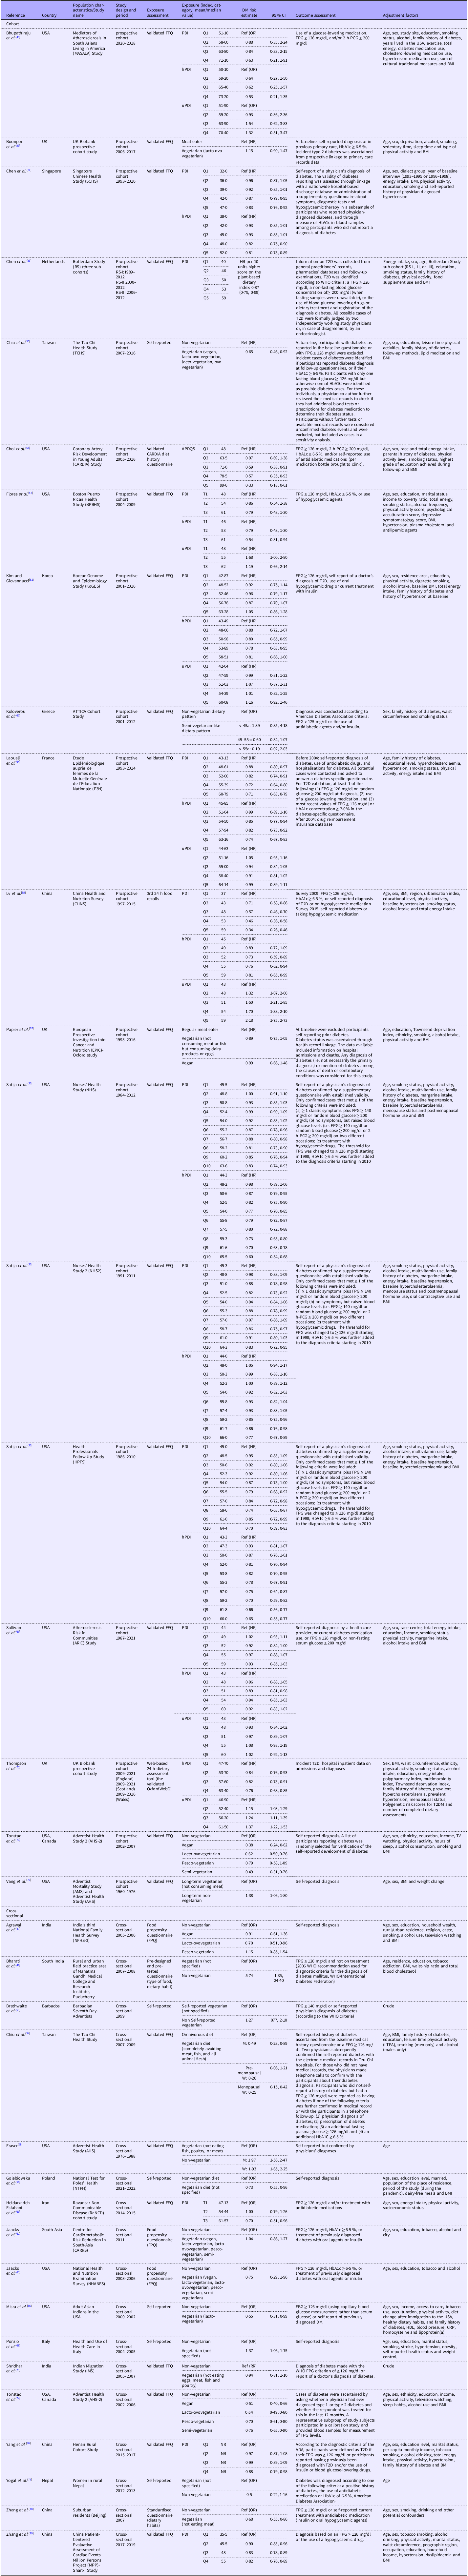
BMI, body mass index; FPG, fasting plasma glucose; 2 h-PCG, 2-h post-challenge glucose concentration; HbA1c: glycosylated Hb; M, males; W, women; NR, not reported; T2D, type 2 diabetes.
Sixteen studies defined adherence to plant-based dietary patterns using a plant-based dietary index, fifteen of them calculated an overall PDI, eleven studies a hPDI and seven studies an uPDI. The remaining twenty studies defined adherence to vegetarian or vegan diets using a priori-defined dietary patterns. Eight studies evaluated specific vegetarian patterns, including vegan, lacto-ovo vegetarian, pesco-vegetarian and semi-vegetarian, while twelve did not stratify the analyses by type of vegetarianism. Specifically, in three studies, the term ‘vegetarian’ referred to a single group of participants adhering to any plant-based dietary patterns, namely vegan, lacto-ovo vegetarian, lacto-vegetarian and ovo-vegetarian(Reference Chiu, Pan and Lin55); and vegan, lacto-ovo vegetarian, lacto-vegetarian, pesco-vegetarian and semi-vegetarian in Centre for Cardiometabolic Risk Reduction in South-Asia and National Health and Nutrition Examination Survey cohorts(Reference Jaacks, Kapoor and Singh61). In nine studies, no definition for vegetarian diet was reported.
Among the studies that assessed adherence using a plant-based dietary index, all but two provided data suitable for dose–response meta-analysis. In one study, exposure doses based on dietary habits assessment were not available(Reference Yang, Li and Wang76); another study did not provide the estimated risk of T2D for each exposure category(Reference Chen, Zuurmond and van der Schaft53).
Risk of bias assessment
Results of study quality assessment by risk of bias are reported in online Supplementary Table S3. Overall, fourteen of the included studies were judged at high risk of bias(Reference Agrawal, Millett and Dhillon47,Reference Brathwaite, Fraser and Modeste51,Reference Chiu, Pan and Lin55,Reference Fraser58,Reference Golebiowska, Zimny-Zajac and Makuch59,Reference Jaacks, Kapoor and Singh61,Reference Koloverou, Panagiotakos and Georgousopoulou63,Reference Misra, Balagopal and Raj66,Reference Ponzio, Mazzarini and Gasperi68,Reference Shridhar, Dhillon and Bowen71,Reference Tonstad, Stewart and Oda73–Reference Vang, Singh and Lee75,Reference Yogal, Shakya and Karmarcharya77) , while five studies were at overall moderate risk of bias(Reference Bharati, Pal and Rekha48,Reference Chen, Koh and Neelakantan52,Reference Chiu, Huang and Chiu54,Reference Satija, Bhupathiraju and Rimm70,Reference Zhang, Qin and Liu78) . Concerning individual domains, six studies were considered at moderate risk of bias due to lack of control for BMI(Reference Fraser58,Reference Heidarzadeh-Esfahani, Darbandi and Khamoushi60,Reference Jaacks, Kapoor and Singh61,Reference Misra, Balagopal and Raj66,Reference Yogal, Shakya and Karmarcharya77,Reference Zhang, Qin and Liu78) and additional two were considered at high risk of bias due to confounding, since they did not implement any multivariable model but reported crude data(Reference Brathwaite, Fraser and Modeste51,Reference Shridhar, Dhillon and Bowen71) . Seven studies were considered at moderate risk of selection bias, because participant selection was linked to a predominantly plant-based diet(Reference Brathwaite, Fraser and Modeste51,Reference Chiu, Huang and Chiu54,Reference Chiu, Pan and Lin55,Reference Fraser58,Reference Tonstad, Stewart and Oda73–Reference Vang, Singh and Lee75) . Regarding information bias, the risk of exposure misclassification was moderate for five studies(Reference Agrawal, Millett and Dhillon47,Reference Bharati, Pal and Rekha48,Reference Brathwaite, Fraser and Modeste51,Reference Jaacks, Kapoor and Singh61,Reference Zhang, Qin and Liu78) because details about questionnaire validation were not specified, while it was high for five studies(Reference Chiu, Pan and Lin55,Reference Golebiowska, Zimny-Zajac and Makuch59,Reference Misra, Balagopal and Raj66,Reference Ponzio, Mazzarini and Gasperi68,Reference Yogal, Shakya and Karmarcharya77) in which vegetarian status was self-reported. As regards bias in departure from intended exposure, six studies were at high risk of bias because exposure levels were not reported(Reference Brathwaite, Fraser and Modeste51,Reference Chiu, Pan and Lin55,Reference Golebiowska, Zimny-Zajac and Makuch59,Reference Misra, Balagopal and Raj66,Reference Ponzio, Mazzarini and Gasperi68,Reference Yogal, Shakya and Karmarcharya77) . Two studies excluded participants due to missing data ≥ 20 %(Reference Koloverou, Panagiotakos and Georgousopoulou63,Reference Tonstad, Butler and Yan74) . Outcome identification was based on self-report in six studies(Reference Chen, Koh and Neelakantan52,Reference Fraser58,Reference Laouali, Shah and MacDonald64,Reference Satija, Bhupathiraju and Rimm70,Reference Tonstad, Stewart and Oda73,Reference Tonstad, Butler and Yan74) , and additional five studies outcome assessment was based on self-report only without external validation, or was not based on international guidelines(Reference Agrawal, Millett and Dhillon47,Reference Golebiowska, Zimny-Zajac and Makuch59,Reference Misra, Balagopal and Raj66,Reference Ponzio, Mazzarini and Gasperi68,Reference Vang, Singh and Lee75) , thus they were considered at high risk of bias. Overall, 58 % of studies were considered at moderate/high risk of bias. Considering high risk of bias only and division by study design, the proportion was much lower in cohort than cross-sectional studies, with respectively 21 % (4/19) and 62 % (10/16).
Quantitative synthesis
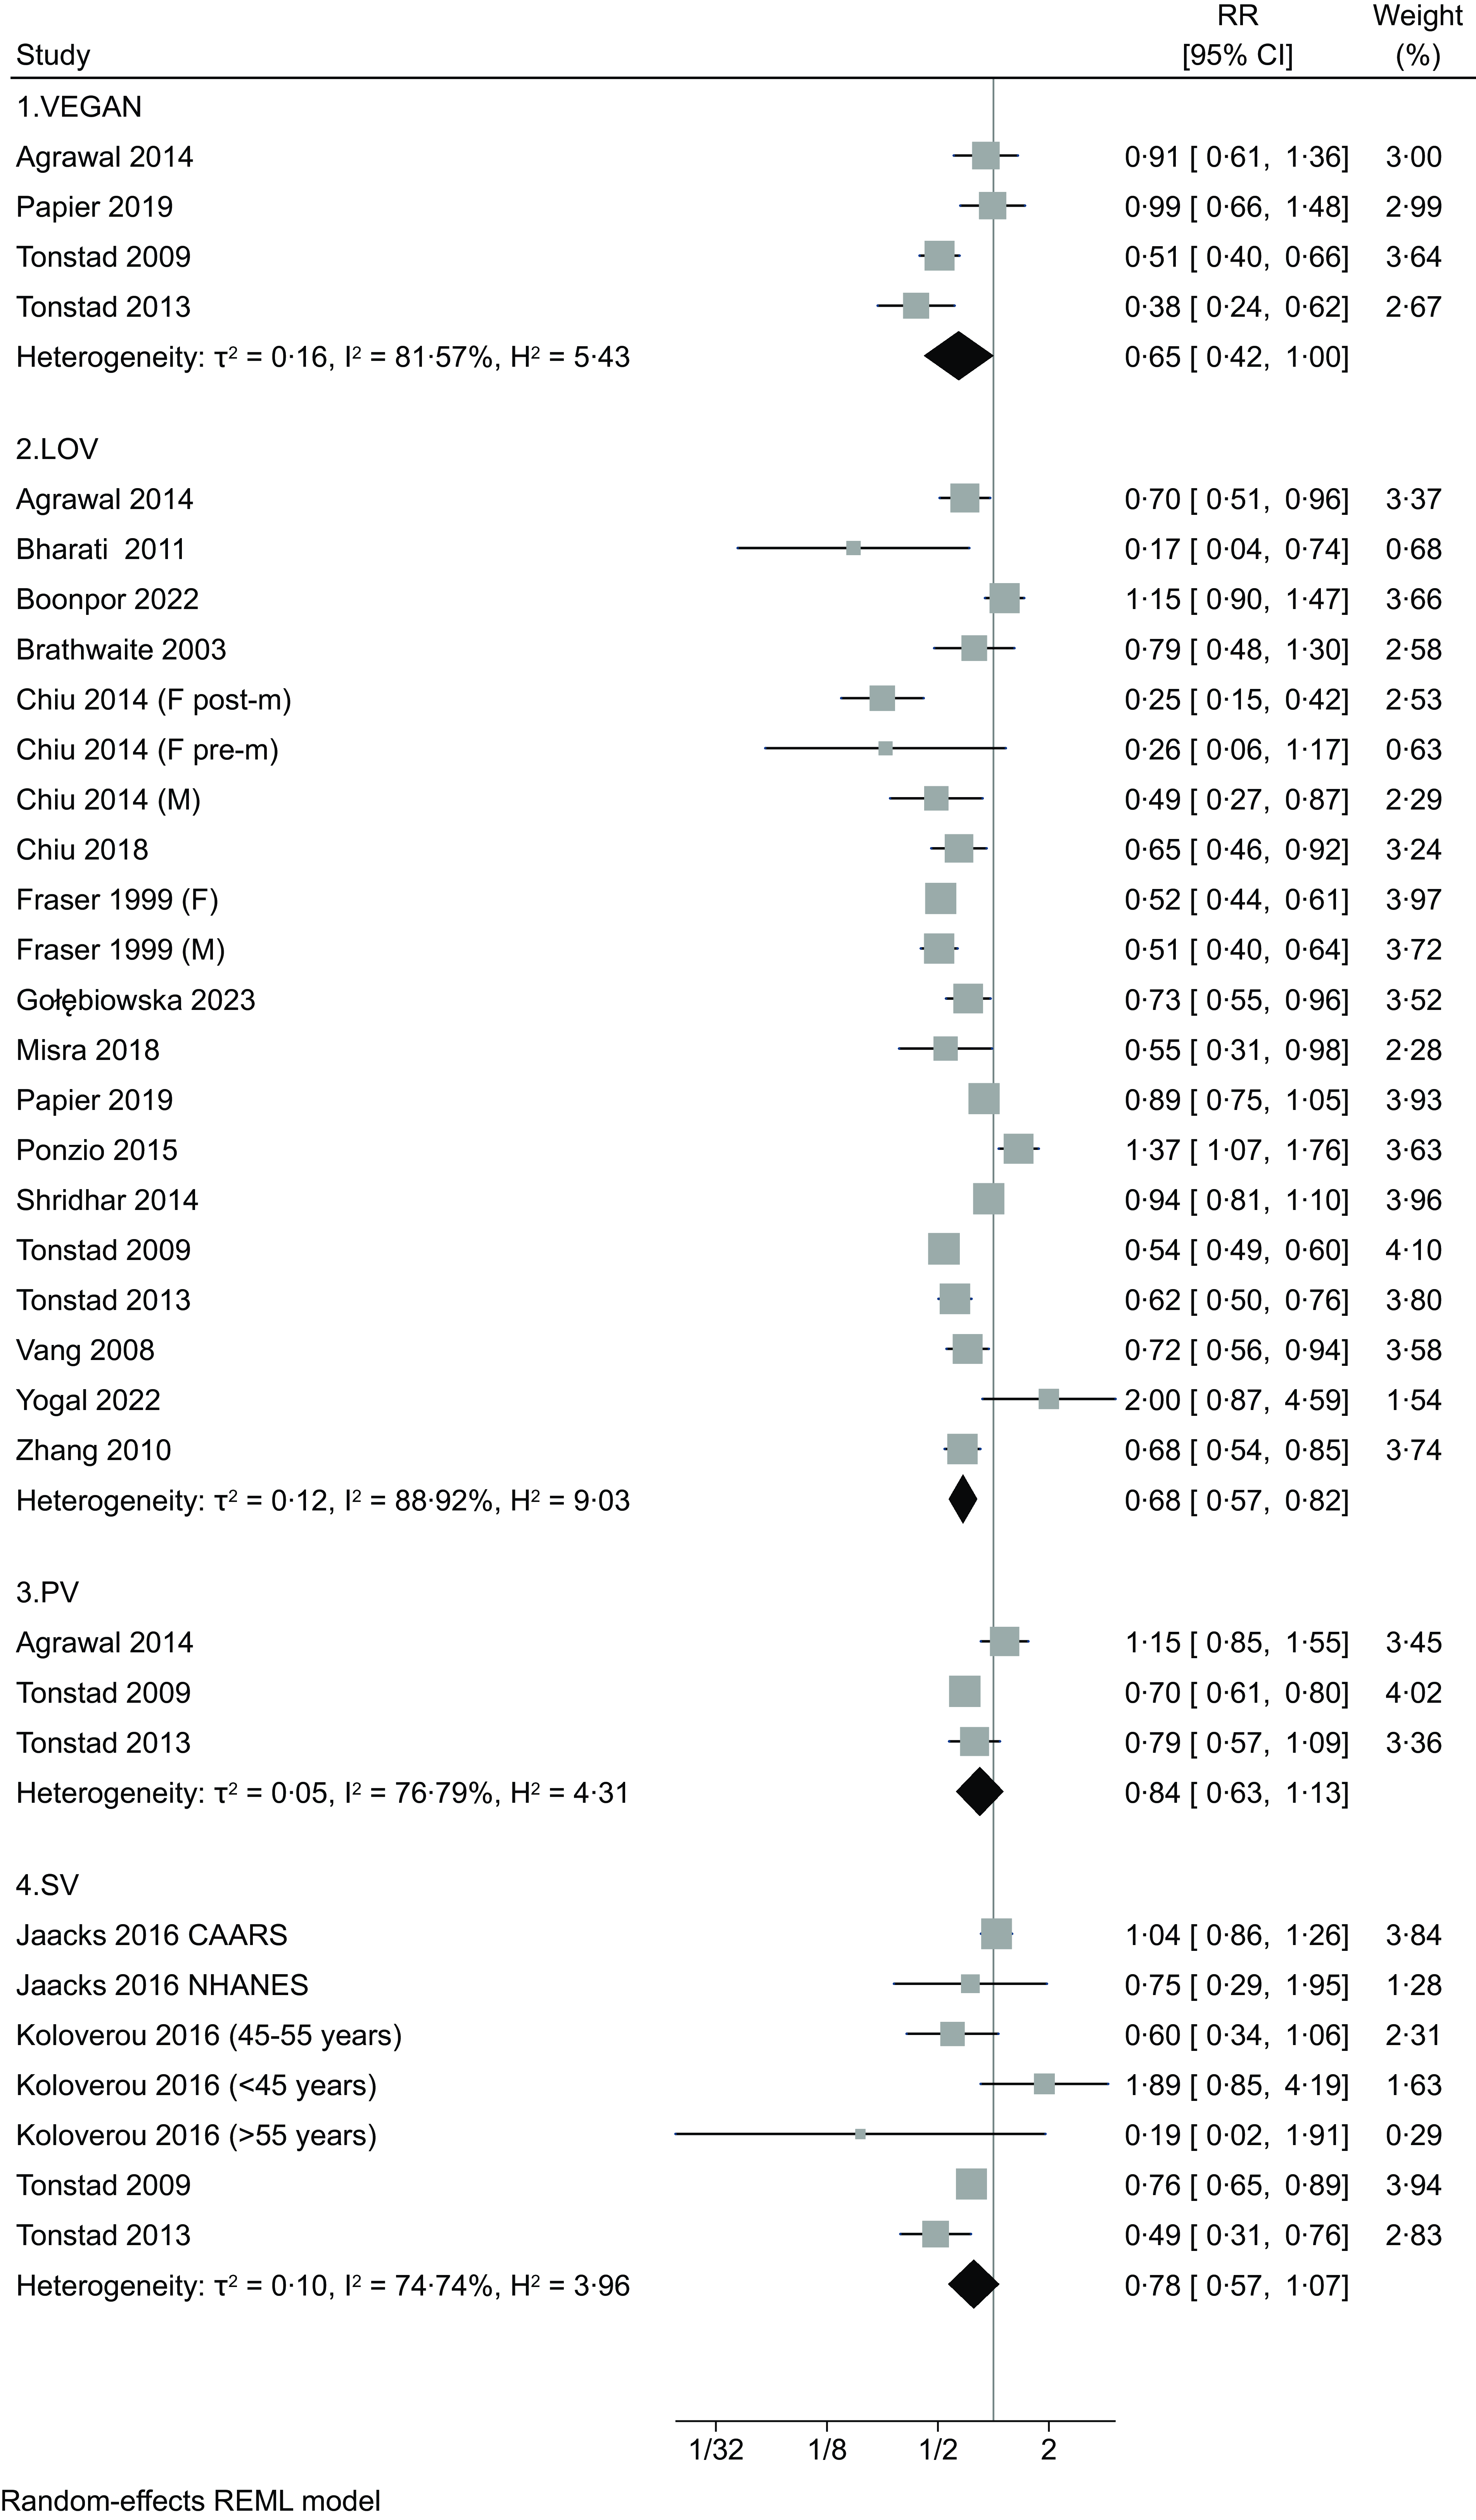
Forest plot analyses comparing the highest v. the lowest adherence to vegetarian/plant-based dietary patterns (Figure 2) showed a negative association with T2D independently from the type of pattern, with RR of 0·65 (95 % CI 0·42, 1·00, four studies, τ2 = 0·16, I2 = 81·57 %), 0·68 (95 % CI 0·57, 0·82, seventeen studies, τ2 = 0·12, I2 = 88·91 %), 0·84 (95 % CI 0·63, 1·13, three studies, τ2 = 0·05, I2 = 76·79 %) and 0·78 (95 % CI 0·57, 1·07, five studies, τ2 = 0·10, I2 = 74·74 %) for vegan, lacto-ovo-vegetarian, pesco-vegetarian and semi-vegetarian, respectively. For studies that defined adherence using a PDI (Figure 3), RR associated comparing extreme categories of intake was 0·76 (95 % CI 0·66, 0·87, fifteen studies, τ2 = 0·06, I2 = 92·28 %). When hPDI and uPDI are considered, RR were 0·75 (95 % 0·69, 0·82, eleven studies, τ2 = 0·01, I2 = 72·65 %) and 1·27 (95 % CI 1·00, 1·60, seven studies, τ2 = 0·07, I2 = 91·30 %), respectively.

Figure 2. Forest plot of the included studies regarding risk of type 2 diabetes comparing the highest v. the lowest adherence to different plant-based dietary patterns (VEGAN: vegan diet; LOV: lacto-ovo-vegetarian diet; PV: pesco-vegetarian diet; SV: semi-vegetarian diet). RR: risk ratio. CI: confidence interval. The area of each grey square is proportional to the inverse of the variant of the estimated RR, and horizontal lines represent the 95 % CI. Black diamonds represent point estimates of overall RR for each group. The solid vertical line represents null effect (RR = 1).
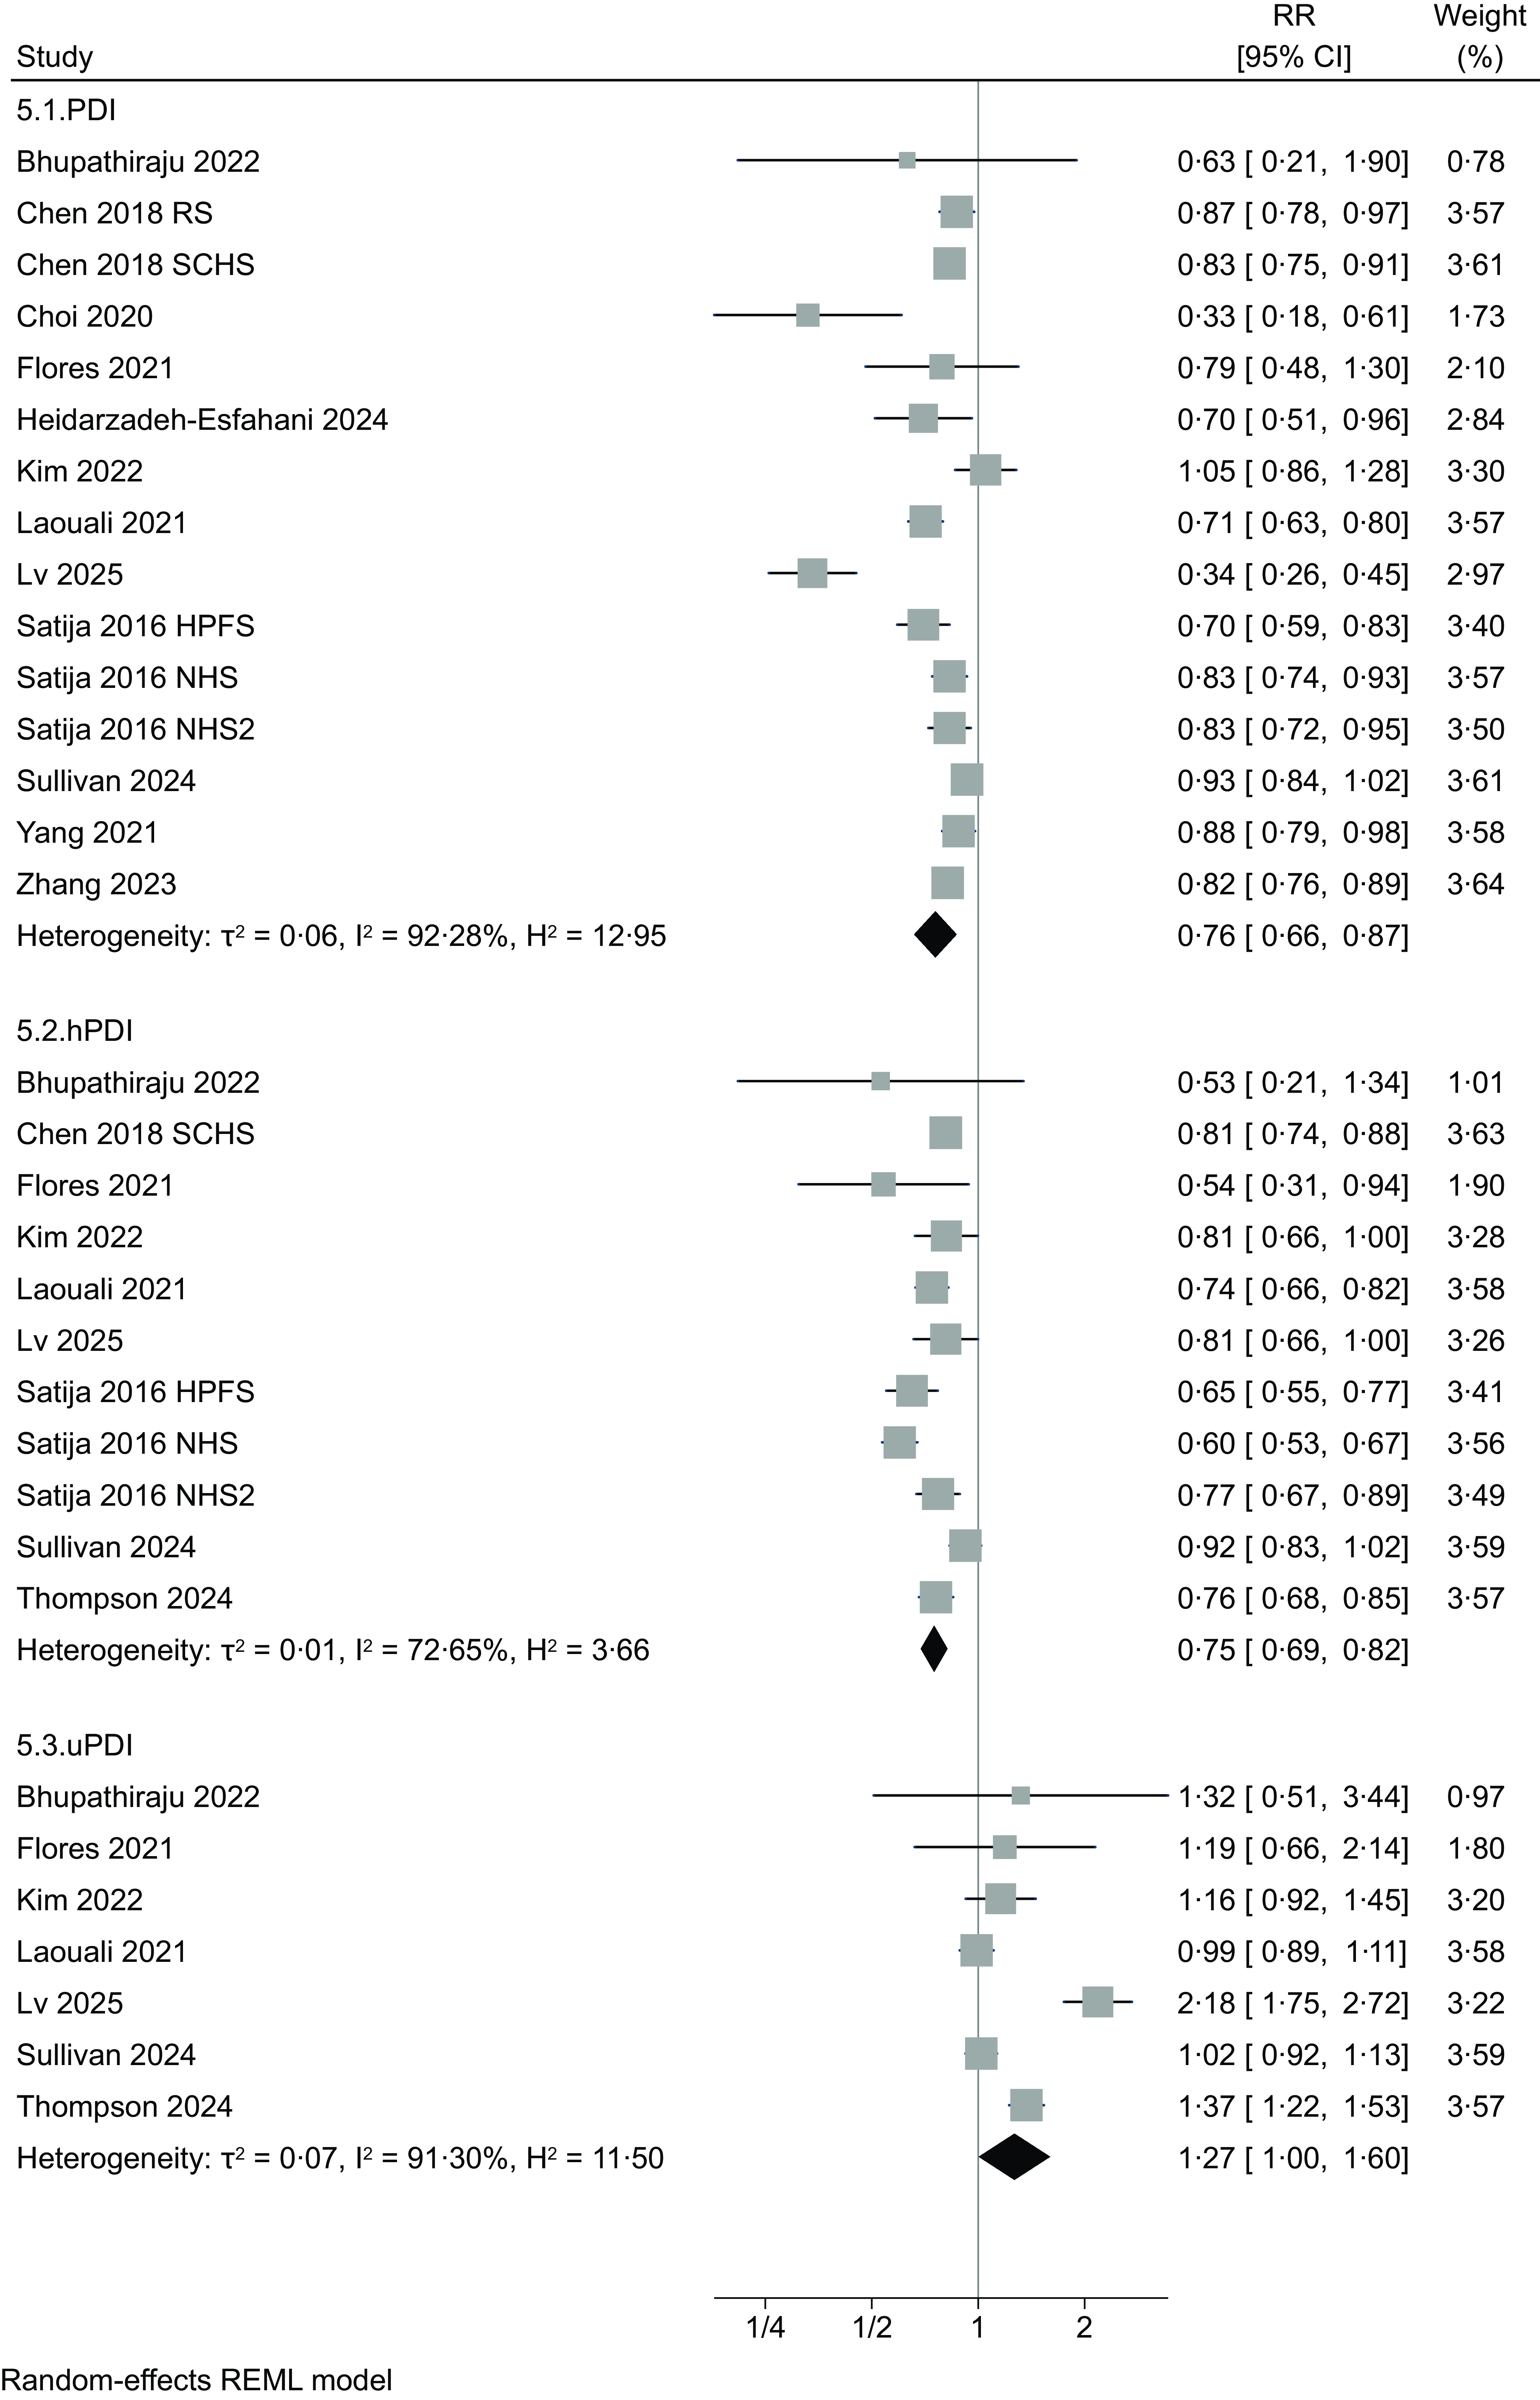
Figure 3. Forest plot of the included studies regarding risk of type 2 diabetes comparing the highest v. the lowest adherence to different plant-based dietary patterns (PDI: plant-based diet index; hPDI: healthy PDI; uPDI: unhealthy PDI) RR: risk ratio. CI: confidence interval. The area of each grey square is proportional to the inverse of the variant of the estimated RR, and horizontal lines represent the 95 % CI. Black diamonds represent point estimates of overall RR for each group. The solid vertical line represents null effect (RR = 1).
In the dose–response meta-analysis, we were able to include results from fourteen studies, assessing adherence to plant-based indices reporting scores for each category of exposure, with higher scores indicating greater adherence. Overall, the analysis based on the assessment of overall PDI available in thirteen studies(Reference Bhupathiraju, Sawicki and Goon49,Reference Chen, Koh and Neelakantan52,Reference Choi, Larson and Gallaher56,Reference Flores, Heron and Kim57,Reference Heidarzadeh-Esfahani, Darbandi and Khamoushi60,Reference Kim and Giovannucci62,Reference Laouali, Shah and MacDonald64,Reference Lv, Wu and Liu65,Reference Sullivan, Kim and Caulfield69,Reference Satija, Bhupathiraju and Rimm70,Reference Zhang, Meng and Wang79) showed an inverse and almost linear relationship with T2D risk (Figure 4). Similarly, the analysis assessing the hPDI, based on eleven studies(Reference Bhupathiraju, Sawicki and Goon49,Reference Chen, Koh and Neelakantan52,Reference Flores, Heron and Kim57,Reference Kim and Giovannucci62,Reference Laouali, Shah and MacDonald64,Reference Lv, Wu and Liu65,Reference Sullivan, Kim and Caulfield69,Reference Satija, Bhupathiraju and Rimm70,Reference Thompson, Candussi and Tresserra-Rimbau72) , indicated a substantially linear, negative association with T2D risk for increasing adherence to hPDI (Figure 4). Conversely, the meta-analysis of results of the seven studies(Reference Bhupathiraju, Sawicki and Goon49,Reference Flores, Heron and Kim57,Reference Kim and Giovannucci62,Reference Laouali, Shah and MacDonald64,Reference Lv, Wu and Liu65,Reference Sullivan, Kim and Caulfield69,Reference Thompson, Candussi and Tresserra-Rimbau72) measuring adherence to uPDI showed a linear positive association with T2D risk for increasing levels of uPDI adherence (Figure 4).
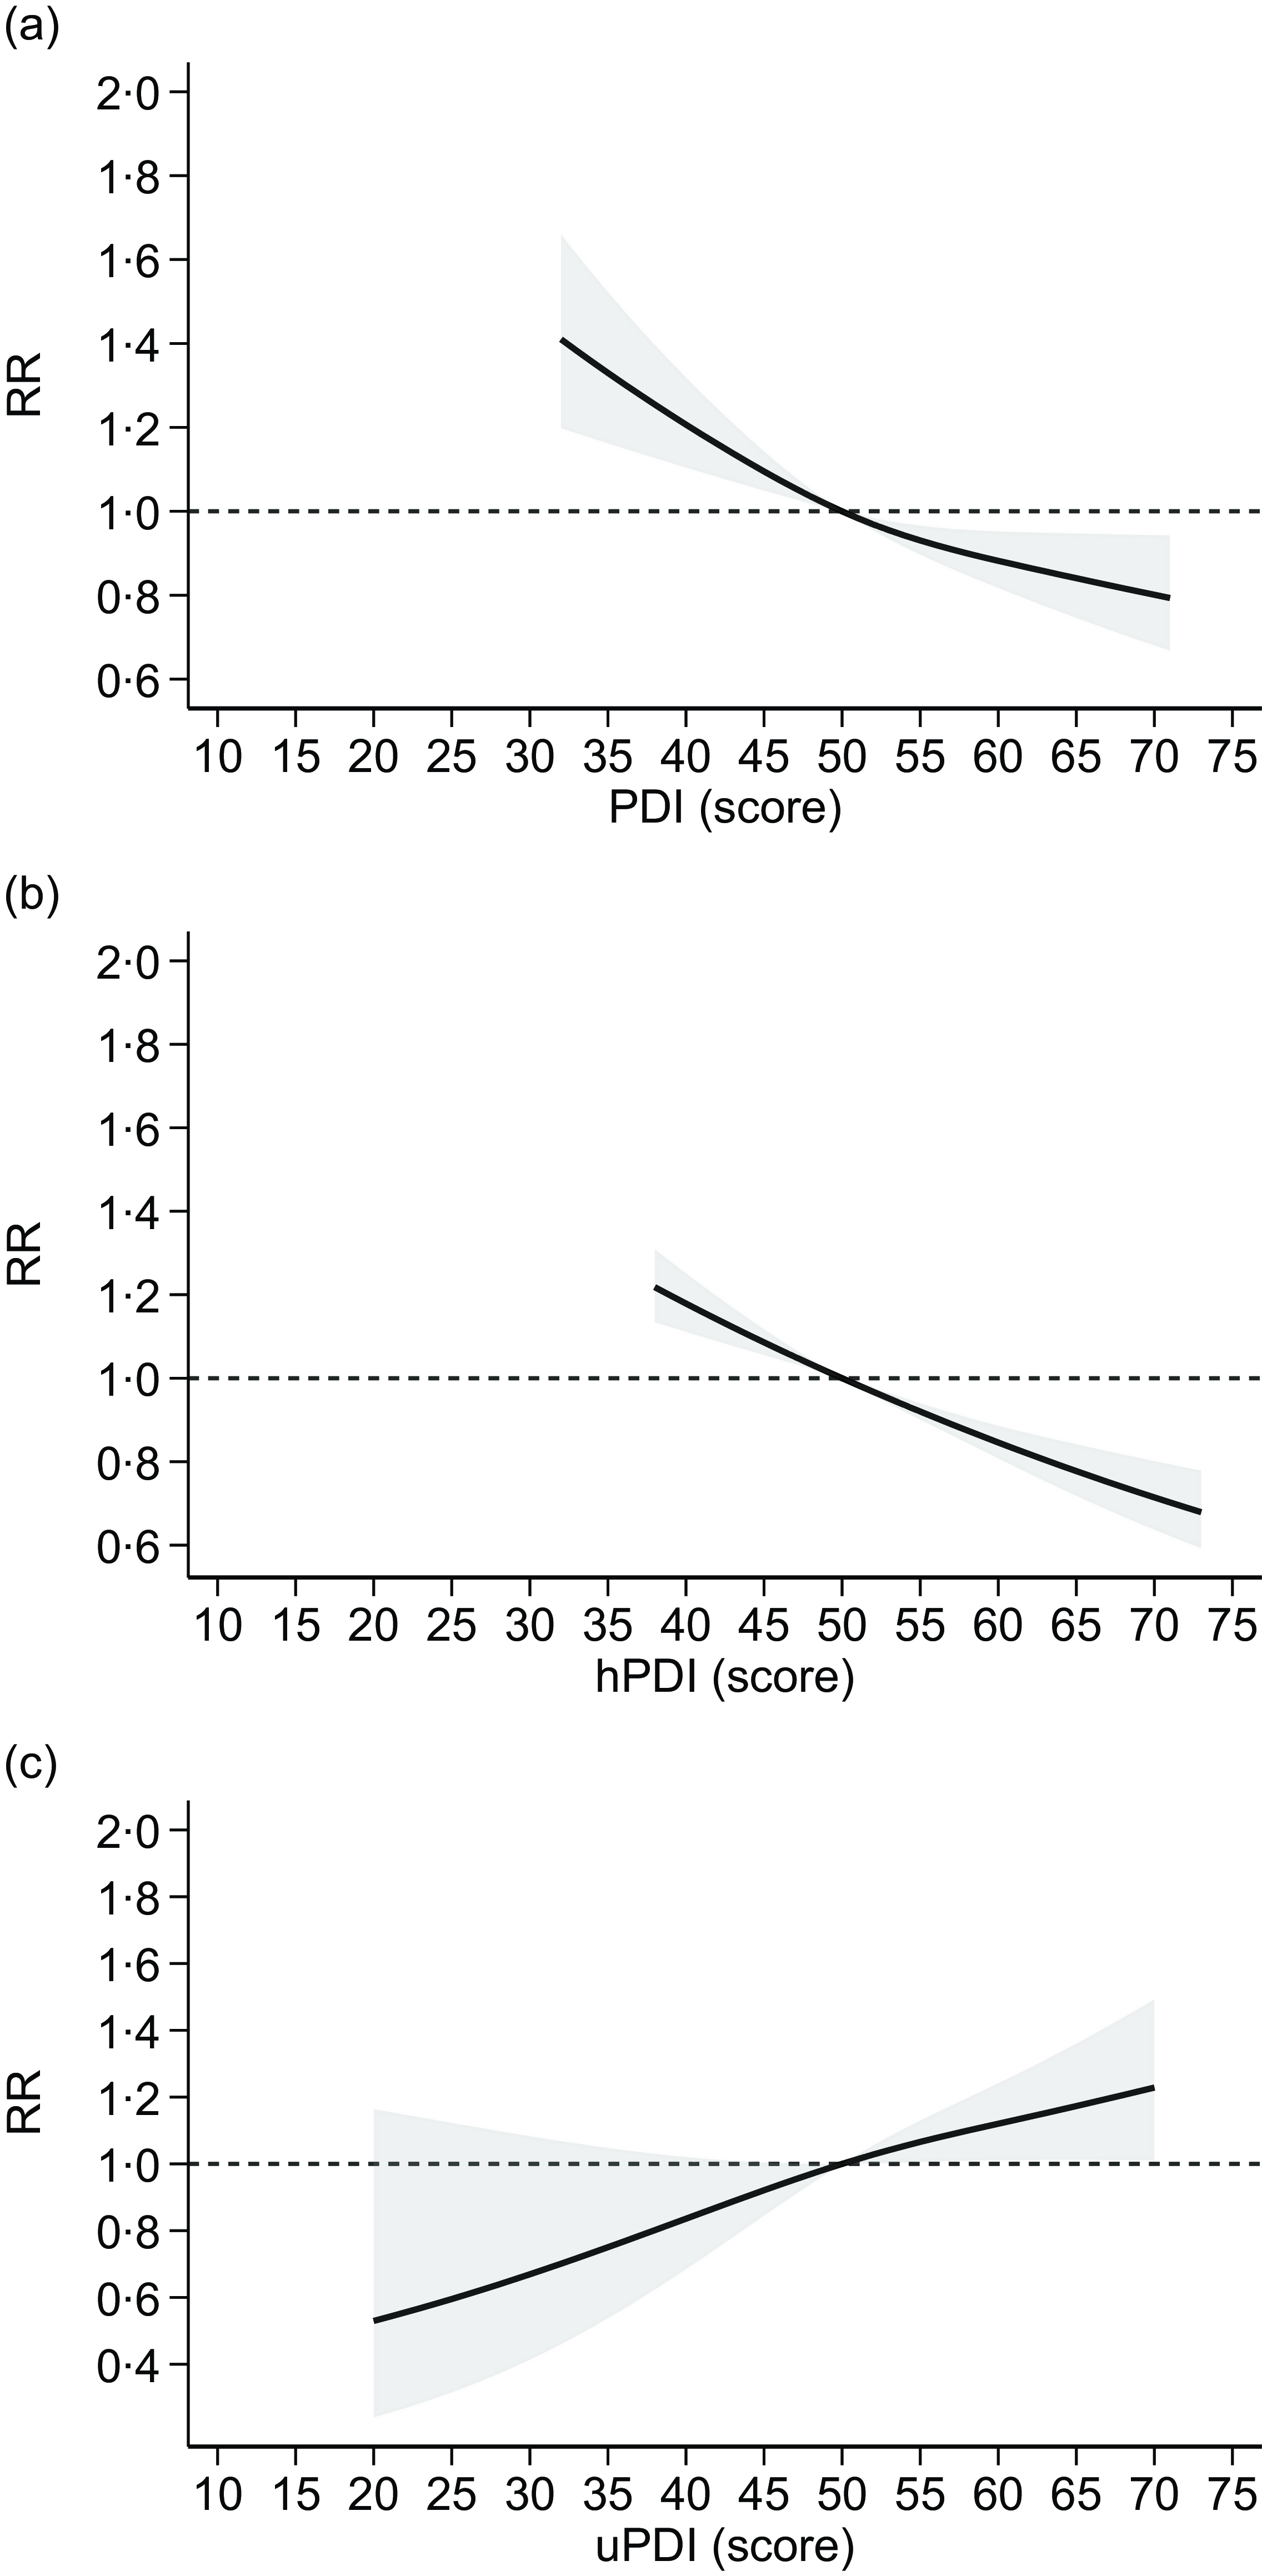
Figure 4. Dose–response meta-analysis of risk of type 2 diabetes according to adherence to plant-based dietary patterns ((a): PDI: plant-based diet index; (b): hPDI: healthy PDI; (c): uPDI: unhealthy PDI). Spline curve (solid line) with 95 % confidence limits (grey area). RR: risk ratio. The curves are designed using restricted cubic spline method using three knots at fixed cutpoints (tenth, fiftieth and ninetieth percentiles) and considering the median value (fiftieth) of such distribution as reference point. The short-dashed line represents the null effect, RR = 1.
Stratified analyses by region showed substantially similar results in Western populations to those obtained from the overall analysis, when the highest v. the lowest adherence to vegetarian dietary patterns were compared. In Asian populations, only adherence to lacto-ovo-vegetarian diet showed a negative association with T2D risk, although only one study for each of the other dietary patterns (i.e. vegan, pesco-vegetarian and semi-vegetarian) was available for the analysis (online Supplementary Figures S1–S2). Stratified analysis by region considering the highest v. the lowest adherence to plant-based dietary patterns showed similar results in both Western and Asian populations, with lower T2D risk for PDI and hPDI, and higher risk of uPDI, although the number of studies carried out in Asia is more limited (online Supplementary Figures S3–S4).
Similarly, a negative linear association between increasing PDI and hPDI adherence and T2D risk emerged both in Western and in Asian populations, although levels of adherence were generally higher in the former. Consistent with the forest-plot analysis, uPDI showed a positive association with T2D risk in Western populations, while for Asia, two studies were available and the analysis could not be performed (online Supplementary Figure S5).
Sensitivity analyses
The analysis limited to cohort studies confirmed the overall RR comparing the highest v. the lowest adherence to vegetarian dietary patterns (online Supplementary Figure S6) as well as using plant-based dietary patterns (PDI, hPDI and uPDI), in both the forest plot (online Supplementary Figure S7) and in the dose–response meta-analysis (online Supplementary Figure S8).
Further restricting the analysis to cohort studies with more than 10 years of follow-up, we found a negative association between lacto-ovo-vegetarian (two studies) and semi-vegetarian diets (one study) and T2D risk, while one study for vegan diet showed null association (online Supplementary Figure S9). No studies were available for pesco-vegetarian diets with more than 10 years of follow-up. As regards plant-based patterns, results were almost identical to those in the main analysis in both the forest plot (online Supplementary Figure S10) and in the dose–response meta-analysis (online Supplementary Figure S11), although based on a lower number of studies.
Exclusion of the fifteen studies deemed at high risk of bias could allow an analysis only for lacto-ovo-vegetarian diet, showing a negative association with T2D risk, as no studies remained available for pesco-vegetarian and semi-vegetarian diets, and the one study on vegan diet showed null association (online Supplementary Figure S12). Finally, studies that assessed adherence using PDI, hPDI and uPDI showed almost identical results to those in the overall analysis, in both the forest plot (online Supplementary Figure S13) and in the dose–response meta-analysis (online Supplementary Figure S14), since no studies were judged at high risk of bias.
Funnel plots based on the different exposure assessment methods did not indicate risk of small-study effects, as also shown by results of Egger’s test (online Supplementary Figure S15), with no studies added in the trim-and-fill analysis. Finally, study-specific curves showed substantial homogeneous trends for all studies included in dose–response analyses except for one study in the overall PDI, showing a much steeper decrease in risk (online Supplementary Figure S16).
Discussion
In this review, we found fairly consistent evidence that adherence to vegetarian and plant-based diets is associated with a lower risk of T2D. This was particularly true for studies comparing lacto-ovo-vegetarian compared with pesco- and semi-vegetarian diets. Similarly, we observed an inverse and almost linear association between overall PDI and disease risk, driven by increasing adherence to a hPDI, characterised by higher intakes of whole grains, fruits and vegetables. Conversely, our analyses showed that adherence to a uPDI may, in fact, increase T2D risk, which is likely due to a higher intake of processed foods and refined carbohydrates, although of plant-based origin.
Our review took advantage of newly available studies that contributed to the implementation of several stratified and sensitivity analyses compared with previous investigations on the same topic(Reference Qian, Liu and Hu13,Reference Nikparast, Mirzaei and Tadayoni31) . In addition, the availability of advanced statistical techniques allowed us to implement dose–response meta-analysis also for uPDI, never reported previously. As a consequence, our findings allowed us to investigate the relationship between vegetarian/vegan and plant-based diets in more depth. The important conclusion of this analysis was that their beneficial effects are only observed if accompanied by an increased intake of a range of ‘healthy’ foods, including whole grains, raw and cooked vegetables, legumes, nuts, fruits, vegetable oils and tea and coffee, not just by limiting the intake of meat products.
Mechanisms for the beneficial effects of increasing adherence to vegetarian and more broadly plant-based diets may include anti-inflammatory and antioxidant effects relating to the increased intake of fibre and polyphenols(Reference Ma, Hebert and Li80–Reference Haghighatdoost, Bellissimo and Totosy de Zepetnek82) contained in whole grains, fruit and vegetables. These dietary factors are recognised to be associated with a lower risk of T2D in previous epidemiological studies(Reference Aune, Norat and Romundstad23,Reference Fung, Hu and Pereira83–Reference Krishnan, Rosenberg and Singer86) . Polyphenols have been shown to improve endothelial function, which has been correlated with insulin resistance and interactions with molecular targets that affect insulin signalling, resulting in an improvement in glycaemia and suppression of gluconeogenesis(Reference Babu, Liu and Gilbert87,Reference Hossain, Wazed and Asha88) . Insoluble fibre lowers post-prandial blood glucose and insulin through slower absorption and a reduced level of absorbed carbohydrate(Reference Nyambe-Silavwe and Williamson89). Fibre intake is associated with favourable profiles of gut microbiota(Reference Wang, Peters and Yu90) that have been linked to decreased risk of T2D(Reference Greenberg and Brunt91,Reference Kinoshita, Ozato and Yamaguchi92) . Similarly, adherence to plant-based and vegetarian diets can alter levels of prebiotics, microbial composition and production of microbial metabolites compared with omnivorous diet, thus affecting glycaemic control and T2D risk(Reference Dimba, Mzimela and Sosibo93–Reference Tomova, Bukovsky and Rembert96). An additional mechanism of plant-based diets in lowering T2D risk is through weight control: in relation to this, experimental trials reported that the consumption of a vegetarian diet led to a reduction in body weight compared with an omnivorous diet(Reference Barnard, Levin and Yokoyama97).
Subjects following vegetarian or plant-based diets demonstrated lower risk of insulin resistance(Reference Chen, Zuurmond and van der Schaft53,Reference Kahleova, Matoulek and Malinska98) . Similarly, high intakes of saturated fatty acids are thought to decrease insulin sensitivity(Reference Feskens, Sluik and van Woudenbergh99,Reference Wolk100) , further supporting the detrimental effects of too high intake of meat products(Reference Wolk100,Reference de Medeiros, Mesquita and Lima101) . Interestingly, a study comparing the prevalence of impaired glucose tolerance amongst Australian women(Reference Baleato, Ferguson and Oldmeadow102) adhering to different diets (vegan, lacto-ovo vegetarian, pesco-vegetarian, semi-vegetarian and meat eaters) found lower impaired glucose tolerance in subjects following a vegetarian diet (0–1·2 %) compared with regular meat eaters (9·1 %). Source of proteins can also affect risk of T2D, with increased risk for moderate-high animal protein intake, whereas it is the opposite with higher intake of plant proteins(Reference Malik, Li and Tobias103,Reference Ye, Yu and Mai104) . Similarly, the switch in energy intake from animal to plant proteins was associated with lower T2D risk(Reference Virtanen, Koskinen and Voutilainen105). Finally, there are many studies that report a beneficial relationship between plant-based diets and other chronic diseases, including metabolic syndrome and dyslipidaemia(Reference Nikparast, Etesami and Rahmani106–Reference Thomas, Calle and Fernandez108).
In spite of the recognised beneficial effects of vegetarian and vegan diets, several studies and guidelines indicate that animal foods might not be totally excluded due to their important contribution to the dietary intake of certain nutrients, including n-3 fatty acids, calcium and vitamin D, vitamin B12, selenium, zinc and iron(Reference Craig109–Reference Filippini, Cilloni and Malavolti113). There is a need to properly plan food intake in order to ensure adequate intake of these nutrients(Reference Agnoli, Baroni and Bertini114) and/or to use supplements and fortified food products(Reference Schupbach, Wegmuller and Berguerand115). It should be noted that in the included studies investigating adherence to PDI, subjects in the highest category reported limited but not zero intake of animal products. As also indicated by the differential (and even opposite) results for hPDI and uPDI in the relationship with T2D risk, limitation of intake of animal foods alone does not appear to be enough for disease prevention(Reference Zhuang, Wang and Yao116). Recommendations to limit processed foods like refined grains, sweets and sugar-sweetened beverages, along with weight control and increased physical activity, and lower intake of other dietary and environmental factors associated with increased T2D risk(Reference Ferrante, Rapisarda and Castrogiovanni117–Reference Vincent120) are clearly fundamental(Reference Halton, Willett and Liu26–Reference Mozaffarian, Hao and Rimm28,Reference Soriguer, Colomo and Olveira30) . Therefore, our findings suggest that guidelines for T2D prevention should consider the inclusion of a higher adherence to healthy plant-based and vegetarian diets. These dietary recommendations linked to our findings are in line with the beneficial role of other dietary patterns considered healthy in lowering T2D risk, especially the Mediterranean diet and the Dietary Approach to Stop-Hypertension(Reference Quan, Shen and Li121,Reference Sarsangi, Salehi-Abargouei and Ebrahimpour-Koujan122) characterised by lower intake of salt, highly processed foods and sweet products in addition to meat and meat products(Reference Sacks, Obarzanek and Windhauser123,Reference Trichopoulou and Lagiou124) . Nonetheless, beneficial effects of vegan/vegetarian diet have also been reported for the management of T2D, lowering Hb1Ac levels and improving insulin sensitivity(Reference Guest, Raj and Landry125,Reference Lopez-Moreno, Fresan and Del Coso126) , especially if characterised by high-protein content(Reference Whelehan, Dirks and West127).
Some limitations of the review should be noted. The restricted number of studies on some subtypes of vegetarian diets hampered the implementation of meaningful stratified analyses, especially those of cohort design with longer follow-up. In addition, the lack of reporting of quantitative assessment of adherence to vegan and vegetarian diets prevented a dose–response analysis of such associations. In addition, there was some heterogeneity in outcome ascertainment (T2D diagnosis) across the studies, being generally self-reported in studies investigating vegetarian and vegan diets, while relying on medical records when using plant-based indices. Nonetheless, we took into account these methodological issues within the risk of bias assessment, and we found substantially homogenous results among included studies in both forest-plots and dose–response curves, as when we excluded studies at overall high risk of bias. Specifically, none of the studies using plant-based indices for exposure assessment were judged at high risk of bias. Strengths of the review include the implementation of analysis stratified by type of vegan/vegetarian diet as well as for overall PDI and divided into hPDI and uPDI. Finally, low risk of publication bias further strengthens the quality of our findings, especially when considering cohort studies only, characterised by higher methodological quality compared with the remaining observational studies.
In conclusion, this review indicates that healthy plant foods, including whole grains, vegetables, fruits, legumes and nuts, may protect against T2D in an almost linear fashion, while unhealthy plant-based diets are not beneficial and may even increase disease risk at high levels.
Supplementary material
For supplementary material/s referred to in this article, please visit https://doi.org/10.1017/S0007114525104157
Acknowledgements
We thank authors who provided helpful details to perform data analysis: Shilpa Bhupathiraju and Caleigh Sawicki of Harvard University, USA; Jihye Kim of Kyung Hee University, South Korea and Edward Giovannucci of Harvard University, USA; Shaoyong Xu of Xiangyang Central Hospital, China; Krithiga Shridhar of Centre for Chronic Conditions and Injuries, Public Health Foundation of India.
Financial Support
This study was supported by grant ‘PRIN 2022 PNRR’ (no. P20229KSXB) from the Italian Ministry of University and Research (MUR) funded by European Union – Next Generation EU, and by grant ‘UNIMORE FAR 2023’ from the University of Modena and Reggio Emilia. TF was also supported by ‘PRIN 2022’ (no. 2022MHMRPR) from the Italian Ministry of University and Research (MUR) funded by European Union – Next Generation EU.
T. F. and M. V. conceived the study; A. M. retrieved and selected relevant articles, and extracted data with the supervision of T. F., performed the statistical analysis, interpreted the data with substantial contribution of M. M., S.F-T., S.P., M.V. and T.F.; A.M., M.M. and T.F. prepared the first draft manuscript with substantial contribution of all other authors; all authors read and approved the final manuscript.
The authors declare that they have no known competing financial interests or personal relationships that could have appeared to influence the work reported in this paper.
Data described in the manuscript, code book and analytic code will be made available upon request pending an application and the approval of the corresponding author.


 Open access