

Introduction
Immigration topics dominate the political agenda in many European countries. One important issue regards the optimal settlement of refugees and asylum seekers that have been granted permanent residency. Should they be free to settle where they prefer, should the government settle them only in regions with booming labour markets, or should they be dispersed across the country to avoid concentration of immigrants in some areas? These are important decisions, since recent research suggests that the gains from a better matching of refugees to regions are large (Bansak et al. Reference Bansak, Ferwerda, Hainmueller, Dillon, Hangartner, Lawrence and Weinstein2018).
One potentially important impediment to placement policies that targets optimal refugee‐labour market matching is negative voter reactions to settlements. The political costs of implementing what might be an optimal placement policy can be high if it results in political backlash. These costs can be high even if the total number of refugees settled in the municipality is low, as research shows that voters are more sensitive to sudden changes in immigration than to levels (Hopkins Reference Hopkins2010; Kaufmann Reference Kaufmann2017), and because the policy debate might heighten the salience of the immigration issue among voters.
In this paper we study the electoral consequences of a change in settlement policy in Norway. One goal of the new policy of the central government was to better disperse refugees and asylum seekers across the country. Although to settle refugees is and has always been voluntary for Norwegian municipalities, the new policy included bureaucratic and financial means which led some municipalities to settle refugees for the first time. The policy change was initiated by the central government and happened quickly within the election cycle, which makes it possible to identify the political effects of the policy change in a difference‐in‐differences framework. By explicitly connecting changes in settlement policy to electoral outcomes we contribute to the scarce literature on this topic.
We put forward three hypotheses on the electoral effects of settling refugees. The first hypothesis is that accepting refugees for the first time will create tensions that will shift the political centre of gravity in a right‐wing direction. This expectation builds on a large literature that points to feelings of threat from competition over jobs or access to public benefits and services, or concerns about cultural change, in the wake of immigrant inflows (see e.g. Hainmueller & Hopkins Reference Hainmueller and Hopkins2014, and discussion below). Since local settlement is ultimately decided at the local level, local politicians must have underestimated the latent feeling of threat from settlements for this effect to apply in our case.
Our second hypothesis is that the rightward shift in voter sentiments may be counteracted by successful refugee integration in the local community. While most previous literature on voter responses to immigration points to mechanisms that move the electorate to the right (Arzheimer Reference Arzheimer and Rydgren2018), our study points to successful integration performance as a potential mechanism that might move (parts of) the electorate to the left. Immigration views are shaped by perceptions of refugee integration costs (Bansak et al. Reference Bansak, Hainmueller and Hangartner2016; Ward Reference Ward2019) and settling refugees for the first time can imply a shock in these perceptions. If the local community fails to successfully integrate refugees, voters will receive a negative signal and might become less inclined to vote for parties with a liberal immigration policy platform. The opposite might occur if integration is successful. Successful integration may therefore shift part of the electorate in a left‐wing direction. By using administrative data, survey data and data on vote shares, we investigate whether municipalities that settle for the first time are successful in their refugee integration, and whether integration outcomes matter for voter responses. The linking of integration outcomes to voter responses is new in the literature and is one of the main contributions of our paper.
Our third hypothesis is that settling refugees for the first time can cause voter polarization. Voters’ perceptions of refugee immigration can be shaped by ideological pre‐dispositions (Dinesen et al. Reference Dinesen, Klemmensen and Nørgaard2016; Johnston et al. Reference Johnston, Newman and Velez2015), which means that while some voters receive the integration signal and for example perceive the settlements as a success story, perceptions of threat and uncertainty might be activated among others that ignore the signal or place more weight on other types of information. Such divergent responses can easily co‐exist in the electorate if they are shaped by pre‐dispositions. If centre‐left voters move further to the left when their perceptions of refugee immigration improve, while centre‐right voters move further right when threat perceptions are activated (Stenner & Haidt Reference Stenner, Haidt and Sunnstein2018), we will observe polarization in local vote shares (see also Finseraas et al. Reference Finseraas, Røed and Schøne2017). By using vote shares at the local level, we measure whether polarization increased in the municipalities that received refugees for the first time. In addition, by using survey data with information about ideological pre‐dispositions, we investigate how perceptions about refugee integration vary across ideological pre‐dispositions, arguing that such heterogeneity is a key mechanism behind polarization.
We find no evidence of a uniform shift in the political centre of gravity in affected municipalities compared to a set of control municipalities, but we do find stronger political polarization in municipalities that settled refugees for the first time (“the treatment group”). The polarization is because parties on opposite sides on the immigration dimension improve their vote shares in the treated municipalities, compared to the change in the comparison group. Moreover, survey data reveal that respondents in treated municipalities report more positive views on refugee integration in the post‐treatment period. This effect is driven by left‐wing respondents, which provides support for the argument that some voters move to the left because of a positive shock in the perceived costs of refugee integration. This perception among the voters is supported by administrative data, as we find that refugees who were settled in the new settlement municipalities had higher labour force participation and lower probability of moving out of the municipality.
Thus, the policy change appears to have had its intended effects on refugee integration, without provoking strong local opposition at the mean. Means to improve refugee integration at the local level therefore seems to be a potential strategy to counter some of the negative voter responses. The electorate is, however, more polarized after the policy change and the question remains whether increased polarization also represents a threat to the political sustainability of local refugee settlements.
Immigration to Norway and refugee settlement policy
Norway has historically been ethnically homogenous, but immigration has been high over the last decades. Bratsberg et al. (Reference Bratsberg, Raaum and Røed2017) show that the increase is mainly due to high levels of labour immigration after the 2004 expansion of the European Economic Area, but the numbers of refugees, asylum seekers, and family reunifications have also increased. In January 2017, 13.8 per cent of the population had an immigrant background (Sandnes Reference Sandnes and Sandnes2017: 12).
There have been two large waves of refugee inflows in recent decades. The first wave was caused by the war in Iraq, the second wave followed the war in Syria. While the inflow of other types of immigrants are more stable over time, refugee inflows follow closely the upheaval of large international crises. There is therefore considerable longitudinal variation in refugee inflows.
The Norwegian settlement policy has three administrative levels.Footnote 1 At the national level, the Directorate of Integration and Diversity (IMDi) organizes a committee that tracks the total number of asylum seekers and refugees that have been granted residency and need accommodation. This committee decides how many of the refugees each of Norway's 19 counties are asked to accommodate. Next, IMDi's six regional offices decide, in cooperation with the municipalities’ confederation (Kommunenes Sentralforbund), how to allocate the refugees across municipalities. This decision is made based on population size, the local labour market situation, and integration competencies in the municipality. Finally, the municipalities decide, in their local councils, how many of the requested refugees they will accept. The municipalities only decide the numbers of refugees they will settle, they cannot pick individual refugees or select nationalities. The municipalities receive a grant per refugee from the central government to finance integration programs, which they (in 2014) receive for five years.
The number of asylum seekers that have been granted residence permits, but wait for a settlement municipality, increased rapidly over the 2000s. This increase is due to increasing numbers of asylum seekers that are granted residency, quicker processing of asylum seeker applications, and insufficient willingness to settle refugees at the municipal level.Footnote 2 In 2013, about 5,500 immigrants were on the ‘waiting list’ to be settled in a municipality. With this background, the newly elected right‐wing government in November 2013 sent a letter to all municipalities, asking them to settle immigrants. This was a break with the previous policy, where IMDi tended to limit the requests to municipalities that previously had accepted to settle newly arrived refugees and asylum seekers. Thus, a large share of municipalities were never requested to settle refugees and therefore had no local settlement decisions to make. In some sense, the policy change was that all municipalities were now considered as possible areas for settlement, whereas previously only a limited number of municipalities were viewed as such. The letter further asked municipalities to make settlement decisions for the next three subsequent years, to make the system more stable and predictable. Moreover, the municipalities were given grant from the central government to cover the costs of settlement for the first years. This grant was now increased. Thus, while the letter asked the municipalities to take collective responsibility to reduce the waiting list, the financial incentives were also strengthened. Finally, the central government established a coordination committee to assist the municipalities to solve the housing supply issues that often made new settlements difficult (Thorshaug et al. Reference Thorshaug, Svendsen, Paulsen and Berg2011).
The policy change had the consequence that a high number of municipalities without experience in refugee integration accepted settling refugees. We leverage this consequence of the policy change for identification. We define treatment municipalities as municipalities that were not requested to settle refugees in the period 2006–2012 and control municipalities as those who were requested to settle refugees for at least one year in the same period.
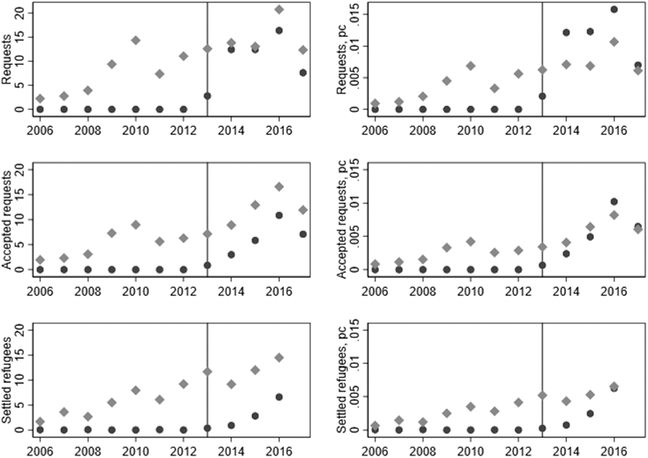
Figure 1 shows the number of settlement requests from IMDi to the municipalities (top panel), the number of accepted settlement requests by the municipalities (middle panel), and the number of newly arrived refugees in the municipalities as reported in administrative register data (lower panel). We see that these numbers follow the same variation over time, indicating that actual settlements are, to a large degree, governed by IMDi requests. The actual settled number of refugees is however lower than the originally requested number. This may be due to some overestimations of needed settlements by IMDi and that a small number of refugees do not settle where planned. We further see that the control municipalities received more refugees in total numbers, but this is due to their slightly larger population size. In per capita terms (right panels), the treatment municipalities received almost the same number of refugees. Importantly, we see that there is a clear change in the treatment municipalities following the policy change. Before 2013, they were neither requested to receive, nor settled any newly arrived refugees. After 2013, this changed sharply.

Figure 1. Mean numbers of requested, accepted and settled refugees, 2006–2016. Total numbers and per capita means. Treatment and control municipalities.
Note: Dark bullets are treated municipalities while light bullets are control municipalities. The sample is restricted to the small and rural municipalities we study below. The patterns are similar if we include all municipalities, but the average numbers of refugees are higher because urban municipalities receive more refugees.
Theoretical expectations
Several theoretical frameworks propose that refugee settlements will cause local opposition. Conflict theory arguments tend to be variations of the following type of reasoning (see e.g., Quillian Reference Quillian1995, for a review): When the number of local residents with a non‐majority ethnic background increases, competition over resources is more likely to take place between ethnic groups (or perceived to do so). This competition can be over jobs, welfare benefits or political power, and might result in higher vote shares for parties and candidates opposing immigration. Effects will be particularly strong if the local economy is contracting, as competition becomes fiercer (Lancee & Pardos‐Prado Reference Lancee and Pardos‐Prado2013). Moreover, the degree of local opposition might depend on the characteristics of refugees, such as the social distance between the local population and the refugees, and whether the refugees are mainly young, single males (Bansak et al. Reference Bansak, Hainmueller and Hangartner2016; Ward Reference Ward2019).
Previous research has emphasized the importance of rapid change in immigration, rather than the immigrant share, for public opinion. This distinction is important in our case, since the number of newly arrived refugees is low and for example, not sufficiently high to have important effects on local labour markets. Hopkins (Reference Hopkins2010) argues that local changes are more likely to be noticed and thus to be salient to voters than levels, since voters are accustomed and sorted across localities based on levels (see also Kaufmann Reference Kaufmann2017). Demographic changes can be viewed as a threat to the current cultural status quo, local identities, and induce uncertainty about the future (Newman & Velez Reference Newman and Velez2014). These effects might be particularly strong if immigration is high on the media agenda (Hopkins Reference Hopkins2010), as it increases the salience of immigration issues in voters’ party choice decisions. The latter is true in our case (Bergh & Karlsen Reference Bergh and Karlsen2017), as the post‐treatment elections we study happened during and in the aftermath of the refugee and migrant crisis. Salience was also heightened by the public debate that followed the policy change.Footnote 3 In these years, the immigration issue was heavily politicized and polarized. In this situation, even a small number of refugees might matter as it reminds local voters about the pros and cons of refugee immigration that are being debated in the media. Thus, based on the literature discussed so far, the first hypothesis is a right‐wing shift in treated municipalities in response to settlements.
There are, however, arguments pointing to a shift in voter sentiments in the opposite direction when a municipality receives refugees for the first time. First, positive personal contact with refugees that counter pre‐existing negative stereotypes (Allport Reference Allport1954) can operate among segments of voters. There is some experimental evidence of such effects in Norwegian contexts (Finseraas & Kotsadam Reference Finseraas and Kotsadam2017; Finseraas et al. Reference Finseraas, Hanson, Johnsen, Kotsadam and Torsvik2019), but the external validity outside the experimental setting, and its relevance for party choice, is unknown. Second, voters’ responses may depend on the local experience of refugee integration. If settling refugees for the first time is successful and/or perceived as relatively successful, a group of voters might be more likely to vote for liberal immigration policies, for instance by switching from the centre‐left to a ‘New Left’ party. It is an open question, however, whether the treated municipalities will be able to successfully integrate the refugees. On the one hand, settlement in an area with few other refugees might result in better language skills and more contact with natives, but on the other hand, it can slow down integration since ethnic networks might be important for employment (see Edin et al. Reference Edin, Fredriksson and Åslund2003 for a discussion). Our data allow us to examine the integration outcomes of the settled refugees. Thus, based on this literature, the second hypothesis is that the direction of the shift will be leftward in treated municipalities if local integration is successful.
There are also arguments pointing to a muted effect on the political centre of gravity, if the number of refugees arriving was small and perhaps not sufficient to provoke local opposition (but see footnote 3). When this is the case, it suggests that the electoral costs from implementing a dispersal policy will often be small, since it implies that most municipalities will receive relatively few refugees. Furthermore, there is also a debate about to what extent local presence of immigrants is what drives party choice. If, for instance, voters are mainly concerned about the fiscal costs of refugees, or the effects on national cohesion and culture, the change in local number of refugees will be of second‐order interest (Sides & Citrin Reference Sides and Citrin2007). Finally, one interesting aspect of our case is that the policy change was implemented by a right‐wing coalition government that included Norway's main anti‐immigration party. Thus, voters wanting to express discontent with the inflow of refugees face the dilemma that the Progress Party has some responsibility for the local presence of refugees.
In our view, voter polarization is a plausible, but less examined, outcome of refugee settlements. Voter polarization will occur if one group of voters shifts right in response to arrivals while another group shifts left. Such diverging responses are likely, since perceptions of refugee inflows are often shaped by ideological pre‐dispositions (Dinesen et al. Reference Dinesen, Klemmensen and Nørgaard2016; Johnston et al. Reference Johnston, Newman and Velez2015).Footnote 4 The policy change we study can be considered as providing a shock in perceptions of the costs of refugee integration, a dimension that is important for voters’ views on refugee immigration (Bansak et al. Reference Bansak, Hainmueller and Hangartner2016; Ward Reference Ward2019), and can thus shape voter responses. A leftward shift among a group of voters that perceive integration to go well, presumably among those with leftist pre‐dispositions, can happen alongside a rightward shift among some voters with right‐wing pre‐dispositions, where feelings of cultural threat and uncertainty is activated (Newman & Velez Reference Newman and Velez2014; Stenner & Haidt Reference Stenner, Haidt and Sunnstein2018) when the immigration issue becomes more salient in their minds. In this situation, the political centre of gravity might not shift in one direction, instead, local politics becomes more polarized. This reasoning is behind our third hypothesis of voter polarization in treated municipalities.
Most of the previous empirical literature studies the effects of immigrant share at the intensive margin, that is leveraging period‐to‐period‐variation in the share of immigrants to identify electoral effects. This literature has grown rapidly over the last years and tends to find positive effects of immigration on support for anti‐immigration parties. Cools et al. (Reference Cools, Finseraas and Rogeberg2021) review and conduct a meta‐analysis of the causal inference literature, finding a small positive effect of immigration (see also Arzheimer Reference Arzheimer and Rydgren2018).Footnote 5
An important aspect of our study is that we examine effects of immigration along the extensive margin, that is studying the effects of receiving refugees for the first time. A change on the extensive margin implies a qualitative change in status from a municipality that does not settle refugees to a municipality that does, while a change on the intensive margin is a quantitative change in immigration/refugee share among municipalities that all settle refugees. The status change might be particularly important since it involves a totally new situation for the municipalities, it is a more significant change in local experiences than normal shifts along the intensive margin. To our knowledge, Steinmayr (Reference Steinmayr2016) is the only previous study of the electoral effects at the extensive margin. Like us, he compares Austrian municipalities that received refugees for the first time after the 2015 migration crisis to those who did not. To get exogenous variation in settlement, he uses the availability of housing accommodation as an instrumental variable. The results show that receiving refugees caused a shift away from the far‐right Freedom Party to the conservative People's Party. He does not study polarization.
Data and empirical strategy
Our empirical strategy is to compare the change in electoral outcomes in municipalities that did not receive refugees prior to the policy change (treatment group) to similar municipalities that accommodated refugees also prior to the policy reform (control group). Our main outcome variables are based on municipality level vote shares in national and local elections. National elections take place every four years. There are 19 election districts, which elect representatives using proportional representation. Candidates are chosen by political parties in what is essentially a closed‐list system with no voter influence. Eight parties were represented after the 2013 election. In additional analyses we also study electoral outcomes in local elections. They take place every four years, midway through the national election cycle.Footnote 6
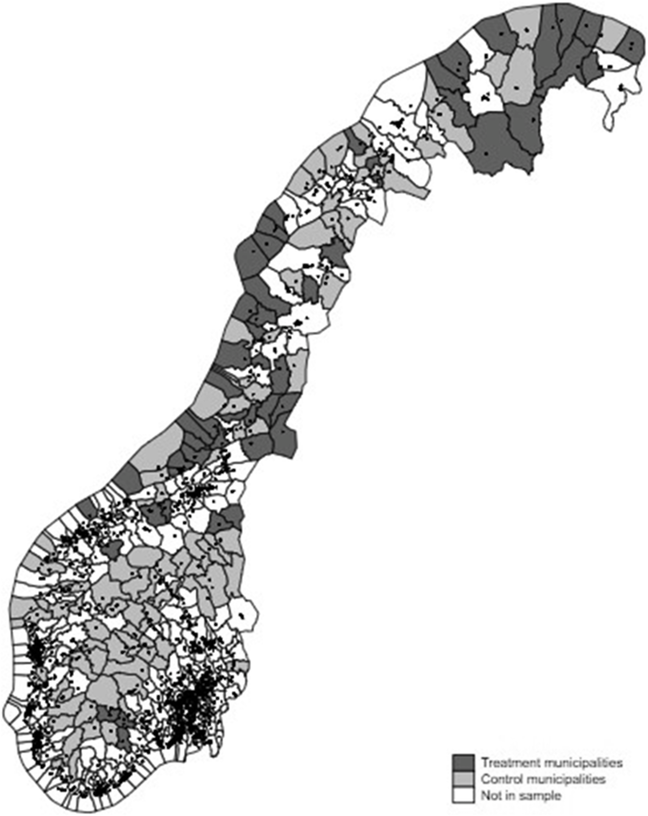
Our analysis sample is small, rural municipalities, as defined by Statistics Norway's centrality index. The index classifies municipalities based on population size and distance to a regional centre. We restrict the sample to municipalities in the two most rural categories of the index. We do this restriction because municipalities that did not receive refugees before 2013 were almost exclusively small and rural. For the comparison group to be comparable to municipalities that did not settle refugees before the reform, we therefore only include municipalities of similar size and centrality. As there are still large differences in the population size of treatment and control municipalities within the two lowest values on the centrality index, we further exclude municipalities in the comparison group that have a higher population size than the largest municipality in the treatment group. We also exclude a small number of municipalities that changed borders during the period. This leaves us with 52 municipalities in the ‘treatment group’ and 96 municipalities in the ‘control group.’ These municipalities are distributed across the whole country, see Figure 2, but there are more treatment municipalities in Northern Norway.

Figure 2. Map of treatment and control municipalities.
Note: Dark grey colour identifies the treatment municipalities, light grey colour the control municipalities, while white colour the municipalities not included in our sample. Black dots indicate cities and towns.
We estimate the effects of the policy change on electoral outcomes using a standard difference‐in‐differences (DD) model:
 \begin{equation}{{Y}_{it}}=\beta \text{TREATE}{{\text{D}}_{i}}\text{*POS}{{\text{T}}_{t}}+\chi \text{TREATE}{{\text{D}}_{i}}+\eta \text{POS}{{\text{T}}_{t}}+{{\epsilon }_{it}}\end{equation}
where i indexes municipality and t indexes period. TREATED is a binary indicator for treated municipalities, while POST is a binary indicator for the post‐treatment period. We define the pre‐treatment period as the electoral period prior to the election of right‐ wing government in 2013, and the post‐treatment period as the subsequent electoral period. When we study electoral outcomes, the 2013 election result is the pre‐treatment outcome and the 2017 result is the post‐treatment outcome. When we study variables with annual variation, we take the mean over the two election periods as the outcomes (2010–2013, 2014–2017). The β coefficient is the DD‐estimate. Under a set of assumptions, where parallel trends in electoral outcomes absent the reform is the strongest one, the β coefficient can be given a causal interpretation. We discuss the parallel trends assumption below. In the main analysis we expand equation 1 by including previous election periods back to 1997 to study pre‐trends. In the analyses where we only include one pre‐period, N is 296 (148 municipalities observed twice), while N is 888 in analyses where we include pre‐periods back to 1997 (148 municipalities observed six times).
Our main outcome variables are measures of centre of gravity and political polarization in national elections, based on election results as reported in Fiva et al. (Reference Fiva, Halse and Natvik2017). In the construction of the outcomes, we use data from the Comparative Manifesto Project (CMP) (Budge et al. Reference Budge, Klingemann, Volkens, Bara and Tanenbaum2001) to classify the political parties along two dimensions. The first is the general left‐right dimension, as developed by the CMP team. The second is a proxy for the immigration and integration dimension, using the ‘support for multiculturalism’ variables in the CMP. When calculating party positions on this dimension we follow Lowe et al. (Reference Lowe, Benoit, Mikhaylov and Laver2011).
We derive the political centre of gravity in each municipality by weighting the local vote shares by the party positions:  ${c_{it}} = \frac{{\sum {s_{ipt}}{p_{pt}}}}{{\sum {s_{ipt}}}}\;$ where ${c_{it}}$ is the centre of gravity in municipality i after election t, ${s_{ipt}}$ is the vote share of party p, and ${p_{pt}}$ is the party position on the respective dimension. Colantone and Stanig's (Reference Colantone and Stanig2018) research is a recent application of this approach. A positive shift implies more left‐wing (left‐right dimension) or pro‐immigration (multiculturalism) voting.
Next, we construct measures of polarization along the two dimensions. We follow Stanig (Reference Stanig2011) and calculate polarization as  ${P_{it}} = \frac{{{\rm{A}}\sum {s_{ipt}}| {{p_{pt}} - \widehat {{p_{pt}}}} |}}{{{\rm{J}}\sum s_{ipt}^2}}\;$, where $\widehat {{p_{pt}}}$ is the average position across parties. A is a parameter equal to $\frac{2}{r}$ where r is the range of the dimension, while J is the number of parties. The polarization score increases if parties located away from the average position on the respective dimension increase their vote share.
In additional analyses we also measure the effects on vote shares for all the main political parties in Norway in both the national and the municipal elections around the policy change. In the study of the national elections, the pre‐period is the 2013 election, and the post‐period is the 2017 election, while the respective election years are 2011 and 2015 in the analysis of local election results. Vote shares for the right‐wing and immigration sceptic Progress Party are of special interest in these regressions.
Finally, we study treatment effects on outcomes from survey data and administrative data on refugee integration, to help interpret the results from the analysis of electoral outcomes. We introduce these data sets and variables below.
Parallel trends assumption
As noted above, we restrict our sample to small, rural municipalities to compare municipalities that are otherwise similar, but differ in their settlement of refugees in the pre‐period. Since the treated municipalities were not asked to settle refugees prior to the policy change, we might expect that they are a selected group of municipalities. The timing of the policy change is however random to the municipalities as it is decided by the central government. The DD estimator identifies the effects from changes in municipality outcomes before and after the policy change. Fixed characteristics of the municipalities and selection based on these are therefore accounted for. Large differences in observable characteristics will however still be worrying because such differences might be correlated with time‐trends in voting behaviour. This is the main reason why we restrict the sample to municipalities of similar size and centrality.
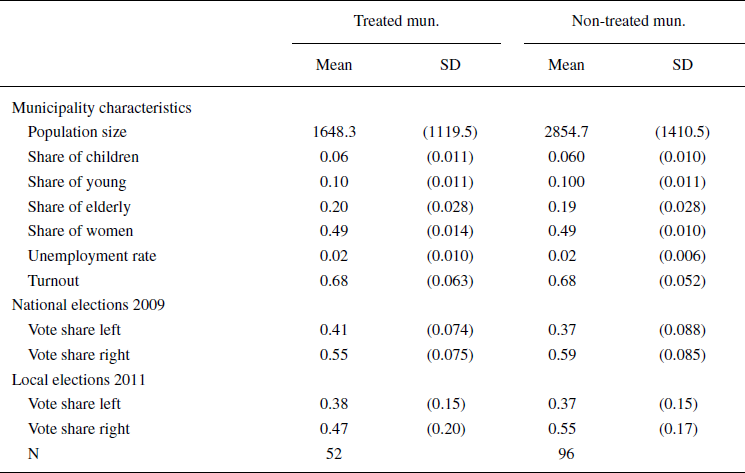
Table 1 shows descriptive statistics for the treatment and control municipalities in 2012. We see that the two groups are fairly similar on socio‐economic characteristics, except that the treatment group has fewer inhabitants. Furthermore, the treated group is somewhat more left‐leaning (higher combined vote shares for the Red Party, the Socialist Left Party and Labour) in the 2009 parliamentary election, while local lists are stronger in the local elections. The latter reflects that treated municipalities are smaller, where local lists tend to be more important.
Table 1. Descriptive statistics of treatment and control municipalities

The main identifying assumption in the DD design is that electoral outcomes would develop in parallel in the treatment and control municipalities absent the reform. This assumption is untestable, but parallel pre‐trends make it more plausible. In our case, however, we might expect pre‐trends to differ: As we saw in Figure 1, the shock to treated municipalities is stark, especially in per capita terms. However, the control municipalities also experience fluctuations in the number of newly arrived refugees both in the pre‐period and the post‐period. If increasing the number of refugees at the intensive margin affects political voting behaviour (Cools et al. Reference Cools, Finseraas and Rogeberg2021), we might not expect either a stable pre‐trend for the control municipalities, nor a zero movement in voting behaviour in the post‐period. However, this pre‐trend analysis along the intensive margin is not directly targeted at our counterfactual, which is what happens when there is a shock at the extensive margin. Still, since changes along the intensive margin might affect the outcomes, we believe it is necessary to adjust for it.
To adjust for (1) pre‐treatment differences in municipality characteristics and (2) repeated pre‐treatment shocks on the intensive margin in the control municipalities, we estimate the model with entropy balancing weights (Hainmueller Reference Hainmueller2012). We adjust the treatment and control group for differences in the four electoral outcomes and population size in the elections going back to 1997 (1997, 2001, 2005, 2009 and 2013). This is a demanding task on a small sample size, which makes convergence of the balancing algorithm difficult, so we construct the balancing weights in an iterative manner: We first estimate the weights on a larger sample of municipalities, and then use these weights as base weights that are refined when we re‐run the algorithm on the smaller sample. We increase the tolerance level to achieve convergence, which implies that the treatment and control groups are not perfectly balanced, however, the degree of imbalance is reduced and becomes insignificant for several outcomes.
Settlement outcomes
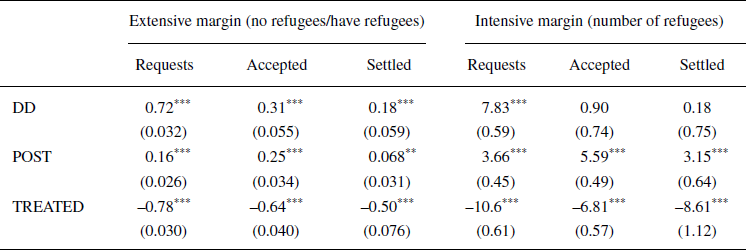
Table 2 shows the effects of the policy reform on municipality refugee settlement decisions, using the DD set‐up using data from the administrative registers of the Directorate of Integration and Diversity (IMDi) and official registers of residence. We study effects on settlement requests, settlement acceptances and actual settlements (as in Figure 1) and study the effects on both the extensive margin and at the intensive margin. The extensive margin is, as explained earlier, a qualitative change (going from zero to a positive number of refugees). We measure this with a dummy variable taking the value 0 if the number of refugees is zero, and 1 if the number of refugees is higher than zero. The intensive margin is a quantitative change, and we measure this by the real number of refugees. The outcomes are averaged over the pre‐ and the post‐period.
Table 2. DD results. Refugee settlements. N = 296

Notes: TREATED is a dummy variable for the treated municipalities, POST is a dummy variable for the post‐treatment period, DD is the difference‐in‐differences estimate, that is the interaction between POST and TREATED (see equation 1). Robust standard errors clustered on municipality in parenthesis. Level of significance: ***1%, **5%, *10%. Unweighted estimates.
In line with the descriptive statistics and the year‐by‐year development in Figure 1, we find strong treatment effects on refugee settlement at the extensive margin. Prior to 2013, the treated municipalities were not asked to settle refugees, but after 2013, the probability of being asked to settle refugees increased by 88 percentage points ((0.16+0.72)×100): 72 percentage points more than the control municipalities. The probability of ultimately settling refugees increased by 24.5 percentage points ((0.068+0.18) ×100): 18 percentage points more than the control municipalities. The increase in the number of requested refugee settlements also increased more in the treatment municipalities than in the control municipalities. They were on average asked to settle about 11 refugees (3.66+ 7.83) per year (from a baseline of zero). The number of refugees they accepted to settle increased to about seven, but not all acceptances were implemented immediately, so that newly settled refugees increased by about three refugees per year. This settled number is the same in the comparison group.
It is evident, therefore, that both treatment and control municipalities received more refugees after the policy change, and there is no significant difference in the growth in total numbers. There is, however, significantly different changes at the extensive margin. Treatment municipalities had much higher increases in the probability of getting requests, accepting and settling refugees for the first time. Thus, our estimates should be interpreted as the effect of going from zero refugees to receiving refugees. We believe this is a theoretically interesting margin, since interacting with newly arrived refugees in their own community was a new experience for voters, and refugee integration a new experience for the municipalities. It is thus informative about the role of new local experiences for anti‐immigration sentiments.
Empirical results
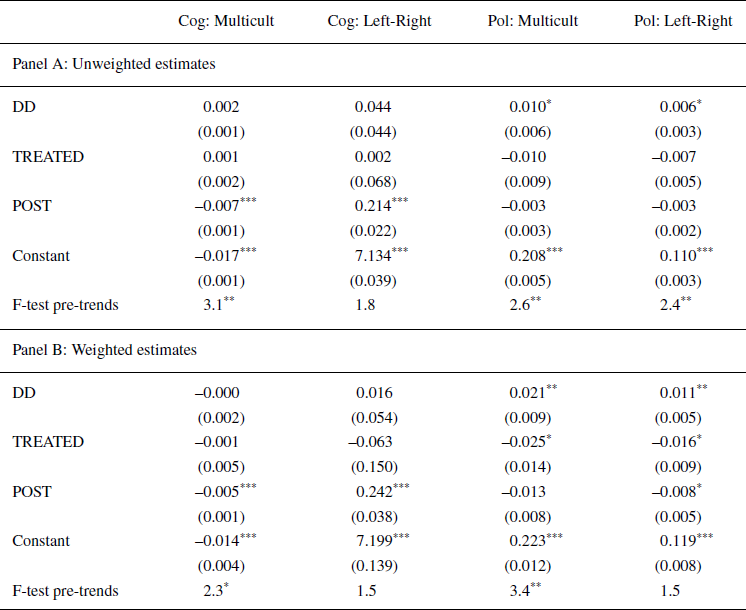
Our main results are reported in Table 3. The constant in our set‐up is the mean in the comparison group in the 2013 election and serves as a useful benchmark. The TREATED coefficient is the mean treatment‐control difference in the 2013 election, the POST coefficient shows the change in outcomes between 2013–2017 for the comparison group, while the DD coefficient (TREATEDi × POSTt in equation 1) shows whether the 2013–2017 changes in outcomes are different for the treated group (i.e., the DD estimate). We include dummy‐variables for the pre‐periods 1997, 2001, 2005 and 2009 and the interactions of these dummies with the treatment variable, to examine changes in pre‐treatment differences. The pre‐trends are left out of Table 3 for ease of presentation but are presented in Tables A4 and A3 in the Supporting Information Appendix. In Panel A we present estimates without weights, while in Panel B we present results using the entropy balancing weights. The treatment‐control differences in the pre‐periods are mostly insignificant (see appendix), but the F‐tests of the interaction terms, presented at the bottom of the panels, reveal that they are jointly significant in most models when we do not weight. The balancing weights typically reduce the pre‐treatment differences, as we should expect.
Table 3. DD results. Political outcomes. N = 888

Notes: TREATED is a dummy variable for the treated municipalities, POST is a dummy variable for the post‐treatment period, DD is the difference‐in‐differences estimate, that is the interaction between POST and TREATED (see equation 1). Robust standard errors clustered on municipality in parenthesis. Level of significance: ***1%, **5%, *10%. Cog: Multicult: centre of gravity on the pro‐multiculturalism dimension.Cog: Left‐right: centre of gravity on the left‐right dimension; Pol: Multicult: polarization on the multiculturalism dimension; Pol: Left‐right: polarization on the left‐right dimension.
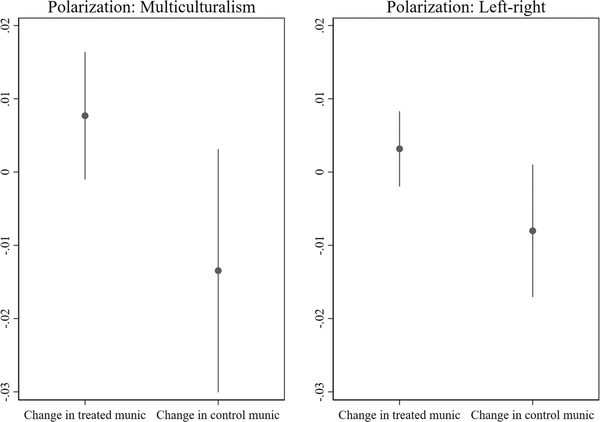
The results in the two first columns show that the policy change had small and insignificant effects on the political ‘center of gravity’ but have increased political polarization (columns 3 and 4). We see from the POST coefficients that there was a slight leftward, but at the same time anti‐multiculturalist shift in voting behaviour from 2013 to 2017, however, these shifts are very similar in the treatment and comparison groups. For polarization, we find small changes in the control group, while the DD estimates show that the treatment municipalities become more polarized, relative to the comparison group. If we compare the weighted DD estimates to the constant (which is equal to the mean in the control group in 2013), we see that the increase in polarization is about nine percent, that is a moderate increase.Footnote 7 Figure 3 plots the estimated changes in polarization in the treatment and control municipalities. As evident, the increase in polarization in the treated municipalities is against a decrease in the control group. Control municipalities became slightly less polarized, while the treated municipalities became slightly more polarized, hence the positive and significant DD estimates in Table 3 (which is the test of whether these two changes differ).

Figure 3. Change in polarization on multiculturalism and the left‐right dimension in treated and control municipalities.
Notes: Based on estimates from Table 3: Change in control municipalities is equal to the POST coefficient, while the change in treated municipalities is equal to DD minus POST.
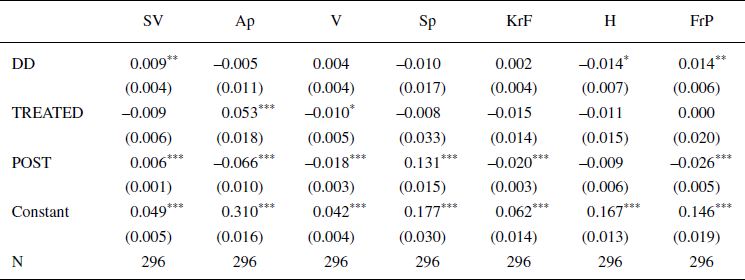
In Table 4 we replace the centre of gravity and polarization outcomes with vote shares for each political party and present the DD estimates from these regressions (using balancing weights). We find that vote shares were quite similar in the two groups in the 2013 election, except that Ap (Labour) was stronger in the treated municipalities. Next, we see that Ap's vote share declined almost seven percentage points in the comparison area, while Sp, an agrarian party that is strong in rural areas, did extremely well. This party is centre‐left on economic issues, but centre‐right on social issues, including immigration. From the DD‐estimates we again see signs of polarization, as the Socialist Left Party and the Progress Party increased their vote shares. These two parties are the opposites on the immigration policy dimension. We further see a relative decrease in the vote share of the Conservative Party, which is the opposite effect of Steinmayr (Reference Steinmayr2016), who finds that a shock on the extensive margin caused a shift from the main anti‐immigration party to the conservative party.
Table 4. DD results. Vote shares. National elections in 2013 and 2017

Notes: TREATED is a dummy variable for the treated municipalities, POST is a dummy variable for the post‐treatment period, DD is the difference‐in‐differences estimate, i.e. the interaction between POST and TREATED (see equation 1). Robust standard errors clustered on municipality in parenthesis. Level of significance: ***1%, **5%, *10%. SV: Socialist Left Party (new left); Ap: Labour Party (social democrats); V: Liberal Party (social liberals); Sp: Centre Party (agrarian); KrF: Christian People's Party (Christian democrats); H: The Conservative Party (conservatives); FrP: Progress Party (populist right party).
Table A1 shows the results when we replace the national election outcomes with the local vote shares. Here we define the 2011 vote shares as the pre‐outcomes and the 2015 vote shares as the post‐outcomes. All coefficients have the same interpretation as in Table A1. We also include estimates for the vote share of the incumbent coalition in the local council. The local election outcomes further reinforce the interpretation that the reform did not move the voters in one direction. The incumbent parties decreased their vote share by about four percentage points, while the Labour party and the Centre Party increased their vote shares, but none of these DD estimates are significant.
Thus, in summary, we find signs of political polarization in parliamentary election outcomes both when we use aggregate measures of electoral polarization and when we study vote shares. Compared to the control municipalities, the municipalities that received refugees for the first time become more polarized, with relative increases in the vote shares of parties at both ends of the immigration policy dimension.
Integration of refugees
The polarization result is surprising because pro‐immigration parties rarely increase their vote shares after refugee inflows, while, in contrast, the increase in vote shares for right‐wing parties is well‐documented (Arzheimer Reference Arzheimer and Rydgren2018). We argued above that a left‐wing response is plausible if integration of the newly arrived refugees is perceived as successful. In this case, settlement has caused a positive shock in perceptions of the costs of integration and perhaps led to positive social contact. This effect can of course operate among segments of the electorate and co‐exist with elevated feelings of threat and uncertainty among other segments of voters. In this section we examine the plausibility of the integration mechanism as one part of the explanation of the polarization results.
Our first piece of evidence is from objective data on refugee integration. We use full population register data from Norwegian tax‐registers and demographic registers to study whether refugees settled in the treated municipalities in the years 2013–2016Footnote 8 became better integrated than refugees who arrived in municipalities that had longer experience in receiving refugees. We allocate newly arrived refugees to the treatment and control municipalities according to the municipality where they were first settled. The settlement municipality is decided by the immigration authorities and exogenous to the individual refugee. The data has a panel structure, that is we follow refugees over several years. The results in Table 5 are from an estimation of the following equation on all refugees arriving at our treatment and control municipalities after the reform:Footnote 9
 \begin{equation}{{Y}_{it}}=\beta \text{TREATE}{{\text{D}}_{i}}+\delta {{X}_{i}}+{{\gamma }_{t}}+{{\epsilon }_{it}}\end{equation}
where i now indexes individual and t indexes year. Xi is a vector of individual characteristics: a dummy for female, age‐dummies, family‐type dummies,Footnote 10 dummies for the year first settled and country of origin. γt represents year‐dummies. The equation is estimated for the full adult refugee population (above 18 years old). The set‐up ensures that we compare refugees with similar characteristics who were settled in the same year but differ in their municipality of first settlement. The coefficient β, which is the estimate presented in Table 5, shows whether refugees settled in the treatment municipalities are differentially integrated in the labour market compared to those who were first settled in the control municipalities.
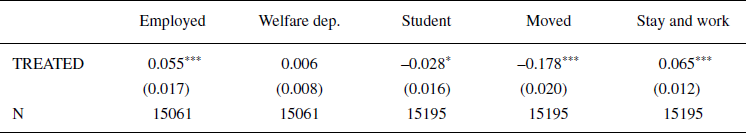
Table 5. OLS regressions on refugees settled between 2013–2016

Notes: TREATED is a dummy variable for refugees settled in the treatment municipalities. N refers to number of observations, as refugees are observed over multiple years. Robust standard errors clustered on municipality in parenthesis. Level of significance: ***1%, **5%, *10%.
We find that labour market integration of refugees settled in treatment municipalities was more successful than in the comparison municipalities. We see in Table 5 that they have higher employment probabilities (partly mirrored by a lower probability of being a student) and move less soon/less often from their first municipality of settlement, which is an indication of social integration also on other parameters than labour market outcomes. Higher employment probabilities are not driven by refugees who move from the municipality they were first settled in, as the last column shows that the probability of both staying and working in the first municipality of settlement is significantly higher. The results indicate that treated municipalities are no less capable of integrating refugees, as results from some previous research might lead us to expect (Edin et al. Reference Edin, Fredriksson and Åslund2003), quite the contrary. One possible reason is that settlement in an area with few refugees might be positive for developing good Norwegian language skills and for beneficial social contact with natives, but our data do not allow us to examine these mechanisms.
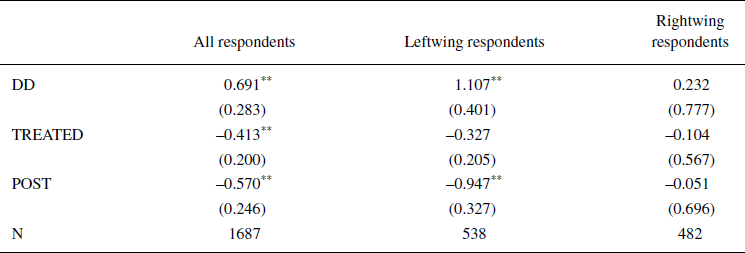
Our second piece of evidence is on voter perceptions of refugee integration. We leverage the Norwegian Citizen Survey (NCS) from the years 2013, 2015, 2017, and 2019, which includes relevant survey questions and municipality identifiers. We classify 2013 as the pre‐period, while the rest of the years are the post‐period. The surveys have a question on respondents’ assessment of how well the efforts to integrate refugees is going, which we scale to range from 0 to 1, where a high score implies a positive assessment.
The first column of Table 6 reveals a large, positive DD estimate for views on refugee integration. While voters in treated municipalities had a less positive view on refugee integration in the pre‐period, there is a stark positive shift in the post‐period, while there is a clear negative trend in the control municipalities. This finding is important as it implies that perceptions of local integration success may explain the increase in the vote share of the Socialist Left Party, the most immigration‐friendly party in Norwegian politics.
Table 6. OLS regressions. Norwegian Citizen Survey (NCS) 2013, 2015, 2017, and 2019

Notes: TREATED is a dummy variable for respondents from the treated municipalities, POST is a dummy variable for the post‐treatment period, DD is the difference‐in‐differences estimate, that is the interaction between POST and TREATED. All models include controls for gender, age, and level of education. Robust standard errors clustered on municipality in parenthesis. Level of significance: ***1%, **5%, *10%.
Thus, positive local experiences of refugee integration may be an important mechanism for the left‐wing increase in vote share among a subgroup of voters. If so, we should expect that the estimate in column 1 is driven by left‐wing respondents. To examine this issue, we use a question in the surveys on how they evaluate ‘the quality of public services in light of what they pay in taxes’, to classify respondents as right‐wing, centre or left‐wing. Columns 2 and 3 show that the positive view of refugee integration is driven by left‐wing voters and is not shared to the same extent on the right. To be clear, there is no change in a negative direction among right‐wing voters. Such voter level polarization would be even stronger indications of local polarization. We have no suitable questions to further examine the right‐wing response, such as direct questions on feelings of threat and uncertainty (Newman & Velez Reference Newman and Velez2014). Such responses to immigration, however, are well‐documented in the previous literature (e.g., Hainmueller & Hopkins Reference Hainmueller and Hopkins2014) and is a plausible mechanism for the right‐wing shift.
Conclusion
How to successfully integrate refugees is a key problem for European societies to solve, and settlement policy is one potential policy that can be important in this respect (Bansak et al. Reference Bansak, Ferwerda, Hainmueller, Dillon, Hangartner, Lawrence and Weinstein2018). In order to craft the settlement policy, policymakers need to take voter responses to policy into account, both to ensure democratic legitimacy and to avoid backlashes that can reduce positive effects on refugee integration. There is, however, limited empirical work on responses to settlement policy (but see Steinmayr Reference Steinmayr2016). We contribute by studying the effects of a change in Norwegian settlement policy. While most work on responses to immigration study effects on the intensive margin (see e.g., Arzheimer Reference Arzheimer and Rydgren2018), the policy change we study had the consequence that a number of municipalities settled refugees for the first time, that is a change on the extensive margin. We believe that such changes are likely to provide new information to the electorate, and therefore be important even if the number of refugees that arrive is small.
Our examination of the electoral consequences of the settlement policy reform suggests that the political repercussions of the reform was small. We see no signs of uniform political responses in the municipalities that started to settle refugees after the policy change, however, we see indications of stronger political polarization in election outcomes. Using data on vote shares at the municipality level, we find increased support for the Socialist Left Party and the Progress Party, parties located at opposite ends of the immigration policy dimension. Whether this polarization is positive or negative for the sustainability of refugee settlements policies, remains a question for future research.
While right‐wing shifts due to immigration are well‐documented in the literature, the left‐wing response is more surprising. We argue that the left‐wing response is caused by positive perceptions of refugee integration among segments of the electorate. Consistent with this claim, we find that newly settled refugees in the treated municipalities had higher labour force participation rates and more often remained in the municipality where they were initially settled. Our interpretation is further supported by survey evidence which shows an improved evaluation of refugee integration in the treated municipalities. The results indicate that local efforts to improve the integration of refugees may counteract some of the negative sentiments that often accompany refugee settlements.
Since the policy we study aimed at dispersion of refugees, our results on labour market integration are in contrast to previous work that has emphasized the positive effects of ethnic networks for labour market integration (Edin et al. Reference Edin, Fredriksson and Åslund2003), that is, that refugees should be settled in areas where immigrants are already settled. The external validity of our results can be questioned, however, because refugee dispersion is likely to have smaller costs in a country like Norway, where labour markets are comparatively well‐functioning, also in rural areas. This might explain why the left‐wing response is rare in previous empirical studies of the electoral effects of refugee inflows. We urge future research to examine shocks along the extensive margin in other contexts.
Acknowledgements
We thank seminar participants at the Norwegian University of Science and Technology and the Institute for Social Research for helpful comments. This work is supported by grant number 270687 (Research Council of Norway).
Online Appendix
Additional supporting information may be found in the Online Appendix section at the end of the article:
Table A1: DD results. Vote shares. Local elections in 2011 and 2015.
Table A2: DD results. cog pol. National elections in 1997‐2017.
Table A3: DD results with entropy balancing weights. National elections in 1997‐2017.


 Open access