

1. Introduction
Energy poverty reflects the insufficient availability of diverse, reliable, high-quality, and environmentally sustainable energy services necessary for economic and human development (Zhou et al., Reference Zhou, Wang, Wang and Tan2024) as well as the excessive use of highly polluting solid energy, clean energy equipment insufficiency, and clean energy fuel deficiency (IAE, 2019). The United Nations has highlighted energy as a major developmental challenge, with the Sustainable Development Goals (SDG) 7 objective of ensuring access to affordable, reliable, sustainable, and modern energy by 2030. Energy poverty (EP) includes both low energy supply and inefficiency.
According to Djeunankan et al. (2024), an evaluation of the level of industrialization and innovation trends in Africa shows that these challenges cannot be met by Africa’s current electric and energy system, infrastructure, and policies. Therefore, approaches should be considered that are more effective to reverse these trends. Globally, the issue of EP is more relevant in African countries regarding the following observations: IEA (2019) highlighted that about 81% of the population relies on fossil fuels for power generation, and about 600 million people did not have access to electricity in 2018. This situation will be exacerbated as Africa will grow by 3% over the course of the decade, and its population by 1.4% per annum until 2030, making Africa the most populated continent by 2040 (Alemzero et al., 2020).
From this perspective, Zhang et al. (Reference Zhang, Lin, Wang and Shahbaz2024) demonstrated that the right way to fulfill global energy requirements, without contributing to climate change, is by promoting innovation and structural change in African economies. The influence of the Global Value Chain (GVC) has gradually increased in recent years, affecting the domestic production process and international trade, putting significant pressure on global energy resources. GVC participation means that developing countries can leverage their comparative advantages by specializing in small fragmented production tasks (Ajide, 2023). Wang et al. (2017d) characterized GVCs as ‘The economic activities involving factor content that cross national borders for production purposes.’ Overall, the GVC system refers to international production; that is, the inclusion of different firms in various countries bringing a product or service to the market, irrespective of the financial and other resource requirements involved in the production process (Obasanjo et al., Reference Obasanjo, Olayiwola, Okodua, Adediran and Lawal2021). In fact, participating in GVCs offers a new way for developing countries to obtain resources, organize production, and quickly improve both energy production and the quality of the energy produced (Ji et al., Reference Ji, Liu, Wu, Su, Ye and Feng2022).
As stated by Zhang et al. (Reference Zhang, Lin, Wang and Shahbaz2024), the move of technologies through GVC participation offers a way for developing countries to integrate into global trade by focusing on niche steps within the supply chain.
Fundamental theoretical arguments have moved from Porter’s (1985) pioneering work. Porter explained from the comparative advantages and competitive strategies theories how GVCs are associated with energy development. However, there is still a lack of empirical contributions to this debate regarding the nexus between GVCs and EP.
Natural resource-rich countries, such as African countries, are expected to improve energy supply through extraction and export in the short term, whereas importing technology or refined products should mitigate EP in the long run. Participation in GVCs will curb energy poverty through the diffusion of advanced technologies (Agostino et al., Reference Agostino, Giunta, Ruberto and Scalera2023) or by forcing firms to adapt to international standards and increase their clean energy consumption (Delera et al., Reference Delera, Pietrobelli, Calza and Lavopa2022). The second view, supported by the haven hypothesis, is due to the fact that developing countries have weak environmental regulations and trade policies, where firms are more concerned with traditional energy sources and activities that cause more pollution, and GVCs may lead to a decrease in the potential for renewable energy development (Ghosh and Dutta, Reference Ghosh and Dutta2022). As noted by Antras (Reference Antras2020), the trend of integration in GVCs observed in less-developed countries could affect the deployment of clean energy technologies and influence energy management at the firm level.
In addition to these empirical controversies, recent contributions clearly document that the quality of institutions (QI) can consolidate these opposing views. Acemoglu et al. (Reference Acemoglu, Jonhson and Robinson2005, Reference Acemoglu, Antràs and Helpman2007), North (Reference North1990) have well established the critical role the institutions play in the development process and trade. Agostiono et al. (Reference Agostino, Giunta, Ruberto and Scalera2023) explained the GVCs–EP nexus as follows: QI is the major driver of the sign of this link, as GVC participation leads to the absorption of more modern technologies and the adoption of greener energy practices, but it can also bring exports of polluting production from countries with weak regulations.
Due to the lack of consensus among studies on our variables of interest, this analysis first attempts to address this gap by evaluating the influence of GVC participation on energy poverty in a sample of African countries. First, we contribute to the ongoing debate on the effects of GVC participation on energy poverty in African countries and address the contradictions observed in the literature on this association. Second, we examine the direct and combined effects of GVC participation and institutional quality on this nexus. To the best of our knowledge, this is the first study to combine GVC participation and institutional quality to evaluate their cumulated impact on energy poverty.
Next, we focus on recent trends in GVC participation and energy poverty in African countries. Since the beginning of the last century, sub-Saharan countries have averaged 50% of gross exports, compared to 42.8% for other developing countries (Ali et al., Reference Ali and Gniniguè2022). In contrast, despite an increase in GVC participation of 1.4–2.9% between 1995 and 2020, African countries lag behind other developing regions over the World, suggesting that African countries appear to be less integrated into GVCs than Asian and Latin American regions. Similarly, the African’s value added by GVC participation has approximately improved by 9%, but it remains quite low compared to the 45% and 18% improvements in Asian and Latin American regions, respectively (IMF, 2021; Ajide, 2023).
However, regarding EP issues in Africa, Meka’a et al. (Reference Meka’a, Djamen and Noufelie2024) showed that the region is most affected by energy poverty due to a lack of energy infrastructure. More recently, it has been observed that beyond significant spatial disparities, 70% of people in sub-Saharan Africa lack access to electricity, and the number is increasing as electricity efforts continue to lag behind population growth. This meant that in 2020 769 million people still had no electricity access IRENA (2020), and Aluko et al. (Reference Aluko, Opoku, Ibrahim and Kufuor2023) highlighted a gap of 10% in access to electricity between urban (97%) and rural (87%) populations in 2020, and considerable gaps to clean cooking fuels between urban (83%) and rural (34%).
This study makes three major contributions to the literature. First, we examined the relationship between GVC participation, energy poverty, and institutional quality. To the best of our knowledge, this is the first study to examine these three factors in African countries. Our study connects GVC participation to energy issues, and energy poverty to institutional quality. Thus, we used innovative indicators to evaluate the energy access and rural–urban gap in energy poverty. Unlike previous studies, this study uses a set of variables, namely lack of electricity, clean fuel for cooking, and technology for cooking, use of renewable energy, and the Multidimensional Energy Poverty Index (MEPI) based on urban and rural gaps. As a result, we provide reliable results, leading to a novel insight to policies that can curb energy poverty in Africa through GVC participation and a better quality of institutions. Using an MEPI measure offers the advantage of identifying the multiple disadvantages that contribute to energy poverty, which cannot be adequately captured by a single indicator, whereas a multidimensional approach could include more relevant/comprehensive indicators.
Second, we consider the literature suggesting that ineffective institutions, a lack of transparency and accountability, and inadequate regulatory and legal frameworks are major factors contributing to energy poverty in developing countries. Adams et al. (2016) and Agostino et al. (Reference Agostino, Giunta, Ruberto and Scalera2023) offered remarkable contributions on how the quality of institutions affects GVC participation and the energy poverty nexus in developing countries. It is imperative to foster international cooperation to absorb expertise, upgrade technology, promote investment, develop an infrastructure to supply cleaner energy, and enhance energy efficiency. Adams et al. (2016) brought some evidence on the influence of institutions on the energy–growth relationship. Institutions appear to be an essential factor in the transmission of economic improvements to the energy sector. This study then introduces the influence of institutions by evaluating how they affect the relationship between the GVC participation and energy poverty.
Third, this study introduces a set of empirical approaches (based on the Dynamic Common Correlated effect Pool Mean Group (DCCE-PMG), which pay particular attention to the cross-sectional dependence between countries, to the dynamic effect, and address the unobservable common factors issue. These features provide novel insights into robust policy design. Finally, we provide several valuable robustness checks to confirm the baseline findings. The findings are provided for both the short term and the long term (Agradi, Reference Agradi2023).
The remainder of this paper is organized as follows. Section 2 reviews the relevant literature and highlights the gaps in the literature. Section 3 introduces the empirical methodology and presents the data measurement variables. Section 4 reports and discusses the econometric investigation results. Section 5 presents the major conclusions of our study and discusses the related policy implications.
2. Literature Review
The literature review sheds light on the main theoretical and empirical contributions regarding the relationships among three major strands. We first focus on the theoretical foundation of the nexus between energy poverty and GVC participation; we then focus on their empirical relationships, and finally we examine the role played by the institutions in this nexus.
2.1 Theoretical Framework
An understanding of the impact of global trade on global development requires a solid theoretical foundation. According to Antras (Reference Antras2020), Ricardo’s comparative advantage is one of the most referenced theoretical analyses. This theory postulates that economies will specialize in the production and export of goods and services that provide a greater relative efficiency advantage. Extended by Porter (1985) to the GVCs field, the author explained, from comparative advantage and competitive strategy theories, how economies can optimize their growth in a competitive market by participating in worldwide value chains (Porter, 1985), especially in the energy sector. Therefore, four arguments have been referenced to clarify the mechanism linking GVCs to energy poverty. First, by reinforcing local producers’ integration in global markets, GVCs are likely to optimize domestic firm resource allocation, fostering investment in the energy sector. However, by accessing a larger market, local producers may increase their income, which is critical for extending energy source funding. Second, supporting GVC involvement may significantly impact energy poverty through the enhancement of both capacity building and operational efficiency of local industries. The integration of GVCs improves employment opportunities and incomes, resulting in an increased energy service demand. Third, Accemoglu et al. (Reference Acemoglu, Antràs and Helpman2007) found that technology transfer opportunities and sustainable practices are critical drivers of energy through GVCs. Indeed, GVC participation allows the extension of partnerships and multinational corporation networks, both of which emphasize the importance of adopting cleaner, more efficient energy practices and increasing energy consumption. Fourth, the transaction cost framework shows how global trade and commodity chain participation help to reinforce the management and governance of the energy supply chain, which leads to energy development (Gereffi, 2005).
In addition to the benefits associated with participation, developing economies are likely to experience adverse consequences. Indeed, when the distribution of opportunities to integrate worldwide value chains is disproportional to economies, inequalities may exacerbate, resulting in reduced access to energy. Furthermore, since participation reinforces the interconnection of economies, over-dependency on GVCs can be related to vulnerability, especially in the current context where international socio-economic crises and geopolitical risks exacerbate developing economies’ opportunities and increase energy poverty. In addition, through their impact on the environment, ecological degradation, due to the expansion of GVCs, may lead to increased energy poverty in developing economies.
Other contributions to this debate are based on the pollution haven hypotheses developed by Copeland and Taylor (Reference Copeland and Taylor1994). The pollution haven hypothesis suggests that GVC participation has a negative effect on the clean energy prognosis. Sarkodie et al. (Reference Sarkodie, Adams and Leirvik2020) provided additional explanations by highlighting that firms from developed countries, with strict environmental regulations, may relocate pollution-intensive production to developing countries with weaker environmental regulations to reduce costs. In contrast, the halo hypothesis assumes that with better institutions, GVC participation is able to support sustainable development and clean energy. Providing similar evidence to the pollution halo theory, the new growth theory has previously explained that GVC participation would be a way to fuel interactions between developing and developed countries in terms of knowledge spillover (Romer, 1994) and technological transfers (Adams, 2008), both of which are clean oil energy projects. This new growth theory indicates that technological innovation through technology transfer will positively influence the development of renewable energy, thus supporting the pollution halo theory. From these arguments, it appears that GVCs promote energy consumption, which is related to the environmental regulations of economies (Zhang et al., Reference Zhang, Lin, Wang and Shahbaz2024).
2.2 Empirical Evidence
Regarding empirical contributions, there are two main strands. The first focuses on contributions to the relationship between GVC participation and energy poverty, while the second is more related to the contribution of institutional quality and energy poverty. Following the previous chronology, the first empirical perspective relates to GVC participation and the energy–poverty nexus. This path of literature is dominated by two major contributions: the first postulates that GVC involvement is negatively associated with energy poverty and the second argues that GVC involvement will have a positive effect on energy poverty.
The first contribution is based mainly on the idea that participating in GVCs qualifies countries to adopt environmental practices or green technologies (Achabou et al., Reference Achabou, Dekhili and Hamdoun2017). Drawing on Enterprise Surveys conducted in 2018–2020 on a large cross-section of firms operating in different industries and countries and applying regression analyses and propensity score matching, Agostino et al. (Reference Agostino, Giunta, Ruberto and Scalera2023) showed that participation in GVCs is positively associated with firms’ propensity to adopt green energy practices. Analyzing the case of China, Zhang, and Fu (Reference Zhang and Fu2022) provided evidence on this last point by showing that foreign technologies have increased energy and domestic production efficiency. Similarly, Zhu et al. (2019) focused on China and showed that technological progress improves energy efficiency by 7.1% per year in the Chinese construction sector and favors greener energy sources that consume renewable energy sources. Yao et al. (Reference Yao, Shah, Yasmeen, Zhang, Kamal and Khan2021) showed that increased participation in GVCs, especially in high-tech industries, could encourage the development of new energy-efficient innovations, which is likely to improve energy security and clean energy demand.
Conversely, regarding the second contribution, some studies support the pollution haven hypothesis. For example, Wang et al. (2022) showed that products from increased GVC production were more polluting and poorly related to renewable energy sources. Similarly, Zhang et al. (2021) showed that countries involved in GVCs face the situation that products from GVCs consume more energy than domestic production. Moreover, they observed an improvement in emission intensity between 2000 and 2014. Furthermore, Zhang et al. (Reference Zhang, Lin, Wang and Shahbaz2024) provided nuanced prior evidence for 27 developing and 35 developed countries from 1995 to 2018. The authors showed a U-shaped nexus between GVC-clean energy, meaning that a certain GVC threshold is needed to promote sustainable energy development.
Despite these controversies about the direction of GVC participation effects on energy poverty, theoretical predictions support a negative nexus. Furthermore, regarding renewable energy development, advanced technologies, acquired from GVC participation and trade extension, favor the adoption of advanced technology that is compatible with renewable technology and lower energy use (Agostino et al., Reference Agostino, Giunta, Ruberto and Scalera2023). From this perspective, integration of developing countries into GVCs should lead to greener technology integration associated with renewable energy.
From this empirical and theoretical support, the first hypothesis of this study posits that:
H1: Participation in GVCs leads to reduced energy poverty in African countries.
2.3 The Influence of Institutional Quality in GVCs–Energy Poverty Nexus
Although the association between GVCs and energy poverty is already complex, recent economic contributions suggest that institutions play a critical role in influencing the dynamics of these variables, especially in Africa. The strand of literature, regarding how national and international regulations interact with the organization of global GVCs in the energy sector, seeks information on the quality of the institutions. The institutional framework, which is associated with domestic energy policy and access dynamics, argues that regulatory environments, as well as domestic ones, are closer to the structure of GVCs. Moreover, GVCs, when coupled with better governance mechanisms, can support energy equity, leading to an enhanced awareness of EP issues. Ji et al. (2020) supported the theory that improved institution quality (regulatory quality, political stability, government effectiveness, and rule of law) can promote the GVC participation specifically in institutionally sensitive countries. This argument is part of a large theoretical framework that attests to the significant nexus between trade and institutions (Acemoglu et al., Reference Acemoglu, Jonhson and Robinson2005; North, Reference North1990).
Regarding the influence of institutions on GVC participation and the energy poverty nexus, empirical literature on this topic is scarce, and Zhang et al. (Reference Zhang, Lin, Wang and Shahbaz2024) highlighted a non-linear GVC–energy poverty nexus and confirmed that it is explained by the quality of institutions. Nguyen et al. (2018) argued that higher-quality institutions force enterprises and public actors to implement new energy technologies and adopt renewable energy sources that are more adapted to secure higher energy quality. In this vein, Nunn and Trefler (2007) found that the quality of institutions is a fundamental factor in the trade-competitive advantage nexus. Strong institutions boost funding for investment, basic infrastructure development, and technology transfer, which are potential drivers of energy access. By contrast, weak institutions deter energy investment and adequate energy infrastructure. Moreover, better regulations enhance private investor confidence, promote energy development, and alleviate poverty.
Based on these arguments, the second hypothesis of this study is as follows:
H2: The quality of institutions leads to deep energy poverty reduction related to participation in global value chains.
The literature review revealed several shortcomings. First, although some studies have evaluated the relationship between GVC participation and energy issues, most have failed to explain the mechanism through which GVC participation affects energy poverty. This study intends to fill this gap in the literature. Second, both theoretical and empirical contributions fail to determine the institutional quality effect on GVC participation–EP nexus.
3. Data and Methodology
3.1 Data
In line with the purpose of this study, the data were collected from several sources, such as the UNCTAD-EORA Global Value Chain Database for GVC participation data, the World Bank’s World Governance Indicators (WGI) for quality of institution variables, and other variables were obtained from the World Bank’s World Development (WDI) database. The data used cover 51 African countries (as listed in the Appendix) from 1995 to 2018. The sample size and selected variables were based on data accessibility and reliability.
3.2 Variable Selection
3.2.1 Dependent Variable
The dependent variable is energy poverty (EP), which was measured using several indicators. In this vein, the present study first follows Meka’a et al. (Reference Meka’a, Djamen and Noufelie2024) and Nkoa et al. (2023) to measure energy poverty with three sub-indicators named: (i) the percentage of the population with no access to electricity, (ii) the percentage of the population with no access to clean fuel and technology for cooking, and (iii) the aggregate multidimensional energy poverty index (MEPI), which is computed using the principal component analysis (PCA) method, based on a combination of single measures ((i) and (ii)). As noted by Nkoa et al. (2023), these indicators offer the advantage of providing more information on the government’s effectiveness and policies regarding energy expenditure in rural and urban spaces on this side and account for access to electricity on the supply side in infrastructural and non-infrastructural solutions (Garrone et al., Reference Garrone, Piscitello and D’Amelio2019). Although the measures introduced by Nkoa et al. (2023) represent real advancements compared to previous studies, Meka’a et al.’s (Reference Meka’a, Djamen and Noufelie2024) more recent contribution goes further. They show that focusing only on access to electricity can lead to biased results. The energy mix in Africa is dominated by fossil fuels, and much of the population does not have access to safe electricity. Instead, they use alternative energy sources for cooking and energy production (Lee et al., 2022). From this point of view, it is clear that more poverty indicators are needed that recognize that supply reliability is a major concern, especially in Africa (Ahlborg et al., Reference Ahlborg, Borang, Jagers and Soderholm2015). Two alternative MEPI are computed: Urban MEPI (Urban-MEPI) and rural (Rural-MEPI), where any energy proxy is measured in both urban and rural areas. Finally, for robustness, we followed Yang et al. (2023) to introduce renewable energy consumption as a proxy for energy poverty. The data for all our energy poverty indicators were collected from the WDIs. Finally, for robustness, we followed Yang et al. (2023) to introduce renewable energy consumption as a proxy for energy poverty. The data for all our energy poverty indicators were collected from the WDIs.
3.2.2 Independent Variable
As previously mentioned, GVC participation could have diverse influences on energy poverty, depending on the level of GVC involvement and the country’s position in the GVC, which consists of two parts: forward GVC participation degree (FVA) and backward GVC participation degree (DVX). Based on Wang et al. (2022) and Ji et al. (Reference Ji, Liu, Wu, Su, Ye and Feng2022), this study introduces three major indicators to measure GVC participation. The first is the share of FVA in gross exports, which captures backward linkages, or GVC participation. The second is the domestic value added to intermediate exports as a share of gross exports that report forward linkages or forward GVC participation. The last is the overall GVC participation, which involves backward and forward linkages. Backward linkages are calculated as the share of FVA in gross exports and forward linkage participation is captured as the DVX in intermediate exports (Koopman et al., Reference Koopman, Wang and Wei2014). These variables were extracted from the UNCTAD EORA database.
3.2.3 Moderating Variable
The present study introduces the quality of institutions as a moderating variable to investigate its role in moderating the effects of GVC participation on energy poverty. Thus, we followed Dosou et al. (2023) to use WGI, namely, control of corruption, government effectiveness, and regulatory quality. The data were extracted from the World Bank’s WGI.
3.2.4 Control Variables
To ensure the robustness of our model specification and to mitigate the potential biases that impact energy poverty, we include a series of control variables in our model. All control variables are collected from the World Development Indicators (WDIs) of the World Bank.
Economic growth: We followed Zhang et al. (Reference Zhang, Lin, Wang and Shahbaz2024) and Meka’a et al. (Reference Meka’a, Djamen and Noufelie2024) to capture economic growth with per capita GDP, and noticed that GDP is a crucial indicator of economic and energy development. An increase in economic growth is expected to lead to greater investment in the energy sector and an increase in energy access and consumption in Africa.
Foreign direct investment: According to Zhang and Fu (Reference Zhang and Fu2022) and Luo et al. (Reference Luo, Sun, Tao, Tan and Kamarudin2024), foreign direct investment (FDI) enhanced domestic innovation capabilities and significantly improved energy efficiency in China. Furthermore, Meka’a et al. (Reference Meka’a, Djamen and Noufelie2024) showed that through green technological innovation, FDIs could mitigate energy poverty in sub-Saharan Africa. Thus, FDI (as a percentage of GDP) is expected to reduce the EP.
Trade openness: The manner in which trade openness impacts energy development remains unclear. First, an increase in trade calls for intensive integration into the global market and access to sophisticated energy industries and services, which could increase the demand for clean energy (Shahbaz et al., 2014). Second, according to the pollution-haven hypothesis, trade liberalization could lead to enhanced polluting production in developing countries, where the quality of environmental regulations is weak, resulting in renewable energy reduction. However, we aligned our predictions with the current dominant findings (Luo et al., Reference Luo, Sun, Tao, Tan and Kamarudin2024; Dossou et al., 2023), supporting the negative effect of trade (measured as the ratio of trade to GDP) on EP.
Urbanization: Urban development is also linked to economic development, which can lead to economic and infrastructure development. Moreover, urban areas require more infrastructural investments and renewable energy sector input. We followed Meka’a et al. (Reference Meka’a, Djamen and Noufelie2024) to measure urbanization and expected a positive relationship with EP.
3.3 Model Specification
Based on the gap in the literature, this empirical study focuses on the role of GVCs and how the quality of institutions affects energy poverty at the global level, but specifically comparing both rural and urban areas.
Following previous theoretical and empirical contributions, we take advantage of the recent studies by Meka’a et al. (Reference Meka’a, Djamen and Noufelie2024) and Nkoa et al. (2024), who explained the dynamics and drivers of energy poverty in African countries, to build our empirical structure. We include the explanatory factors listed above of GVC participation and QI variables in order to ensure analytical rigor and comparability of international data. Our EP function takes the following form:
 \begin{equation}E{P_{it}} = f(GV{C_{it}};Q{I_{it}};{X_{it}})\end{equation}
 where  $E{P_{it}}$ measures the level of energy poverty of country i in year t, $GV{C_{it}}$ and $Q{I_{it}}{\text{ }}$capture the GVC participation degree of country i in year t and ${X_{it}}$ is the vector of baseline control variables. The econometric form of Equation (1) follows:
 \begin{equation}E{P_{it}} = {\beta _0} + {\beta _1}GV{C_{it}} + {\beta _2}Q{I_{it}} + \sum\limits_{i = 3}^6 {{\beta _i}{X_{it}}} + {\varepsilon _{it}}\end{equation}
 where  ${\beta _0}$ captures the unobserved parameters in our models, ${\beta _1}$ and ${\beta _2}$ are the parameters associated with GVC and QI respectively. ${\varepsilon _{it}}$ is the error term.
Equation (2) allows us to reach our first objective: to evaluate the direct influence of GVC participation on energy poverty. Furthermore, we include a multiplicative interaction term in equation (2) in order to reach the second objective that analyzes the mediating role played by QI in the GVC–EP nexus. Therefore, as suggested by Agradi (Reference Agradi2023), equation (3) includes the use of natural logarithms for all variables in order to eliminate the effects of data fluctuations and the potential heteroskedasticity. All other variables are converted to natural logarithms to ensure data non-volatility, with the exception of institutional quality. The final equation to be estimated is as follows:
 \begin{equation}\begin{gathered}
E{P_{it}} = {\beta _0} + {\beta _1}GV{C_{it}} + {\beta _2}Q{I_{it}} + {\beta _3}{(GVC \times QI)_{i,t}} + {\beta _4}GD{P_{it}} + {\beta _5}Trad + \\
{\beta _6}FD{I_{it}} + {\beta _7}UR{B_{it}} + {\varepsilon _{i,t}} \\
\end{gathered} \end{equation}
\begin{equation}\begin{gathered}
E{P_{it}} = {\beta _0} + {\beta _1}GV{C_{it}} + {\beta _2}Q{I_{it}} + {\beta _3}{(GVC \times QI)_{i,t}} + {\beta _4}GD{P_{it}} + {\beta _5}Trad + \\
{\beta _6}FD{I_{it}} + {\beta _7}UR{B_{it}} + {\varepsilon _{i,t}} \\
\end{gathered} \end{equation} where  $L$ represents the natural logarithmic operator and $(GVC \times QI)$ is the interaction term between GVC participation and the quality of institutions.
The results obtained from the estimation of Equation (3) cannot draw definitive conclusions. As noted by Meka’a et al. (Reference Meka’a, Djamen and Noufelie2024), by deepening our investigation we clearly appreciate the results of the mediating factor. For this purpose, we determine the net (total) effect of the direct effect of GVC on energy poverty. Following Luo et al. (Reference Luo, Sun, Tao, Tan and Kamarudin2024), the net effect ( ${\text{GV}}{{\text{C}}_{NEF}}$) of GVCs effect on EP trough QI, is computed as follows:
 \begin{equation}GV{C_{NEF}} = {\beta _1} + {\beta _3}\overline {QI} \end{equation}
 where  $\overline {QI} {\text{ }}$is the mean of quality of institutions.
Finally, it is further relevant to compute the threshold effect of QI, which means the optimal QI value needed to change the sign of the GVC coefficient. The computation of QI thresholds is based on the following formula:
 \begin{equation}Q{I_{it}} = - \frac{{{\beta _1}}}{{{\beta _3}}}\end{equation}
However, two conditions are necessary to justify the obtained fit in the threshold calculation: first, at least one coefficient from the direct and indirect effects should be statistically significant; and, second, these coefficients should have opposite signs (Meka’a et al., Reference Meka’a, Djamen and Noufelie2024).
3.4 Empirical Strategy
This subsection provides more precision on our econometric path, which is divided into three steps: the first step is the cross-sectional dependence and slope heterogeneity test; the second evaluates the short- and long-run relationships; and, finally, a set of robustness approaches is provided to evaluate the consistency of the baseline results.
3.4.1 Cross Sectional Dependence and Slope Heterogeneity Test
One of the major problems during the estimation process of the panel data model is cross-sectional dependence (CSD), which may lead to biased results. Indeed, as African countries are similar in economic, cultural, and geographic aspects, it is also observed that the changes and disruptions observed in the GVCs in recent years have redefined the links among them (Agradi, Reference Agradi2023). Therefore, this study introduces Pesaran’s (Reference Pesaran2004) cross-sectional dependence test (because N (51) is larger than T (29). The formulation of this test is as follows:
 \begin{equation*}{\delta _{CSD}} = \frac{{((T*N)(N - 1))}^{\frac{1}{2}}}{2}{\mathop {PR}\limits^{\hat{}}}_{N}\end{equation*}
 with N, representing the cross sections, T the stated time, and  ${\mathop {PR}\limits^{\hat{}}}_{N}$ illustrates the pairwise parameters.
Next, by considering the CSD issue, we test slope heterogeneity from Pesaran and Yamagata (Reference Pesaran and Yamagata2008), as follows.
 \begin{equation*}\mathop {{\Delta _{SH}}}\limits^{\hat{}} = {(N)^{\frac{1}{2}}}*{(2k)^{\frac{1}{2}}}*(\frac{1}{N}\mathop S\limits^{\hat{}} - k)\end{equation*}
 \begin{equation*}\mathop {{\Delta _{AdjSH}}}\limits^{\hat{}} = {(N)^{\frac{1}{2}}}*{\left( {\frac{{2k.(T - k - 1)}}{{T + 1}}} \right)^{^{ - \frac{1}{2}}}}*(\frac{1}{N}\mathop S\limits^{\hat{}} - k)\end{equation*}
 The previous equations  $\mathop {{\Delta _{SH}}}\limits^{\hat{}} $ and $\mathop {{\Delta _{AdjSH}}}\limits^{\hat{}} $, which take into account the delta and adjusted delta statistics, are made under the null hypothesis that ‘slope parameters are homogeneous across panel identities. $\hat{S}$, $k$,
$k$,  $T$, and $N$ respectively represent the Swamy’s statistics, regressors, time, and cross-sections.
3.4.2 Long-run Estimations
Given that a primary analysis has provided some relevant characteristics of our data, it is critical to choose the appropriate estimation method. Indeed, the occurrence of CSD has led to the abandonment of several recently adopted approaches to find energy poverty drivers. For instance, since our panel includes 51 countries over the 24 years (1995–2018), we cannot employ FGLS as did Meka’a et al. (Reference Meka’a, Djamen and Noufelie2024) and Nawaz and Rahman (2023), because the Park’s (1967) condition is not guaranteed (T large and N small). Additionally, although quantile regressions deal with heterogeneity, they fail to address the CSD issue. We follow Agradi (Reference Agradi2023), who uses DCCE-PMG to investigate how the long- and short-run remittances affect energy poverty in Africa. The author claimed that DCCE-PMG is more accurate than CCE-PMG because the dynamic specification addresses the endogeneity issue, as authors claimed a significant association in energy access between two consecutive periods. In addition, the GMM approach could solve the endogeneity issue, by including a dummy country that fails to address the cross-sectional issue (Hoechle, Reference Hoechle2007). DCCE is a substantial method to take into account both temporal and cross-sectional dependencies in a panel. Furthermore, DCCE-MG and DCCE-PMG estimators assume both heterogeneous coefficients in the short run; however, in the long run, the later assumes homogenous coefficients, while the former still assumes heterogeneous coefficients (Agradi, Reference Agradi2023). Indeed, short-run heterogeneity can be linked to diversity in institutions, economic development, culture, etc. However, all of these economies are likely to converge toward a steady state in the long run. Additionally, DCCE-PMG takes advantage of the Driscoll and Kraay (Reference Driscoll and Kraay1998) and DCCE-MG methods, as DCCE-PMG, by including cross-sectional dependence, symptomatically exhibits a differential effect due to unobserved common factors even if the number of unobserved common factors is unknown (Pesaran, Reference Pesaran2006). However, the Driscolland Kraay method is limited, especially in their assumptions, and it remains difficult to generalize, especially in the presence of unobserved common factors. Therefore, DCCE-PMG is a more efficient estimate to provide accurate results in the long run (Chudik and Pesaran, 2013). As Kim and Lin (2018) and Agradi (Reference Agradi2023) state, we agree that this approach appears to be the best choice for our sample as it accounts for the homogeneity across countries in the long run and countries specificities in the short run.
3.4.3 Robustness Check
To check the consistency and reliability of our findings, we introduce a set of robustness approaches that include the optional measures of our variables of interest, sub-sample robustness, and another estimation method.
4. Results
4.1 Preliminary Analyses
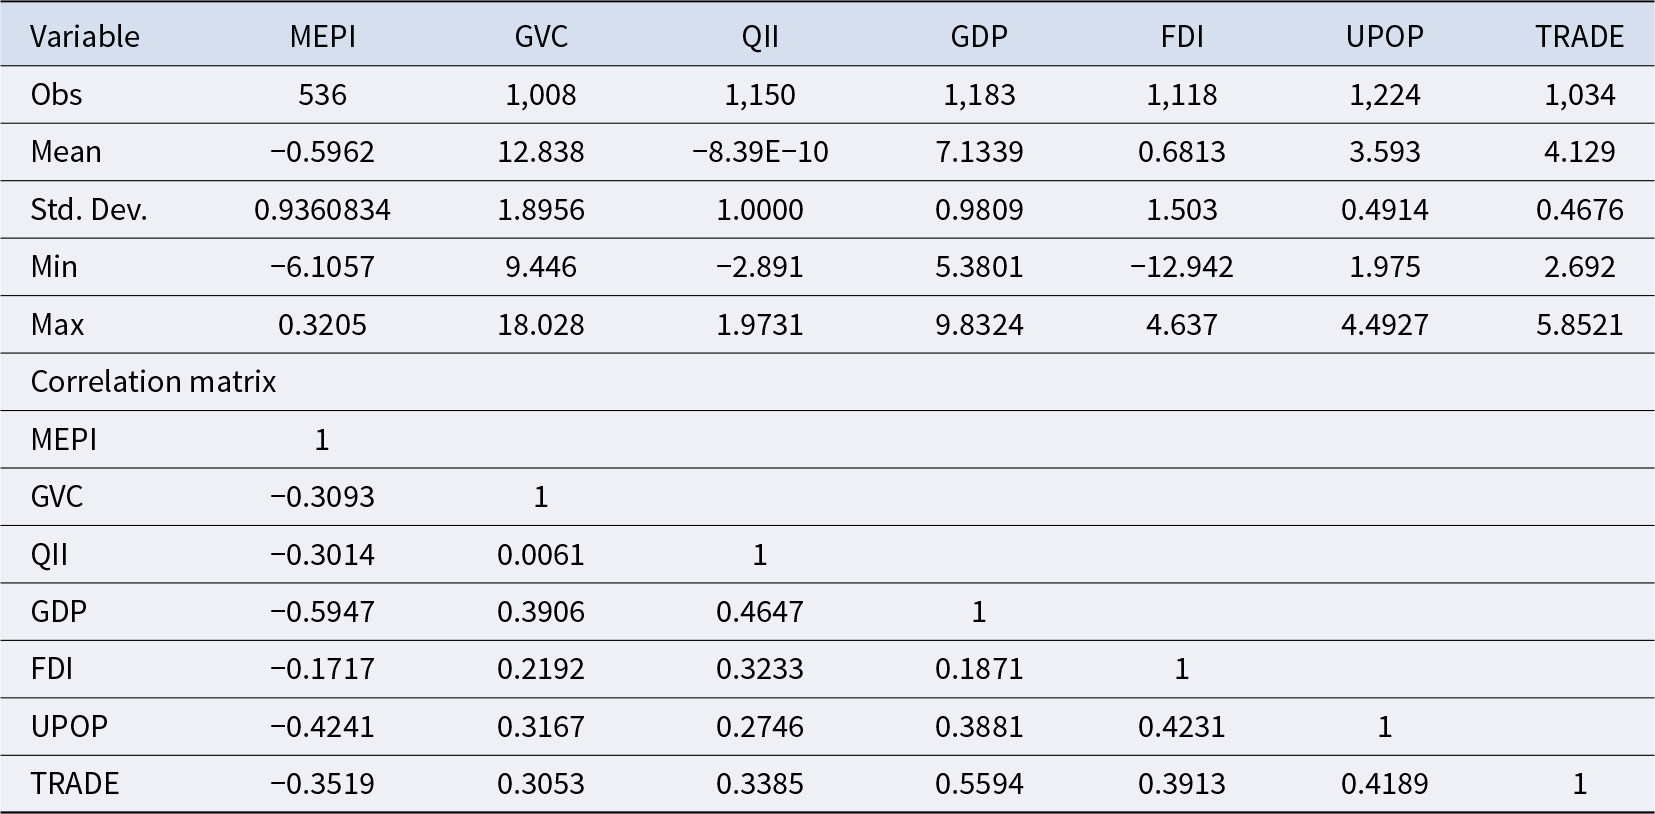
First, the focus, from a proper perspective, is on the descriptive properties of the variables to be analyzed. Table 1 presents a summary of the descriptive statistics and the correlation matrix. It appears that MEPI is –0.596, meaning that nearly 60% of the population has no access to both electricity and CFT, which are bounded by the minimum and maximum values of –0.6105 and 0.320, respectively.
Table 1. Descriptive statistics
Source: Authors.
Moreover, the maximum and minimum values of the GVCs were 9.44 and 18.028, respectively, with an average of 12.838. We also observe that the value of the standard deviation (sdt.dev) range from 0.467 to 1.895, revealing low variability in the distribution of any series in the panel. In the pairwise analysis, the correlation matrix among the variables reveals that the main variable (multidimensional energy poverty) is negatively correlated with all explanatory variables in the study. In contrast, there is a positive correlation between each explanatory variable and other variables. Second, all the coefficients of the correlation matrix are relatively low, given that they are less than the conventional threshold (0.6).
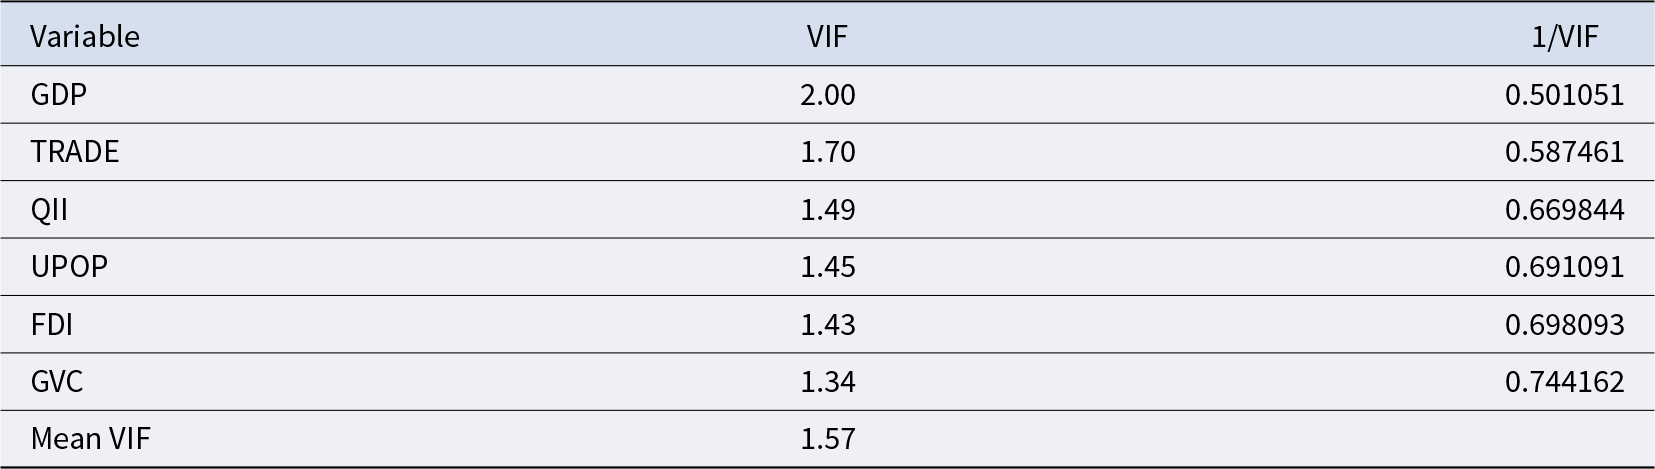
However, to conclude about the significant threat of multicollinearity, we proceed to the Variance Inflation Factor (VIF) and tolerance (1/VIF) tests (Table 2). The general rule of thumb is used to validate the potential presence of multicollinearity and assumes that multicollinearity occurs if the VIF is less than 10 (or greater than 0.1) (Miles, 2014).
Table 2. Test for multicollinearity

Source: Authors.
Regarding the values in Table 2, it is apparent that all VIFs are less than or equal to 2 (0.501). This indicates that a serious multicollinearity threat does not occur, and the regression estimations in this analysis are reliable.
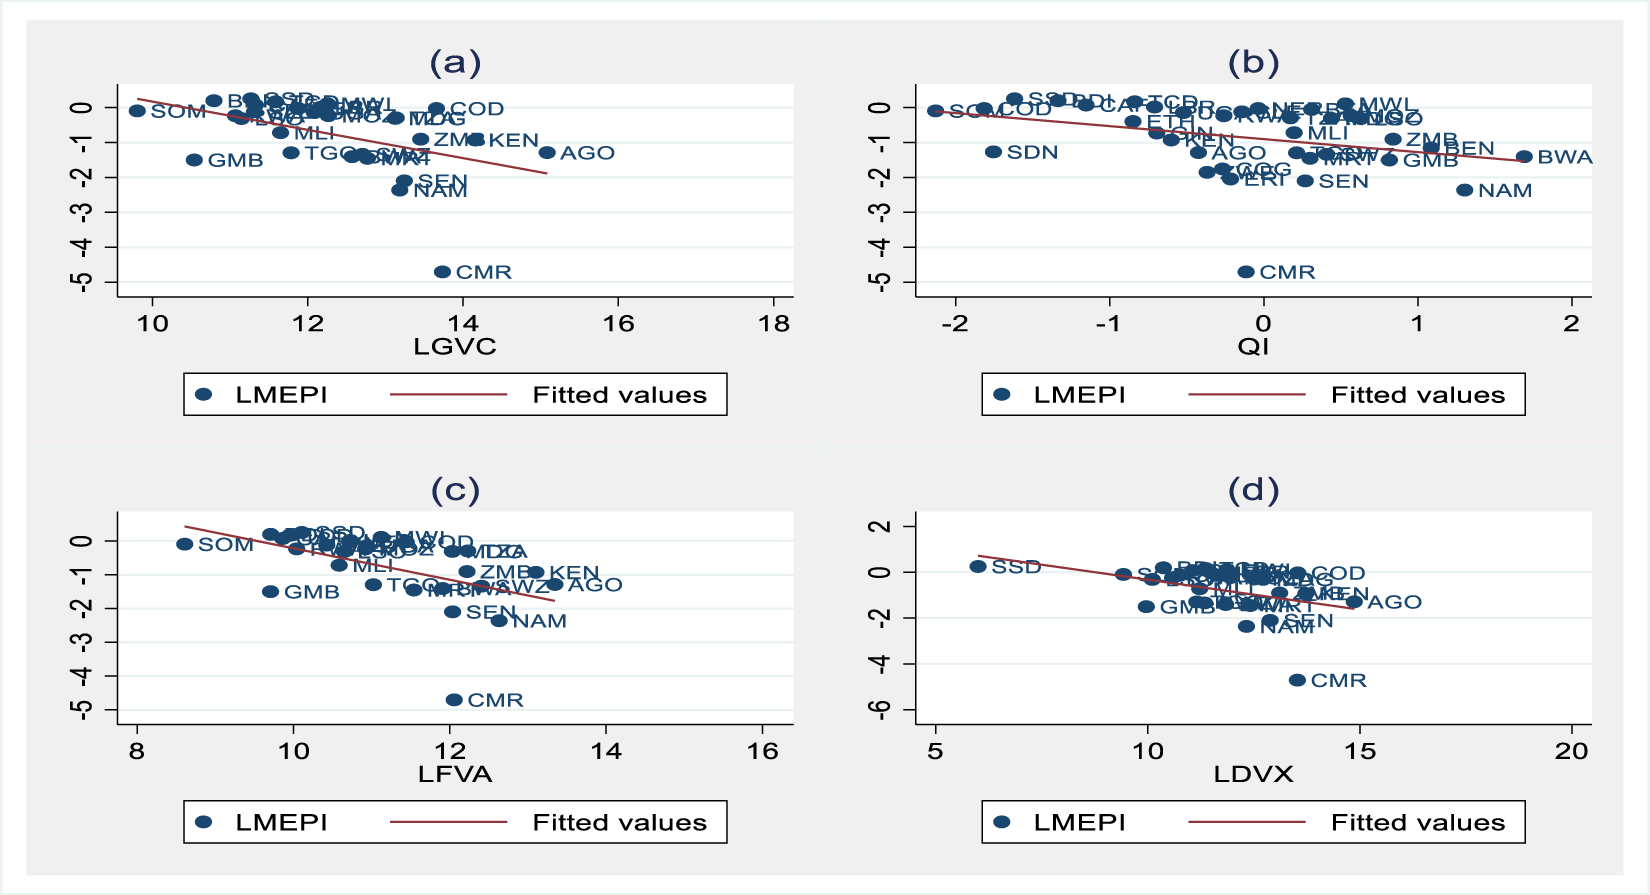
Figure 1 displays the nexus between the proxies of the value chain, multidimensional energy poverty, and institutional quality. A negative association appears between total GVC (fig. (a)), FVA (fig. (c)), DVX (fig. (d)), and QI (fig. (b)) and energy poverty. Irrespective of the case, a negative link is depicted, confirming the observations from the pairwise analysis. Thus, GVC and QI are likely to reduce multidimensional energy poverty. Moreover, Cameroon and Namibia both suffer from energy poverty, while South Sudan, Malawi, and Tchad are among the top three countries with higher threats to multidimensional energy poverty.

Figure 1. GVCs, QI, and multiregional energy poverty proxies.
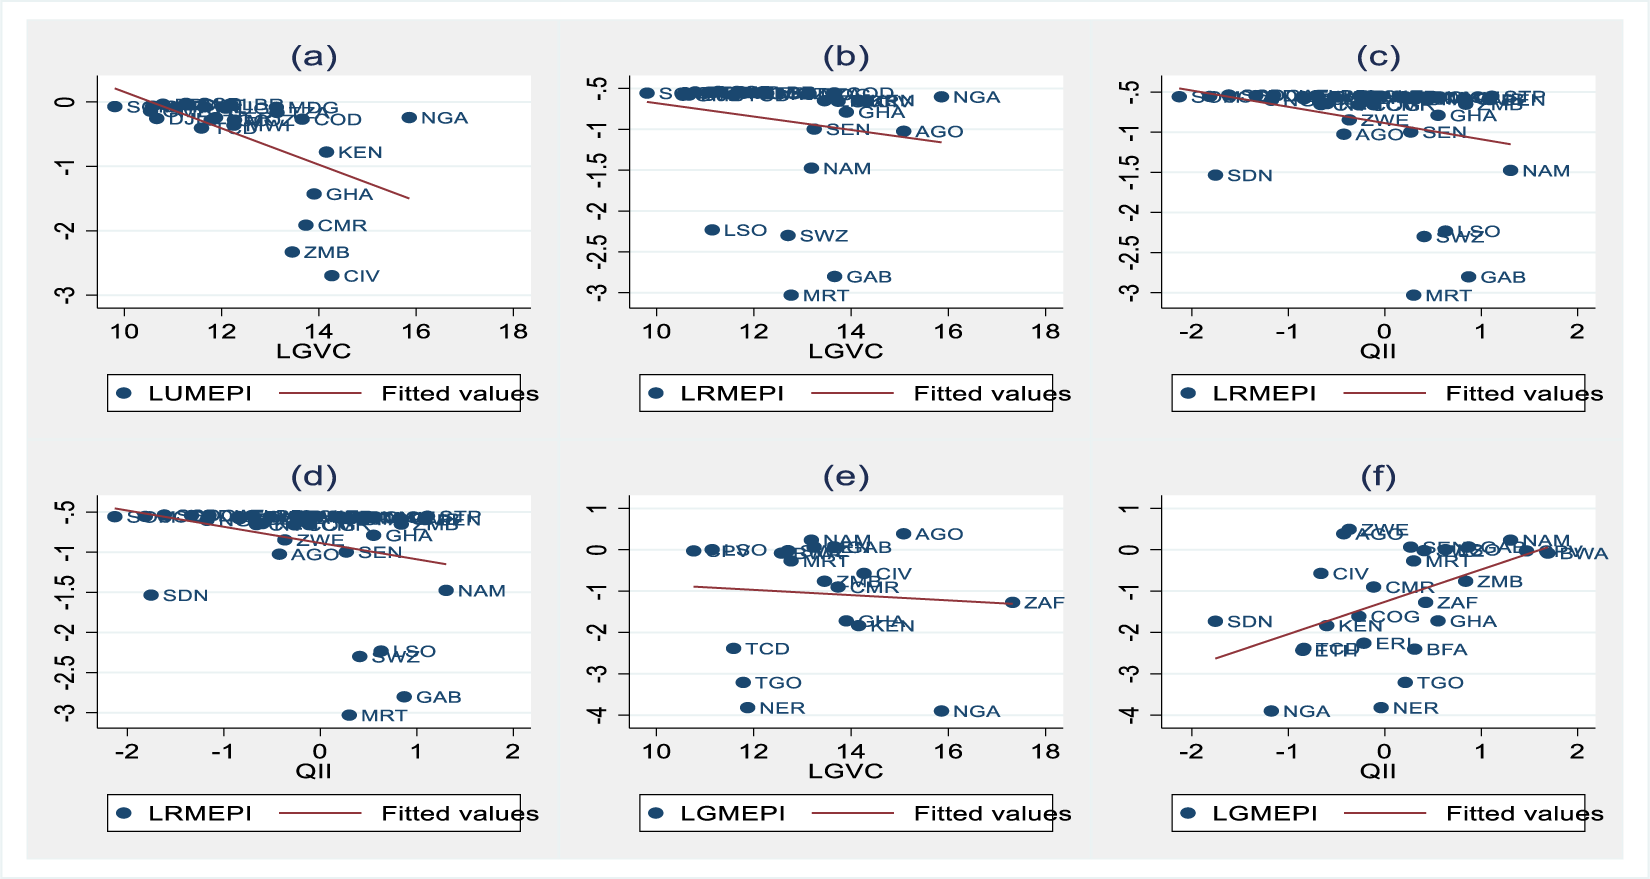
Figure 2 displays the GVC-MEPI (figs (a) and (b)) and QI-MEPI (figs (c) and (d)) relationships by considering urban–rural heterogeneity; negative links are depicted in any case. Similar observations occur in both urban and rural multidimensional energy poverty: ((a) and (c) for urban and (b) and (d) for rural. However, evidence regarding the nexus with the rural–urban gap in the MEPI is mixed. Indeed, a negative nexus arises between GVC and GMEPI, whereas a positive link is observed with the quality of the institution. Furthermore, energy poverty is higher in rural areas than in urban areas (positive value of gap), except for Angola, Namibia, and Zimbabwe, where the gaps are negative, and MEPI is more severe in urban areas than in rural areas.

Figure 2. Global value chain proxies, QI, and multiregional energy poverty.
Table 3 presents the findings from a set of statistical CSD tests, including CD (Pessaran (2015/2021), CDw (Juodis and Reese, 2021), and CDW+ (Fan et al., 2015), which are combined CDw with power enhancement, and CD* (Pesaran and Xie, 2021). The test evaluates CSD occurrence and is at a weakness level, as the null hypothesis is either strict or weak cross-sectional independence. The advantage of these tests is that they are suitable for balanced and unbalanced panels. The results indicate that each series is statistically significant for at least one among these statistical tests. Therefore, we cannot validate the null hypotheses; therefore, we conclude with a strong CSD among the economies in our panel. GVC participation, FDI, and TRADE are directly responsible for the interdependence of economies (Uddin et al., 2023), which justifies the fundamentals of the statistical result. Consequently, because ordinary regressions are likely to provide spurious results, we employ a modern econometric method to provide accurate outcomes.
Table 3. Test for cross-sectional dependence (CSD)
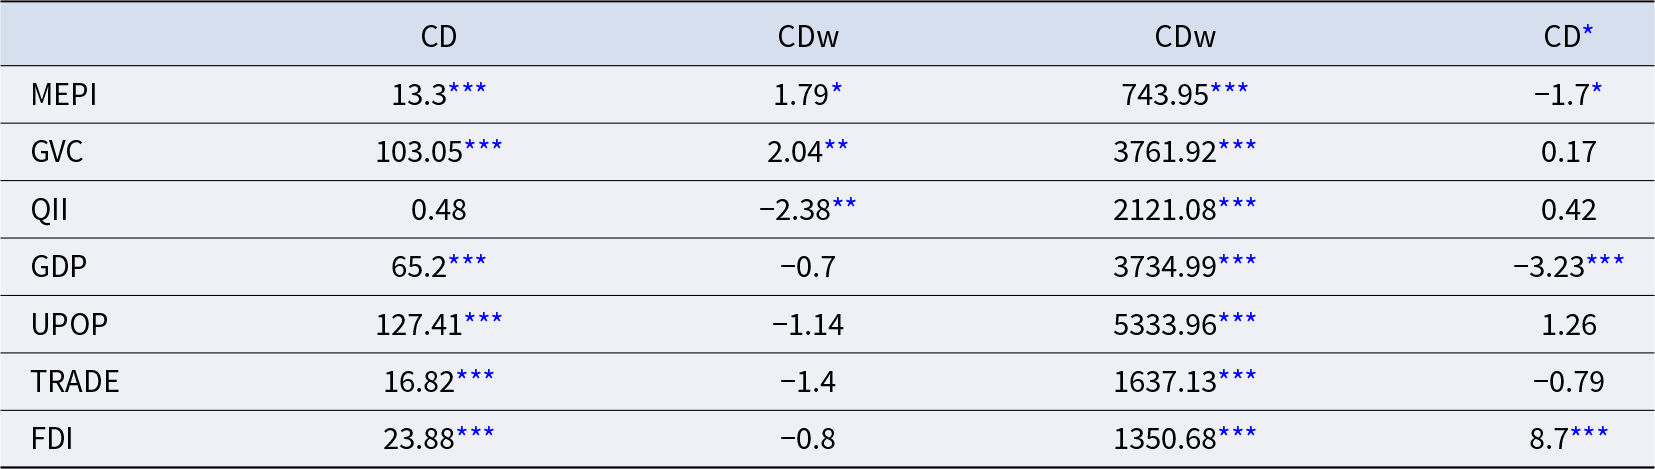
***, **, and * Notes: Standard errors are shown in the brackets. refer to significant at 0.01, 0.05, and 0.10 level, respectively.
Source: Authors.
Figure 3 depicts the nexus between each GVC participation proxy, including forward added value in exportation (FVA), backward GVC participation (DVX), and multidimensional energy poverty proxies, including rural, urban, and rural–urban gaps in MEPI. The results reveal that except for FVA-GAP in the MEPI nexus, where it is nearly constant, all other relationships are negative, meaning that the GVC, irrespective of the penetration method, may contribute to mitigating energy poverty in both rural and urban areas, and the rural–urban gap.
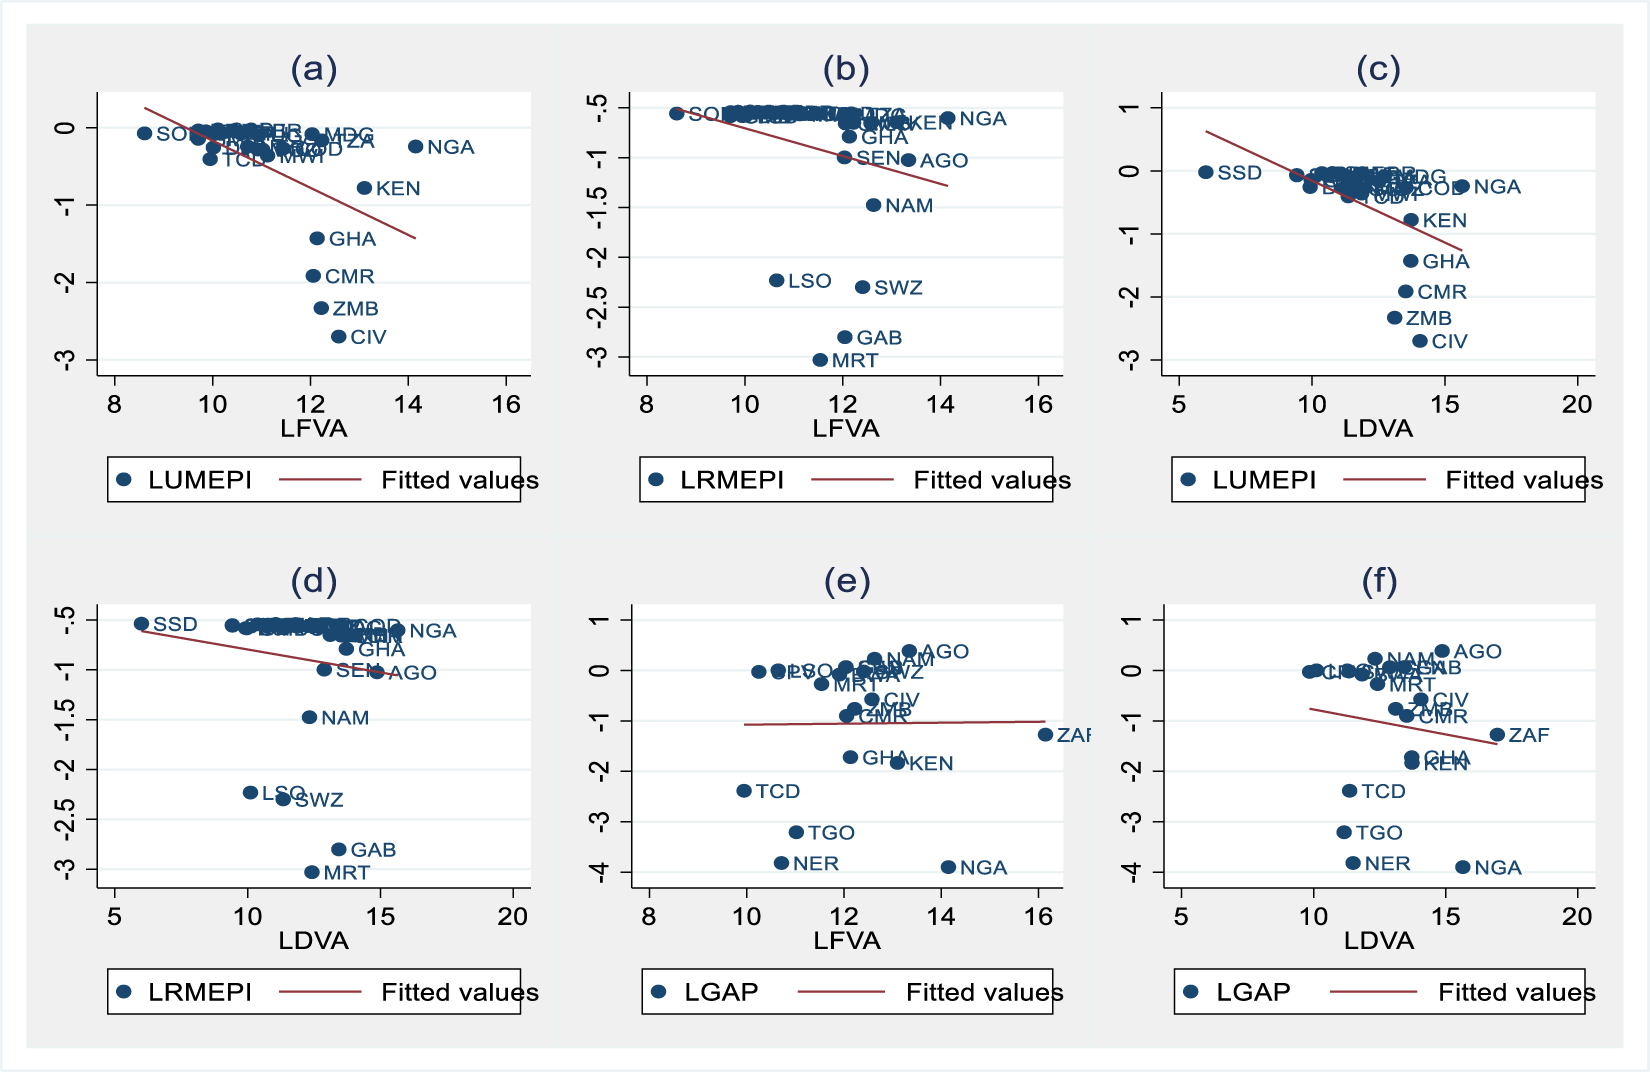
Figure 3. Global value chain proxies and multiregional energy poverty proxies.
4.1 Empirical Analysis
After investigating the necessary preliminary diagnostic analysis, the emphasis now moves toward the empirical part of the study regarding the direct and indirect effects of GVC on MEPI through the quality of institutions. For this purpose, the baseline model uses the DCCE-PMG method, and the findings are presented in Tables 4 and 5, where the short- and long-run effects, respectively, are carried out.
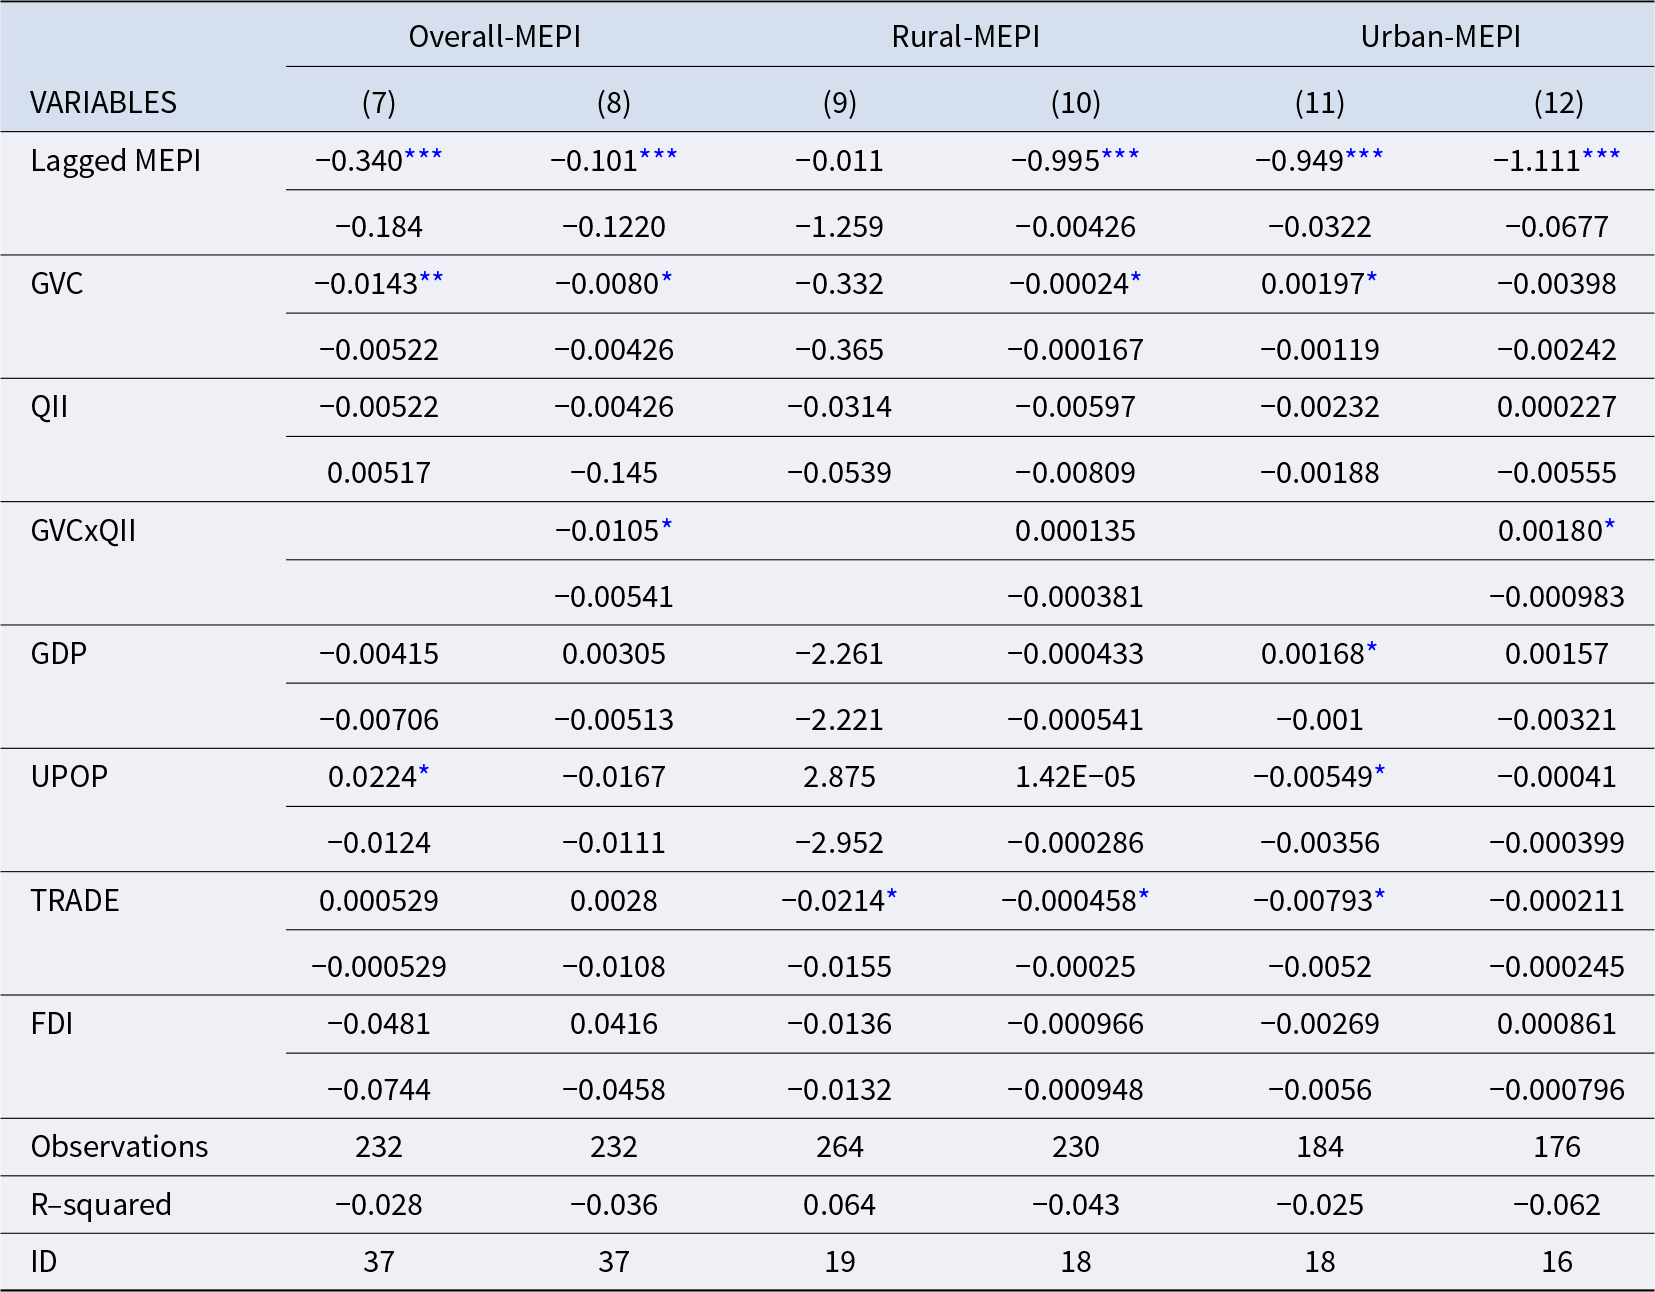
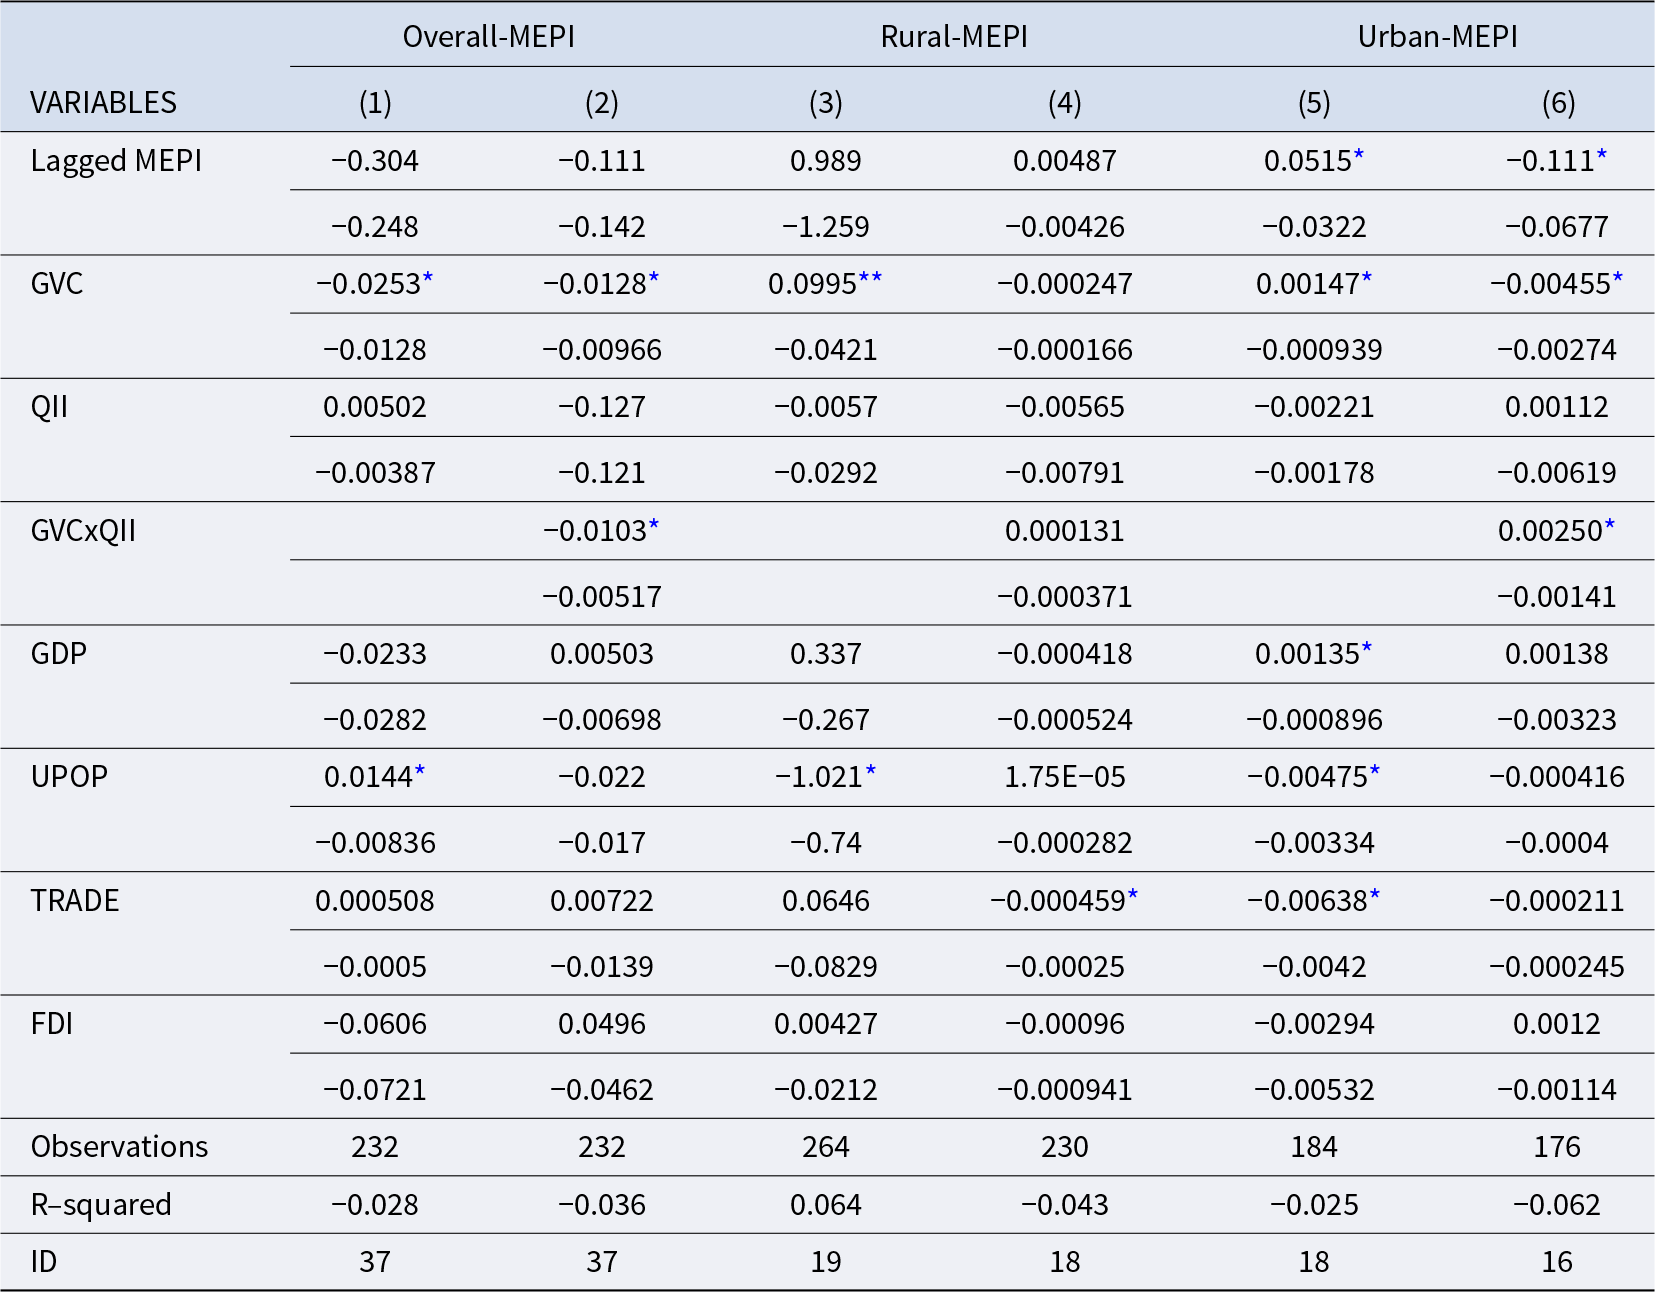
Table 4. Mediating role of QI in GVCs and multidimensional energy poverty: short-run analysis

***, **, and * Notes: Standard errors are below coefficients. refer to statistical significance at 0.05 and 0.10 levels, respectively.
Source: Authors.
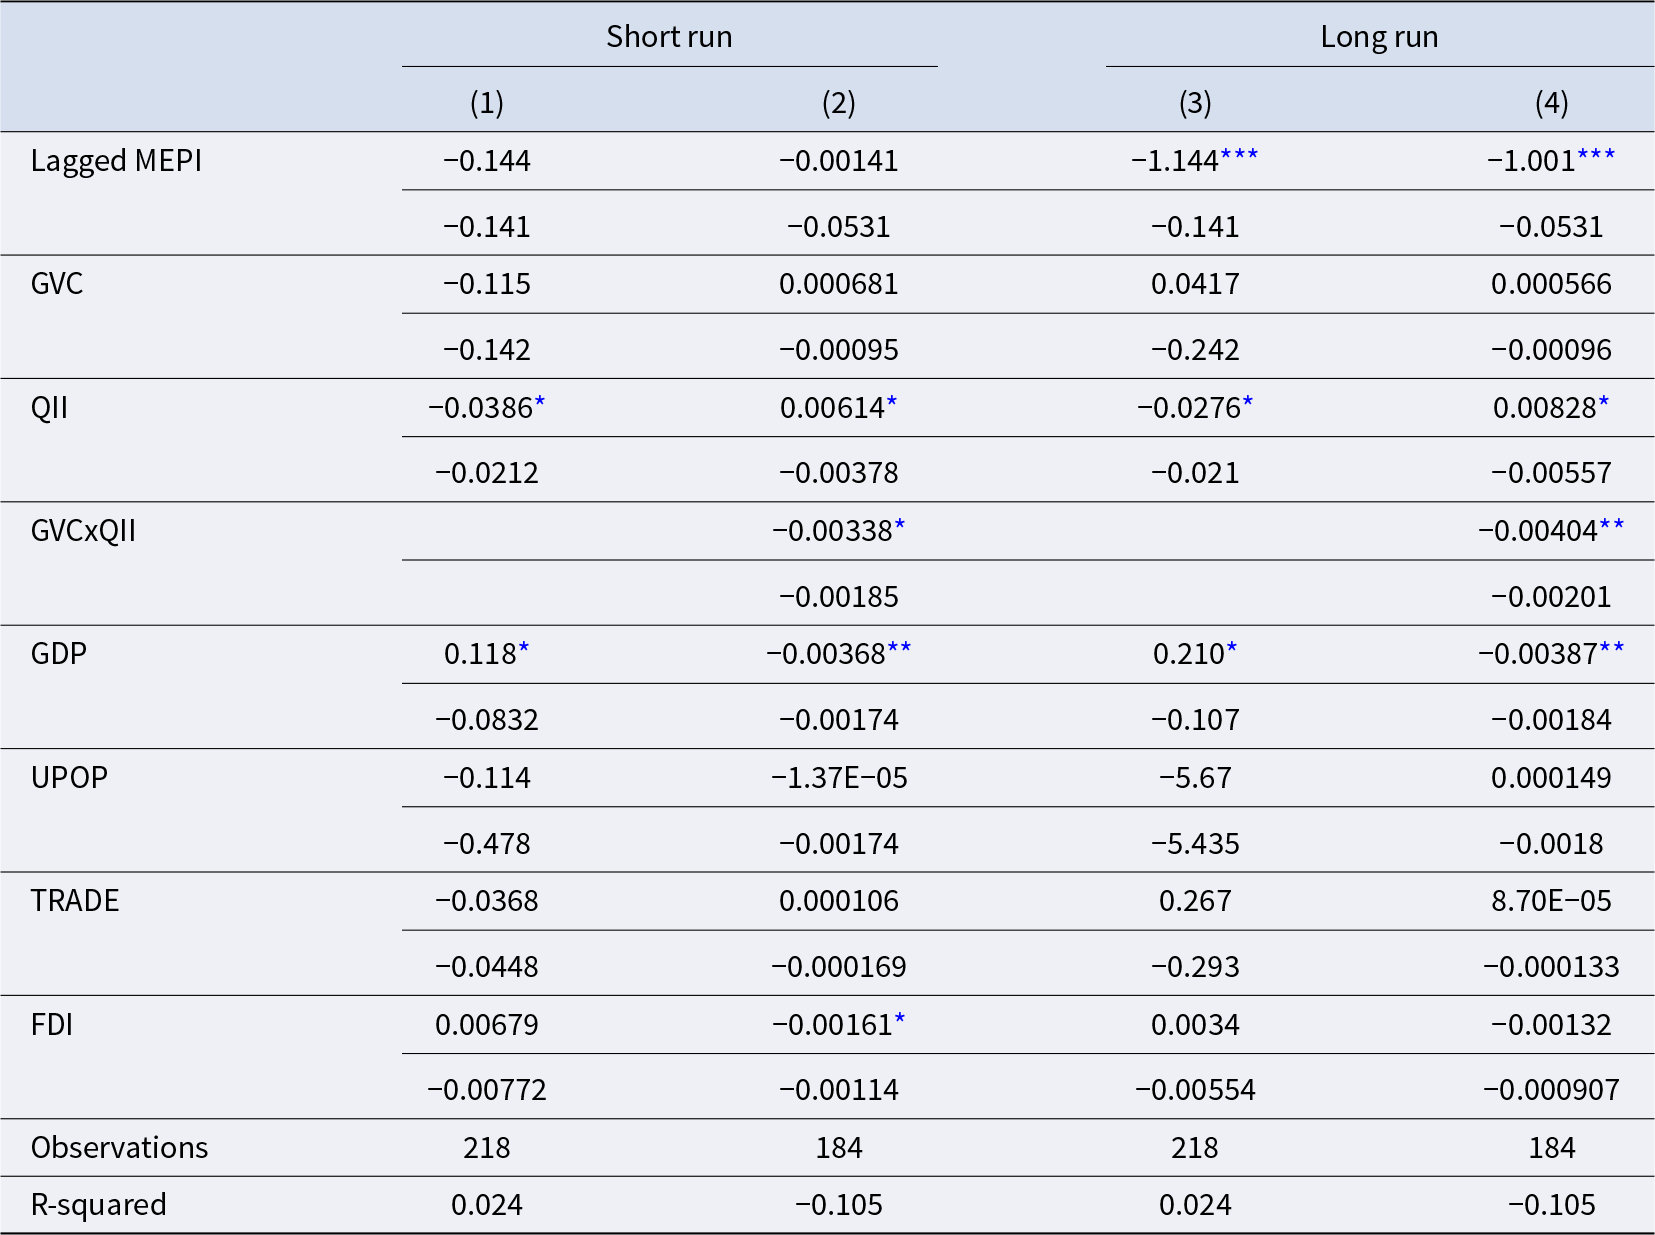
Table 5. Mediating role of QI in GVCs and multidimensional energy poverty: long-run analysis
***, **, and * Notes: Standard errors are below coefficients. refer to statistical significance at 0.01, 0.05, and 0.10 levels, respectively.
Source: Authors.
Table 4 shows the results in the short run and includes three EP proxies as dependent variables: total multidimensional energy poverty (Overall-MEPI) (Columns 1 and 2), Rural MEPI (Columns 3 and 4), and Urban-MEPI (Columns 5 and 6). Additionally, sub-columns (1), (3), and (5) present the coefficients of the direct impact, while columns (2), (4), and (6) focus on the conditional effect.
The results in column 1 (Table 4) show a significant and negative effect of total GVC participation on total MEPI at the 10% statistical level, where the GVC’s coefficients are 0.0253. However, columns (3) and (5) show positive and significant coefficients associated with total GVCs, reaching 0.00147 and 0.996 for urban and rural areas, respectively. That is, a 10% increase in total GVC participation leads to a 0.253% decrease in global MEPI, contrary to 0.014% and 9.96% increases in urban and rural MEPI, respectively. Consequently, although the direct effect of total GVC participation alleviates energy poverty, rural and urban energy poverty increase, with the most severe in rural areas. However, the results show that institutional quality does not affect the MEPI for our three energy poverty proxies (Table 4).
Regarding the pathway through which total GVC influences MEPI, the role of institutional quality was investigated. Following the inclusion of the multiplicative interaction term (GVCxQII), results as reported in column (2), (4), and (6) show first that the direct effects of GVC on energy poverty remain negative, irrespectively of MEPI area. Second, a negative (positive) and significant coefficient arises for the overall-MEPI (Urban-MEPI), and negative but insignificant for the rural area. Thus, the QI level remains insufficient to allow GVC participation to significantly influence rural energy poverty in the short run. Accordingly, in the short run, the dynamics of GVC involvement led to a direct reduction in energy poverty, and institutional quality significantly influences the sign and magnitude of this nexus, which varies according to residential area.
Moving to the long-run investigation, the findings of which are presented in Table 5, the total GVC reduces MEPI at both the overall (columns 7 and 8), rural (column 10), and urban (column 11) scales. Specifically, a 10% increase in total GVC participation directly leads to decreases in energy poverty by between 0.0805% and 0.143% overall, 0.00247% in rural areas, and 0.0197% in urban areas. Moving to the analysis of the conditional effect through the quality of institution in the above nexus, we focus on the features of the coefficient of the multiplicative interaction term between the QI index and total GVC.
The findings allow us to observe the direct negative effect of total GVC participation on MEPI for each MEPI proxy; however, the interaction term’s coefficients are statistically significant for both overall and urban-MEPI proxies, although they are negative in the former and earlier cases. A similar finding occurs in the short run where, through the quality of institutions, total GVCs allow the reduction of total multidimensional energy poverty, while the urban population will continue to experience severe energy poverty given the inefficient institution. Finally, the quality of institutions is still too low to enable GVCs to reduce MEPI in rural areas.
Furthermore, we examine the QI level’s target from where this goal had been achieved in rural areas. This could provide more polished and enhanced policy options and perspectives. The results in columns (10) and (12) allow us to compute from columns (5) the QI threshold and find 0.183 for the rural areas and 0.221 for the urban areas.
These represent the minimum QI levels required to reach the GVC participation to mitigate the MEPI. Comparative to the current QI level of –0.611, this clearly implies that in the long run most effort is needed for SSA policymakers to enhance institutional quality levels from the perspective of addressing the issue of energy poverty. It is further important to observe that the magnitude is higher in the short term than in the long run, implying that the reduction in energy poverty through strengthening total GVC participation and institutional quality may decrease over time.
Regarding the control variables, the results show that, irrespective of the period, GDP leads to an increase in urban energy poverty, while trade openness enables it to reduce it for both rural and urban areas. Additionally, the urban population is positively associated with total MEPI but negatively associated with rural–urban areas; however, we cannot find evidence regarding FDI’s effect.
During the investigation of total GVC and the moderating role of QI on total, rural, and urban MEPI, we emphasize the rural–urban gap in MEPI (Table 6). The analyses examine the effect both in the short and long run, and both the unconditional (columns 1 and 2) and conditional (columns 3 and 4) effects. This is relevant to help policymakers design and achieve the target public policies, specifically in fulfilling spatial inequality in access to energy. Therefore, the findings in Table 6 reveal that total GVC does not significantly influence the rural-urban energy poverty gap, both in the long run and short run. In addition, institutional quality revealed further relevant observations. In particular, a 10% improvement in QI contributes to a reduction in the rural-urban MEPI gap by nearly 0.38% and 0.27%, respectively.
Table 6. Pathway of GVC into rural–urban MEPI gap: the role of institutional quality

***, **, and * Notes: Standard errors are below coefficients. refer to statistical significance at 0.01, 0.05, and 0.10 levels, respectively.
Source: Authors.
However, we find significant and negative coefficients of the crossed term in both the long and short run, while the direct effect is still insignificant and positive. Moreover, opposing coefficient signs appear between the GVC and crossed variables, revealing the necessity to find a QI threshold. In other words, through the increase in GVC participation, spatial inequality in energy poverty can be achieved through better institutions. Especially, QI thresholds should reach to 0.201 in the short run and 0.14 in the long run, in order to reduce rural–urban gap in Africa’s MEPI through the promotion of total GVCs, thereby, policymaker should work in moving the QI level from –0.62 (current average level) to 0.201 level.
4.1.1 Robustness Checks
This section sheds light on the robustness of baseline results. For this purpose, several alternative analyses were carried out, including alternative measures of MEPI, GVC, quality of institution, and alternative methods.
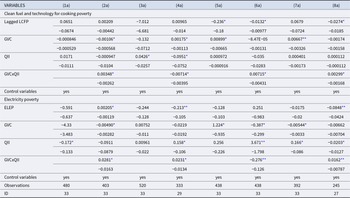
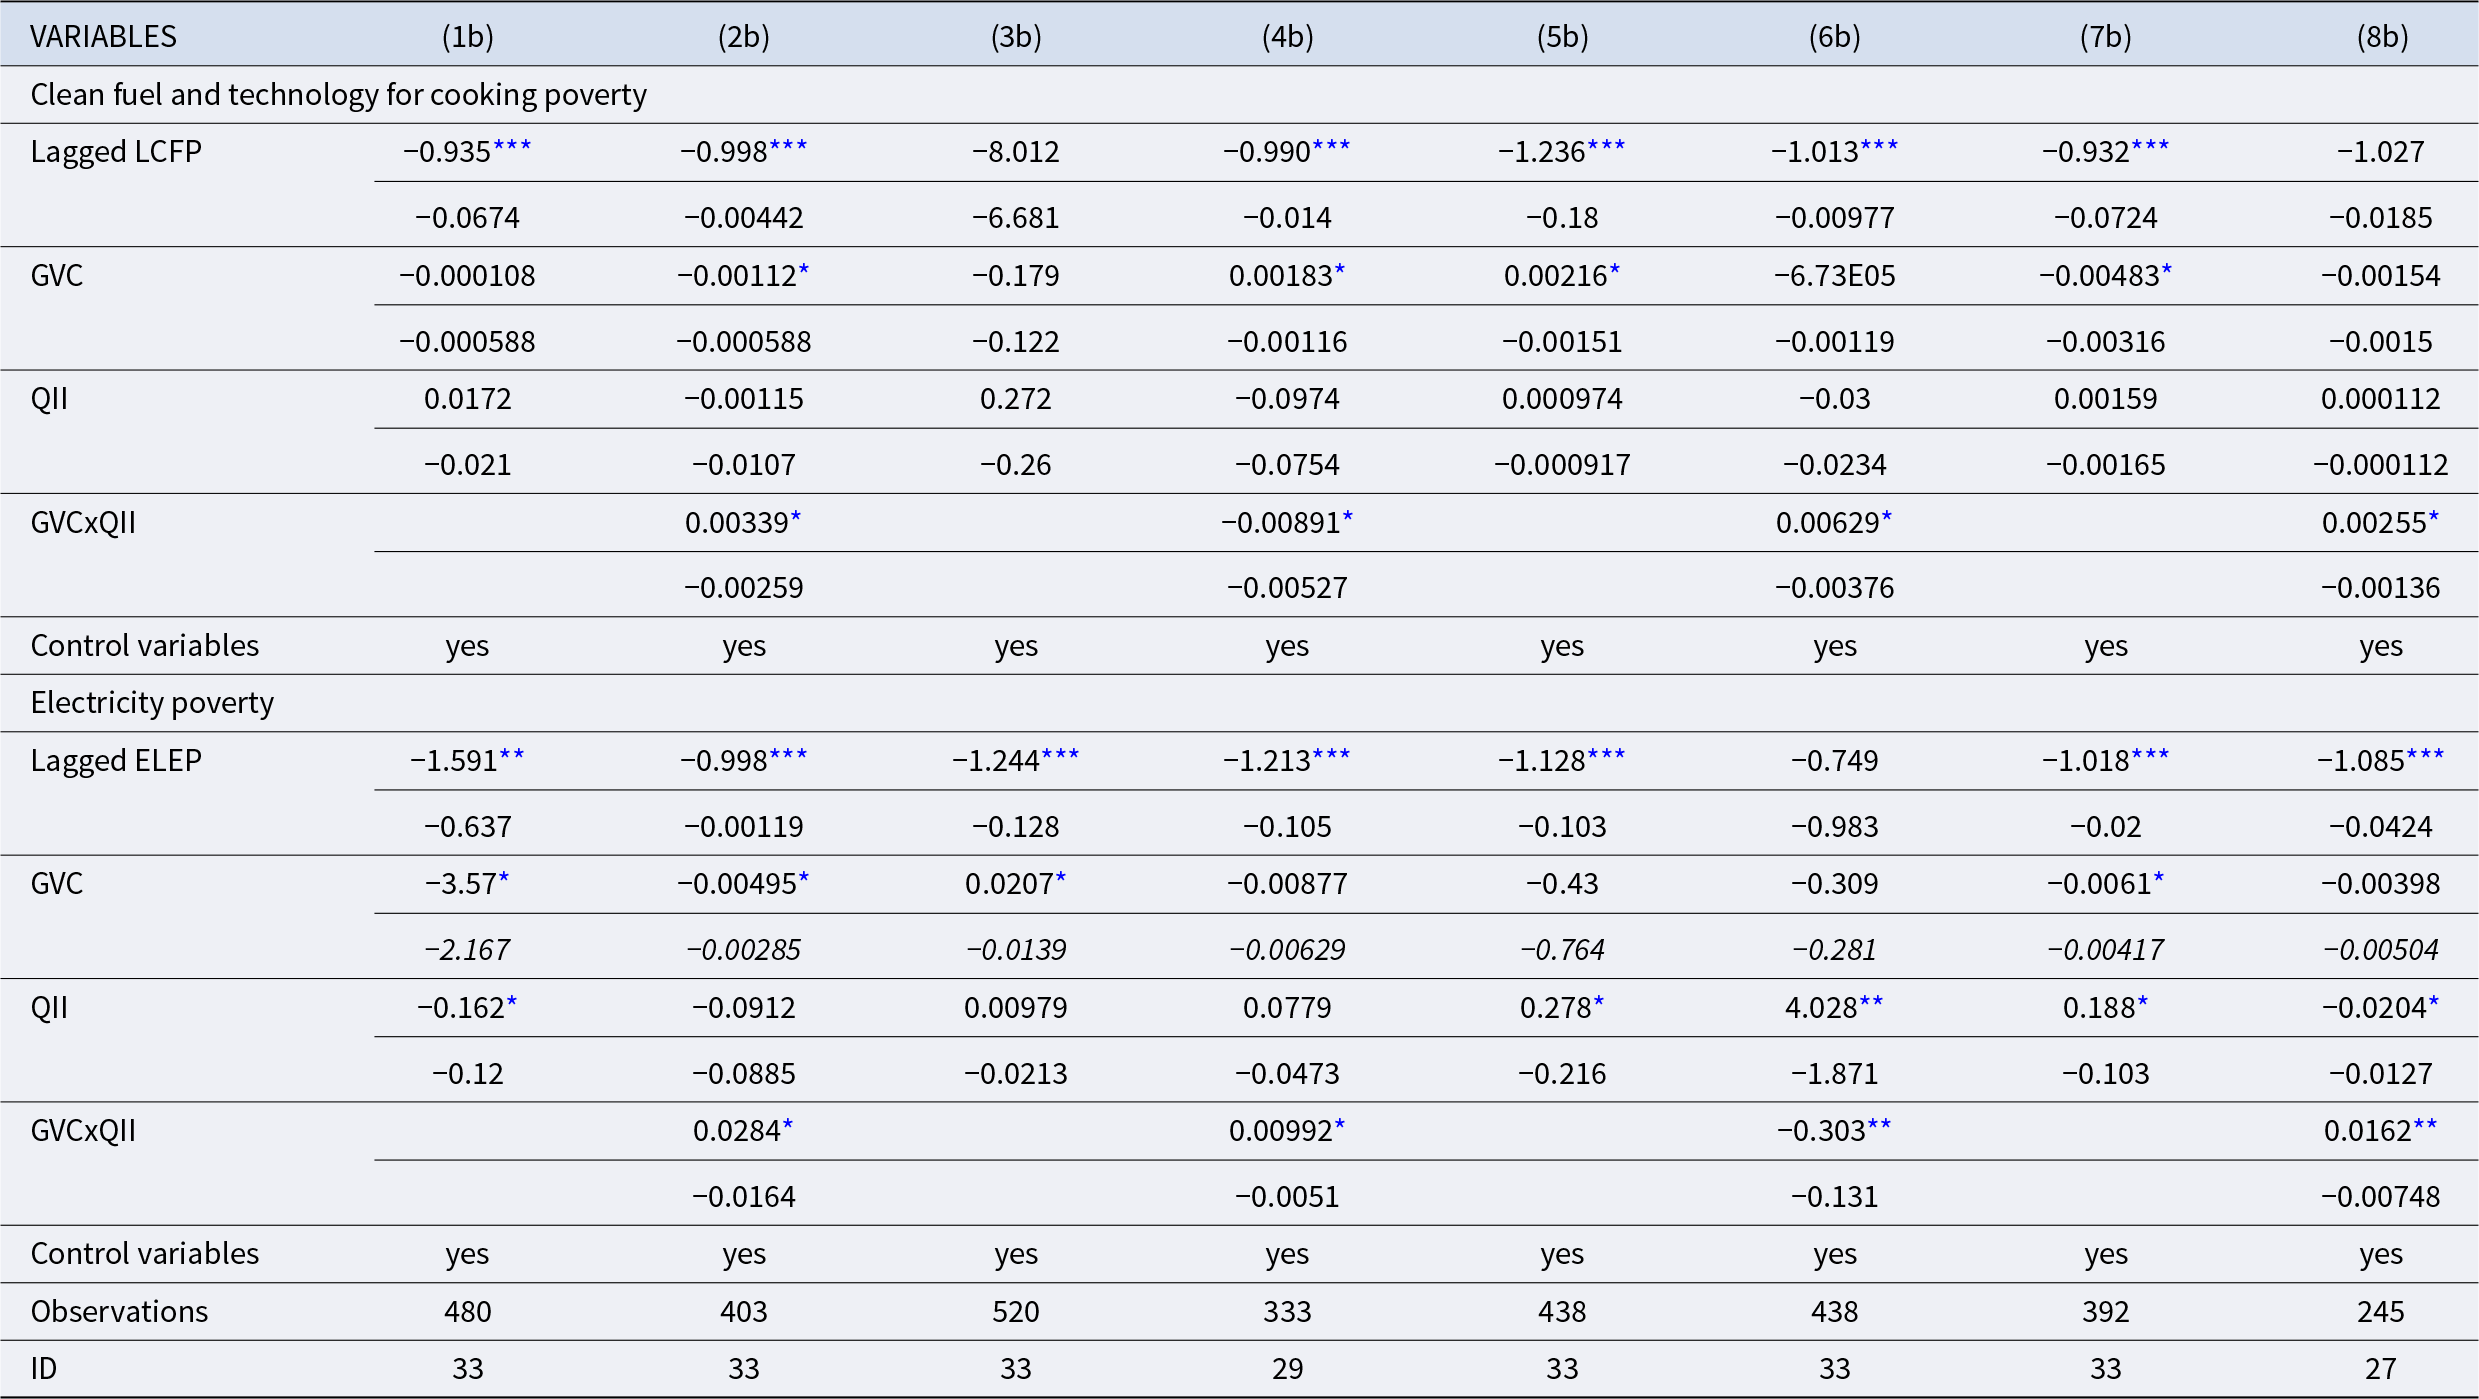
To gauge the heterogeneity effect of GVC participation and the QI index on energy poverty, we first focus on two energy poverty sub-indices: electricity poverty (bottom of Tables 7a and 7b) and clean fuel and technology for cooking poverty (top of Tables 7a and 7b). We further consider each index according to area, and the rural–urban gap between them. The results are included in Tables 7a and 7b, with the short- and long-run analyses. Irrespective of the energy poverty nexus, the results in columns (1a and 1b) of Tables 7a and 7b show a negative nexus between the GVC and any energy poverty sub-indices in the short- and long-run. This is similar to the findings of the baseline. Furthermore, the impact of GVC participation on any EP proxy was negative in both rural and urban areas. This means that, in the short run, GVC is likely to directly reduce rural CFT poverty, while urban areas will experience severe energy poverty with an increase in GVC participation. These effects lead to reinforcement through the channel of the conditional effect (Columns 2a, 4a, 6a), and the quality of institutions is still relevant to enable GVC to influence the dynamics of energy poverty. In contrast, it appears that GVCs lead to strengthening energy poverty in the long-run, irrespective of both the energy sub-index and area (Table 7b). However, QI enables mitigation of the negative effect of GVCs on both global CFT and global electricity poverty (Table 7b, column 1b).
Table 7a. CFT poverty, electricity poverty, and rural–urban energy poverty gap: short-run analysis
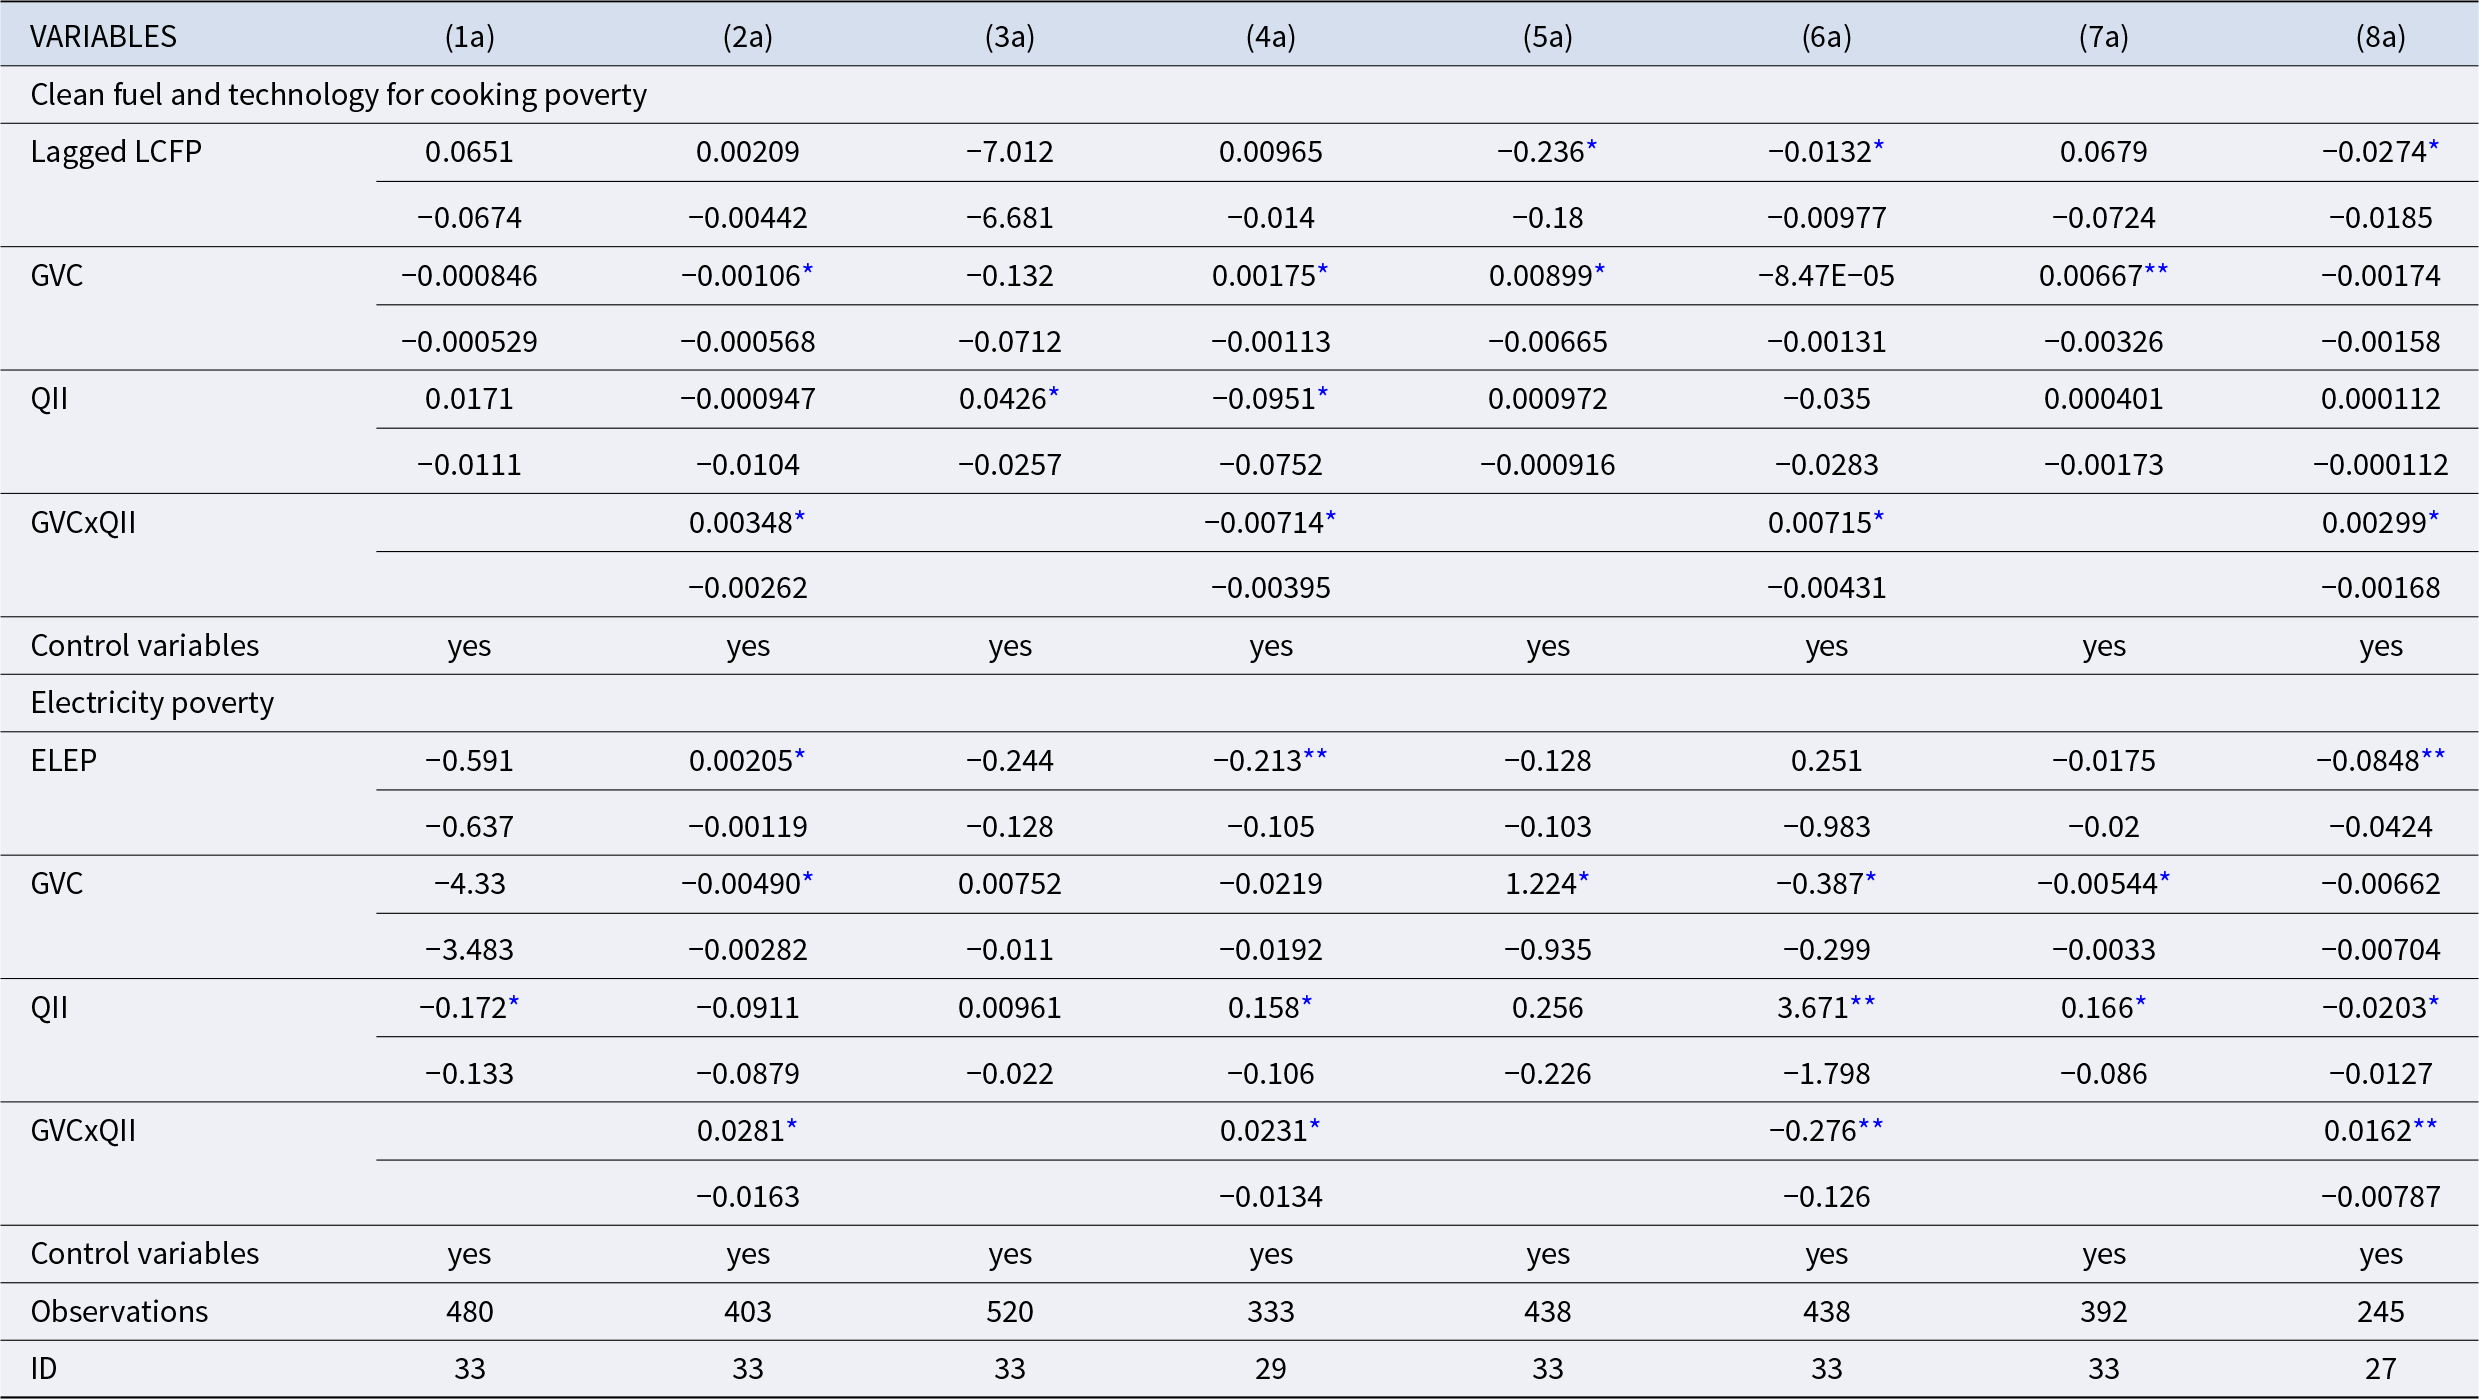
***, **, and * Notes: Standard errors are below coefficients. refer to statistical significance at 0.05 and 0.10 levels, respectively.
Source: Authors.
Table 7b. CFT poverty, electricity poverty, and rural–urban energy poverty gap: long-run Analysis

***, **, and * Notes: Standard errors are below coefficients. refer to statistical significance at 0.01, 0.05, and 0.10 levels, respectively
Source: Authors.
In particular, QI interacts with GVC to strengthen the reduction in rural-CFT poverty, while it leads to deep urban and global CFT poverty. Moving to the bottom of Table 7a, the QI-GVC nexus has a negative and significant effect on urban electricity; in contrast, a positive impact on total and rural electricity poverty occurs. Moreover, through QI, GVCs enable mitigation of urban-CFT poverty (top of Table 7b, column 4b) and the rural-electricity poverty (bottom of Table 7b, column 6b).
Finally, we observe that GVC participation enables an increase in the rural–urban CFT gap, but decreases rural–urban electricity poverty; however, through poor QI, GVC will significantly foster energy poverty both in the long (Column 8b) and short run (Column 8a), irrespective of proxy. Regarding the findings in the long run, GVC participation leads to reduced energy poverty via an increase in both electricity and CFT access. Furthermore, it appears that electricity poverty will increase in rural areas due to an increase in GVCs, but not in urban areas, while both rural and urban areas experience dampening in CFT.
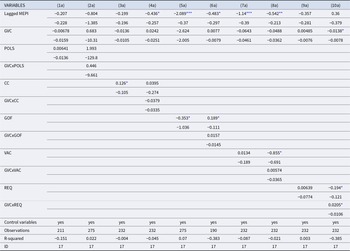
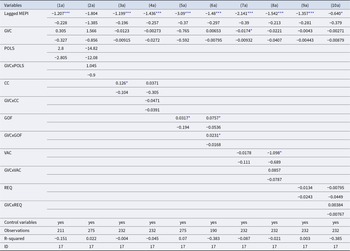
Moreover, an additional problem this study attempted to solve is to move over the global institutional measures and distinguish the differential roles played by any institutional type. The results are shown in Tables 8a and 8b, for the short- and long-run investigations, respectively. The results remained negative.
Table 8a. Alternatives measurement for Institutional Quality: short-run analysis

***, **, and * Notes: Standard errors are below coefficients. refer to statistical significance at 0.01, 0.05, and 0.10 levels, respectively
Source: Authors
Table 8b. Alternatives measurement for Institutional Quality: long-run analysis

***, **, and * Notes: Standard errors are shown in the brackets. refer to statistical significance at 0.01, 0.05, and 0.10 levels, respectively.
Source: Authors.
Examination of the conditional effect in the short run and in the long run indicates a significant coefficient only for GVCxREG (quality of regulation) and GVCxGOEF (governance effectiveness) at the 10% level, and they are positive. This means that the negative effect of GVC on energy poverty may mitigate bad regulation quality in the short run or in the long run when governance effectiveness is poor. We further find that the enhancement in corruption control would be a relevant channel through which GVC participation leads to a reduction in energy poverty, although it remains non-significant.
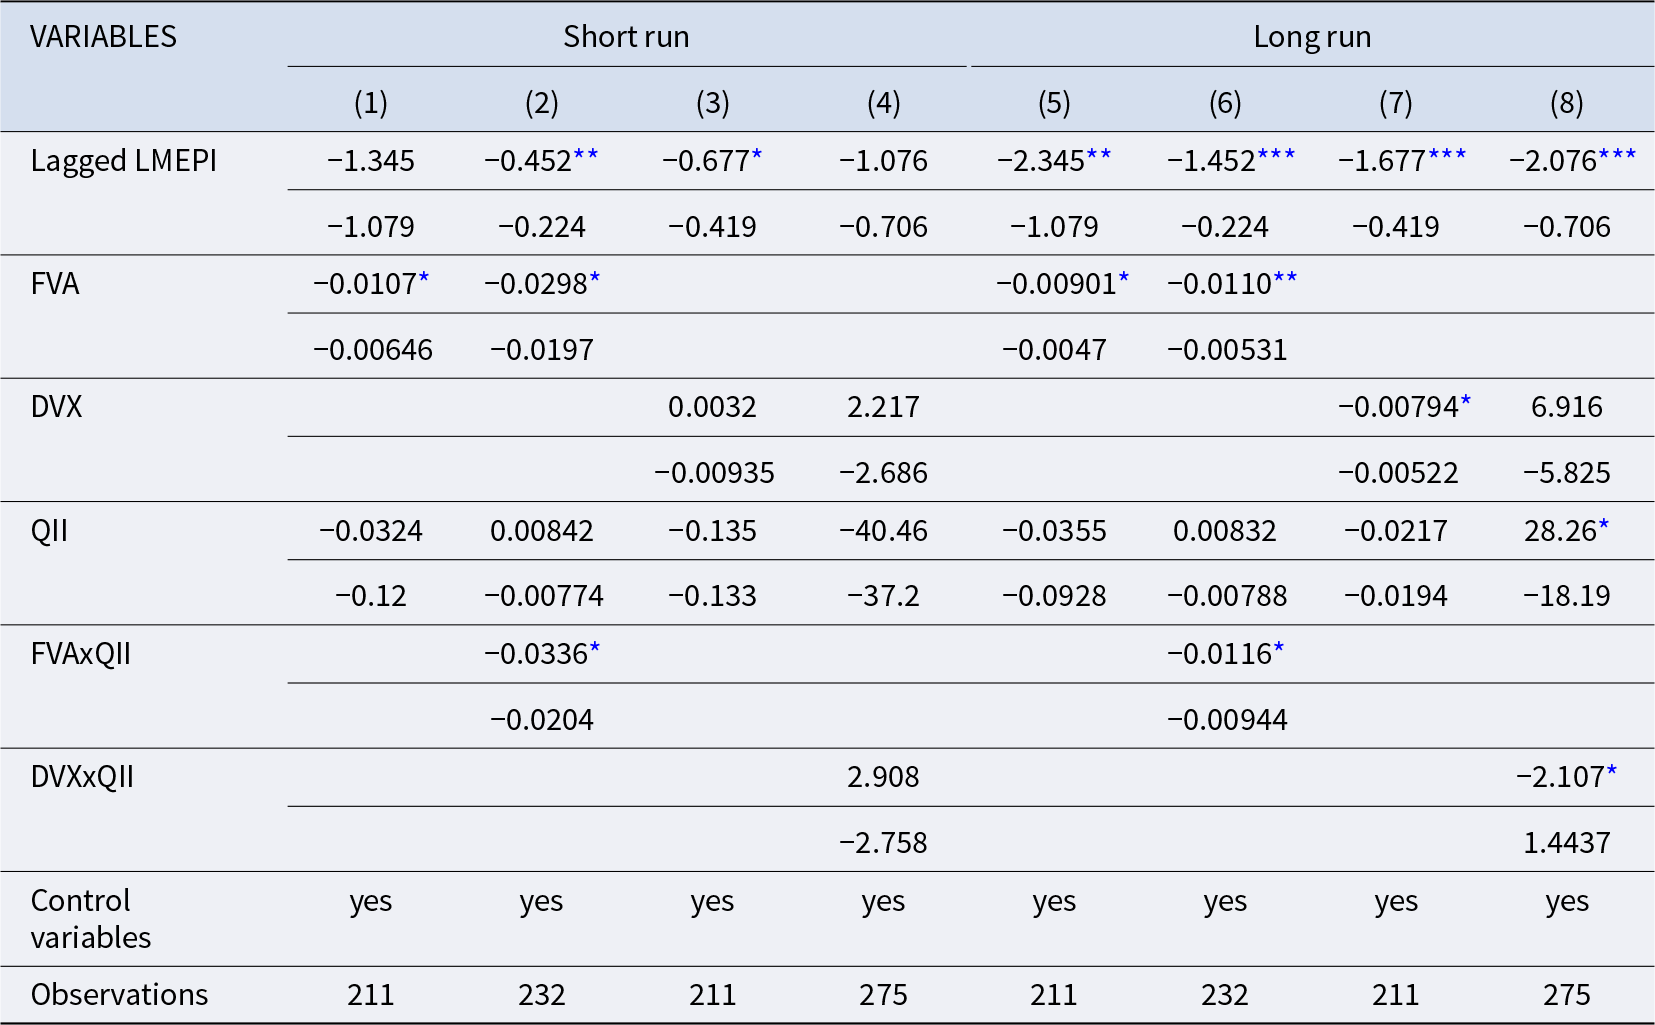
Further insights were gained by substituting GVC with Domestic/Forward GVC (DVX) and Foreign/Backward GVC (FVA) in accordance with Koopman et al. (Reference Koopman, Wang and Wei2014). This is motivated by the observation that these components are captured differently, which may likely have different impacts on the MEPI (Obeng et al., Reference Obeng, Mwinlaaru and Ofori2021; Luo, 2024). The conclusion can be provided based on the results in the short run (columns 1–4) and the long run (columns 5–8) in Table 9.
Table 9. Robustness check for GVC’s alternative measurement

***, ** and * Notes: Standard errors are shown in the brackets. refer to statistical significance at 0.01, 0.05, and 0.10 levels, respectively.
Source: Authors.
Columns (1) and (5), (2) and (6), and (3) and (7) show the total MEPI, rural-MEPI, and urban-MEPI, respectively, while Columns (4) and (8) measure the rural–urban MEPI in the short and long run, respectively.
Overall, there is a significant negative relationship between these two types of GVC and any MEPI sub-index, except for rural areas. Moving to the role of institutional quality, it can be seen that it interacts with FVA to reinforce the decrease in energy poverty, irrespective of the period, while this evidence is found only in the long run by interacting QI by DVX. This is in agreement with the results in Tables 4 and 5, and then meaning that the results are robust and trustworthy. Therefore, although GVCs are helpful in mitigating Africa’s energy poverty, the avenue is obviously through both better institutions and upstream participation rather than downstream.
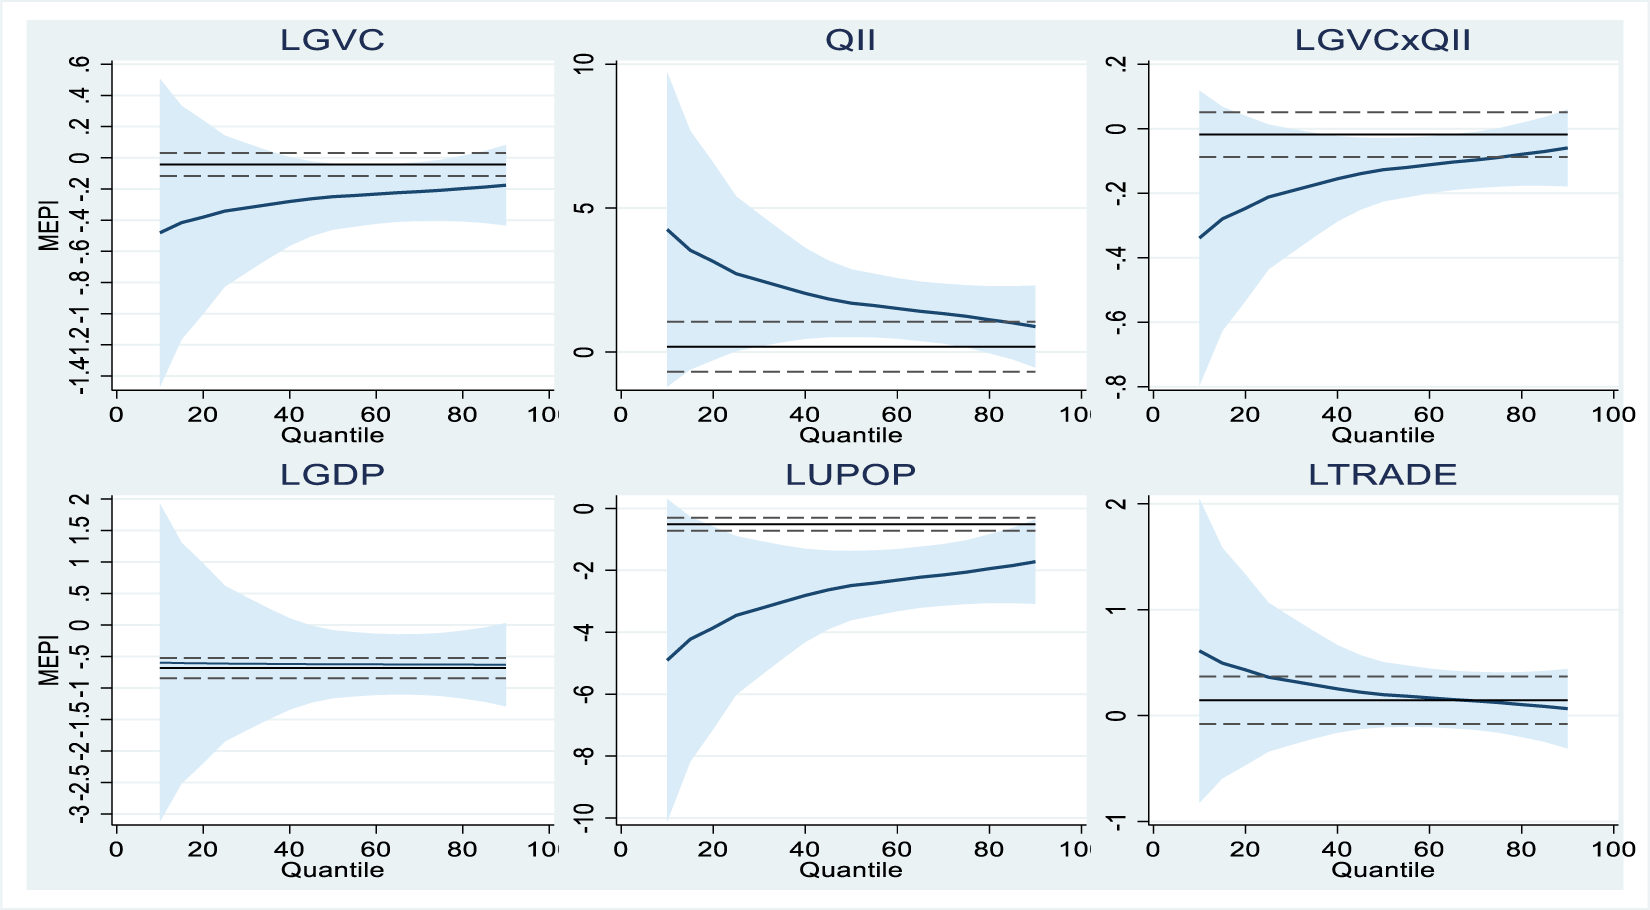
The dynamic common correlated estimator approach was used for the baseline approach; however, it does not consider the differences in energy poverty levels among the countries. Since Figures 1-2 depict heterogeneity in the MEPI in our panel, it is likely that this impact varies according to the magnitude of energy poverty in a country. As in Luo (2024), we apply the MMQR approach and consider three quartiles, including the 25th, 50th, and 75th levels.
As shown in Figure 4, results of the effect of GVC participation on multidimensional energy poverty are more illuminating than those of the baseline estimation. Indeed, four major features can be observed: first, GVC is negatively associated with MEPI across the quantiles of distribution; second, it supports the findings from the baseline analysis. Second, there is no evidence from the model without the interaction term; consequently, the QI seems to be critical in explaining the direct MEPI-GVC nexus. Third, including the interaction term leads to GVC participation directly influencing energy poverty, but also, the coefficients of crossed variables are significant and negative across the quantile of distribution. Regarding the conditional and unconditional effects, the absolute magnitudes of the coefficients both decrease across quantiles of distribution of MEPI. As the logical quantile of distribution arranges the data from lower to upper values of the dependent variable (Wolde-Rufael and Mulat-Weldemeskel, Reference Wolde-Rufael and Mulat-Weldemeskel2022), the third observation means on the one hand that, for lower MEPI countries such as Cameroon, Senegal, and Namibia, the role of GVC participation in reducing energy poverty is relatively obvious, compared to that in countries with higher MEPI, including Chad, South Sudan, and Malawi. On the other hand, as conditional and unconditional effects are both negative, this means that the quality of institutions enables strengthening energy poverty reduction through GVC participation.

Figure 4. Graph from quantile of distribution of the determinants of MEPI.
5. Discussion of Findings
This section further discusses the findings and implications of the previous studies. The benchmark model shows that GVC participation has a negative effect on overall multidimensional energy poverty in Africa as well as in the short and long run. But there is a larger magnitude in the short run than in the long run. This means that integration into the GVCs will lead to a significant reduction in energy poverty in African countries, allowing us to validate hypothesis 1 of the current study. The theoretical mechanism underpinning this is as follows: participation in global production chains leads domestic firms to grow up in international competition in the energy development field, resulting in an investigation of the energy sector. Furthermore, the competitive and strategic advantages developed by Porter (1985) confirmed that natural resource-rich countries, such as African countries, are expected to improve energy access through extraction and export for the first time, and, in the long run, importing technology or refined products should mitigate energy poverty. Ongo Nkoa (2023) found a significant association between natural resources and energy poverty in sub-Saharan Africa. A further mechanism has been presented by Tinta et al. (Reference Tinta, Sarpong, Ouedraogo, Hassan, Mensah-Bonsu and Onumah2018) explaining that through countries’ integration, the access to space for ‘learning to compete’ and for ‘self-discovery’ offers new opportunities to local industries for greater rigor and competition in GVCs. Then, a share of the profit from GVC participation could be invested in the energy field to reinforce their position on the GVCs, resulting in energy poverty reduction. These findings are supported by previous empirical studies (Agostino et al., Reference Agostino, Giunta, Ruberto and Scalera2023; Obeng et al., Reference Obeng, Mwinlaaru and Ofori2021). Indeed, it has been shown that participation in GVC can reduce energy poverty. On the one hand, domestic firms gain from producing/using new renewable energy sources (Agostino et al., Reference Agostino, Giunta, Ruberto and Scalera2023). On the other hand, Delera et al. (Reference Delera, Pietrobelli, Calza and Lavopa2022) asserted that domestic firms would be forced to employ smart and digital technology to achieve the best efficiency when using clean energy sources, which are required on an international scale. Similarly, Ji et al. (Reference Ji, Liu, Wu, Su, Ye and Feng2022) and Luo et al. (Reference Luo, Sun, Tao, Tan and Kamarudin2024) found that participation in GVCs promotes renewable energy access through the opportunity to access new resources and organize production. Finally, Obasanjo et al. (Reference Obasanjo, Olayiwola, Okodua, Adediran and Lawal2021) and Zhang et al. (Reference Zhang, Lin, Wang and Shahbaz2024) associated it with the capacity to participate in GVCs that offer an easy way to join the global market using domestic firms, which is favorable for engaging the resources needed to curb energy poverty. Antras (Reference Antras2020) further argues that integration into GVC participation is critical to the emergence of energy technology in developing countries. In addition, because GVCs promote inclusive growth (Obeng et al., Reference Obeng, Mwinlaaru and Ofori2021), the spillover effect may generate more access to basic infrastructure, such as clean energy sources, in the long and short run. Furthermore, our evidence supports the pollution hallo hypothesis since GVCs are likely to reduce energy poverty in that strong environmental regulations will lead foreign firms and companies to use new technologies in all GVC participation segments, resulting in the promotion of clean energy value chains (Zhu et al., 2019).
Looking at the rural and urban heterogeneity outcomes, irrespective of the time period, the direct effect of GVC participation is still negatively linked to both urban and rural energy poverty, but with lower magnitudes in rural areas. This means that energy poverty reduction in rural areas is less associated with GVCs than in urban areas. This is plausible because rural space economies tend to be categorized by marginal production with inadequate government funding and a lack of modern infrastructure. However, we cannot find robust evidence regarding the explanation of rural–urban energy poverty inequality through GVC involvement. We further found that among the control variables, GDP reduces the rural–urban energy poverty gap, FDI and trade openness do not affect it, while the urban population impact is significant but only in the long run. These findings were supported by those of Meka’a et al. (Reference Meka’a, Djamen and Noufelie2024).
Additionally, the findings reveal mixed influences of QI in the GVC-MEPI nexus: significant and negative for overall MEPI, significant and positive for urban areas, and negative and non-significant for rural areas in the long and short run. On the one hand, GVCs play a significant role in the overall reduction of multidimensional energy poverty in African economies through better QI. Therefore, enhancing the quality of institutions is critical in supporting overall clean energy development through the participation in GVCs in Africa. On the other hand, the mediating role of QI remains low in significantly reducing rural energy poverty. In contrast, QI leads to reinforcing urban energy poverty related to an increase in GVC participation, and this adverse result has been found as a consequence of rapid urbanization, which can mitigate institutional effectiveness and increase energy poverty (Ongo Nkoa et al., Reference Ongo Nkoa, Tadadjeu and Njangang2023). This evidence is consistent with that of Agostino et al. (Reference Agostino, Giunta, Ruberto and Scalera2023), who showed a significantly positive effect of GVC participation on energy development. When countries feature relatively better institutions, they should support domestic firms’ citizenship value chain segments, resulting in a reduction in their lack of access to energy in the long run.
Recently, Ghosh and Dutta (Reference Ghosh and Dutta2022) confirmed similar evidence and recommended that developing countries should implement a combination of environmental standards, strong regulatory conformity, and virtuous energy management policies to achieve zero-energy post-targeting. We further showed a positive association between QI and GVCs, as in Barbero and Rodriguez-Crespo (Reference Barbero and Rodriguez-Crespo2020). Africa’s GVC involvement presents great potential for the development of renewable energy, such as biomass, solar, wind, and hydropower, which represent attractive factors for investors in renewable energy development (Aliyu et al., 2018). This is relevant because the development of green energy sources can limit harmful emissions and provide sufficient energy for the population to preserve the environment. Second, the state of democracy in these countries is relatively low in capturing the net effect of GVC on energy access.
Similarly, the findings confirm that through QI, GVC participation leads to a reduction in the rural–urban gap in energy poverty. Checking for robustness, the MMQR approach supports this evidence and indicates an asymmetric effect of a larger magnitude for countries with a low MEPI. That is, a non-linear relationship occurs between GVC participation and MEPI and between GVC. The results are also robust regarding alternative measures of GVC participation, including FVA or Domestic value-added, and QI proxies. Therefore, engaging in forward participation within GVCs – access to the information required about technology from trading partners to trade intermediate goods – may be a great avenue for energy development. In other words, African countries’ exports are related more to natural resources than to agricultural and local products/services. According to Obeng et al. (Reference Obeng, Mwinlaaru and Ofori2021), this may be linked to the fact that Africa’s economy features relatively few downstream firms that could easily and steadily transform imports from foreign economies into semi-finished and finished goods. In contrast, the DVX impact prevails over a long period when the mediating channel of QI is included. That is, the above transformation process occurs if better institutions exist. Reforms and adequate institutions specific to the agricultural sector should be included in countries expected to promote both GVC participation and clean energy development.
Although most public funding is directed toward major electricity grid extension and support projects, the effects are not observed in the long run. Lack of government support could increase energy poverty related to GVCs in both urban and rural areas and increase the rural–urban gap in energy poverty. Therefore, in countries with better quality of institutions, especially less corruption and better quality of regulation and governance, increased participation in GVCs will have a significant influence in facilitating access to electricity, clean fuel, and technology for cooking. It has been observed that promoting good institutions is an avenue for enhancing the diffusion of information and new technology (Nunn and Trefler, Reference Nunn and Trefler2014). Thus, institutional improvement, which could induce a better investment climate, increase private and foreign investments, and increase energy use, is expected to reduce energy poverty (Akalin and Erdogan, 2020).
Therefore, policymakers are confronted with the challenge of properly regulating and strengthening GVCs linkages’ to promote technology transfer and a better institutional environment while simultaneously ensuring clean energy access in a country. In addition, many scholars advocate more potent trade, domestic industrial, and innovation policies to drive energy upgrades. GVCs scholars, including Pietrobelli et al. (2022), have attracted fine-gained microeconomic focus. The reduction in Africa’s MEPI through GVC and the quality of institutions will obviously pass through combining upstream rather than downstream positions on value chain participation and a better quality of regulation and governance efficiency.
6. Conclusion and Policy Implications
Accessibility to basic services, such as energy, remains obvious despite the significant progress recorded in recent decades. Several empirical contributions have been followed to provide governments with some policies regarding the energy factor; however, there is no consensus, particularly in Africa, where energy poverty is still a significant problem. In this vein, the current study assesses the impact of participation in the GVC and quality of institutions (QI) on multidimensional energy poverty (MEPI) in Africa. For this purpose, a panel sample of 51 African countries over the period ranging from 1995 to 2018, and the Dynamic Common Correlated Model (DCEE-PMG) estimation method were used. The measurement of total GVCs includes both forward GVC participation and backward GVC participation; QI is the index from policy V and MEPI, which includes the share of the population without access to electricity and without access to clean fuel and technology for cooking (CFT). Findings show that GVC participation negatively affects energy poverty not only in the short run but also in the long run, meaning that GVCs reduce multidimensional energy poverty in Africa.
The effect of QI on the MEPI did not appear to be significant. However, regarding the role of QI in the GVCs-MEPI nexus, the results suggest that the reduction in energy poverty related to participation in GVCs would be reinforced through the institutional quality of African countries. That is, the better the quality of institutions, the larger the total effect of GVC participation on the reduction in energy poverty. Furthermore, QI is significant in GVC rural energy poverty, while it turns positive in urban areas. Additionally, the findings confirm that through QI, GVC participation leads to a reduction in the rural–urban gap in energy poverty. Checking for robustness, the MMQR approach supports this evidence and indicates an asymmetric effect with a larger magnitude for countries with a low MEPI. The results are further robust regarding alternative measures for GVC participation, including the FVA, DVX, and QI proxies. In light of our findings, evidence suggests an urgent need to reinforce the application and promotion of better institutions, essentially in clean energy sectors, to support the curb of energy poverty in both the short and long run. Recognizing the crucial contribution in defining the GVC participation terms and conditions led by firms and governments, the promotion of the best institution is likely to attract partnerships in the energy field and upgrade the local supply chain. Urban heterogeneity should be considered in government policies. Government policies related to stimulating GVC participation should be combined with institutional quality to increase investment in both electricity and clean fuel and technology for cooking and the sustainable transition toward clean and reliable energy.
Furthermore, we found that FVA led to reduced MEPI irrespective of the time period, whereas it occurred only in the long run under DVX. Quality of regulation and government efficiency are likely to channel GVC participation to decrease energy poverty. This is because African countries’ GVC participating firms are largely downstream and agriculture-based, particularly in rural areas, and thus take place in domestic value additions, resulting in exports to upstream industries in developed countries. Moving on from the above, policymakers should harmonize GVC participation and QI in order to reduce energy poverty. Indeed, our analysis validates the effectiveness of participation in GVC in the reduction of energy poverty in African countries. Government policies related to stimulating GVC participation should be included as a political ingredient for the strengthening of both imports of intermediate goods, their conversion into semi-finished and finished goods, and these last will finally be exported to foreign countries. Policies aimed at encouraging participation in the GVCs require particular institutional reforms according to the area in order to significantly reduce the rural–urban gap in energy poverty.
Data accessibility
The data will be made available on reasonable request from the corresponding author.
Acknowledgement
The authors thank Editor-in-chief and anonymous reviewers for their comments that helped to improve the final draft’s quality. Additionally, a sincere thanks to Mr. David Baumann for his availability and valuable support in managing the dataset replication.
Competing Interests
Authors are required to disclose financial or non-financial interests that are directly or indirectly related to the work submitted for publication.
Appendix
List of Countries


 Open access