The metabolic syndrome (MetS), which refers to a cluster of risk factors including central obesity, low serum HDL-cholesterol and increased serum TAG, blood pressure and blood glucose(Reference Alberti, Eckel and Grundy1), doubles the risk of cardiovascular outcomes and increases the risk for all-cause mortality(Reference Mottillo, Filion and Genest2). The MetS occurs in 85 % of patients with type 2 diabetes(Reference Ley, Harris and Mamakeesick3), and the greater the number of MetS components, the greater the frequency of coronary artery disease and microvascular chronic complications(Reference Costa, Canani and Lisboa4).
Dietary intervention plays an important role in the management of MetS components(Reference Papathanasopoulos and Camilleri5). Diets with high fibre content improve most MetS components in non-diabetic individuals(Reference Esposito, Marfella and Ciotola6, Reference Azadbakht, Mirmiran and Esmaillzadeh7). However, there is scarce information about the effects of fibre consumption in patients with diabetes and the MetS. In patients with type 2 diabetes, we have recently demonstrated that a low total fibre content, associated with consumption of high dietary glycaemic index foods, was positively associated with the presence of the MetS(Reference Silva, Steemburgo and de Mello8). Additionally, the intake of soluble fibres, especially from whole-grain foods and fruits, was negatively associated with the presence of the MetS in patients with type 2 diabetes(Reference Steemburgo, Dall'Alba and Almeida9).
The beneficial effects of fibre on glucose and lipid abnormalities have mostly been attributed to soluble rather than insoluble fibre(Reference Papathanasopoulos and Camilleri5). Partially hydrolysed guar gum (PHGG) is a natural water-soluble dietary fibre obtained by the controlled partial enzymatic hydrolysis of guar gum (GG) that is tasteless and can be easily added to the diet(Reference Yoon, Chu and Raj Juneja10, Reference Slavin and Greenberg11). Some studies have suggested that the intake of GG reduces plasma glucose levels(Reference Calvo-Rubio Burgos, Montero Pérez and Campos Sánchez12–Reference Lalor, Bhatnagar and Winocour15) as well as improves the lipid profile(Reference Calvo-Rubio Burgos, Montero Pérez and Campos Sánchez12, Reference Aro, Uusitupa and Voutilainen14–Reference Stahl and Berger18) in patients with type 2 diabetes. However, other studies have not confirmed these beneficial effects of GG both in glucose(Reference Niemi, Keinänen-Kiukaanniemi and Salmela16–Reference Stahl and Berger18) and lipid levels(Reference Chuang, Jou and Yang13). The possible effects of GG on MetS components in patients with type 2 diabetes and the MetS are still unknown. Therefore, the aim of the present study was to evaluate the effects of PHGG on the MetS in patients with type 2 diabetes.
Subjects and methods
The present randomised, open-label, parallel, controlled clinical trial study was conducted in patients with type 2 diabetes and the MetS. The primary outcomes were MetS components (central obesity, serum HDL-cholesterol and TAG, blood pressure values and blood glucose)(Reference Alberti, Zimmet and Shaw19). The values of glycated Hb (HbA1c), 24 h urinary albumin excretion (UAE), serum fatty acids (FA), high-sensitivity C-reactive protein and plasma endothelin-1 were secondary outcomes. The present study was conducted according to the guidelines laid down in the Declaration of Helsinki, and all procedures involving human patients were approved by the Research Ethics Committee of the Hospital de Clínicas de Porto Alegre, Rio Grande do Sul, Brazil. Written informed consent was obtained from all patients. The present trial was registered at clinicaltrials.gov as NCT 01071785.
Patients and study protocol
Patients with type 2 diabetes, who consecutively attended the Endocrine Division's outpatient clinic at Hospital de Clínicas de Porto Alegre, Brazil, were selected based on the following criteria: presence of the MetS; HbA1c < 9 %; serum creatinine < 176 μmol/l; UAE < 200 mg/24 h; absence of malabsorption, urinary tract infection or other renal diseases.
Type 2 diabetic patients were defined based on diabetes onset at age ≥ 30 years, the absence of previous episodes of ketoacidosis or documented ketonuria and the start of treatment with insulin not before 5 years following diagnosis. Diagnosis of the MetS was based on the International Diabetes Federation criteria: central obesity (waist circumference (WC) ≥ 94 cm for men and ≥ 80 cm for women) and one of the following, considering that all patients had diabetes: TAG ≥ 1·695 mmol/l; HDL-cholesterol < 1·036 mmol/l for men and < 1·295 mmol/l for women; blood pressure ≥ 130/85 mmHg (or use of anti-hypertensive drugs); raised blood glucose or diabetes(Reference Alberti, Zimmet and Shaw19).
A total of sixty-three eligible patients with type 2 diabetes, all of them with the MetS, entered a run-in period of 2 weeks (19·5 (sd 8)). Changes in medication were prescribed, if necessary, in order to stabilise blood pressure and blood glucose (anti-diabetic agents were standardised to metformin and/or neutral protamine Hagedorn insulin). Hypolipidaemic agents were temporarily discontinued 6 weeks before the beginning of the study. Patients were instructed to maintain their usual physical activity and diet. Soyabean oil and white bread were supplied for all patients in order to avoid differences in carbohydrate and fat contents between the intervention and control groups. White bread and soyabean oil were chosen because these foods are the most frequently consumed by our type 2 diabetic patients according to our dietary record database(Reference Silva, Steemburgo and de Mello8).
Patients were randomly assigned to the intervention group (PHGG, 5 g twice per d) or the control group. A sequential list established before the beginning of the protocol was used for randomisation. Clinical, laboratory and nutritional evaluations were performed at baseline, 4 and 6 weeks.
Intervention group: partially hydrolysed guar gum
PHGG soluble fibre is produced from GG by an enzymatic process and has the same chemical structure as native GG, with one-tenth of the length(Reference Yoon, Chu and Raj Juneja10). The intervention group (GG group) received a daily dietary supplementation of 10 g PHGG (Benefiber®; Novartis Brasil), taking one 5 g sachet at lunch and another at dinner. PHGG sachets were supplied and compliance was assessed at every visit by counting the number of return sachets. Non-compliance was defined as missing more than 10 % of the total supplied PHGG sachets. Also, patients from the GG and control groups were asked to describe any unusual symptoms or signs in order to evaluate the possible side effects related to PHGG.
Clinical evaluation
Blood pressure was measured twice, after a 10 min rest, using a standard digital sphygmomanometer (Omron HEM-705CP; Omron Healthcare, Inc.). Hypertension was defined as blood pressure ≥ 140/90 mmHg, measured on two occasions, or the use of antihypertensive drugs(Reference Chobanian, Bakris and Black20). Patients were classified as normoalbuminuric (UAE < 30 mg/24 h) or microalbuminuric (UAE 30–299 mg/24 h). Microalbuminuria was always confirmed by a second urinary measurement(Reference Gross, Azevedo and Silveiro21). Fundus examination was performed and diabetic retinopathy was graded as present or absent.
Physical activity was graded in levels according to activities during a typical day based on a standardised questionnaire(Reference Tuomilehto, Lindström and Eriksson22) adapted to local habits. Overall, four levels, from a sedentary lifestyle to high physical activity, were defined. Positive alcohol intake was considered in patients who mentioned the current intake of any amount of alcoholic beverage. Ethnicity was self-identified as white or non-white.
Nutritional assessment
The body weight and height of patients were obtained with measurements recorded to the nearest 100 g for weight and to the nearest 0·1 cm for height. BMI was calculated. WC was measured once to the nearest 1 cm midway between the lowest rib margin and the iliac crest, near the umbilicus, with a flexible, non-stretch fibreglass tape.
The patients' diet was assessed by 3 d weighed dietary records (two non-consecutive weekdays and one weekend day)(Reference Moulin, Tiskievicz and Zelmanovitz23). Patients were issued commercial scales and measuring cups. Records were analysed using Nutribase 2007 software (Clinical Nutrition Manager v.7.14; Cybersoft)(24). The total fibre content was estimated according to the CRC Handbook of Dietary Fiber in Human Nutrition (25). Data on trans-FA were analysed as described previously(Reference Steemburgo, Dall'Alba and Almeida9, Reference Almeida, Zelmanovitz and Vaz26). Data intake from nutrients was expressed in crude amounts adjusted to total energy, unless otherwise stated. Compliance was confirmed by the measurement of a 24 h urinary N output and by the completeness of urine collection as evaluated by 24 h urinary creatinine.
Laboratory measurements
Blood samples were obtained after a 12 h fast. HbA1c was measured by an ion-exchange HPLC (Merck-Hitachi L-9100 glycated haemoglobin analyser, reference range 4·7–6·0 %; Merck Diagnostica). UAE was measured by immunoturbidimetry (Microalb). Glomerular filtration rate was estimated using the Chronic Kidney Disease Epidemiology Collaboration equation(Reference Levey, Stevens and Schmid27).
For serum FA analyses, blood samples were separated after centrifugation at 1500 g for 15 min and stored at − 80°C for later laboratory measurements. FA were determined in TAG fractions by GC (Hewlett-Packard 6890; Agilent Technologies), as described previously(Reference Perassolo, Almeida and Pra28). Methyl heneicosanoate (21 : 0) was used as an internal standard and the identity of each FA peak was ascertained by comparing the peak retention time with a previously characterised mixture of thirty-seven FA (Sigma-Aldrich). In our laboratory, the CV of each individual FA in this mixture ranged from 0·03 to 3·5 %.
Statistical analyses
Sample size was calculated based on a putative decrease in at least two MetS components except diabetes. It was estimated that twenty-one participants would be required in each group to achieve a power of 80 % and α of 0·05, taking into account a loss of 20 %.
Student's t test, the Mann–Whitney U test and the χ2 test were used as appropriate. Changes in outcomes were analysed by the general linear model for repeated measures, with measurements at different times considered as a within-subject factor, followed by a post hoc test (least significant difference) and adjusted for possible confounding factors (covariates). For each outcome analysis, covariates were chosen if they had a known biological influence on the evaluated outcome or had significantly changed during the study. Normally distributed dietary data were adjusted for energy intake through the residual method(Reference Willett and Stampfer29). Non-normally distributed variables were log-transformed before analyses. Results are expressed as means (standard deviations), medians (interquartile ranges) or number of patients with the characteristic (percentages). P< 0·05 was considered as statistically significant. SPSS 16.0 software (SPSS) was used for statistical analyses.
Results
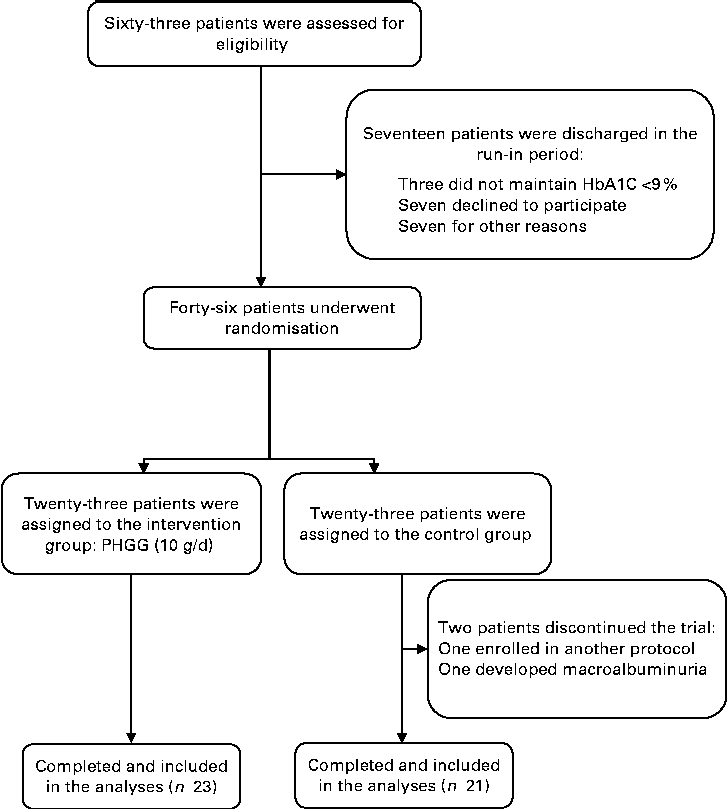
Of the sixty-three eligible patients, seventeen were discharged during the run-in period: three were unable to maintain HbA1c < 9 %; seven were unwilling to attend the protocol visits and declined to participate; another seven due to other reasons (three patients had poor compliance with the food-weighing technique, two underwent coronary angiographies, one developed macroalbuminuria and the last one developed recurrent urinary tract infection). Therefore, forty-six patients were randomised. After randomisation, two patients from the control group were discharged: one was inadvertently enrolled in another research protocol and the other developed persistent macroalbuminuria. Therefore, forty-four patients completed the protocol and only their data were included in the analyses. Fig. 1 shows the flow diagram of patient recruitment and randomisation.

Fig. 1 Flow diagram of recruitment and randomisation of patients with type 2 diabetes and the metabolic syndrome. HbA1c, glycated Hb; PHGG, partially hydrolysed guar gum.
Baseline patient characteristics
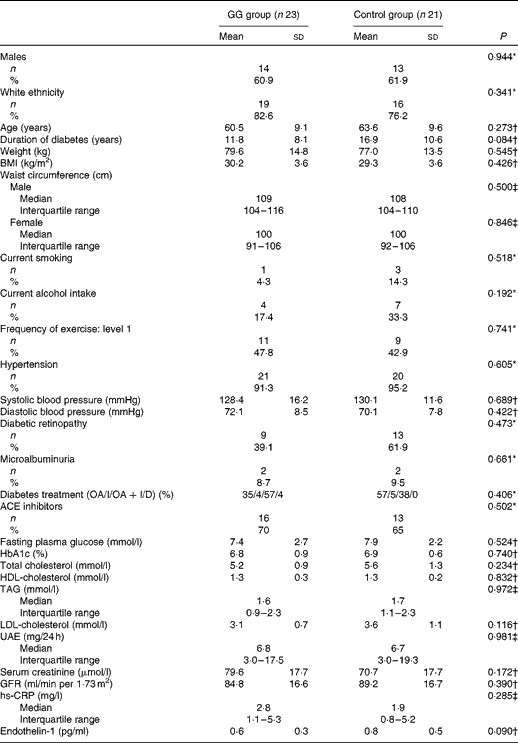
Baseline clinical and laboratory characteristics of patients with type 2 diabetes and the MetS are shown in Table 1. There were no differences between the GG and control groups regarding demographic features, anthropometric measurements, lifestyle characteristics, blood pressure values, frequency of chronic diabetic complications, laboratory test results and the proportion of the use of medications.
Table 1 Baseline clinical and laboratory characteristics of patients with type 2 diabetes and the metabolic syndrome (Mean values and standard deviations; medians and interquartile ranges; number of patients and percentages with the analysed features)

GG, guar gum; OA, oral anti-diabetic agents; I, insulin; D, diet only; ACE, angiotensin-converting enzyme; HbA1c, glycated Hb; UAE, urinary albumin excretion; GFR, glomerular filtration rate; hs-CRP, high-sensitivity C-reactive protein.
* Pearson χ2.
† Student's t test.
‡ Mann–Whitney U test.
Dietary evaluation at baseline and during the study
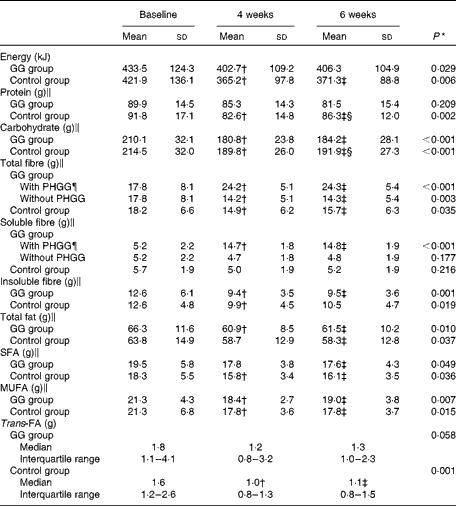
Table 2 describes the dietary data. At baseline, no differences were observed in total daily energy and the intakes of protein, carbohydrates, fibres, total fat, MUFA, PUFA, SFA, trans-FA and cholesterol between the GG and control groups (P>0·05 for all).
Table 2 Daily diet of patients with type 2 diabetes and the metabolic syndrome (Mean values and standard deviations; medians and interquartile ranges with the analysed features)

GG, guar gum; PHGG, partially hydrolysed guar gum; FA, fatty acid.
* P value refers to the general linear model for repeated measurements.
† Mean values were significantly different from those of baseline (P< 0·05; least significant difference (LSD) post hoc test).
‡ Mean values were significantly different from those of baseline (P< 0·05; LSD post hoc test).
§ Mean values were significantly different from those of 4 weeks (P< 0·05; LSD post hoc test).
∥ Nutrient values adjusted for total energy daily intake.
¶ Baseline values before receiving PHGG.
During the study, energy, carbohydrates, total fat, MUFA, PUFA, SFA and cholesterol intakes were reduced in the GG and control groups (P>0·05 for all). Protein intake and trans-FA were reduced in the control group only.
Information about the total and soluble fibre intakes during the study was expressed as fibre intake with PHGG (including fibre from foods and PHGG) and fibre intake without PHGG (fibre from foods only). In the GG group, there was, as expected, an increase in total and soluble fibre intake when PHGG was taken into account. On the other hand, considering just fibre from foods, total fibre intake was reduced during the study in the control and GG groups. Insoluble fibre intake diminished in the two groups.
Metabolic syndrome and other cardiovascular risk factors during the study
WC was reduced from baseline to the 4th and 6th weeks only in the GG group, adjusted for changes in weight. No changes were observed in TAG, HDL-cholesterol, blood pressure values, fasting plasma glucose and frequency of the MetS during the study in both groups (Table 3).
Table 3 Metabolic syndrome components in patients with type 2 diabetes and the metabolic syndrome (Mean values and standard deviations; medians and interquartile ranges with the analysed feature)
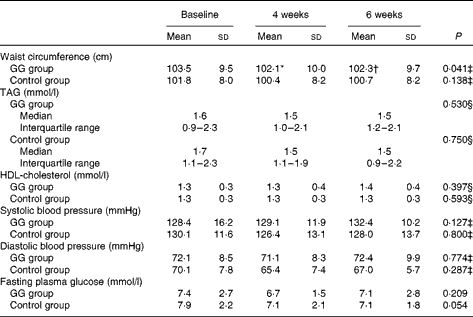
GG, guar gum.
* Mean value was significantly different from that of baseline (P< 0·05; least significant difference (LSD) post hoc test).
† Mean value was significantly different from that of 4 weeks (P< 0·05; LSD post hoc test).
‡ P value refers to the general linear model (GLM) for repeated measurements adjusted for changes in weight.
§ P value refers to the GLM for repeated measurements adjusted for changes in total fat intake.
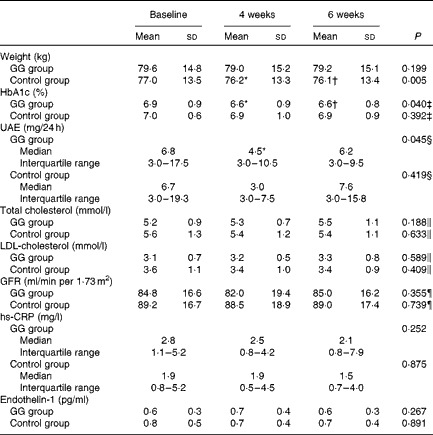
Changes in other factors associated with cardiovascular risk in patients with diabetes are described in Table 4. The HbA1c values were reduced in the GG group, adjusted for changes in weight and baseline HbA1c values. Also, UAE was reduced in the GG group, taking into account concomitant changes in weight, blood pressure, protein intake and HbA1c. Body weight diminished only in the control group. No changes were observed in total and LDL-cholesterol, serum creatinine, glomerular filtration rate, high-sensitivity C-reactive protein and plasma endothelin-1 in both groups.
Table 4 Selected cardiovascular risk factors evaluated in patients with type 2 diabetes and the metabolic syndrome (Mean values and standard deviations; medians and interquartile ranges with the analysed feature)

GG, guar gum; HbA1c, glycated Hb; UAE, urinary albumin excretion; GFR, glomerular filtration rate; hs-CRP, high-sensitivity C-reactive protein.
* Mean values were significantly different from those of baseline (P< 0·05; least significant difference (LSD) post hoc test).
† Mean values were significantly different from those of 4 weeks (P< 0·05; LSD post hoc test).
‡ P value refers to the general linear model (GLM) for repeated measurements adjusted for weight changes and HbA1c at baseline.
§ P value refers to the GLM for repeated measurements adjusted for changes in weight, systolic and diastolic blood pressure, protein intake and HbA1c
∥ P value refers to the GLM for repeated measurements adjusted for total fat intake changes.
¶ P value refers to the GLM for repeated measurements adjusted for changes in systolic and diastolic blood pressure, protein intake and HbA1c.
Regarding FA evaluation, no changes occurred in total serum, SFA, MUFA and PUFA (P>0·05 for all; data not shown) in the GG and control groups. However, a reduction in serum trans-FA was observed in the GG group: baseline 71 (interquartile range 46–137) mg/l; 4th week 67 (interquartile range 48–98) mg/l; 6th week 57 (interquartile range 30–110) mg/l (P= 0·011; least significant difference post hoc test: P= 0·07). This analysis was adjusted to changes in weight and intakes of total fat, trans-FA and energy.
Concerning PHGG compliance, only two patients missed PHGG sachets during the study (four sachets each one). PHGG was well tolerated without any serious adverse effect. Of the patients, four reported decreased appetite, fourteen had an increased number of bowel movements and three had diarrhoea in the first 2 d of use. The control group did not report any gastrointestinal symptom.
Discussion
The present randomised clinical trial demonstrated that in patients with type 2 diabetes and the MetS, a 6-week dietary supplementation with PHGG, a soluble fibre, had beneficial effects on the MetS profile and other factors associated with cardiovascular risk. The intake of PHGG reduced WC, HbA1c, albuminuria and serum trans-FA. These results were observed as early as 4 weeks after the start of this type of fibre supplementation, most lasting until the end of the study. In addition, the present study suggests a possible novel benefit of this soluble fibre in reducing trans-FA and albuminuria.
Fibre consumption seems to be protective against the presence of the MetS in non-diabetic subjects. Randomised clinical trials have demonstrated that diets with a high fibre content, such as the Mediterranean-style(Reference Esposito, Marfella and Ciotola6) or Dietary Approaches to Stop Hypertension diets(Reference Azadbakht, Mirmiran and Esmaillzadeh7) can reduce MetS prevalence. However, an independent fibre effect cannot be established based on these trials, since fibre content was not their primary focus.
Abnormal WC appears to be a constant feature in patients with the MetS(Reference Alberti, Zimmet and Shaw19). A longitudinal survey has indicated that central obesity may precede the onset of other MetS components(Reference Cameron, Boyko and Sicree30). Furthermore, central obesity is a risk factor for stroke, CHD and total mortality, independent of and additive to total obesity(Reference Klein, Allison and Heymsfield31). In a cohort of US men, a daily intake of 12 g of total fibre was associated with a 0·63 cm decrease in WC(Reference Koh-Banerjee, Chu and Spiegelman32). In the present study, there was a 1·2 cm reduction in WC resulting from the intake of 10 g of supplementary PHGG, regardless of weight changes. This effect may be linked to the reduction of postprandial plasma insulin responses by fibre intake(Reference Pereira and Ludwig33) and, consequently, appetite and energy intake(Reference Roberts34). The increase in satiety from soluble fibres may result from other factors besides the insulin response: intrinsic physical properties of the fibre; modulation of gastric motor function; possible influence on gut peptide hormones involved in signalling satiation, such as GLP-1(Reference Papathanasopoulos and Camilleri5, Reference Heini, Lara-Castro and Schneider35). Fibre intake may also affect the distribution of body fat, since the expression of the effects of insulin may be more marked in abdominal visceral than in subcutaneous adipocytes(Reference Bjorntorp36).
A glucose-lowering effect of high fibre intake in patients with diabetes has been described(Reference Anderson, Randles and Kendall37, Reference Post, Mainous and King38). Our patients who received PHGG supplementation had a 0·3 % reduction in HbA1c values. This reduction is relevant, since it occurred in patients using metformin and/or insulin, whose HbA1c values were already within the recommended glucose control target ( < 7·0 %)(39). This effect would probably be even more pronounced in patients with a poor glycaemic control. Furthermore, this HbA1c reduction was achieved without weight gain or other major adverse effects that are often associated with many anti-diabetic medications(Reference Gross, Kramer and Leitão40). The reduction in HbA1c (0·3 %) is comparable with that accepted as significant in clinical trials when a novel drug is added to conventional anti-hyperglycaemic agents(41).
Although PHGG has a lower viscosity and molecular weight than the intact GG, it has a similar biological action(Reference Yoon, Chu and Raj Juneja42). It is known that soluble fibre, including PHGG, increases the viscosity of gut contents, reducing glucose diffusion through the unstirred water layer and the accessibility of α-amylase to its substrates, and decreases pancreatic enzyme activities(Reference Papathanasopoulos and Camilleri5, Reference Yoon, Chu and Raj Juneja42). These effects can blunt the postprandial increase in glucose and insulin, resulting in HbA1c decrease. This possibility is underscored by the demonstration that the relative contribution of postprandial glucose to HbA1c values is almost 70 % when HbA1c is close to 7 %(Reference Monnier, Lapinski and Colette43). A recent study has also confirmed that this contribution of postprandial glucose is increased with low HbA1c values(Reference Riddle, Umpierrez and DiGenio44).
The observed reduction in UAE resulting from the PHGG fibre supplement, although transitory, is important, especially considering the low UAE values in this sample. Interestingly, albuminuria was once considered by the WHO as a MetS component(Reference Alberti and Zimmet45). Indeed, high normal levels of albuminuria are predictive of macroalbuminuria and increased mortality in patients with type 2 diabetes(Reference Murussi, Campagnolo and Beck46). Supplementary soluble fibres have retarded the development of diabetic nephropathy in genetically diabetic mice(Reference Lee47), while GG has reduced UAE in streptozotocin-induced diabetic rats(Reference Murussi, Campagnolo and Beck46). In human subjects, the adoption of a high-fibre-content diet, rich in fruits and vegetables, has been reported to reduce UAE in pre-hypertensive non-diabetic subjects(Reference Gallaher, Olson and Larntz48). In fact, the effects of fibre intake on renal function are an almost unexplored issue. Given that UAE may reflect generalised vascular damage(Reference Deckert, Feldt-Rasmussen and Borch-Johnsen49), anti-inflammatory properties of fibres(Reference Jacobs, Gross and Steffen50) could partially explain its reduction. However, in the present study, there were no changes in the evaluated inflammatory markers.
The present data show that supplementation with PHGG was able to promote a reduction in serum trans-FA, even though the significance of this finding was borderline following the post hoc analysis. Nevertheless, we believe that this observation is in accordance with previous findings from the dietary reduction of trans-FA. Studies have shown that the reduction of trans-FA intake can be associated with reduced WC(Reference Koh-Banerjee, Chu and Spiegelman32), cardiovascular risk(Reference Mozaffarian, Katan and Ascherio51) and improved insulin sensitivity(Reference Hu, van Dam and Liu52). The effects of serum trans-FA reduction by PHGG seem to be related to a common effect of soluble fibre: after ingestion, soluble fibres form gels that can reduce the intestinal absorption of nutrients. This effect occurs independent of the intake of this type of fat as observed in the present study. Since sources of serum trans-FA are only from the diet, their reduction by fibre intake may be more evident than that observed for other serum FA.
There was no reduction in total and LDL-cholesterol in the present study. This lack of fibre effect can be explained by baseline values very close to the normal reference range in all the studied patients. It should be noted, however, that the present results converge with a small borderline HDL-cholesterol-lowering effect of dietary fibre with no changes in TAG(Reference Brown, Rosner and Willett53), as described previously.
Possible limitations of the present study are related to unintentional changes in dietary components other than fibre. Probably these changes were not related to the information obtained from dietary diaries, given that the adopted 3 d weighed dietary record method was standardised previously(Reference Moulin, Tiskievicz and Zelmanovitz23) and includes dietary information from 2 d of the week and one weekend day. The observed reduction in dietary intake could be partially explained by more frequent visits and surveillance, since patients were frequently monitored by the dietitian and the physician. Accordingly, dietary modifications occurred both in the GG and control groups and did not differ between them. These unintentional changes were included as covariates in the multivariate analysis to control this potential interference. Furthermore, the unintentional weight loss observed only in the control group, possibly explained by a sustained reduction in energy intake up to the 6th week, could represent another limitation. Then, we also included weight changes as a covariate in the analyses of HbA1c, WC and blood pressure changes, and the results did not change. Another restriction that could preclude the generalisation of the present data is associated with the good glycaemic, lipid and blood pressure control already present at baseline in our patients. Nevertheless, the effect of soluble fibre supplementation might be assumed to be even more beneficial in diabetic patients with a poor glucose control. The lack of a placebo group in the present study could also represent a limitation. However, it is difficult to find a proper placebo that matches the physical characteristics of PHGG (tasteless white powder). For example, using an insoluble fibre as the placebo probably would not represent an actual placebo since insoluble fibres could also have some metabolic effects(Reference Papathanasopoulos and Camilleri5). Moreover, we have to consider that patients receiving PHGG may have gastrointestinal symptoms that easily would identify the active treatment. In fact, we observed that seventeen from twenty-three patients in the GG group reported gastrointestinal complains.
The results of the present study suggest that patients with diabetes should have a dose of 10 g PHGG added to their usual diet to improve their MetS profile. From a practical, clinical perspective, patients can be encouraged to include a fibre-rich food, especially soluble fibre, in their diet. For example, the intake of 10 g of soluble fibre would mean a daily consumption of two tablespoons of oats (30 g), two slices of rye bread (50 g), a ladle of black beans (140 g), a slice of papaya (150 g) and an orange (180 g). However, additional investigation will be necessary to confirm whether soluble fibres from foods have similar metabolic effects when compared with PHGG. This beneficial effect should be confirmed in randomised clinical trials using natural food sources of soluble fibres.
Conclusions
In conclusion, in patients with type 2 diabetes and the MetS, the addition of PHGG to the usual diet improved the MetS profile and factors associated with cardiovascular risk by reducing WC, HbA1c, UAE and trans-FA. This soluble fibre consumption might be included in the dietary management of type 2 diabetic patients.
Acknowledgements
The present study was supported by grants from Projeto de Núcleos de Excelência do Ministério de Ciência e Tecnologia, Ministério de Ciência e Tecnologia, Conselho Nacional de Desenvolvimento Científico e Tecnológico and FIPE – Hospital de Clínicas de Porto Alegre. V. D. was the recipient of scholarships from CNPq and F. M. S. from Coordenação de Aperfeiçoamento de Pessoal de Nível Superior. T. S. received a grant from Projeto Nacional de Pós-Doutorado (PNPD 03021/09-2). Bread was provided by Nutrella, soyabean oil by Bunge and Benefiber® by Novartis Brasil. We thank Dr Magda Perassolo for helping with the endothelin-1 measurements. The authors' contributions were as follows: V. D., M. J. A. and J. L. G. designed the research; V. D., M. J. A., F. M. S., C. P. R. and J. P. A. conducted the research; V. D. and M. J. A. performed the statistical analyses and wrote the paper; V. D., M. J. A. and J. L. G. had primary responsibility for the final content; V. D., F. M. S., J. P. A., T. S. and J. C. A. performed the FA measurements. None of the authors had a personal or financial conflict of interest.

