


1. Introduction
An efficient organization of groups requires that group members are able to coordinate their actions successfully in order to achieve potentially large efficiency gains from interaction. Examples abound across many different fields (Camerer, Reference Camerer2003; Cooper & Weber, Reference Cooper, Weber, Capra, Croson, Rigdon and Rosenblat2020; Devetag & Ortmann, Reference Devetag and Ortmann2007; Ochs, Reference Ochs, Kagel and Roth1995). Think of hunting together or defending one’s territory against potential invaders or companies coordinating on a new technological standard when competing platforms are available. In such situations, typically multiple equilibria exist, such as several platforms that can serve as technical standards or all group members hunting a large prey, like a stag, rather than each hunting individually a small animal like a rabbit.
The ability to coordinate actions has important welfare implications. In many cases, the multiple Nash equilibria in coordination games can be ranked according to their overall efficiency (Brandts et al., Reference Brandts, Cooper, Fatas and Qi2016; Cason et al., Reference Cason, Savikhin and Sheremeta2012a, Reference Cason, Sheremeta and Zhang2012b; Cooper et al., Reference Cooper, De Jong, Forsythe and Ross1990; Duffy & Feltovich, Reference Duffy and Feltovich2006; Van Huyck et al., Reference Van Huyck, Battalio and Beil1990). Coordination failure creates inefficiencies, which can take on two forms: Either players do not coordinate on the same action, but rather pick different actions and therefore miscoordinate, or they coordinate on an equilibrium that is not the most efficient one (Brandts & Cooper, Reference Brandts and Cooper2006; Weber, Reference Weber2006).
Given the importance of the ability to coordinate actions when subjects have to interact with each other and multiple equilibria exist, it is interesting to note that there is hardly any knowledge about when humans learn to coordinate efficiently and how the choice of efficient strategies develops in adolescence (Cooper & Weber, Reference Cooper, Weber, Capra, Croson, Rigdon and Rosenblat2020). Except for very few papers discussed below, it remains an open question whether children and teenagers are able to play efficient strategies and whether this ability develops with age and depends in predictable ways on economic incentives and the number of interaction partners in the group.
In this paper, we study how 727 children and teenagers, aged 9 to 18 years, played a simple one-shot coordination game – a stag-hunt game (Cooper et al., Reference Cooper, De Jong, Forsythe and Ross1990) – in which there were only two strategies available that could lead to two different equilibria (in pure strategies); one equilibrium that is Pareto-efficient – which we will call the efficient equilibrium henceforth – and another equilibrium that is Pareto-dominated – we call this second equilibrium the inefficient one. Our primary interest lies in understanding the influence of age, incentives, and group size on the choice of strategies in this simple, one-shot coordination game. We can examine whether already children and teenagers react systematically to changes in the latter parameters of a coordination game and whether age moderates these potential effects. In addition to studying the influence of external parameters of the game, we are able to control for subjects’ beliefs about other subjects’ behaviour.
According to Cooper and Weber (Reference Cooper, Weber, Capra, Croson, Rigdon and Rosenblat2020), there is hardly any work on how children play coordination games. Developmental psychologists have investigated how young children play such games. Grueneisen et al. (Reference Grueneisen, Wyman and Tomasello2015a) have studied whether theory of mind (ToM) is important for efficient coordination in a type of stag-hunt coordination game played by six-year-old children. Theory of mind is developed around the age of six, and it allows subjects to put themselves into the shoes of another person. This ability is supposedly influential in coordination games because the strategic uncertainty about the interaction partner’s behaviour is important for one’s own choices. Grueneisen et al. (Reference Grueneisen, Wyman and Tomasello2015a) find that children with higher ToM are better able to coordinate on more efficient outcomes. Their study does not consider a broader age range, however. This is done in Grueneisen et al. (Reference Grueneisen, Wyman and Tomasello2015b), where the authors let children aged three to eight years play coordination games. In these games, there is a focal point that can be used to coordinate the players’ actions. Yet, all possible equilibria of the game are equally efficient – that is, there is no ranking of equilibria possible. Grueneisen et al. (Reference Grueneisen, Wyman and Tomasello2015b) report that five-year-old children and eight-year-old children are able to coordinate on the focal point with a likelihood that is significantly greater than chance, but three-year-old children are not yet able to do so. Our paper differs from Grueneisen et al. (Reference Grueneisen, Wyman and Tomasello2015b) in several aspects. First, our coordination games have two Pareto-ranked equilibria (in pure strategies), which allow us to study whether children are able to choose the more efficient strategy. Second, we do not implement any focal point, thus making the choice of the efficient strategy considerably harder. Third, contrary to both Grueneisen et al. (Reference Grueneisen, Wyman and Tomasello2015a) and Grueneisen et al. (Reference Grueneisen, Wyman and Tomasello2015b), we do not only consider pairs of subjects playing a coordination game, but we also study behaviour in larger groups, because many coordination games are played by multiple players. Our treatment variation with respect to group size (pairs of subjects vs. groups of five) allows investigating whether larger groups affect the likelihood of choosing the efficient strategy. Fourth, we consider a broader age range than Grueneisen et al. (Grueneisen et al., Reference Grueneisen, Wyman and Tomasello2015a, Reference Grueneisen, Wyman and Tomasello2015b) by considering children and teenagers aged 9 to 18 years. Brocas and Carillo (Reference Brocas and Carillo2021a) study a similar age range in their coordination experiments. They run both a stag-hunt game (like we do) and a battle-of-the-sexes game. Children and adolescents of age 7 to 16 play these games for 96 periods (four supergames with 24 periods each). They find that older participants are more likely to reach the efficient and fair long-run outcome over the course of many repetitions. In contrast to them, we study one-shot games that reveal subjects’ reaction to strategic uncertainty (by varying group sizes) and different incentive schemes (by varying payoff matrices), absent of any convergence due to potential learning effects. We consider the paper by Brocas and Carillo (Reference Brocas and Carillo2021a) and ours as complementary.
To start with, our focus on the influence of age on behaviour in coordination games was exploratory, since, at the time of running our experiment (in 2009), no evidence existed about how children and adolescents might play coordination games. Of course, from the (now existing) experimental economics literature on the behaviour of children in economic games, one could form some expectations. Reasoning in economic games seems to develop below the age of 10 and is rather stable in the teenage years, as Brosig-Koch et al. (Reference Brosig-Koch, Heinrich and Helbach2015) have shown in an experiment on a backward-induction task (that has a unique equilibrium) and Brocas and Carillo (Reference Brocas and Carillo2021b) in a dominance solvable game. Similarly, Czermak et al. (Reference Czermak, Feri, Glätzle-Rützler and Sutter2016) have found in a series of normal-form games (also with unique equilibria) that strategic thinking is fairly stable in the teenage years. A priori, it is unclear from these papers what the implications for coordination games would be. In coordination games, strategic uncertainty is prevalent because a player needs to form an expectation about the other players’ actions in order to best respond. This does not necessarily imply that more sophisticated strategic thinking would lead to more frequent choices of the efficient strategy. The direction of influence will depend on expectations, and they might depend on age, so it is ultimately an empirical question whether age matters. In repeated coordination games, Brocas and Carillo (Reference Brocas and Carillo2021a) have shown that older adolescents coordinate more efficiently, yet for one-shot games this is yet to be examined.
Besides investigating potential age effects, we also examine the influence of incentives and group size. With respect to incentives, the prediction is straightforward (see Schmidt, Reference Schmidt2003, or Brandts & Cooper, Reference Brandts and Cooper2006, for coordination games with adults). The choice of the efficient strategy in our stag-hunt game should become more likely when it becomes more profitable – by increasing the payoffs in the efficient equilibrium – or when it is less costly – by increasing the payoffs in case of failure to coordinate on the efficient equilibrium. With respect to the effects of group size, experimental coordination games typically show more efficient play in smaller groups than in larger groups, and such patterns have been found consistently with adult participants (see Weber, Reference Weber2006, and in particular his Table 2 for a summary of group size effects, but also the surveys of; Devetag & Ortmann, Reference Devetag and Ortmann2007, or Cooper & Weber, Reference Cooper, Weber, Capra, Croson, Rigdon and Rosenblat2020). We vary group sizes by letting subjects play once in pairs and once in groups of five, expecting more frequent choices of the efficient strategy in smaller groups.
Our experiment has the following main results: (1) We do not find systematic and robust effects of age in our age range of 9–18-year-olds. This holds for the choice of the efficient strategy and the stated beliefs. Yet, with respect to the likelihood of successful coordination, we see some slight increase with age, mainly driven by an increase in inefficient coordination. (2) As expected, incentives play a systematic role. By and large, the efficient strategy is chosen significantly more often as it gets more rewarding in two-person groups. In five-person groups, we find no significant effect of the incentive scheme. (3) Efficient strategies are more often chosen in groups of two subjects than in groups with five subjects. (4) When subjects expect others in the group to play the efficient strategy, they are more likely to play it themselves, meaning that beliefs and actions are related to each other.
The rest of the paper is organized as follows. In Section 2 we present the experimental design and our experimental treatments. In Section 3 we present the results, and Section 4 concludes the paper.
2. Experimental design
2.1. Procedures
We conducted our study in seven different schools in Tyrol (Austria) in 2009, including 36 different classes that comprised fourth grade (with 9–10 years old children), sixth grade (11–12 years), eighth grade (13–14 years), tenth grade (15–16 years), and twelfth grade (17–18 years).Footnote 1 In total, we had 828 participants, with a slight surplus of girls (see Table 1), as one of the schools was a girls-only school.Footnote 2 Our experiment was part of a larger research project that over the course of two academic years investigated the development of economic decision-making of children. In the first year, we measured children’s risk, time, and social preferences (see Fehr et al., Reference Fehr, Glätzle-Rützler and Sutter2013; Sutter et al., Reference Sutter, Kocher, Glätzle-Rützler and Trautmann2013), and we used these data as explanatory variables for the coordination decision that we elicited in the second year of the research project. In the notes to Table 2 we describe in detail how we measured those preferences. Risk preferences might matter in coordination games because such games entail strategic risk. Social preferences might matter for the choice of strategy because miscoordination yields different degrees of unequal payoffs across our treatments. Time preferences have been shown to be related to cooperative behaviour (Kölle & Wenner, Reference Kölle and Wenner2023), and similarly they might be related to coordination behaviour.
Table 1 Distribution of observations by treatment, gender, and understanding

Notes: Experimental participants earned points in the experiment that were exchanged into Euros at the following age-dependent rates: €0.3 per point for 9–10-year-olds, €0.5 for 11–12-year-olds, €0.7 for 13–14-year-olds, €1.4 for 15–16-year-olds, and €2.2 for 17–18-year-olds.
# Treatments are explained in Section 2.2.
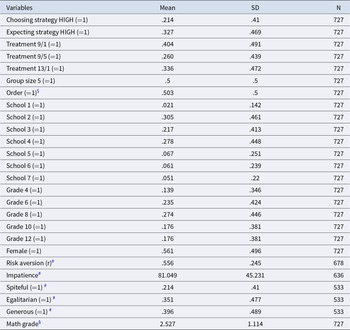
Table 2 Descriptive statistics

Notes: $ Order is defined as 1 when subjects first played in the two-person group, and afterwards in the five-person group. The reverse order is coded as 0. #Risk aversion, impatience, and other-regarding preferences (i.e. spiteful, egalitarian, generous) of subjects were measured in different experiments (one academic year earlier). Risk aversion was elicited utilizing the framework of Ellsberg’s two-color choice task (Ellsberg, Reference Ellsberg1961). Subjects could choose either a lottery that paid €10 or 0 with equal probability or a safe amount of money that increased in increments of €0.50 from €0.50 to €10. As a measure of a subject’s risk aversion r we use r = 1 – CE/10, where CE denotes the certainty equivalent of the risky prospect. The variable risk aversion can range from 0 (very risk-loving) to 1 (very risk-averse), with 0.5 as risk-neutral. For roughly one-quarter of the sample, we examined the effects of stake sizes by increasing the lottery prize from €4 for 10-year-olds in steps of €2 up to €12 for 18-year-olds. We did not find any stake size effect and hence control for this stake size variation by normalizing the CE to €10. A subject’s impatience was measured using time preference decision sheets, giving students the option of choosing a fixed amount at an earlier point in time or waiting for an increased payoff at a later point in time (see Figure A2). Each subject faced 8 different decision sheets with 20 decisions each. Only one of the choices was paid out in the end. The decision sheets varied in a 2x2x2 factorial design, the size of the fixed payoff at the earlier point in time (either €10.10 or €4.05), the waiting time between the earlier payoff, and the later payoff date (3 weeks or 1 year) and the upfront delay (no upfront delay or 3 weeks upfront delay). The variable ‘Impatience’ measures the frequency with which a subject chose the earlier (and smaller) payoff. Larger values indicate higher impatience. See Sutter et al. (Reference Sutter, Kocher, Glätzle-Rützler and Trautmann2013) for more details on the risk and the time preference experiment. Other-regarding preferences were measured with three simple allocation choices, which allow classifying the subjects’ preference type to be either egalitarian, altruistic, or spiteful. See Fehr et al. (Reference Fehr, Glätzle-Rützler and Sutter2013) for more details on the social preference elicitation experiment. §Math grade are self-reported grades in mathematics ranging from 1 (best grade) to 5 (worst grade). Columns 1 to 3: means, standard deviations (SD), and number of subjects who passed our comprehension check (i.e. answered the two control questions correctly). Note that we have two observations on choosing strategy HIGH as well as expecting strategy HIGH per child, one for group size 2 and one for group size 5. Note that treatments are explained in Section 2.2.
Our study was approved by the state board of education in Tyrol. Further consent was given by the headmasters of each school. Prior to the experiment, parents received an information leaflet explaining the nature of the study, without revealing details of the experiment, though. Participation was, of course, voluntary for children, but all of them agreed to participate. The experiment was run during regular school hours. Within a given school, we randomly selected classes of each age cohort to participate in our research project. Given that all children of the randomly selected classes in each school participated, there was no self-selection into experimental participation.
The experiment was computerized (using zTree, Fischbacher, Reference Fischbacher2007) and run with a portable lab.Footnote 3 Instructions were explained verbally by taking great care that children and teenagers could understand the rules of the coordination game and in particular how to interpret the payoff matrix. Before proceeding to the experiment, all participants had to answer two control questions (see Appendix for control questions). Overall 727 subjects answered both control questions correctly with an increase in comprehension by age (from 83% for 9–10-year-olds to 95% for 17–18-year-olds, p = 0.036 χ2-test). Note that we base our analysis on those 727 children and teenagers who passed both control questions. We used partition walls to prevent participants from looking at other participants’ screens. Moreover, experimenters enforced rules that questions could only be answered privately and that no communication between participants was allowed.
The experiment was incentivized, and each point earned in the experiment was exchanged into Euros at a pre-specified exchange rate, which was announced prior to the experiment. This exchange rate differed by school grades and was proportional to the average weekly allowance across the whole age range (see Fehr et al., Reference Fehr, Glätzle-Rützler and Sutter2013 for average weekly allowance for this age range). In the legend of Table 1, we present the exchange rate for each age group. Overall, the experiment took about 25 minutes.
2.2. The effects of incentives – between-subjects treatments
The experimental design had both a between-subjects and a within-subjects variation. The between-subjects variation concerned the payoff matrix of the coordination game. Here we had three different one-shot treatments, which are shown in Table 3.Footnote 4 In each treatment, subjects could choose between action LOW (presented as action ‘One’ in the instructions; see experimental instructions in the Appendix) and action HIGH (presented as action ‘Two’ in the instructions). The combination of one’s own action and the minimum action chosen by the other players in one’s group determined the payoffs. This general structure yielded two pure strategy Nash equilibria of the game, one where all players in a group play HIGH – which is the Pareto-efficient equilibrium – and one in which all players play LOW – which yields the inefficient equilibrium.Footnote 5 The choice of LOW always yielded eight points for the active player.
Table 3 Payoff matrices in the three one-shot treatments

Notes: The Pareto-efficient equilibrium (HIGH, HIGH) is depicted in the top left corner of each treatment, and the inefficient equilibrium (LOW, LOW) in the bottom right corner. The first numbers in a cell present the row player’s payoff. All players saw themselves in the role of the row player. The options LOW and HIGH in the columns of each treatment indicate the minimum choice of all other players in the group (excluding the row player), and the second numbers in each cell show the payoffs of the second player only in the games with a group size of two subjects.
The three treatments shown in Table 3 differed with respect to the possible payoffs from choosing strategy HIGH. The treatment labels indicate the two possibilities in case of picking HIGH. In treatment ‘9/1’, presented on the left-hand side of Table 3, a player who plays HIGH earned nine points if the minimum choice in the group was HIGH but earned only one point if someone in the group chose LOW. Of course, the efficient equilibrium (of all players earning nine points) requires all group members to choose HIGH, but this is risky because if only one group member chooses LOW, then the payoff drops to 1 point for all players who chose HIGH.
The other two treatments, shown in the middle and on the right-hand side of Table 3, vary either the payoff in the efficient equilibrium or the payoff in case of miscoordination (i.e., the payoff for the row player in the upper right cell of the matrix). In treatment ‘9/5’, it becomes less costly to play HIGH because of a payoff of 5 – rather than 1 as in ‘9/1’ – if another group member chooses LOW. Finally, in treatment ‘13/1’, the payoff in the efficient equilibrium increases from 9 – as in ‘9/1’ – to 13, keeping everything else constant.
Given that playing HIGH becomes less costly in ‘9/5’ in the case of miscoordination and more profitable in ‘13/1’ in case of efficient coordination, we expect to observe more choices of HIGH in these two treatments than in ‘9/1.’ It is unclear what to expect from a comparison of ‘9/5’ and ‘13/1,’ however. Both treatments yield an expected payoff of 7 from playing HIGH under the assumption that it is equally likely that the minimum chosen by the other players is LOW or HIGH. If increased payoffs in the efficient equilibrium (13 points instead of 9) weigh in larger than the increased payoffs in case of miscoordination (5 points instead of 1), then we should observe more choices of HIGH in ‘13/1,’ which would then lead to the largest frequency of HIGH in ‘13/1,’ an intermediate one in ‘9/5,’ and the lowest in ‘9/1.’Footnote 6
2.3. The effects of group size – within-subjects variation
While the effects of incentives were examined in a between-subjects variation, we examined the possible effects of different group sizes by letting each subject play two one-shot games (with the same incentives each) with different group sizes. The ‘two-person groups’ had two members, meaning that the row player’s payoff in any of the treatments shown in Table 3 depended on the own choice and the choice of the only other player in the group. The ‘five-person groups’ had five group members. Given the row player’s choice, the payoff for the row player from choosing HIGH was then determined by the minimum choice of the other four players in the group. In other words, choosing HIGH paid off for the row player only if all four other group members chose HIGH as well. We expect to find more choices of HIGH in two-person groups compared to five-person groups as the strategic uncertainty about the other group members’ choices is much lower in smaller groups.
Both one-shot games were explained at the beginning of the experiment (see experimental instructions in the Appendix), yet we balanced the order in which the two games were introduced in order to control for potential order effects. After we had worked through the instructions and participants had answered two control questions, we let them make their decisions. At the end of the experiment, it was randomly determined which game (first or second) was payoff-relevant.
2.4. The effects of beliefs
We also elicited subjects’ beliefs on the behaviour of the other group members. Therefore, following the actual choice in the two-person (respectively, five-person) groups we asked all participants to guess the minimum choice of their other group members. The belief elicitation was incentivized with one token for a correct guess. We expect that coordination choices are highly correlated with subjects’ beliefs. Note that in order to make the question about beliefs easy also for our youngest participants, we only asked for a point belief (whether someone expected HIGH or LOW as the minimum choice of the others in the group). This means that we did not elicit any kind of probability for HIGH or LOW as the minimum.
Subjects had no information about the other group members other than that they were attending the same school grade and would therefore be of the same age. It was additionally explained that the matched subjects did not attend the same school to exclude any potential influence of personal relationships in the decision-making process.Footnote 7 Given the latter matching procedure, all subjects were only paid after all data had been collected.Footnote 8 This was done within one–two weeks after executing the experiments. The money was handed over in sealed envelopes with an anonymous ID code on them.Footnote 9
3. Experimental results
The results section will first present the results for the two-person groups and then the five-person groups. Recall that the effects of group size were examined in a within-subject design in which the group size was randomly ordered (first a two-person group and then a five-person group, or vice versa). We did not find any order effects (see Table A2 in the Appendix), for which reason we pool the two different orders. The figures below show the coordination behaviour of our participants separately for each grade and for each of the three different incentives. Actions (i.e., choosing the efficient strategy HIGH) are discussed first and then followed up with the beliefs (i.e., expecting the partner(s) to choose the efficient strategy HIGH). Likewise, in the regression analysis, we control for our main explanatory variables grade (i.e., age), incentives (i.e., stake sizes), and group size as well as interactions thereof.
When presenting the results in the following, it helps to explain the general structure of Tables 4 and 5 already here. Table 4 shows the results of the OLS regression for the likelihood of choosing strategy HIGH, split by actions (models 1 to 3) and subsequently for beliefs (models 4 and 5). Model 1 shows the basic regression, model 2 includes measures for risk aversion, impatience, social preferences, and math grade, and model 3 includes the interaction between grade and beliefs. Similarly, model 4 shows the basic regression with the expected strategy as dependent variable, while model 5 includes additional controls. Table 5 shows the Wald tests where we test for age effects, differences between the treatments (i.e., stake sizes), and differences between the group sizes. Models 1–5 follow the same structure as in Table 4. Additionally, columns 6 and 7 present the non-parametric test results for comparison. To correct for multiple hypothesis testing, we have adjusted our analysis by performing a Bonferroni correction in which we take into account that we have tested six main hypotheses at the same time (i.e., three incentive structures x two group sizes). Finally, in Table A3 and A4 in the Appendix, we show probit regressions, which confirm that these estimation results are largely consistent with our OLS regression analyses.Footnote 10
Table 4 OLS estimation of determinants of choosing strategy HIGH and expecting strategy HIGH. Dependent variable: (1)–(3) likelihood to choose strategy HIGH, (4)–(5) likelihood to expect strategy HIGH as the minimum of the other players in one’s group

*** /**/* Denotes significance at the 1%/5%/10% level. P-values corrected for multiple hypotheses testing by performing a Bonferroni correction. Robust standard errors in parentheses. Clustered on the level of individual subjects. School fixed effects are included in each regression (i.e. we include for each of the seven schools, except for school 1 as the baseline school, a dummy. In no single regression, these dummies are significant.
Table 5 Post-estimation wald tests for regressions presented in Table 4 (columns 1 to 5) and results of corresponding non-parametric tests (columns 6 for actions and 7 for beliefs)

*** /**/* Denotes significance at the 1%/5%/10% level. P-values corrected for multiple hypotheses testing by performing a Bonferroni correction.
A (βgrade = 0).
B (βgrade + βgrade*treatment 9/5 = 0).
C (βgrade + βgrade*treatment 13/1 = 0).
D (βgrade + βgrade*group size 5 = 0).
E (βgrade + βgrade*treatment 9/5 + βgrade*group size 5 = 0).
F (βgrade + βgrade*treatment 13/1 + βgrade*group size 5 = 0).
G (βtreatment 9/5 + βgrade*treatment 9/5*1[2/3/4/5 … depending on the grade] = 0).
H (βtreatment 13/1 + βgrade*treatment 13/1*1[2/3/4/5 … depending on the grade] = 0).
I (βtreatment 9/5 + βgrade*treatment 9/5*1[2/3/4/5 … depending on the grade] = βtreatment 13/1 + βgrade*treatment 13/1*1[2/3/4/5 … depending on the grade]).
J (βtreatment 9/5 + βgrade*treatment 9/5*1[2/3/4/5 … depending on the grade] + βtreatment 9/5*group size 5 = 0).
K (βtreatment 13/1 + βgrade*treatment 13/1*1[2/3/4/5 … depending on the grade] + βtreatment 13/1*group size 5 = 0).
L (βtreatment 9/5 + βgrade*treatment 9/5*1[2/3/4/5 … depending on the grade] + βtreatment 9/5*group size 5 = 0 = βtreatment 13/1 + βgrade*treatment 13/1*1[2/3/4/5 … depending on the grade] + βtreatment 13/1*group size 5).
M (βgroup size 5 + βgrade*group size 5*1[2/3/4/5 … depending on the grade] = 0).
N (βgroup size 5 + βgrade*group size 5*1[2/3/4/5 … depending on the grade] + βtreatment 9/5*group size 5 = 0).
O (βgroup size 5 + βgrade*group size 5*1[2/3/4/5 … depending on the grade] + βtreatment 13/1*group size 5 = 0).
P (βexpected coordination + βgrade*expected coordination*1[2/3/4/5 … depending on the grade] = 0).
3.1. Two-person groups
3.1.1 Age
We begin by looking at subjects’ choices with respect to age in the two-person group. Figure 1a shows the likelihood of choosing strategy HIGH (on the vertical axis) by grade (on the horizontal axis) for each payoff treatment. The overall frequency of choosing HIGH across all age groups and treatments is 31.2%. When we investigate decisions by grade and treatment, we do not observe a clear age trend. While the non-parametric tests show a significant increase in choosing HIGH with age in the ‘13/1’ treatment (p = .006), this is not confirmed by the Wald tests (see Table 5). We conclude that there is no robust relationship between age and choosing HIGH across treatments in two-person groups. Subsequently, we proceed in Fig. 1b by examining the subjects’ beliefs regarding their expectation of the partner’s action. Similar to the findings pertaining to the subjects’ actions, there is no discernible age-related trend observed in terms of anticipating the partner’s inclination towards selecting HIGH in any of the treatments (see Table 5).

Fig. 1 a. Relative frequency of choosing HIGH in two-person groups; b. Relative frequency of expecting the other player to choose HIGH (error bars show 95% CI)
3.1.2 Incentives
When investigating how the different incentives affect choices, we observe that our subjects do differentiate between the payoff treatments. Pooling across all age groups, the frequency of choosing HIGH is 18.0% in the ‘9/1’ treatment, 24.9% in the ‘9/5’ treatment, and 52% in the ‘13/1’ treatment (see Table A1). While coordination is less sensitive to incentives among the youngest cohort, we find stronger reactions towards incentives among our older participants (see Fig. 1a). Specifically, we see significantly higher rates of choosing HIGH in treatment ‘13/1’ compared to treatments ‘9/1’ and ‘9/5’. This is true across all age groups, with the exception of the youngest age group (i.e., grade 4, see Table 5).
The beliefs by and large match this pattern as a higher fraction of subjects expect their partner to choose HIGH in treatment ‘13/1’ than in ‘9/1’ and ‘9/5’. The Wald tests confirm a significant difference across all age groups between treatments ‘9/1’ and ‘13/1’, as well as for older age cohorts (starting at grade 8) between treatments ‘9/5’ and ‘13/1’ (see Table 5). The latter effect, however, is not robust to controlling for additional factors (see Table 5, model 5). When comparing coordination behaviour between treatments ‘9/1’ and ‘9/5’, no clear distinction in strategies can be found (see Table 5). Contrarily, the beliefs show that subjects expect their partners to choose HIGH more frequently in ‘9/5’. This is the case for all grades, with the exception of grade 12.
3.2. Five-person groups
Next, we show and compare the choices and beliefs of the five-person groups. Recall that each subject played both, the two- and five-person game, in random order. We first investigate the differences within five-person groups by age and incentives and then contrast coordination behaviour in large versus small groups.
3.2.1 Age
Similar to our results for two-person groups, we do not find any robust differences for action HIGH when comparing the different grade levels. While there is a significant negative effect of age on the choice of HIGH in treatment ‘9/5’, it is not robust to the inclusion of risk-, time-, and social preferences as well as the math grade (see Table 5). We conclude that there are no robust age effects in large groups. In line with the actions, the beliefs do not show any significant differences or developments with age either (see Table 5 and Fig. 2b).
3.2.2 Incentives
When comparing the choice of strategy HIGH between the three treatments in five-person groups, no robust significant differences are found (see Fig. 2a and Table 5). Only when comparing treatments ‘9/1’ and ‘13/1’, we see a significantly higher frequency of HIGH in the two oldest grade levels in ‘13/1’. However, this effect is not robust to the inclusion of economic preferences and the math grade (Table 5, model 2). The beliefs are once again aligned with the choices as there are no significant differences in expectations (see Fig. 2b and Table 5).

Fig. 2 a. Relative frequency of choosing HIGH in five-person groups; b. Relative frequency of expecting HIGH as the minimum choice of the other four players in the five-person group (error bars show 95% CI)
3.2.3 Group size
Finally, we investigate differences in coordination behaviour across group sizes (i.e. comparing frequencies of choosing/expecting strategy HIGH in Figs. 1 and 2). From the comparison of Figs. 1 and 2, it stands out that the frequency of choosing strategy HIGH aggregated over all grade levels and treatments is much lower in five-person groups (11.6%) than in two-person groups (31.2%). A similar pattern is found in beliefs (19.7% vs. 45.8%). Both the lower fraction of actions and of beliefs (of HIGH) reflect a response to the increased strategic uncertainty of coordinating with four partners rather than just one.
Investigating group size effects by treatments, we find the biggest effect on actions in the 13/1 incentive, where the average choice of HIGH is 13.9% in large groups compared to 52% in two-person groups. This effect is significant across all grade levels. Similarly, the frequency of playing HIGH in treatment ‘9/1’ is lower in the five-person groups (9.2% versus 18%) and this effect is driven by the older age cohorts (namely, grades 10 and 12) as confirmed by the Wald tests in Table 5. No robust effect is found for treatment ‘9/5’. While the non-parametric tests show a significant effect (see Table 5, column 6), this is not confirmed by the Wald tests. Analyzing group size differences in beliefs largely confirms our results for actions. Subjects across all age groups expect in all three treatments the minimum choice of HIGH significantly less often in five-person groups than in two-person groups (compare Fig. 2b to Fig. 1b; Table 5, models 4-5 and column 7).
3.3. Best-response play
Figure 3 addresses the question of how many of our subjects are playing best-response to their expectations about others’ behaviour. As evident from Fig. 3 subjects play best response with a very high probability when they believe the minimum choice of the other players in their group is LOW. When subjects believe the minimum choice is HIGH, they are less likely to play best response. This pattern is equally found in small and large groups. In two-person groups, approximately 90% of our subjects (across all age groups) play best response if they believe their partner chooses LOW, while only 57% play best response if they believe their partner chooses HIGH. In five-person groups, we find an even larger gap in best-response rates. If subjects believe that LOW is the minimum choice of the other players in their group, they best respond on average in 94% of times. However, if subjects believe that HIGH is the minimum choice of the other players in their group, the best-response rate drops to only 33%. Our design choice of only asking for binary beliefs (either HIGH or LOW) may have contributed to this difference in best-response rates, contingent on subjects’ beliefs. It may be the case that subjects expecting LOW are almost certain about the other’s behaviour, and thus have no reason at all to choose HIGH themselves. On the contrary, subjects expecting HIGH may be less sure about it, assigning also some probability (but less than 50%) to LOW, in which case choosing LOW themselves may be a reasonable choice.

Fig. 3 Relative frequency of playing best-response to one’s own beliefs about the minimum choice of the others in one’s group; a. In two-person groups; b. In five-person groups (error bars show 95% CI)
Concerning the effects of age, we see that best-response rates seem to increase somewhat in older subjects. While 85% of 4th-graders in two-person groups play best response if they expect their partner to choose LOW, this fraction increases to 94% in 12th-graders, yet this is not significant (p = 0.882 Cuzick’s Wilcoxon-type test for trend). Given the expectation that the partner chooses HIGH, best-response rates increase significantly from 41% (4th-graders) to 72% (12th-graders) in two-person groups (p = 0.006 Cuzick’s Wilcoxon-type test for trend). A similar pattern can be found in five-person groups for subjects who expect the minimum choice of the other players in their group to be LOW. While 88% of 4th-graders in this group play best response, this fraction increases significantly to 98% for 12th-graders (p = 0.054 Cuzick’s Wilcoxon-type test for trend). No increase with age can be found for subjects who expect the minimum choice of the other players in their group to be HIGH. Therefore, the ability to incorporate the beliefs in own decisions and best respond to these beliefs is by and large more pronounced in older children and teenagers.
Figure 3 has shown best-response rates, conditional on own beliefs. It has not yet shown how the beliefs themselves relate to one’s own choices. This is shown in Fig. 4, in panel a for two-person groups and in panel b for five-person groups. The bars indicate how likely subjects expect HIGH as the minimum choice of the other players in their group, conditional on own choices. The left bar in each grade refers to subjects choosing HIGH themselves, the right bar to the others choosing LOW. In both panels, we see a very strong difference between the left and right bars, as one would expect. Subjects choosing HIGH themselves are much more likely to expect HIGH as the minimum of the others in their group. In two-person groups, this relative frequency is 83.3% over all age groups, while for subjects playing LOW themselves we see that only 28.8% expect HIGH as the minimum. For five-person groups, the corresponding numbers are 56% (for those playing HIGH) and 14.9% (for those playing LOW). These clear differences indicate that beliefs and actions are closely related. In the final subsection, we deal with this relationship from yet another angle.

Fig. 4 Relative frequency of expecting HIGH to be the minimum choice of the others in one’s group contingent on action HIGH and LOW; a. In two-person groups; b. In five-person groups (error bars show 95% CI)
3.4. Simulations on the level of (mis)coordination and the accuracy of beliefs
Recall that due to some miscommunication with helpers, we did not record who was actually matched with whom (see also note 8). Nevertheless, we can run simulations to examine the relative frequency with which coordination – on the efficient or the inefficient equilibrium – or miscoordination (when actions are not identical within a group) can be expected. To do so, participants were randomly matched 1,000 times in either pairs (two-person game) or in groups of 5 (see Section 2.4 for the matching procedure). Figure 5 illustrates the likelihood of successful coordination – meaning that the subject’s action and the minimum choice of the other members of the group – is the same (independent of which action) by age and incentives for both group sizes. Figures A3 and A4 in the Appendix disentangle this further into cases of successful coordination on the efficient or the inefficient equilibrium (absolute frequency of respective equilibria among 1,000 simulations on the vertical axis). The accuracy of beliefs is demonstrated in Fig. 6 by showing how many times (out of 1,000 simulations) one’s beliefs match the others’ actions. Figures A5 and A6 in the Appendix disentangle this for the different beliefs (of expecting others to play HIGH or LOW). Table A5 in the Appendix presents parametric and non-parametric test results for age, incentive, and group size effects. The overall frequency of successful coordination across all age groups and treatments is 75.5%. This is a relatively large fraction, yet it is driven by a very large degree of coordination on the inefficient equilibrium, as 69.3 percentage points stem from inefficient coordination and only 6.2 percentage points from efficient coordination.

Fig. 5 Absolute frequency of successful coordination for 1,000 simulations; a. In two-person groups; b. In five-person groups (error bars show 95% CI)

Fig. 6 Absolute frequency of correct beliefs for 1,000 simulations; a. In two-person groups; b. In five-person groups (error bars show 95% CI)
3.4.1 Age
Looking at subjects’ coordination success with respect to age, Fig. 5 and Table A5 show that successful coordination increases significantly with age in treatment ‘9/1’and ‘9/5’ in two-person groups (see Fig. 5a) and in treatment ‘9/5’ in five-person groups (see Fig. 5b). A look at Figures A3 and A4 reveals that this is driven by a significant increase of inefficient coordination by age. Conversely, Figures A3 and A4 illustrate that for two-person groups in treatment ‘13/1’, we find a significantly declining age trend in inefficient coordination and a significantly increasing one in efficient coordination. The net effect on overall successful coordination is insignificant for this subgroup. Subsequently, we proceed by examining the correctness of subjects’ beliefs. Similar to the results pertaining to successful coordination, we find a significant increase in correct beliefs in treatment ‘9/1’ for two-person groups and in treatment ‘9/5’ for five-person groups (see Fig. 6), which is driven by an increase of correct beliefs conditional on own LOW beliefs (see Figure A5). Moreover, there is a significant increase in correct beliefs given a LOW belief in treatment ‘9/5’ and a significant decrease in treatment ‘13/1’ in two-person groups (see Figure A5).
3.4.2 Incentives
When investigating how the different incentives affect the occurrence of different equilibria, we observe that our subjects do differentiate between the payoff treatments. Pooling across all age groups, the occurrence of successful coordination is 81.1% in the ‘9/1’ treatment, 74.6% in the ‘9/5’ treatment, and 69.4% in the ‘13/1’ treatment. Again, this is driven by inefficient coordination (79.4 percentage points in treatment ‘9/1’, 71.6 percentage points in treatment ‘9/5’, and 55.3 percentage points in treatment ‘13/1’). While successful coordination is less sensitive to incentives among the youngest cohort, we find stronger reactions towards incentives among our older participants in two-person groups (see Fig. 5a, Figure A3a, Figure A4a). Largely consistent with our findings for actions in Section 3.1, we see by and large more successful coordination in treatments ‘9/1’ and ‘9/5’ compared to treatment ‘13/1’, driven by more inefficient and less efficient coordination. No significant incentive effects are found for five-person groups. The accuracy of beliefs generally aligns with this pattern, as a greater proportion of subjects hold correct beliefs when their belief is LOW, and a smaller proportion hold correct beliefs when their belief is HIGH. These incentive effects are observed in the accuracy of beliefs for all treatment comparisons in two-person groups starting from grade 6 onwards. No clear pattern in the accuracy of beliefs is found for five-person groups.
3.4.3 Group size
Finally, we investigate differences across group sizes. Overall, the pattern is very clear – both regarding the occurrence of different equilibria as well as the accuracy of beliefs. We observe significantly fewer instances of successful coordination in two-person groups compared to five-person groups (see Fig. 5a and Fig. 5b), and this effect is driven by a lower likelihood of reaching the inefficient equilibrium (see Figure A3a and A3b). A similar pattern is found in the accuracy of beliefs. The correctness of beliefs is significantly higher in five-person groups compared to two-person groups (see Fig. 6a and Fig. 6b), and this is driven by a higher accuracy of LOW-beliefs in large groups (see Figure A5a and Figure A5b).
4. Conclusion
We have studied the evolution of coordination behaviour of children and teenagers in a large experiment with 727 participants, aged 9 to 18 years. We have focused on the influence of age, group size, and incentives on the likelihood of playing the efficient strategy in an experimental stag-hunt game. While the effects of group size and monetary incentives have been investigated previously in coordination games with adults (Brandts & Cooper, Reference Brandts and Cooper2006; Van Huyck et al., Reference Van Huyck, Battalio and Beil1990; Weber, Reference Weber2006), the relationship between age and the ability to choose the more efficient strategy has not received sufficient attention so far. Given that coordination problems also abound in the pre-adulthood age (e.g., selecting on which social media to be active), we consider it as important to understand the development of choosing the efficient strategy in the (pre)teenage years.
Overall we have found the following main results: Age does not have a robust effect. While we find some interaction effects with group size and monetary incentives, none of the age effects are robust to the inclusion of control variables. In sum, this means that in our one-shot coordination games, age plays no clear role. This is different from the finding of Brocas and Carrillo (Reference Brocas and Carillo2021a) that in repeated coordination games (across 96 periods in total), older adolescents become more efficient than younger ones. This might be due to learning, which was ruled out in our setting. In our one-shot games, age is no unambiguous predictor of behaviour. Yet, for the other two main factors under investigation – group size and incentives – we find clear effects.
The second main finding refers to the effects of group size. We have seen a much higher likelihood of choosing the efficient strategy in the two-person groups than in the five-person groups. The strategic uncertainty in larger groups is obviously harmful to the choice of an efficient strategy. This result is completely consistent with earlier experimental work with adults, starting with Van Huyck et al. (Reference Van Huyck, Battalio and Beil1990) and discussed extensively in Weber (Reference Weber2006) or Cooper and Weber (Reference Cooper, Weber, Capra, Croson, Rigdon and Rosenblat2020). Hence, children and teenagers react in a predictable way to strategic uncertainty in larger groups, as adults do. Our simulations show, however, that coordination on one equilibrium is much more likely for the inefficient equilibrium. Subjects who expect others to play the inefficient strategy choose this strategy themselves almost always, while those expecting others to play the efficient strategy deviate themselves more frequently.
Our third main finding concerns the relationship between monetary incentives and the choice of an efficient strategy. The larger these incentives, the more likely it is that subjects choose the efficient strategy in two-person groups. Here we have found that increasing the profits in the efficient equilibrium (in ‘13/1’) seems to work better than providing a cushion (in ‘9/5’) for subjects who choose the efficient strategy but where groups fail to achieve the efficient equilibrium. Overall, our results about the effects of incentives seem to be in line with what has been found in experiments with adults (see Brandts & Cooper, Reference Brandts and Cooper2006; Devetag & Ortmann, Reference Devetag and Ortmann2007, or Cooper & Weber, Reference Cooper, Weber, Capra, Croson, Rigdon and Rosenblat2020), indicating that already children and teenagers react in a predictable way to monetary incentives in coordination games. Similarly, children and teenagers form beliefs that are related, in the aggregate, to their actions. Those who believe others in their group also play the efficient strategy are more likely to play the efficient strategy themselves.
For future research, it would be interesting to investigate the influence of ToM on children’s beliefs about the choice of their partner(s). This ability develops from early childhood into adolescence (Valle et al., Reference Valle, Massaro, Castelli and Marchetti2015) and has been shown to affect strategic reasoning. Consequently, it may shape the proficiency of individuals in adopting equilibrium strategies within the context of game theoretical research designs. A study conducted by Brocas and Carillo (Reference Brocas and Carillo2020) has underscored the noteworthy development of ToM and logical reasoning during early childhood. Their findings suggest that children’s strategic decision-making is primarily influenced by elements of complexity in the game. Following their example, we believe it would be interesting to investigate how ToM affects subjects’ choices with increasing age as well as increasing complexity of the game, that is, group size.
Supplementary material
The supplementary material for this article can be found at https://doi.org/10.1017/eec.2025.10019.
Data availability statement
The replication material for the study is available at https://doi.org/10.17617/3.1H6QYT.
Acknowledgements
We thank three referees, Ragan Petrie as editor and Stefania Bortolotti, Alexander Cappelen, Werner Güth, Bertil Tungodden, and workshop participants in Munich and Bergen for helpful comments and suggestions. We are particularly grateful to Thomas Plankensteiner from the State Board of Education in Tyrol (Landesschulrat für Tirol) and the headmasters of the involved schools (Peter Arnold, Max Gnigler, Sigmund Heel, Gottfried Heiss, Ulrike Künstle, Hermann Lergetporer, Bernhard Schretter, and Peter Paul Steinringer) for making this study possible
Funding statement
Financial support was provided by the Austrian Central Bank (Jubilaeumsfondsprojekte 12,588 and 14,680) and by the University of Cologne (through the Hans Kelsen Prize)


 Open access