


Introduction
The rise of digital platforms has been called a “revolution” [Parker et al. Reference Parker, Van Alstyne and Choudhary2016], with varied effects on trade, organizations and the economy. Digital platforms have become progressively more pervasive in our everyday lives, ranging from culture (music streaming) to health care (appointment making) and education (learning management systems). This article examines how they affect the concrete functioning of markets, insofar as they interfere with price formation and mediate relationships between consumers and producers.
One answer in relation to the restaurant market that emerged early on, when this form of intermediation was still a novelty, is that platforms can solve any mismatch by enabling all willing diners to find their desired table and all open restaurants to fill their dining rooms [Evans and Schmalensee Reference Evans and Schmalensee2016]. Another answer, “zooming in” on diners, highlights the empowering effect of platforms’ online review systems in the sense that they allow consumers to express their views and influence others, even without being gastronomy experts [Mellet et al. Reference Mellet, Beauvisage, Beuscart and Trespeuch2014; Beuscart, Mellet and Trespeuch Reference Beuscart, Mellet and Trespeuch2016]. But what are the effects of platforms on the other side of the market—that is, on interactions between competing restaurants, on their choice to position themselves in a specific “niche” (from fine dining to bistros and pizzerias) and perhaps on their long-term business choices?
Answering these questions requires a move away from the commonly held view of markets as the matching of supply and demand, to a sociological definition that highlights their empirical structuring through interactions between members. This perspective places particular value on producer market models, emphasizing coordination between firms that endeavor to position themselves in relation to one another. Harrison White [1981, 2002] famously posited that producers make their decisions through mutual observation: “the individual makes his or her choice by observing the fate of others who have faced similar, but by no means identical choices” [Leifer and White Reference Leifer, White, Mizruchi and Schwartz1987: 86]. Restaurants offer an ideal setting in which to identify the contours of the practice of competitor observation because at least one underpinning mechanism, namely geographical proximity, is intuitive and plausibly general. Dine-in services in particular are tied to specific localities that, for each restaurant, limit the set of potential customers, workers and, importantly for our purposes, competitors. Although White’s original model did not explicitly foreground the spatial dimension, it can be assumed that restaurant owners and managers observe the competitors they have literally next door, in a geographically delimited area that may be the street, the neighborhood or some larger vicinity, depending on the setting. Locations in which competitors meet facilitate inter-organizational interactions [Lomi and Pallotti Reference Lomi and Pallotti2012]. We call this mechanism “eye’s length ties” with reference to the “arm’s length ties” described in Brian Uzzi’s [Reference Uzzi1996] path-breaking article on the embeddedness of New York textile firms. In sum, physical limits constrain observation of competitors within the given perimeter of what is visible at a glance.
Digital platforms innovate by equipping producers with devices [Karpik Reference Karpik2000] to support their observations. Traditionally, only gourmet restaurants could harness tools such as the Michelin Guide or the writings of expert critics [Johnston and Bauman Reference Johnston and Baumann2014] and food journalists [Naulin Reference Naulin2017] to monitor the space of possible market opportunities. Digital platforms arguably extend this opportunity to all types of restaurants. One of the first to offer such services was OpenTable in the United States, a technology-enhanced real-time reservation system for diners and restaurants, which also serves to guide dining choices thanks to platform-provided labels, restaurants’ self-presentations and customer reviews. Research on market devices [Garcia Reference Garcia1986; MacKenzie Reference MacKenzie2008; Muniesa Reference Muniesa2000; Muniesa, Millo and Callon Reference Muniesa, Millo and Callon2007] shows that technologies shape the market as much as they facilitate it. To “eye’s-length” observations, we must thus add the “digital glasses” that these devices represent. For example, restaurants can now see online the menus and photographs, as well as any discounts or special offers, posted by their competitors.
Observation, said White, is of “others who have faced similar, but by no means identical choices” [Leifer and White Reference Leifer, White, Mizruchi and Schwartz1987: 86, emphasis added]. Restaurants epitomize a market characterized by product differentiation rather than by homogeneity as a pathway to business success, as first theorized by Edward Chamberlin [Reference Chamberlin1946]. White extended this idea by modelling how the reactions of each producer to all others eventually generate a market structure in which each group of producers occupies a differentiated niche, depending on the level of quality offered. Indeed, the restaurant market could not be understood without considering quality—not much in terms of factual attributes (such as type of cuisine) but rather in terms of the judgments through which interacting stakeholders construe it, sometimes through controversies: what is “good” food, a good meal or a good restaurant? The French “economics of conventions” school [Diaz-Bone and de Larquier Reference Diaz-Bone and de Larquier2025] sheds further light on the notion of quality by framing it as the result of production conventions, which arise from implicit collective agreements between market actors and are translated by firms into coherent forms of management [Biggart and Beamish Reference Biggart and Beamish2003; Diaz-Bone Reference Diaz-Bone and Zafirovski2023]. Interestingly, quality conventions are co-constructed by producers and consumers, as the latter’s valuations are signals to which the former react by adjusting their position in the market structure and, consequently, the way they perceive each other and fine-tune their choices accordingly. Hence, quality brings consumers back to White’s producer market model. This is another channel through which the “digital glasses” provided by online platforms offer better sights than sheer eye’s length observation: restaurants can now use diners’ reviews to infer their competitors’ quality choices.
Taken together, these different dimensions offer a sociological definition of the market as a simultaneously territorial, social and technological space, within which producers compete for the same customers. In the remainder of this article, we investigate the interplay of these forces in a concrete market, drawing on White’s producer market model as interpreted by the economics of conventions [Favereau, Biencourt and Eymard-Duvernay Reference Favereau, Biencourt, Eymard-Duvernay, Favereau and Lazega2002], seeking to unpack the impact of digital platforms on the modes and mechanisms through which restaurants observe each other and position themselves in the quality space. We empirically analyze the case of a very popular platform, which we rename here “The App”, in the restaurant industry of the mid-sized city of Lille in northern France. A cosmopolitan and lively city, Lille has a rich and diverse restaurant culture; at the same time, it is less heterogeneous and volatile, and its territorial boundaries are easier to determine than those of larger conurbations, such as Paris. Mixing methods, we use observations and interviews, web-scraping and business data about Lille restaurants to show that platforms rationalize firms’ practice of observing one another as a basis for making decisions on volume and quality. We thereby claim that the rise of digital platforms has brought about no “revolution” but rather has equipped producers with devices that amplify their view of the competition, standardize their offerings and support the stability of their business over time. In doing so, we highlight how the platform facilitates, but does not fundamentally change the social coordination of this market based on quality.
A sociological approach to producer markets: space, quality and technology
We introduce in what follows the main theoretical pillars that sustain our argument. After recalling the essential traits of White’s producer model, we discuss the role of quality judgments and introduce the notion of “quality conventions” as a basis on which to further specify our research questions and to formulate more precise conjectures about the potential effects of digital platforms. In this way, we also expound how the economics of conventions enriches White’s model and makes it empirically tractable.
A sociological definition of the market
Carruthers and Uzzi [Reference Carruthers and Uzzi2000] claim that in sociology the study of the firm started earlier, and progressed faster, than the study of the market. But since the path-breaking articles of Harrison White [Reference White1981] and Mark Granovetter [Reference Granovetter1985], “new” economic sociology has blossomed, taking the social construction of markets as its core. Unlike economics’ abstract representations, economic sociology construes markets as concrete, organized social spaces arising from social relations and interactions between heterogeneous actors [Ahrne, Aspers and Brunsson Reference Ahrne, Aspers and Brunsson2015], including not only producers and consumers but also experts, intermediaries, advisors and other stakeholders. Aspers [Reference Aspers2012] defines a market broadly as “a social structure for the exchange of rights in which offers are evaluated and priced, and compete with one another, which is shorthand for the fact that actors—individuals and firms—compete with one another via offers.”
White proposed a narrower definition of “production markets” as “self-reproducing social structures among specific cliques of firms and other actors who evolve roles from observations of each other’s behavior” [1981: 518]. For White, a production interface is a structure in which actors make the market as much as they fit into it, and in which producers’ participation, supported by suppliers, presupposes a commitment to provide consumers with a flow of goods of a given quality. Producers seek to position themselves in “quality niches”, that is, unique combinations of quality level and production volume, and allocate their costs accordingly. Thus, production markets differ theoretically from the exchange markets of perfect competition theory, in which goods are homogenous and firms compete only on price. Here, products are differentiated into price–quality bundles, although they are close enough to appeal to similar consumers. Producers’ choices are guided by the reactions of consumers, whose decision to buy or not to buy will positively or negatively sanction them, thereby stabilizing or transforming their offerings over time. Competition involves interdependence because “each participant’s relative position within the internal hierarchical order of the interface is determined on the basis of judgements that are made about the quality of that participant’s performance, compared with the performance of the other participants” [Azarian Reference Azarian2005: 124]. By the price and relative quality of their product, producers signal their choices to others, enable mutual observation and adjust to others’ positions.
White’s analysis is based on the simultaneous interplay of four parameters, which reflect supply and demand factors: a, consumer satisfaction in relation to volume; b, consumer satisfaction regarding quality; c, production costs due to volume; and d, production costs for quality. These parameters are quantitative and can incorporate qualitative dimensions insofar as these are subject to a commensuration process [Espeland and Stevens Reference Espeland and Stevens1998]. Two coefficients synthesize market structure: a/c (ratio between volume indicators) and b/d (ratio between quality indicators). They constitute a plane in which a/c is the horizontal and b/d is the vertical axis. Two intermediate sub-axes subdivide the plane. The first, vertical axis corresponds to the points at which a = c, that is, the volume costs incurred are equal to consumers’ satisfaction in relation to volume. The second, diagonal axis corresponds to the points at which the ratio between customer satisfaction (demand) and producer decisions (supply) with regard to quality and volume are equal (a/c = b/d). These sub-axes distinguish a non-viable (“Failure”) region from a viable one, in turn subdivided into three different regionsFootnote 1 (“Ordinary”, “Advanced” and “Paradox”Footnote 2). According to White, the “Failure” region is unsustainable because firms in this region are “freeloaders” [White Reference White1981: 529). Indeed, they try to get ahead by attracting customers at the expense of others, that is, by engaging in fiercer competition. In doing so, their choices (in terms of allocating costs to volume and quality) are not fully in line with the structure of the market and therefore do not promote its sustainability and reproducibility.
Markets as located settings
Co-location can be consequential especially in a geographically tethered industry such as dine-in restaurant services. Mutual observation of co-located competitors, notably in the tourism industry [Hall and Williams Reference Hall and Williams2008], is a key mechanism through which firms learn from, and imitate, each other. The combination of co-location and market segment facilitates, for example, knowledge transfer and innovation spillover [Ren et al. Reference Ren, Gyimothy, Jensen, Krizaj, Bratec, Alsos, Eide and Madsen2014).
We submit that the importance of the multidimensionality of markets, social and geographical, has increased with the rise of digital platforms. Far from constituting a “virtual” space of their own, these technologies are anchored in physical geography and leverage its properties—notably through extensive capture of geo-localized data—to optimize their functioning. For example, the App’s search engine uses location, in addition to ratings and any attributes (for example, opening times) to recommend restaurants to consumers. As a result, geographically close restaurants may be presented as equivalent alternatives to consumers and therefore become competitors regardless of their market segments (quality/volume choices). Therefore, competitor observation becomes more comprehensive and overcomes the limitation that White noted 40 years ago, namely that “firms can observe only volumes and payments, not qualities or their valuations” [1981: 520–521]. Platforms open a window precisely on qualities and valuations through their online review systems, as discussed in detail below. Additionally, the platform’s algorithm may extend the geographical reach of competition by juxtaposing recommendations of spatially distant restaurants—which could have ignored one another in non-digital worlds. These considerations support a first conjecture on the effects of digital platforms on this market, which we call amplification: we expect platforms to extend observation of competitors to larger geographical areas (beyond eye’s length distance), and simultaneously to uncover more information about firms’ characteristics and choices, previously occluded from view.
When quality valuations shape markets
French economic-sociological research insists that quality is not predetermined but emerges from interactions between actors who acquire technical and relational “judgment devices” to play the social game of defining it [Favereau and Lazega Reference Favereau and Lazega2002; Karpik Reference Karpik1989]. Quality is particularly hard to assess in the restaurant market, and prices are insufficient to remove uncertainty [Karpik Reference Fourcade and Healy2000] so that, as already mentioned, there is a long tradition of relying on the information and expertise of culinary experts and journalists. The rise of digital platforms has brought about a sea change in this market by giving valuation roles to non-experts through online consumer review systems, something that is also happening in other markets, such as hotels [Orlikowski and Scott Reference Orlikowski and Scott2014]. Of course, laypersons’ opinions informally transmitted by word of mouth have always been a powerful judgment device and mechanism of influence. Digital platforms formalize this process and raise it to a larger scale, collecting the opinions of many consumers, aggregating them into easily understandable indicators (such as rankings and “star” ratings) and diffusing them publicly on the web. Unsurprisingly, there are tensions between platforms, as promoters of consumer review systems, and more traditional expert critics [Beauvisage et al. Reference Beauvisage, Beuscart, Cardon, Mellet and Trespeuch2013].
Consumers’ valuations, and the scores that the platform computes on this basis, were initially intended to remove some of the informational bottlenecks that make quality uncertainty so pervasive. By providing the same information to all users, they would be more inclusive than the informal word-of-mouth networks of the past, and less vulnerable to opportunistic behaviors [Gandini Reference Gandini2016]. However, the reliability of platforms’ reviewing and rating systems rests on voluntary participation and truthful reporting, and the conditions for this to happen are rarely met. Luca and Zervas [Reference Luca and Zervas2016] find that 16% of restaurant reviews on the popular website Yelp are fake, fraudulently created by businesses for their own benefit or against their competitors. Platforms’ efforts to control misbehavior have led them to exert more power on users, often using opaque algorithmic tools [Lehdonvirta Reference Lehdonvirta2022]. This may result in bias: for example, platforms’ design of incentives overwhelmingly favors positive evaluations, especially when users are not anonymous [Origgi and Pais Reference Origgi and Pais2018]. In this context, the occasional strongly negative review has much stronger effects on a business’s capacity to attract customers. Awareness of this risk generates significant uncertainty. In particular, restaurants’ reactions to the judgments that their clients share online include fear of bad ratings, suspicion of fake reviews, need to take concrete actions after negative criticisms, and extra work to curate online reputation [Beuscart, Mellet and Trespeuch Reference Beuscart, Mellet and Trespeuch2016].
But beyond the individual, what are the effects on the whole social space of producers, that is, the interactions of restaurants with their competitors? Even if somewhat distorted, consumers’ reviews are still visible to competitors and constitute signals. The operations performed by the platform also tend to make restaurants more commensurable, closer to each other—to the extent that they are assessed in the same way regardless of any differences in cuisine (or other characteristics) and are shown next to each other when the customer runs a search. On this basis, we formulate our expectation of normalization, whereby platforms frame and shape the identity of restaurants by standardizing the way they present themselves, and ultimately, their offers to consumers, ultimately reducing any differences between competitors.
Production markets through “quality conventions”
The notion of “quality conventions” highlights how definitions of quality do not always depend on consumers alone, and rather require coordination between multiple actors in ways that give order to the market and trigger the emergence of a variety of “enterprise models” of production [Favereau, Biencourt and Eymard-Duvernay Reference Favereau, Biencourt, Eymard-Duvernay, Favereau and Lazega2002]. Convention theory identifies a threefold typology of “merchant”, “industrial” and “domestic” quality conventions, each corresponding to a different approach to the production of goods and services. The “merchant” quality convention constitutes an order of quality based on conformity to customers’ tastes and applies, for example, to fashionable products. Firms are flexible and adapt to the competition, which is only partly price-based, in that consumers may be ready to pay higher prices for very successful products but expect much lower prices for others. The “industrial” quality convention describes firms whose production is based on technical standards and norms, for example those established by an outside authority. Because economies of scale incentivize standardization of production and stabilization of the product over time, consumers see firms’ offerings as very similar and look for lower prices. The “domestic” quality convention characterizes firms whose production is based either on traditional know-how and expertise or on reputation linked to a long-standing brand image. Prices can be high because they are not the main criterion that customers consider.
Conventionalists used this typology to shed light on a major outcome of White’s model, namely the idea that different market regions can be distinguished, depending on quality [Favereau, Biencourt and Eymard-Duvernay Reference Favereau, Biencourt, Eymard-Duvernay, Favereau and Lazega2002]. In this perspective, the “Ordinary” part of White’s two-axis plane corresponds to the “merchant” convention, in which firms compete not only on price, but also by being responsive to consumer tastes. The “Advanced” region reflects the “industrial” convention, in which firms seek to standardize and normalize their production, aiming to attract and increase their customer base through lower prices and basic products and services. Finally, the “Paradox” region is related to the “domestic” convention, in accordance with which firms seek to build their reputation and brand image, and aim to foster trust, receive positive evaluations and singularize their production, thereby mitigating and warding off competition.
Insofar as the restaurant market is segmented into regions that correspond to this typology, we expect use of digital platforms to affect competitor observation differently in each of them. For example, “Ordinary” restaurants will seek to spot any new food fashions and innovations in the industry, “Advanced” restaurants will monitor others’ prices, and “Paradox” ones will pay attention to awards or other forms of recognition. These differences may affect the time horizon of choices made on the basis of mutual observation: while price adjustments can be made (and unmade) in the short run, quality changes may orient a firm’s longer term business model and, if successful, may be durable. We thus formulate the conjecture that digital platforms can form part of a business operating mode that can remain stable over time, conditional on the quality convention adopted.
Data and methods: operationalizing White’s model to study restaurants in Lille
In what follows we present our setting, data collection strategy and computations to operationalize White’s model and its reinterpretation by convention theorists. In our sequential mixed method design [Cresswell and Plano Clark Reference Creswell and Plano2007], the preliminary qualitative fieldwork informs the quantitative research strand in a reflexive manner. A loop effect also emerges in the interpretations, in which qualitative material provides illustrations of quantitative findings. This sequential approach situates the data in a specific concrete market, drawing on insights from participants to give meaning to, and to grasp the connections between, non-conventional quantitative data sources from platform and business providers. Our mixed method design does not aim at triangulation (examining one phenomenon through multiple concurrent methods) but at complementarity of tools to address a research question that none of them could answer alone [Greene, Caracelli and Graham Reference Greene, Caracelli and Graham1989]. On this basis, we identify relevant restaurants, position them in White’s market interface, then present the resulting quality niches and production conventions.
Collecting data from and about a platform
The App is an online consumer review website combined with a real-time booking system and a reservation management service for restaurants. Each firm has its own page, on which it can advertise itself through pre-established categories (“Italian” or “French” cuisine, “Terrace”, “Top Rated” and so on), list its services (“American Express”, “English spoken”), add photos, showcase its seasonal menu and write a short blurb about itself. The App visualizes each restaurant’s address on a map of the city and computes average price based on the menus provided. A restaurant may choose to be bookable through the App; if it does, its page includes a widget for table reservations. Booking online is free of charge for customers, while restaurants pay a fee for each diner. Only customers who have dined at a restaurant after making a reservation through the App can leave a review. They give a score on a 0–10 scale for cuisine, service and setting, and the App publishes a weighted average (50% cuisine, 25% service and 25% setting, at the time of our fieldwork). In addition, customers can add a written review of the restaurant, although, in practice, only a minority do so. The number of ratings and the average score are shown prominently on the restaurant’s page, together with the most recent written comments. At the time we collected the data, the platform removed all restaurants with an average score below the threshold of 7.
The App encourages restaurants to offer discounts (as a percentage of the final price excluding drinks, or in the form of a special menu) to diners who book their table through its services. For consumers, there is a system of loyalty points which may be redeemed in the form of further discounts in participating restaurants. The platform also offers table management software to restaurateurs, to be purchased separately from the main online booking and reviewing service.
In 2017, we conducted a sequential mixed method study about online reservation platform usage by restaurant owners and managers. We started with 13 exploratory qualitative interviews with restaurateurs who used the App, and in some cases also other platforms. These interviews took place in Paris, Normandy and Lille, and had a duration of 20–60 minutes, with an average of 35 minutes. We also conducted a day of observation at an event that the platform organized to bring together top chefs, culinary journalists and consultants in front of an audience of restaurateurs.
The second—and main—part of the study is quantitative and uses native digital data from the App itself. We programmed an automated web scraper in Python to retrieve data on platform use, and we ran it twice in August and September 2017. A change in the platform’s Terms of Use just afterwards prevented us from gathering later updates.
The scraping identified n=283 restaurants located in Lille, of which we selected the 105 that not only had a page on the platform at the time of the data collection but were also bookable through it and had evaluation scores computed by the platform based on diners’ reviews. These criteria define our empirical setting, establishing the boundaries of the population. While these restaurants differ by size, type of cuisine, price level and other characteristics, their co-location in the same city and their use of the platform are common features that establish dependencies and therefore define them as mutual competitors [Eloire, Reference Eloire, Christoforou and Laine2014]. Through the App, all these restaurants appear on customers’ screens as potential alternatives, with all other differences between them being minimized as mere filters that may or may not be activated. Despite their qualitative diversity, these restaurants compete essentially for the same customers and use the digital platform to become more visible to them.
The data obtained from web scraping are limited to what the platform publishes on the profile of each restaurant. We could access basic information about the restaurant (location, type of cuisine, self-description, tags, price), and its evaluation scores, computed by the platform as averages of all customers’ contributions since the first day the restaurant was bookable through its services, and customers’ freely written comments. However, these data are insufficient for computing White’s model because they document only aspects that interest customers, not business strategies and operations. We thus obtained a complementary dataset, first through a private service consultant that provided three additional variables for each restaurant: number of employees, number of seats and average bill per meal (which differs from the price computed by the App, which is simply the average of a three-course meal based on restaurants’ self-declared menus rather than actual orders, and does not include extras, such as drinks). Second, we consulted the Michelin Guide and another regional guide, as well as a famous blog (“Pudlo”), to collect more information about restaurants’ status and better describe their quality orientation. Third, in 2020, we ran a manual search to retrace the trajectory of these restaurants: do they still exist and do they still use the App? This verification was carried out in February 2020, before the disruptions caused by the Covid-19 pandemic.
Typology of restaurants in Lille
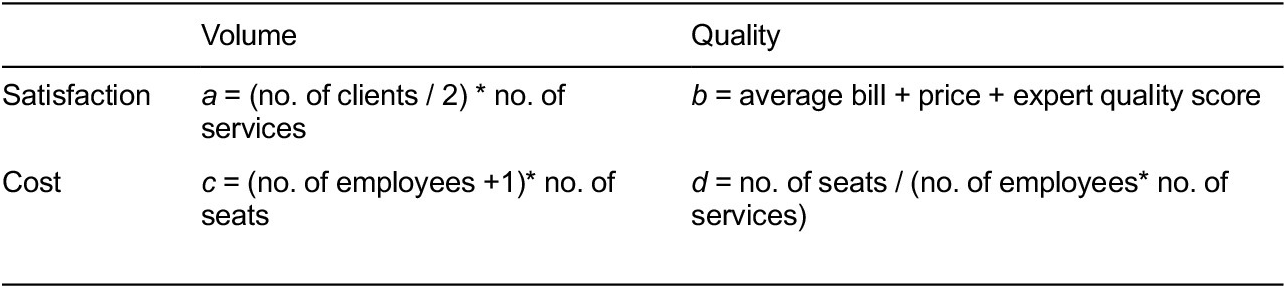
We use prices, guidebook awards and number of seats, services, employees and customers to compute the a, b, c and d parameters that reflect, respectively, cost and satisfactionFootnote 3 in relation to quality and volume in White’s producer market model [White Reference White2002: 51]. Like other authors who have adapted this model to their research settings,Footnote 4 we combine these variables to build the four parameters.
Table 1 summarizes our operationalization of White’s generic indications. In the absence of precise measures of quality and cost, we approximate them through indicators derived from available data and inspired from Dallery et al. [Reference Dallery, Eloire and Melmies2009]. First, we measure volume satisfaction (a) as the audience level of the restaurant, taking the number of clients per day divided by two (the number of meals per day, that is, lunch and dinner), and multiplied by the number of services per week (ranging from a minimum of five to a maximum of fourteen if the restaurant is open for lunch and dinner, seven days a week). The higher the restaurant’s occupancy rate, the more the volume offered by the restaurateur satisfies the volume of consumers. For volume cost (c), we extract information on the amount of resources necessary to produce a meal from the size of the restaurant, under the assumption that a larger size corresponds to higher costs. We proxy size through the number of employees plus one (the restaurant owner or founder), multiplied by the capacity of the restaurant, measured by the number of seats. The greater this value, the higher the volume-related costs. We then compute customer quality satisfaction (b) as the average bill per meal, to which we add the price level displayed by each restaurant, and the quality score that we estimate from the awards given by experts (such as the Michelin Guide).Footnote 5 The higher this indicator, the more customers appreciate the quality of the restaurant and are willing to pay a higher price for their meal. Finally, we assess the cost of quality (d) through an indicator that spotlights restaurants that invest in the quality of their service, proxied by the theoretical time an employee can spend attending to each customer. We capture this through the ratio between the number of seats, multiplied by the number of weekly meal services, and the number of employees. A lower score on this indicator signifies a greater investment in meal quality, as it reflects the fact that employees have more time per customer. The choice of lowering d aims to achieve greater customer satisfaction.Footnote 7
Table 1 White’s model for Lille restaurantsFootnote 6

Source: Authors’ elaboration based on White Reference White1981.
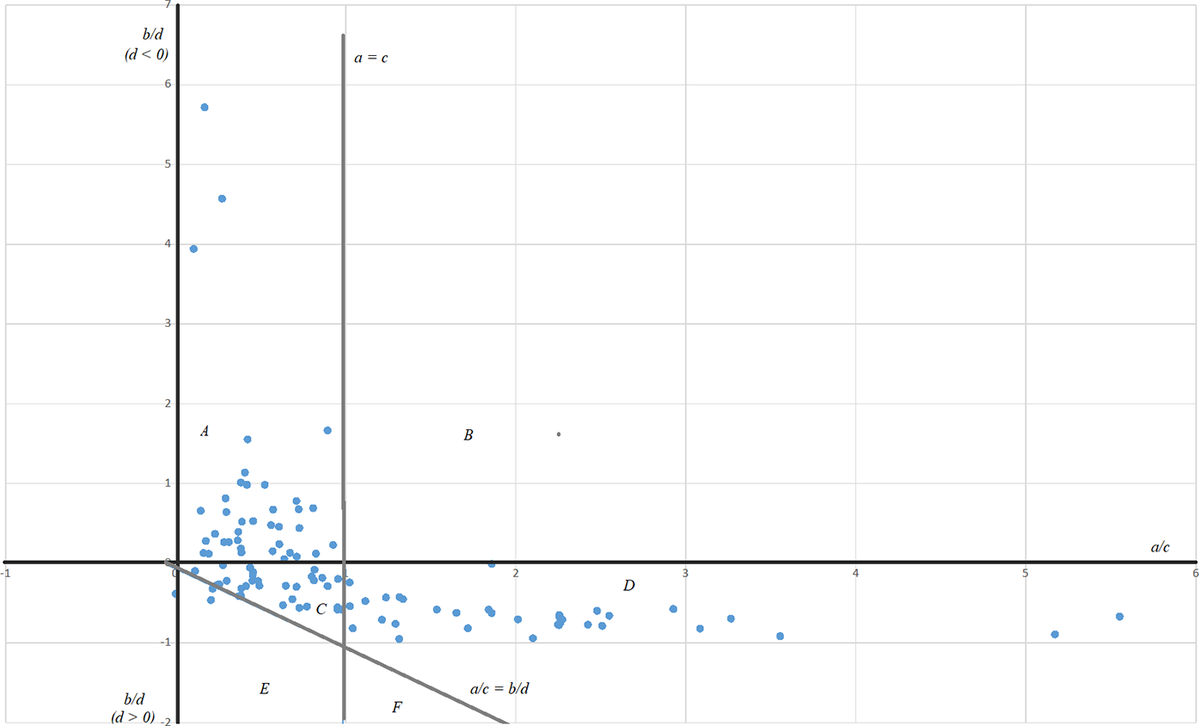
The two coefficients (a/c and b/d), derived from these four parameters, synthesize the market structure and define each restaurant’s niche or quality convention. These coefficients determine whether a restaurant falls into the Advanced, Ordinary, Paradox or Failure region (Figure 1). Positioning within a specific region reflects the restaurateur’s cost allocation strategy, favoring quality (Paradox), volume (Advanced) or a mix of the two (Ordinary). If the restaurant belongs to one of these three viable regions, customer satisfaction validates its cost decisions. However, if it falls into the non-viable (Failure) region, then the firm, and more generally the market, faces potential risk.

Figure 1 Lille restaurants in the White model plot
Note: Horizontal axis: a/c (volume), vertical axis: b/d (quality). The sub-axes a = c and a/c = b/d have been added. Zone A = Paradox, zone C = Ordinary, zone D = Advanced, all other zones = Failure. N = 105.
Source: Author’s elaboration.
Restaurants within the interface
We now describe in detail restaurant characteristics within each region of this market and highlight any differences in platform use that may be associated with this typology (Table 2). Each of the three viable regions contains about a third of the restaurants in our population. Accounting for only 7% of restaurants, the Failure region does not endanger the overall market structure.
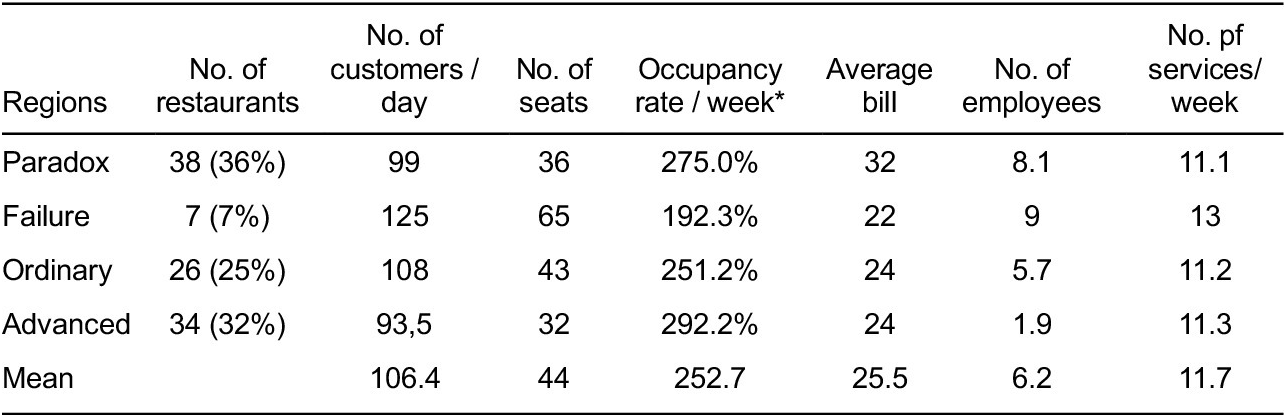
Table 2 Lille’s restaurant characteristics by type in White’s model

Note: Averages per type, n=105. Occupancy rate / week is defined as (No. of customers/day * No. of services/week) * 100 / (No. of seats * No. of services/week)
Source: Author’s elaboration.
Table 2 also summarizes restaurants’ average characteristics by market type/quality convention. The Paradox type comprises higher-quality restaurants, with the highest average bill (32 euros per person per meal). At the opposite end, Advanced restaurants have the lowest labor costs (1.9 employees) and the best occupancy rate (292.2%), although they are not the largest. Ordinary restaurants are on average larger (43 seats) but less expensive (24 euros), and they have an intermediate occupancy rate (251.2%). Failure restaurants are relatively close to the Ordinary region (just below the a/c = b/d diagonal). Their behavior resembles what White calls “freeloaders”: they have the lowest occupancy rate (192.3%), but high costs (9 employees), so they charge the lowest prices on the market (22 euros) to attract customers, whose satisfaction does not seem to be very enthusiastic.
How do these restaurants perform on the App? Their scores are very high, with an average of 8.6. Paradox restaurants have a higher mean score (8.7) than Advanced restaurants (8.4). Paradox restaurants have the highest minima (7.8) and maxima (9.5), while the Advanced minimum is as low as 6.9. More Paradox restaurants receive scores of 10 (the maximum) than any other group. We use one-way analysis of variance (ANOVA) to test the null hypothesis that the means of the different groups (defined by White’s four categories) are the same. The resulting p-value is less than the significance level 0.05, rejecting the null hypothesis and implying that there are statistically significant differences between groups. To find which pairs of groups differ, we use the Tukey Honest Significant Differences (Tukey HSD) test, which takes the fitted ANOVA as an argument, to perform multiple pairwise comparisons between the means of groups. It indicates that only the Paradox-Advanced difference is statistically significant at the 5% level.
In terms of number of reviews received through the App, Paradox restaurants have the highest mean (560.76), while Failure ones have the highest median (365). In all groups, the median is lower than the mean because of the presence of outliers.
Let us now examine how restaurants present themselves. Regarding cuisine, French restaurants constitute over half of the population and are the most common in all categories. However, Paradox restaurants offering French cuisine are relatively more numerous and those offering non-European cuisine are slightly less numerous. Ordinary restaurants are more likely to offer regional cuisine and to use non-geographical labels (“traditional cuisine”, “cuisine du marché”). Advanced restaurants are slightly more likely to advertise non-European cuisine.
The 105 restaurants use a total of 54 unique tags; each uses between 2 and 14, with an average of 5.7. In their choice of tags, Paradox restaurants showcase evidence of quality (“Best of”, “Certificate of Excellence Trip Advisor”, “best rated”, “gastronomic” or “gourmet”) and use classical qualifications (“Bistrot”, “Brasserie”, “Romantic”). Advanced restaurants insist on location (“Old Town”), uses (“together with friends”), and refer to themselves as “Trendy”. They also use the word “bistronomic”, a fashionable contraction of “bistrot” and “gastronomic”, and praise their wine lists. More than half of Failure restaurants call themselves “Trendy”, cater to families and highlight their location in the Old Town. Interestingly, they stand out for their offer of burgers and tapas, but they also cater to healthier and more sophisticated food choices (“gluten-free”, “veggie”). Ordinary restaurants advertise themselves as pépite cachée (“hidden gem”) and cater to a range of demands, including business menus. The “traditional” tag is popular across groups, and all restaurants have special offers for Valentine’s Day.
Results: platform effects on amplification, normalization and stability
Our conjecture that platforms enhance eye’s-length observation with digital glasses can be broken down and explored in three steps. The very functioning of digital booking-and-reviewing platforms supports the above-outlined idea of amplification, whereby digital platforms enable observation of competitors beyond one’s immediate spatial vicinity, while also widening the range of observable characteristics. We use qualitative fieldwork data to give more substance to this initial suggestion, seeking to confirm that mutual observation of competitors does take place, to give a concrete sense of how actors use the platform, and to offer preliminary insights into the micro-level social mechanisms that sustain this process. In line with the sequential mixed method design, our analysis remains broad and exploratory at this stage, to uncover the varying modes, forms and meanings of platform adoption, without any hypothesis testing, strictly speaking. Rather, its results inform the quantitative analyses that follow.
We then set out to prove normalization, aiming to assess the extent to which platforms frame and shape the identity of firms by standardizing their practices and shrinking differences between perceived competitors. To do so, we use a model that links restaurant similarity, measured along the lines of White’s typology and revisited through convention theory, with explanatory variables that account for platform usage, holding constant other factors, such as geographical distance.
Finally, we establish stability, the extent to which restaurants’ use of the platform remains the same over time, conditional on their volume and quality choices. The aim is to ascertain how platforms facilitate the process through which firms observing their competitors “act on the basis of these observations, thereby reproducing the observations” [White Reference White1981: 520–521]. For this purpose, we use dated records of restaurants’ activity and model the association between platform usage at different points in time, firm characteristics in accordance with White’s interface, and quality conventions.
Narratives of amplification
The theme of mutual observation between peers, with or without digital devices, emerges forcefully from the qualitative fieldwork. At the event organized by the App, we noted that all attendees compared their practices with one another. Interviews confirm that restaurateurs routinely seek to identify their “direct” competitors:
That’s my direct competitors. [restaurant name] I think they use the platform. (Itw2)
It quickly became clear that platforms are used as tools for mutual observation, replacing more traditional word-of-mouth:
Before, we used to say: it’s word of mouth, yeah. Well, no, now it’s the opinions of internet users. (Itw2)
This supports our metaphor of the platform as a tool that augments eye’s length observation with “digital glasses” that extend a company’s view beyond its traditional limitations. The platform reveals customer (dis)satisfaction and makes it possible to identify similar restaurants:
I look at restaurants of the same type as us, that serve appetizers, amuse-bouches, several menus with several dishes. And that’s where I see what people say, if they liked the offer, if they were happy. (Itw1)
These digital glasses extend the geographical area of reference: if a restaurant’s closest neighbors are positioned in incommensurable market segments (for example, by type of cuisine or price level), it is now easier to refer to similar restaurants located further away. Restaurateurs can extend their gaze beyond “the street” to reach out to “the city”. Asked whether they look at their competitors’ reviews, one respondent said:
Yeah, a lot, all those in this street, in the city and… also the restaurants… the ones that are ranked highest, you know. […] I look at the comments, what people liked, what they didn’t like. (Itw1)
Through their competitors, restaurateurs identify their position in the quality range:
The competitors, it’s all the people who do the same, the same kind of, of food as us… bistronomy… the same price ranges. (Itw5)
While restaurateurs do not necessarily have in mind the whole meso-level market structure as in White’s model, they demonstrate clear awareness of the specificity of the niche in which they position themselves:
What we offer … at fifteen euros for a starter/main course or main course/dessert, with a slow-cooked dish, three side dishes, no one else is offering this in the neighborhood. (Itw3)
The Failure region is nevertheless visible to them, sometimes by comparison with the viable region:
[It] is a bit of a jungle. Many restaurants open and close very quickly, some have been around for a long time, others not so long (Itw 5).
Sometimes, restaurateurs pride themselves on what people say about them:
We’ve had only good comments, only good comments, that’s it. So, afterwards, there were other restaurants in the vicinity, and we made fun of them, because we have a little bistro and… you have a nice restaurant and… [we have better comments]. (Itw3)
Customers’ ratings matter:
That’s good when you’re well rated, when you’re… well, it brings people in. After that… you mustn’t make any mistakes… (Itw2)
Interviewees use diverse strategies to take advantage of the information they gather from the platform. Interviewee 13 admitted that, in addition to his professional account on the App, he also has a customer profile that he uses to look at his competitors “more easily”. Others note that platform use has become a necessity:
The guy next door never used apps, and he’s had to close the restaurant. (Itw6)
These qualitative data lend support to the idea that digital platforms enhance mutual observation between competitors. Producers can now watch their peers more discreetly (without being seen), more panoptically (the whole market), and more comprehensively (a larger number of features, especially quality in addition to volume/price indicators). But what are the effects of these digital glasses on restaurants’ relative positioning in this market, notably in terms of their volume and quality choices? To answer this question, we need to switch to quantitative data.
A model of normalization
We now have all the elements we need to assess the extent to which mutual observation leads to normalization, that is, the diffusion of practices and choices that tend to make competing restaurants more similar in terms of quality conventions. This does not necessarily mean full homogenization but rather a balanced positioning of each restaurant in the market, between the micro level (quality niche) and the aggregate level (White’s market types, or quality conventions). This substantive interest in the extent to which pairs of restaurants behave similarly requires a measure of similarity that represents the mutual positions of a pair of firms, instead of an analysis of individual firm units. We therefore model our data as dyadic, in which each unit of analysis is a pair ij, with i and j being two different restaurants. According to Mizruchi and Marquis [Reference Mizruchi and Marquis2005], this approach is ideal in situations in which the dependent variable is quantitative, and predictors account for dependencies between individual units (here, restaurants), highlighting their shared characteristics and relative positions as potential reasons for similarity. In the past few decades, statistical research has developed techniques that account for dependencies in dyads [Krackhardt Reference Krackardt1988].
The dependent variable Yij is derived from the interface structure itself and computed as the Euclidian distance (numeric) between two points (restaurants) i and j with coordinates (ai/ci; bi/di) and (aj/cj; bj/dj), where for each restaurant, a/c and b/d are the standardized volume and quality parameters of the White model. Smaller distances correspond to points that are closer to each other in the two-axis plane. The independent variables are twofold, both geographic to control for the effect of co-location, and platform-related to measure changes prompted by this new tool of observation between competitors:
X1ij = Haversine geographic distance (numeric), defined as the great-circle distance (along the surface of the spherical Earth, or “as the crow flies”) between two points (restaurants) of given longitude and latitude. Smaller distances correspond to geographically closer restaurants.
X2ij = Score difference (numeric): absolute difference between the App’s average overall scores of restaurants i and j, where smaller differences correspond to similarly rated restaurants.
X3ij = Number of reviews difference (integer): absolute difference between number of the App reviews of restaurants i and j, where smaller differences correspond to restaurants that have received similar numbers of reviews (that is, presumably with similar numbers of App-using customers).
X4ij = Same cuisine (binary): equal to 1 if restaurants i and j offer the same cuisine (for example, “French”), 0 otherwise. Information is taken from restaurants’ pages on the App and is therefore self-declared.
X5ij = Tag distance (numeric): Euclidian distance between restaurants i and j based on their use of tags (such as: “Certificate of Excellence Trip Advisor” or “Brasserie”) on their App online page. Technically, each tag is taken as a feature, a restaurants-features matrix is built, and a distance between restaurants i and j is computed from this matrix, based on the features that they share or do not share.
X6ij = Description distance (numeric): Euclidian distance between restaurants i and j based on the free self-description they post on the App. Each description consists of one or two paragraphs, which we have segmented into “tokens” (of single or compound words). Then a restaurants-by-tokens (features) matrix is built and the distance between restaurants i and j is computed based on the features that they share or do not share.
Other variables already used in the construction of White’s model (such as price and number of services) enter the computation of Y and have thus been omitted to avoid multicollinearity. In summary, this model aims to assess the extent to which geographical factors vs. the functioning of the platform are good predictors of the positions of restaurants in the White diagram.
To estimate the model, we use the MRQAP linear regression approach [Krackhardt Reference Krackardt1987, Reference Krackardt1988; Dekker, Krackhardt and Snijders Reference Dekker, Krackhardt and Tom2003, Reference Dekker, Krackhardt and Tom2007], which predicts a (dyadic) variable based on the similarities, differences and relationships involving the two actors in each dyad.Footnote 8 We estimate the model in R (package sna), with 5,000 iterations, modelling the graph as undirected and excluding the diagonal. Table 3 presents the results.
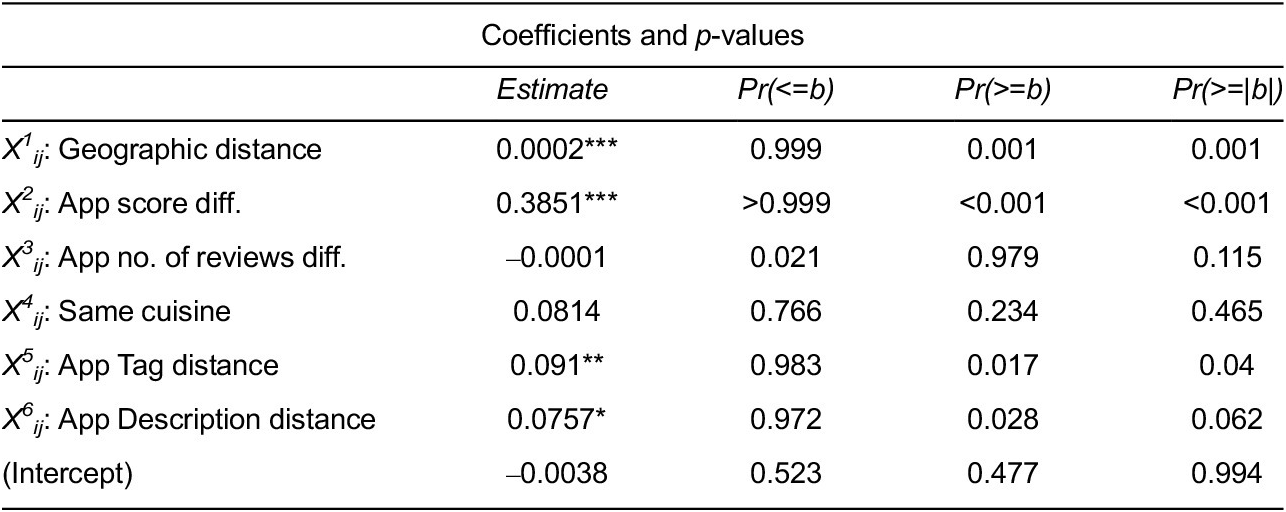
Table 3 MRQAP results

Note: The dependent variable is Yij, distance of restaurants i and j on White plane. N = 5460 (corresponding to all the possible dyads formed between 105 restaurants). Interpretation: A one-point difference in the overall App score (second row) increases the distance of restaurants i and j on the White plane by 0.3851 (second column). Because the corresponding p-value (last column) is lower than the reference threshold of 0.01, we reject the hypothesis that the score difference has no effect. Significance codes: 0.01 ‘***’, 0.05 ‘**’, 0.1 ‘*’.
Source: Author’s elaboration.
Table 3 indicates that geographical distance (X 1) is statistically significant at the 1% level. The positive coefficient means that two geographically distant restaurants will have a larger distance in the White diagram, that is, they will have more divergent a/c and/or b/d values, which probably corresponds to different quality conventions. Conversely, two closely located restaurants will tend also to be closer in the plot. But the important result here is that, regardless of physical location, similarity in platform use also predicts smaller distances in White’s diagram. To begin with, distance in the choice of the App tags is significant at the 5% level, and distance in the App descriptions at the 10% level: restaurants that describe themselves more similarly online, whether by using pre-defined tags or free text, will be more similar in the sense of White’s volume and quality measures. While both tags and self-descriptions result from restaurateurs’ own actions, differences in the overall score computed by the App based on customer ratings, and the number of these ratings, are aggregate measures of diners’ reactions to their offer. Overall score is significant at the 1% level, and positive, meaning that restaurants with similar ratings will also have similar quality and volume indicators. The relevance of this specific result aligns with White’s idea that “quality is in the eye of the beholder” [1981: 522], acknowledging that customers validate—or not—producers’ choices, with repercussions for them [Aspers Reference Aspers2012]. Online review platforms allow competitors to closely observe each other’s customer feedback, which serves as an indirect quality indicator and encourages them to make more similar decisions.
Technically, this statistical result is static, but it should be interpreted as the outcome of an underlying dynamic process, whereby producers that make similar use of the App (and those in the same geographical area) observe and imitate one another. Online proximities that signal mutual observation bring competitors closer together in terms of the quality convention they adopt.
The results presented so far suggest that as the platform changes the scale and scope of restaurateurs’ practices, the process through which actors position themselves in White’s market structure, in which they get closer to their perceived competitors and adopt similar quality conventions, becomes more efficient. Outliers that refuse to play this game may be at risk—like the abovementioned neighbor who refused to use digital devices and eventually “closed their restaurant”. To what extent is platform use consistent with restaurants’ volume and quality choices, and how likely is it to continue over time? To see this, we should turn to a model that maps restaurants’ longer-run outcomes to platform use, controlling for geographic location.
Mapping firms’ longer-term outcomes to platform use
From a longer term perspective, we examine which variables may be correlated with restaurants’ trajectory over the two and a half years following our original data collection. We use factor analysis of mixed data (FAMD), a method that combines principal component analysis (PCA) for continuous variables and multiple correspondence analysis (MCA) for categorical variables. This time, the unit of analysis is the individual restaurant, not the dyad. For each of the 105 restaurants in the dataset, we take geographic location (mean geographical distance of a restaurant from all other restaurants, measured with the Haversine method, numeric), type of cuisine (to simplify, French vs. non-French, binary), App-related indicators (average score, numeric, and number of reviews, integer), and coordinates in the White model plan (volume a/c and quality b/d, both numeric). As a supplementary variable, we take restaurants’ status in February 2020, using three categories: closed; open but no longer bookable through the App; open and bookable through the App. A supplementary variable has no influence on the outcome of an FAMD analysis but can be projected on the factorial plan to visualize its relationship with the set of active variables: it can be seen as a sort of response variable. If, two and a half years after our first observation, a restaurant is still open and bookable through the App, its quality, volume and platform-use choices prove to be consistent, and it forms part of “a historically shaped structure of roles among a stable set of producer firms” [White Reference White1981: 526]. While it may have gone through temporary changes between the two dates, its return to its initial choices confirms their validity. Restaurants that are still open, but not bookable through the platform, have had to make some changes to stay afloat. Their use of the platform was not entirely consistent with their quality and volume choices. Of course, leaving the platform does not necessarily signal a negative outcome: restaurants can exit “from the top”, continuing their activity with different tools. Closed restaurants are those that faced the most challenging inconsistencies and could not survive. These cases are more frequent in the Advanced region, affecting slightly more than one in six restaurants, compared with one in twenty in the Paradox region.
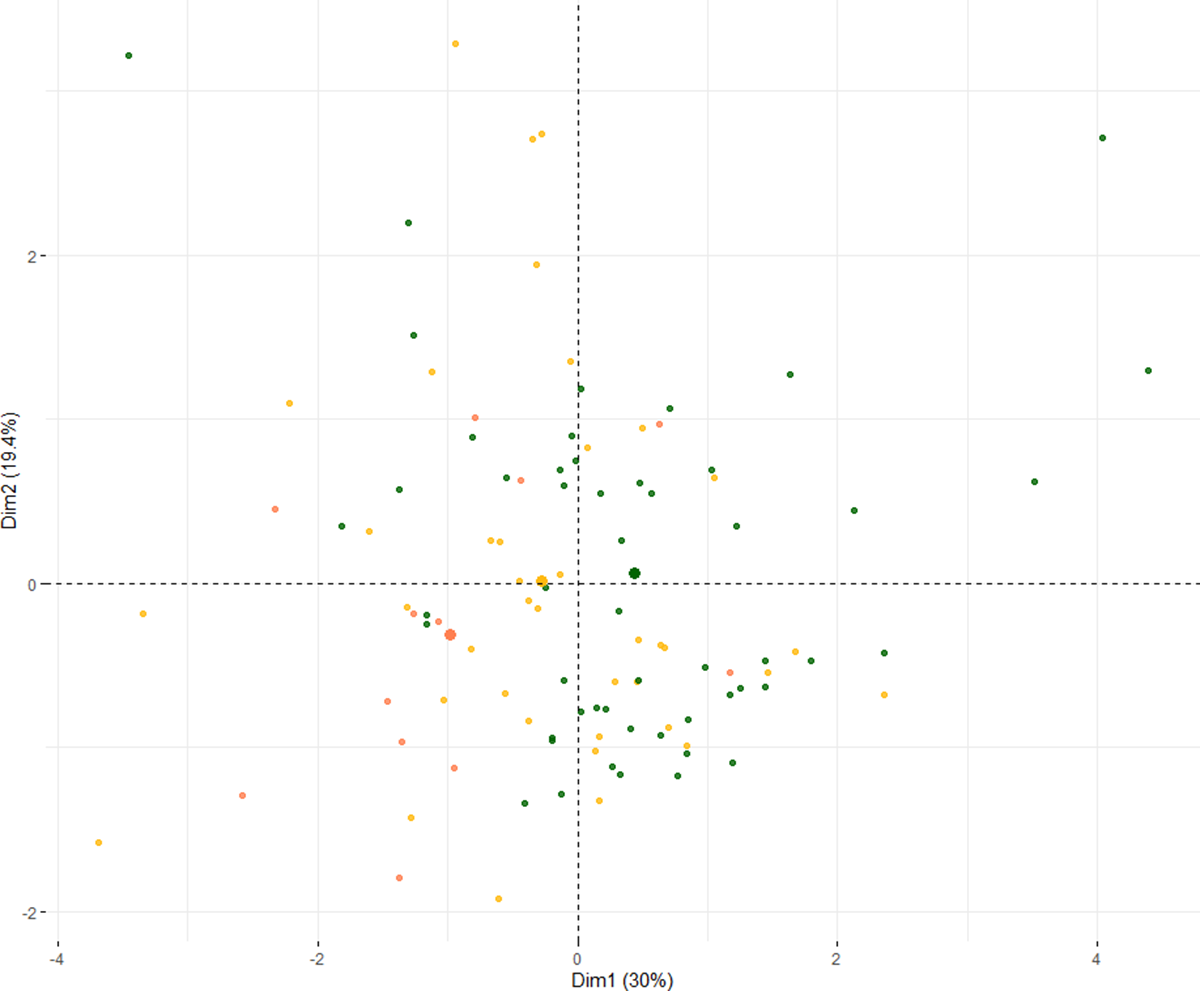
Figure 2 shows a projection of restaurants’ status in February 2020 on the factorial plane. The first two factorial axes explain 49.4% of the variance. The first axis is closely related to White’s model and mainly separates restaurants oriented toward quality, as measured by the b/d ratio (right side of the plot), from those oriented toward volume, a/c (left side). The average rating on the App is generally higher for quality-oriented restaurants on the right side. The second axis distinguishes restaurants by their mean geographical distance from all others, with more distant (peripheral) restaurants in the top half of the diagram. French cuisine is associated with smaller distances (bottom quadrants). Most restaurants that continued to operate in early 2020 and could still be booked via the platform are in the right quadrants (higher quality as in White’s model, higher average score on the App). Almost all closed restaurants are on the left, mostly at the bottom (more geographically central and more focused on volume in White’s sense). Those still in business, but which no longer take reservations via the App, are slightly more numerous on the left, though many are also in the right-bottom quadrant. Overall, these results suggest that more peripheral restaurants that emphasize quality rather than volume, and that receive high ratings from customers, tend to maintain the same business model over time, including prolonged use of the App. Speculatively, this suggests that the platform-enabled “digital glasses” offset the potentially penalizing effects of greater geographical distance for quality-oriented restaurants. In contrast, use of the platform does not suffice to counterbalance arguably tight neighborhood-level competition among centrally located restaurants that focus more on volume, so that many of them eventually cease their activity. The restaurants that are still open but have abandoned the App have changed their operating mode, at least in part, suggesting that their earlier use of the platform did not bring stability. Summarizing, the digital glasses offered by the platform augment restaurants’ stability over time, but conditional on their volume/quality choices (that is, the quality convention they adhere to) and their geographic location.

Figure 2 Factorial analysis of mixed data for Lille restaurants
Note: Graph of individuals as represented in FAMD analysis. Colors represent values of the supplementary variable that indicates status in early 2020. Green: open and bookable through the App; yellow: open but not bookable via the App; red: closed. N = 103 (owing to two missing cases).
Source: Author’s elaboration.
Discussion
Through White’s model, as interpreted by the economics of conventions, we have empirically described a market as the interface by means of which competitors observe one another and define their positions (that is, volume and quality strategies) accordingly. Here, digital platforms constitute a means for a restaurant to make itself visible to customers (who subjectively assess the quality of a product or service) and to competing firms. Aggregated consumers are the mirror through which competitors see one another, and the whole process contributes to the definition of quality conventions. This perspective illuminates the role of online platforms in shaping markets. Against views of the rise of platforms as a “revolution” we see no evidence that they “took the friction out of restaurant reservations” [Evans and Schmalensee Reference Evans and Schmalensee2016]: not one of our interviewees ever worried about empty tables, and some even limited the number of seats they offered through the App in order to save space for diners who might prefer to book by phone or who simply turned up at the restaurant. The capacity of online platforms to better match consumers and producers may be contingent on setting and have less general validity than is often claimed. By offering an alternative explanation of what platforms provide to producers, our work aligns with a more critical literature that recognizes the novelty of this new intermediation technology, without overstating its benefits [Srnicek Reference Srnicek2017].
We have highlighted an amplification effect, whereby technology extends competitor observation to wider vicinities and offers a view not only of volume, but also of quality, as reflected in online reviews and ratings. By providing valuable information backed by algorithmic techniques and large volumes of data, the platform-provided “digital glasses” allow restaurants to see “like a market” [Fourcade and Hiely Reference Fourcade and Healy2017]. Through reviews, they perform a perhaps more effective connecting function—not so much between a restaurant and its clients, but more importantly, between a restaurant and its competitors’ clients. On this basis, we have also revealed a normalization effect, as platform use induces firms to standardize their offers and become more similar, without producing complete homogenization but rather maintaining differences, notably between quality conventions. Finally, we have shown that continuing platform use over time depends on type of quality convention and geographical position. Excluding cases of business closure, the sizeable number of restaurants that exit the platform can be partly a response to overwhelming platform power [Cutolo and Kenney, Reference Cutolo and Kenney2021] if it interferes with the chosen quality convention. Overall, and conditional on the interplay of multiple variables, these processes point to a broader rationalization process, whereby digital platforms allow competitors to observe each other more systematically, more comprehensively and more efficiently. We share the view of van Dijck, Poell, and de Waal [Reference Van Dijck, Poell and de Waal2018: 2] that platforms “do not cause a revolution;” rather, they constitute devices (“digital glasses”) that reshape and improve existing practices (“eye’s length observation”).
These results challenge the common view of digital platforms, which in markets, have been framed overwhelmingly as matchmakers that enable supply to find its own demand and vice versa. By overemphasizing intermediation, this literature may have obscured other, and more subtle, effects of platforms. But just as markets can be framed as producers’ markets rather than as symmetric encounters between supply and demand, the function of platforms as instruments for market organization does not have to be matching. Our study shows that platforms can play diverse and potentially unbalanced roles on a single side of the market, without necessarily striving toward a perfectly competitive supply-demand equilibrium. We uncover effects that concern only the producer side, and are distinct from those that arise from intermediation, and from those that pertain to the demand side. With these results, we contribute to addressing the gap highlighted by Haidar [Reference Haidar2024] according to whom the relationship between platforms and businesses (in this case, restaurants) has remained under-researched. The broader implication for the sociological analysis of markets is that three perspectives can be taken: the construction of demand, the mediation of supply and demand, and the coordination of supply.
Our analysis also confirms the empirical validity of Harrison White’s model and extends its applicability to originally unforeseen conditions. Designed for settings in which, as discussed earlier, firms could “observe only volumes and payments, not qualities or their valuations”, White’s producer market model still holds when platforms lift the veil on these qualities through their online review systems. Its core insights are therefore independent of the state of technology and are robust to platform-enabled empowerment of consumers.
This study has limitations. First, we have examined a platform that provides a reservation system for dine-in services only, together with an online review system. There is scope to extend the analysis to platforms offering delivery services, which have mushroomed in recent years. Haidar [Reference Haidar2024] shows that they subject restaurants to permanent and constant monitoring, induce them to follow certain behaviors, and penalize them, often arbitrarily. There is a need to better understand how these different types of platforms jointly affect market structure.
We do not explicitly examine the effects of algorithmic management [Stark and Pais Reference Stark and Pais2020]. Ratings and reviews are the result not only of consumers’ opinions and choices, but also of the way the platform chooses to aggregate, compare and disclose them. We have already mentioned the removal of restaurants with average ratings below a given threshold, and the fact that not all existing written comments are shown on a restaurant’s page. Additionally, several interviewees made educated guesses with regard to how the platform’s internal search engine ordered its results after a customer’s query: for example, many thought it gave prominence to the restaurants that offered discounts, thereby creating a strong incentive for all of them to do so—although discounts are costly for restaurants and incentivize strategic choices that favor volume instead of quality. Although we cannot verify such claims empirically, we recognize that the platform exercises asymmetric power, actively shaping the market by imposing operational norms that differ from White’s model. Far from being neutral, it uses data and algorithms—in particular, though not exclusively, through its online review system—to steer restaurants toward behaviors that are functional to its business success. As an ever-present market-maker, it deploys technologies and imposes rules that mold inter-firm competition.
Finally, this paper exemplifies the limitations of relying on platforms to objectify markets and map out their structures [Ollion and Boelaert Reference Ollion and Boelaert2015]. If consumers and producers use digital platforms as sources of information, we as researchers do the same—in our case, with web-scraping techniques that, we hoped, could provide a window into consumer and producer behaviors in the Lille restaurant industry. But, as mentioned earlier, we would have conducted a much poorer analysis if we had used web scraping alone. The variables we collected in this way were not sufficient to build White’s model, or to find an indicator of the trajectory of restaurants over time. Thus, we had to complete the database through multiple other sources, including by hand. The metaphorical digital glasses worn not only by the restaurant owners, but also by us as researchers, do not perfectly detail the life of restaurants—that is, devices do not work alone. In part, this is because our research goals are not always aligned with those of platforms—which do not necessarily need, say, precise information about a restaurant’s volume or quality-related costs to make it bookable on their pages. But in part, it is because platforms control large amounts of data—potentially much larger than the amount they choose to display online—and much more than what they reveal to researchers. Their algorithms are trade secrets that are not ordinarily disclosed. While this is broadly true of any company, it is more worrying in the case of online platforms, which have a strong impact on manifold stakeholders.
Several avenues can be taken in pursuit of our reflection. Longitudinal studies may capture progressive changes at the level of both markets and firms’ individual strategies. Additionally, given the spread of platforms to all industries (bookstores, household appliances, etc.), comparisons could help to assess the differential effects of platforms across sectors. Overall, we believe in the importance of using digital platforms—both substantively and methodologically—to bring together valuation studies, theories of the social construction of the market, and convention theory to shed new light on the effects of digital technologies on market interactions and structures.
Acknowledgements
We benefited from funding from Mission pour les Initiatives Transverses et Interdisciplinaires (MITI) of the National Centre for Scientific Research (CNRS) in 2017-18 and from the IRISSO research center in social sciences at Paris Dauphine PSL university in 2019.
We thank Philippe Caillou, Antonio Casilli, and Julian Posada for their important contribution to data collection design and implementation, and to preliminary analyses. A draft of this paper was presented at the Networks2021 online conference, and we thank the attendees for their valuable feedback.
Any remaining errors or inconsistencies are exclusively ours.
Declaration of interest statement
Authors have no interest in the publication of this research.
Ethics
At the time of data collection, there were no ethics committees at the authors’ respective institutions. Nevertheless, the data were collected in compliance with personal data protection regulations. The then applicable French law (‘Loi Informatique et Liberté’ of 6 January 1978) required a declaration to the data protection authority, CNIL. The web-scraped data and the business data acquired externally were collected at company level and do not include personal information.

 Open access