

Appendix B Supplementary Interview Methods
Our study is based on 157 anonymous, semi-structured interviews conducted with members of environmental and social agencies across six countries: Denmark (24), Germany (38), Ireland (28), Italy (40), Portugal (15), and the UK (12). >Appendix C provides a detailed breakdown of interviews by country, sector, and organization. This section of the Appendix A offers additional insights into our data collection process, including our sampling approach, interview methodology, and the coding procedure used to analyze responses (following Bleich and Pekkanen, 2013).
To ensure ethical research standards, we obtained informed and voluntary consent from all interviewees. Their statements have been fully anonymized in accordance with data protection guidelines, as detailed in the following sections. The entire interview process was reviewed and approved by a relevant ethical board, ensuring compliance with best practices in research ethics.
A.1 Sampling Process
Our sampling strategy was purposive and guided by theoretical considerations. In each country, we targeted members of central environmental and social agencies involved in policy implementation. The sample frame included individuals whose contact details were publicly available online.
To recruit interviewees, we initially reached out via email. If no response was received, we followed up with a friendly reminder two weeks later or attempted contact by phone. The interviews were conducted remotely via phone or Zoom between April 21, 2021, and August 1, 2023. The duration of the interviews varied between 25 and 125 minutes, with an average length of approximately 50 minutes.
We conducted anonymous interviews for both research and ethical reasons. First, discussing triage and prioritization practices in the face of high implementation burdens is a sensitive topic for implementers. These practices often run counter to their professional ethos and may imply that, to some extent, they have “failed” to fully implement policies as intended. Ensuring anonymity increased the likelihood that interviewees would speak candidly about the difficult decisions they face.
Second, we anticipated that political principals could potentially use interview findings to target and blame specific individuals who admitted to being unable to meet the full expectations of their roles. This concern was validated during the interview process, as several participants sought additional reassurances that their statements would remain anonymous before proceeding. To further protect interviewees, we opted against providing full transcripts, as these could facilitate their identification.
We contacted potential interviewees via email, inviting them to participate in a study on “Policy Implementation in the European Union.” By framing the study in broad and neutral terms, we aimed to minimize self-selection bias. Had we explicitly stated that our research focused on the impact of increased workloads on policy implementation, it is likely that respondents who were particularly affected by this issue would have been more inclined to participate, skewing our sample.
At the same time, we ensured that our approach remained ethically sound, as our description was not misleading. The relationship between workload and implementation effectiveness is naturally encompassed within the broader theme of policy implementation in the European Union (EU), aligning with how respondents themselves might perceive their roles and challenges. This strategy allowed us to maintain methodological rigor while respecting ethical considerations in participant recruitment.
A.2 Interview Strategy
We conducted the interviews via telephone or video conference and recorded them, with the recordings securely stored on a protected university server. To ensure that interviewees felt comfortable and willing to share candid insights, we assured them of their anonymity before the interview. This approach was intended to foster openness, particularly when discussing potentially sensitive topics.
At the start of each interview, we introduced the study in broad terms to avoid priming respondents or steering their responses in a particular direction. Our initial questions were deliberately open-ended, allowing interviewees to describe their working conditions and challenges from their own perspective. More sensitive topics – such as coping mechanisms employed to manage excessive workloads – were introduced later in the conversation, after interviewees had become more comfortable. This sequencing helped build rapport and encouraged more forthright discussions on difficult aspects of their roles.
The open-ended questions we asked included the following:
– What are your specific responsibilities within the organization?
– What is your professional background? Is that a common background for your organization?
– How long have you been working in the organization?
– Did or do you face increases in your workload?
– Where is this workload coming from?
– When did you face the steepest increases of workload?
– Can you give concrete examples of such increases?
– How do you (try to) cope with them?
– Do you think that these coping practices influence (your agency’s) goal attainment?
A.3 Coding Procedure and Coding Results
Seven researchers independently coded the interviews to ensure reliability and consistency. In cases where notable discrepancies emerged in the coding results, the researchers revisited the relevant interview sections to reassess their interpretations. If disagreements persisted, they engaged in discussions to reach a consensus on the most appropriate coding decisions.
The interviews were coded for the following key aspects:
– Whether interviewees experience a high workload (yes/no)
– Whether workload has been increasing over time (yes/no)
– Whether they can identify periods during which the workload increased considerably (open)
– Why they think workload has increased (open)
– How they try to cope with the increased workload (open)
– Whether they prioritize tasks (yes/no; open)
– Which logic they use to prioritize different tasks
– Whether increased workload affects policy implementation and, by extension, goal attainment (yes/no; open)
– Which factors helped them to effectively implement a policy (open)
– Additional comments that illuminate the research situation
Table A1 reports additional interview details using the COREQ criteria.
Consolidated criteria for reporting qualitative studies (COREQFootnote [1]).
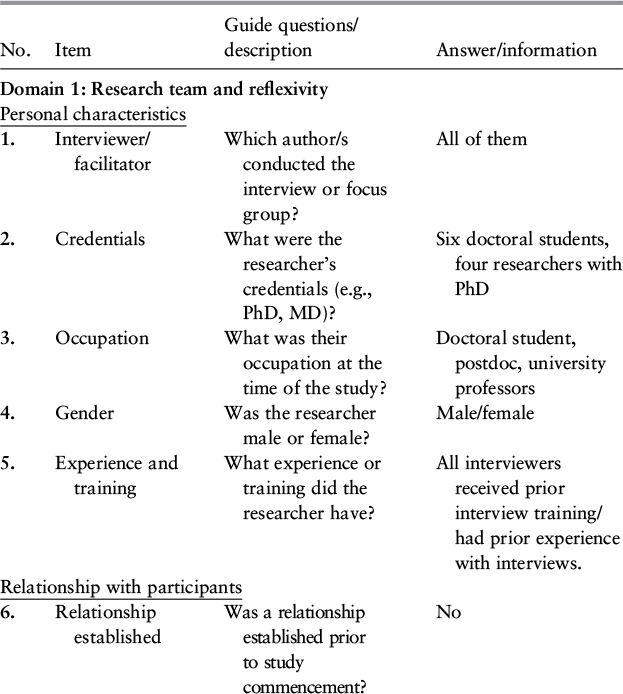
Table A1 (cont. - A)Long description
The table has four columns for number, item, guide questions or description, and answer or information. The table has three sections for domain a1, research team and reflexivity, domain 2, study design, and domain 3, analysis and findings. Domain 1 presents personal characteristics and relationship with participants. Domain 2 presents the theoretical framework, participant selection, setting, and data collection. Domain 3 presents data analysis and reporting.
The table presents data in the following order: number, item, guide questions or description, and answer or information.
Domain 1: Research team and reflexivity.
Personal characteristics:
Row 1: 1. Interviewer or facilitator. Which authors conducted the interview or focus group? All of them.
Row 2: 2. Credentials. What were the researcher’s credentials, example. P h D, M D? 6 doctoral student, 4 researchers with P h D.
Row 3: 3. Occupation. What was their occupation at the time of the study? Doctoral student, post-doc, university professors.
Row 4: 4. Gender. Was the researcher male or female? Male or female.
Row 5: 5. Experience and training. What experience or training did the researcher have? All interviewers received prior interview training or had prior experience with interviews.
Relationship with participants:
Row 6: 6. Relationship established. Was a relationship established prior to study commencement? No.
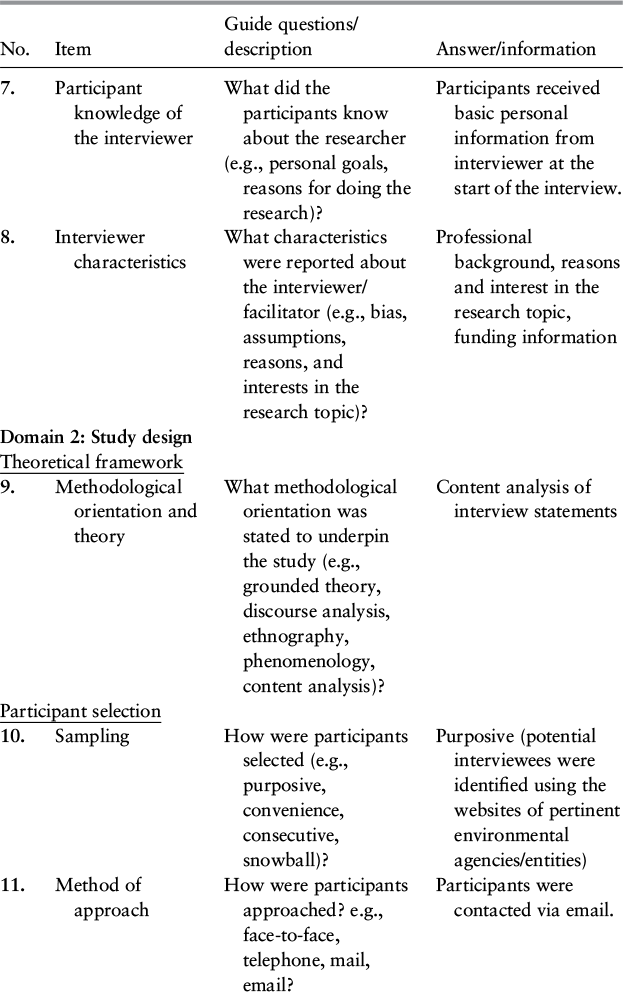
Table A1 (cont. - B)Long description
A continuation of the table. Row 7: 7. Participant knowledge of the interviewer. What did the participants know about the researcher, example, personal goals, reasons for doing the research? Participants received basic personal information from interviewer at the start of the interview.
Row 8: 8. Interviewer characteristics. What characteristics were reported about the interviewer or facilitator, example, bias, assumptions, reasons and interests in the research topic? Professional background, reasons and interest in the research topic, funding information.
Domain 2: Study design.
Theoretical framework:
Row 9: 9. Methodological orientation and theory. What methodological orientation was stated to underpin the study, example, grounded theory, discourse analysis, ethnography, phenomenology, content analysis? Content analysis of interview statements.
Participant selection:
Row 10: 10. Sampling. How were participants selected, example, purposive, convenience, consecutive, snowball? Purposive, potential interviewees were identified using the websites of pertinent environmental agencies or entities.
Row 11: 11. Method of approach. How were participants approached? Example, face-to-face, telephone, mail, email. Participants were contacted via email.
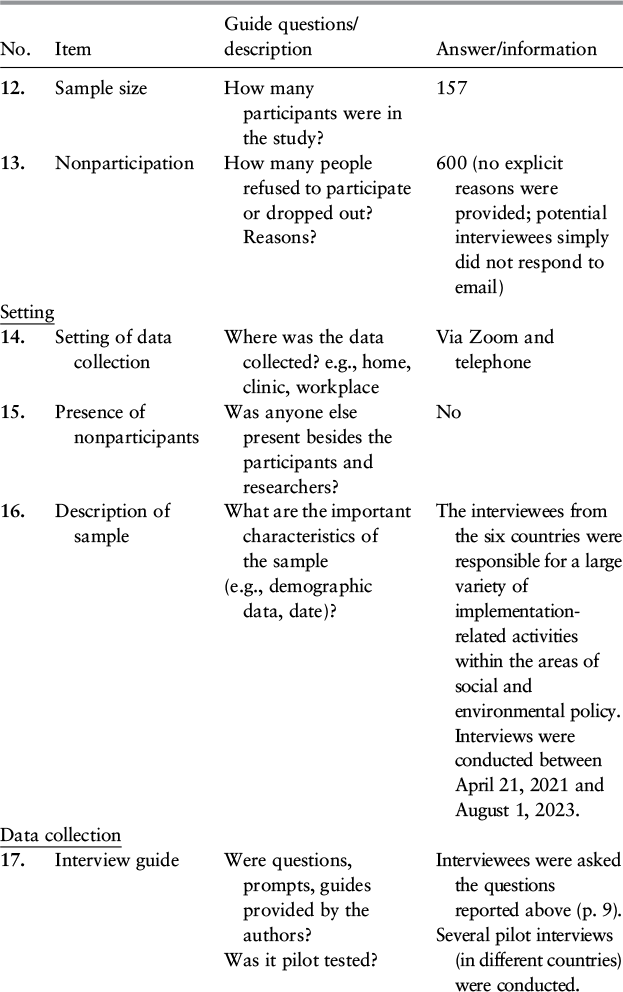
Table A1 (cont. - C)Long description
A continuation of the table. Row 12: 12. Sample size. How many participants were in the study. 157.
Row 13: 13. Non-participation. How many people refused to participate or dropped out? Reasons? 600, no explicit reasons were provided; potential interviewees simply did not respond to email.
Setting:
Row 14: 14. Setting of data collection. Where was the data collected? Example, home, clinic, workplace. Via Zoom and telephone.
Row 15: 15. Presence of non-participants. Was anyone else present besides the participants and researchers? No.
Row 16: 16. Description of sample. What are the important characteristics of the sample, example, demographic data, date? The interviewees from the six countries were responsible for a large variety of implementation-related activities within the areas of social and environmental policy. Interviews were conducted between April 21, 2021 and August 1, 2023.
Data collection:
Row 17: 17. Interview guide. Were questions, prompts, guides provided by the authors? Was it pilot tested? Interviewees were asked the questions reported above, p. 9. Several pilot interviews, in different countries, were conducted.
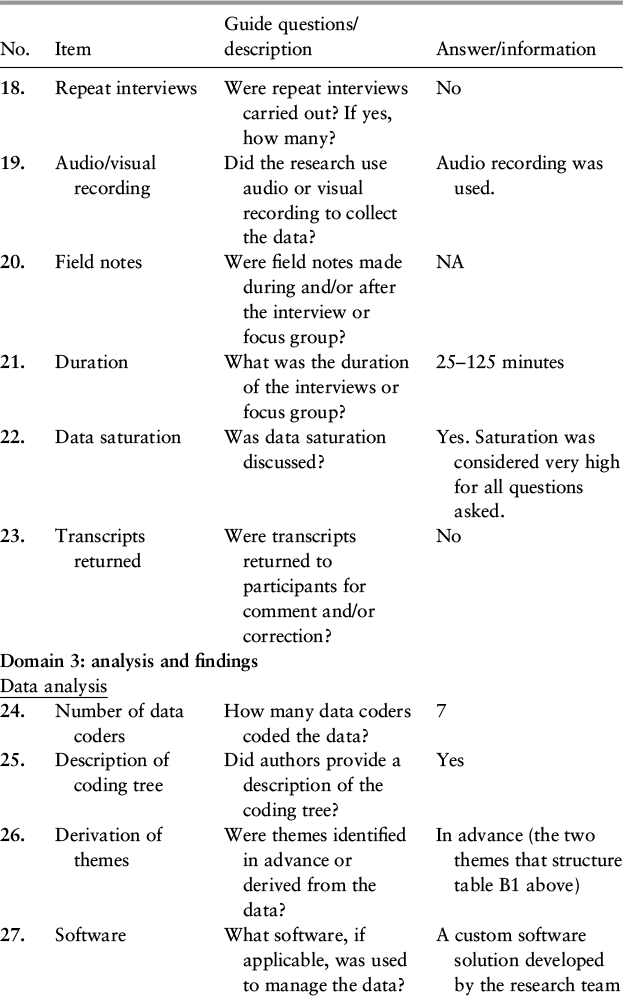
Table A1 (cont. - D)Long description
A continuation of the table. Row 18: 18. Repeat interviews. Were repeat interviews carried out? If yes, how many? No.
Row 19: 19. Audio or visual recording. Did the research use audio or visual recording to collect the data? Audio recording was used.
Row 20: 20. Field notes. Were field notes made during and, or after the interview or focus group? N A.
Row 21: 21. Duration. What was the duration of the interviews or focus group? 25 to 125 minutes.
Row 22: 22. Data saturation. Was data saturation discussed? Yes. Saturation was considered very high for all questions asked.
Row 23: 23. Transcripts returned. Were transcripts returned to participants for comment and, or correction? No.
Domain 3: Analysis and findings.
Data analysis:
Row 24: 24. Number of data coders. How many data coders coded the data? 7.
Row 25: 25. Description of coding tree. Did authors provide a description of the coding tree? Yes.
Row 26: 26. Derivation of themes. Were themes identified in advance or derived from the data? In advance, the two themes that structure table B 1 above.
Row 27: 27. Software. What software, if applicable, was used to manage the data? A custom software solution developed by the research team.
[1] Tong, Allison, Peter Sainsbury, and Jonathan Craig. 2007. “Consolidated criteria for reporting qualitative research (COREQ): A 32-item checklist for interviews and focus groups.” International Journal for Quality in Health Care 19(6), 349–357.
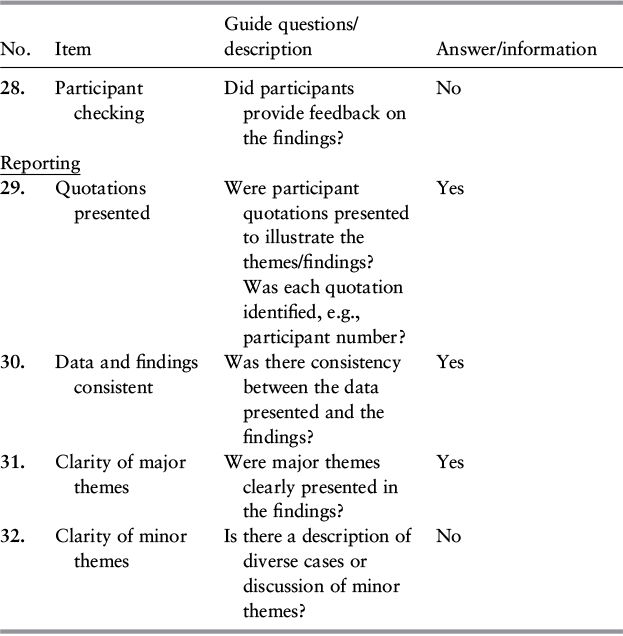
Table A1 (cont. - E)Long description
A continuation of the table. Row 28: 28. Participant checking. Did participants provide feedback on the findings? No.
Reporting:
Row 29: 29. Quotations presented. Were participant quotations presented to illustrate the themes or findings? Was each quotation identified, example, participant number? Yes.
Row 30: 30. Data and findings consistent. Was there consistency between the data presented and the findings? Yes.
Row 31: 31. Clarity of major themes. Were major themes clearly presented in the findings? Yes.
Row 32: 32. Clarity of minor themes. Is there a description of diverse cases or discussion of minor themes? No.

 Open access