There is a substantial body of literature to support the adverse effects that obesity has on health, including increased risk of developing type 2 diabetes, CVD and high blood pressure( Reference Malik, Popkin and Bray 1 , Reference Chen, Caballero and Mitchell 2 ). Higher BMI (kg/m2) values have been associated with an increased risk for certain types of cancer including oesophageal adenocarcinoma and renal cancers in men and women, thyroid and colon cancers in men, and increased risk of endometrial and gallbladder cancers in women( Reference Renehan, Tyson and Egger 3 ). Additionally, the National Cancer Institute reports links between obesity and cancers of the breast (postmenopausal), ovary and pancreas( 4 ). Health problems resulting from overweight and obesity have been connected with increasing health-care costs for all Americans, as well as increased federal and state taxes and other fiscal penalties( Reference Goldman, Michaud and Lakdawalla 5 ).
A number of lifestyle factors contribute to obesity. Lack of physical activity coupled with a diet high in fat and/or energy, especially energy-dense foods with little to no nutritional value, increase a person's risk of becoming overweight or obese( 4 , Reference Olsen and Heitman 6 – 8 ). Sugar-sweetened beverages (SSB) have been recognized in several studies as a potential contributor to becoming overweight or obese( Reference Olsen and Heitman 6 – 8 ). Soft drinks consumption in particular has been connected with increased energy intake( Reference Vartanian, Schwartz and Brownell 7 ), especially among children and adolescents. The Centers for Disease Control and Prevention (CDC) cites research stating that soft drinks accounted for 12–13 % of energy intake for adolescents aged 14–17 years during 1994–1998( 8 ). The reported relationships between SSB consumption and body weight are mixed, although this could be due in part to differences in study design( Reference Vartanian, Schwartz and Brownell 7 ). SSB intake has also been connected with decreased consumption of milk, Ca and other nutrients( Reference Vartanian, Schwartz and Brownell 7 ).
According to the CDC, SSB contribute an estimated 7 % of total energy intake for Americans( 8 ). In fact, over 60 % of US adults report daily consumption of SSB; the highest rates of consumption have been reported among racial and ethnic minorities and among persons with lower income( Reference Bleich, Wang and Wang 9 , Reference Finkelstein, Zhen and Nonnemaker 10 ). Rates of obesity have also been found to be higher among lower-income households and among racial and ethnic minorities( Reference Finkelstein, Zhen and Nonnemaker 10 , Reference Wang and Beydoun 11 ).
The CDC states that one way to curb consumption of SSB is to limit access to such beverages( 8 ). Those who have examined the effectiveness of public health intervention programmes targeted at reducing obesity have suggested that a part of eliminating access could be to impose a tax on these products, thus decreasing product demand( Reference Chan and Woo 12 ). Many states already have existing taxes on SSB, varying from state to state in the form of sales taxes on the beverages themselves or as taxes levied on distributors, manufacturers and wholesalers for syrups and packaging( Reference Jacobson and Brownell 13 ). As an example, rates of sales tax on the price of soda range, on average, from 5 % to 7·25 %, which studies have shown reduces consumption only by very modest amounts( Reference Jacobson and Brownell 13 – Reference Brownell, Farley and Willett 15 ). Other states exclude SSB from taxation along with other foods( Reference Brownell, Farley and Willett 15 ). Larger specific excise taxes on other products have proved successful in lowering demand for those products; for example, high excise taxes on cigarettes have in turn have led to many smokers to quit. Increased taxes on SSB could have a similar effect on consumer demand for these beverages( Reference Frieden 16 , Reference Andreyeva, Long and Brownell 17 ). The potential benefits of large taxes (around 20 %) on SSB include a boost in consumption of beverages that have little or no added sugar such as milk and water( Reference Brownell, Farley and Willett 15 – Reference Andreyeva, Long and Brownell 17 ); a decrease in SSB and those beverages that put individuals at risk for obesity( Reference Brownell, Farley and Willett 15 – Reference Andreyeva, Long and Brownell 17 ); and an incentive for beverage companies to create products that are less detrimental to the health of consumers( Reference Brownell, Farley and Willett 15 ). Higher SSB taxes would also serve as an opportunity for federal, state and municipal government to generate revenue to fuel health promotion and education campaigns( Reference Brownell, Farley and Willett 15 ). Such large-scale taxes on SSB have been proposed in New York and Maine, among other places, but have often been vigorously opposed by the beverage industry( Reference Brownell, Farley and Willett 15 , Reference Brownell and Frieden 18 ).
Although jurisdictions have considered taxes on SSB, there are few scholarly data available regarding the public's opinion on such taxes. One poll cites that 52 % of New Yorkers would be in favour of a large tax on SSB; a number which rose to 72 % when respondents were told that revenues from such a tax would be used to support obesity prevention programmes( Reference Brownell and Frieden 18 ). However, the literature does not show how the public would react to these proposed tax increases. To address gaps in our understanding regarding public attitude towards proposed taxes on SSB, we collected baseline data from a representative sample of adults across the USA to determine beverage consumption, knowledge about SSB and obesity, and anticipated reaction to a 20 % tax on these products. We aimed to examine the following research questions:
-
1. What are SSB consumption patterns?
-
2. What are the characteristics of those who consume SSB?
-
3. What is the public's knowledge about links between obesity and SSB consumption and certain health conditions?
-
4. What is the public's level of support for an added 20 % tax on SSB?
-
5. What is the public's anticipated reaction to such taxes?
Methods
A random-digit dialled telephone interview lasting 20 min was administered to a representative sample of 592 adults across the USA by the Survey Research and Data Acquisition Resource (SRDAR) at Roswell Park Cancer Institute. Data collection began in April 2009 and was completed in June 2010. The data were weighted to the age, race and gender distribution of the population of the USA. Because of the increasing percentage of households that have a cell phone only, we included a sample of cell phone numbers in our study. Respondents who completed the survey on a cell phone were sent a cheque for $US 10 immediately after completing the survey. The response rate was 20 % for the landline surveys and 34 % for the cell phone surveys, calculated with the American Association for Public Opinion Research response rate 4( 19 ).
Measures
Beverage consumption
Sugar-sweetened beverages. To assess levels of consumption of SSB, we asked three survey questions: (i) ‘In the past week approximately how many servings of sugar-sweetened beverages have you consumed over the entire week?’; (ii) ‘In the past week approximately how many servings of regular soda have you consumed over the entire week?’; and (iii) ‘In the past week, approximately how many servings of sweetened coffee or tea have you consumed over the entire week?’
Respondents were given a brief description of the categories of beverages that we were interested in. We asked about SSB such as Kool-Aid, Gatorade, lemonade, Hi-C, or sweetened iced tea. This also included energy drinks such as Red Bull. We defined a serving of SSB as 12 fluid ounces. A serving of soda was also defined as 12 fluid ounces, which is the amount in one can of soda. A serving of coffee was defined as 6 fluid ounces, about the size of a small coffee cup that many people would use at home.
We calculated an overall average number of SSB consumed over the past week which included each of these. We then calculated a second average of pre-packaged SSB consumed over the past week. Pre-packaged SSB include sodas and other beverages that are sweetened when purchased. We excluded sweetened coffee and tea from this group, because some people make coffee or tea at home and add sugar themselves. This presumably would not be included in any proposed taxes on SSB.
Unsweetened beverages. To assess levels of consumption of unsweetened beverages, we asked the following survey question: ‘In the past week approximately how many servings of 100 % fruit or vegetable juice have you consumed over the entire week?’ The same question format was repeated to ask about diet soda, milk (2 %, 1 %, skimmed and soya milk), unsweetened coffee or tea, tap water and bottled water.
Respondents were given a brief description of the categories of beverages that we were interested in. We asked about 100 % fruit or vegetable juice with no sugar added, such as orange and grapefruit juice, or V8 vegetable juice. We define a serving of 100 % fruit of vegetable juice as a half a cup, or 4 fluid ounces, and asked respondents not to count drinks such as Kool-Aid, Gatorade, cranberry juice cocktail or fruit punch. We asked about diet soda, and drinks made with artificial sweeteners such as sugar-free Red Bull and Crystal Light. A serving was defined as 12 fluid ounces, which is the amount in one can of soda. The number of drinks was recorded for each of the questions. We calculated an overall average number of unsweetened beverages consumed over the past week which included each of these.
Alcohol. We defined a drink of alcohol as one can or bottle of beer, one glass of wine, one can or bottle of wine cooler, one cocktail or one shot of liquor. Frequency of drinking alcoholic beverages was measured with the question: ‘In the past week, approximately how many alcoholic beverages have you consumed over the entire week?’ The number of drinks was recorded.
Knowledge and attitudes
To assess levels of knowledge about the health effects of obesity and soda consumption, respondents were asked whether each of the following statements was true or false, ‘Frequent consumption of sweetened soft drinks increases the risk of…’: ‘…obesity’ (true or false), ‘…diabetes’ (true or false), ‘…cavities among children’ (true or false). Respondents were also asked to tell whether they thought obesity is related to: ‘Diabetes’ (yes or no), ‘Heart disease’ (yes or no), ‘Asthma’ (yes or no), ‘Hypertension’ (yes or no) and ‘Cancer’ (yes or no).
To assess attitudes about taxing SSB, respondents were asked, ‘What would you do if your state began collecting a 20 % tax on regular soda and sugar sweetened beverages?’ Response choices were: ‘No impact at all’; ‘I'd switch to untaxed drinks, like diet soda, fruit juice, water, or milk’; ‘I'd cut back on my soda and sweetened beverage consumption’. We also asked, ‘Do you support or oppose a tax on regular soda and sweetened fruit drinks?’ Response choices were: ‘Strongly support’; ‘Support’; ‘Oppose’; ‘Strongly oppose’.
Other covariates
Demographic covariates included sex (male v. female), age in years (18–24 v. 25–44 v. 45–64 v. 65+), race/ethnicity (white, black, Hispanic, other), income (<$US 17 500, $US 17 501–40 000, $US 40 001–65 000, >$US 65 000), education (less than 12 years, high-school graduate or GED (General Educational Development), some college, college graduate or more) and BMI (underweight, healthy weight, overweight, obese). Respondents were asked for their height and weight, which were used to calculate an estimated BMI (since under-reporting is likely)( Reference Bingham, Gill and Welch 20 ); a BMI of <18·5 kg/m2 is underweight, 18·5–24·9 kg/m2 is considered a healthy weight, 25·0–29·9 kg/m2 is overweight and ≥30·0 kg/m2 is obese.
Statistical analysis
Statistical analyses were conducted using the SPSS statistical software package version 14·0 (SPSS Inc., Chicago, IL, USA). Descriptive statistics were conducted for measures of beverage consumption and measures of support for a 20 % tax on SSB. Logistic regression analyses were used to examine the correlates of drinking SSB while controlling for the covariates. We also used logistic regression to examine the association between SSB consumption and knowledge about the health effects of SSB and the health effects of obesity, as well as the association between demographic measures and support for a 20 % tax on SSB. Analysis results were weighted to the demographics of the population within the USA.
Results
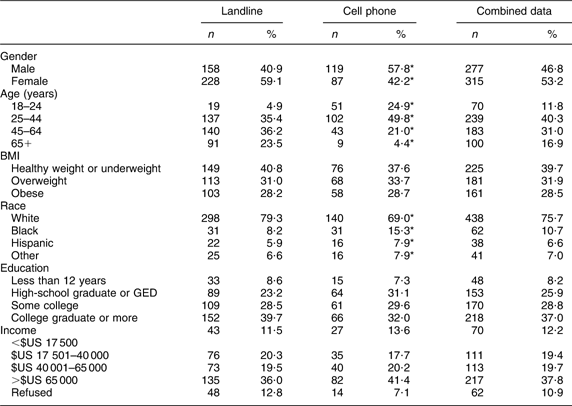
The characteristics of the sample are included in Table 1. The respondents who completed the survey on a cell phone were more likely to be younger, male and African American, compared with the respondents who completed the survey on a landline phone. A high proportion of adults in our sample (69 %) reported drinking at least one pre-packaged SSB in the last week. Among those who consumed a SSB in the last week, the average number of pre-packaged SSB that respondents reported drinking per week was 6·9; respondents reported drinking forty-five servings of unsweetened beverages (including bottled water and tap water) during the past week and 3·6 servings of alcoholic beverages.
Table 1 Characteristics of the respondents by type of phone (landline v. cell): random-digit dialled telephone sample of US adults (n 592), April 2009–June 2010

GED, General Educational Development.
*Proportion was significantly different from that in the landline phone group (χ 2 test): P < 0·05.
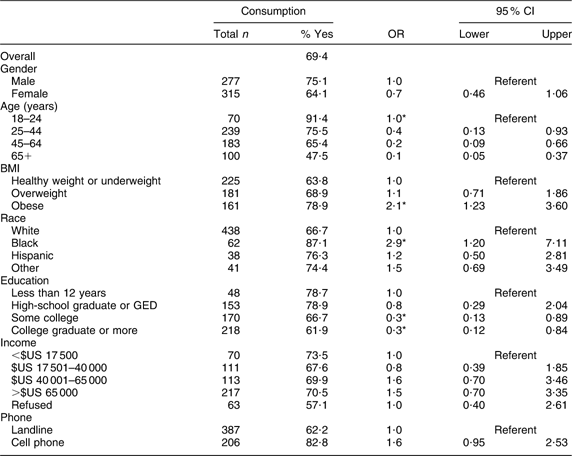
Logistic regression analyses were used to examine the correlates of drinking SSB while controlling for gender, age, BMI, race, education and income. Respondents most likely to report drinking an SSB in the past week were African Americans, males, those age 18–24 years, those with a BMI of ≥30·0 kg/m2 and those with lower levels of education (P < 0·05; Table 2). We also conducted a linear regression model (data not shown) assessing the number of SSB reported per week, among those who reported any consumption, with results similar to the logistic regression except that the association of SSB consumption with race and with education disappeared using this method.
Table 2 Odds of reporting consumption of pre-packaged sugar-sweetened beverages in the past week: random-digit dialled telephone sample of US adults (n 592), April 2009–June 2010

GED, General Educational Development.
*OR and 95 % CI were significant in a logistic regression model controlling for each variable presented in the table: P < 0·05.
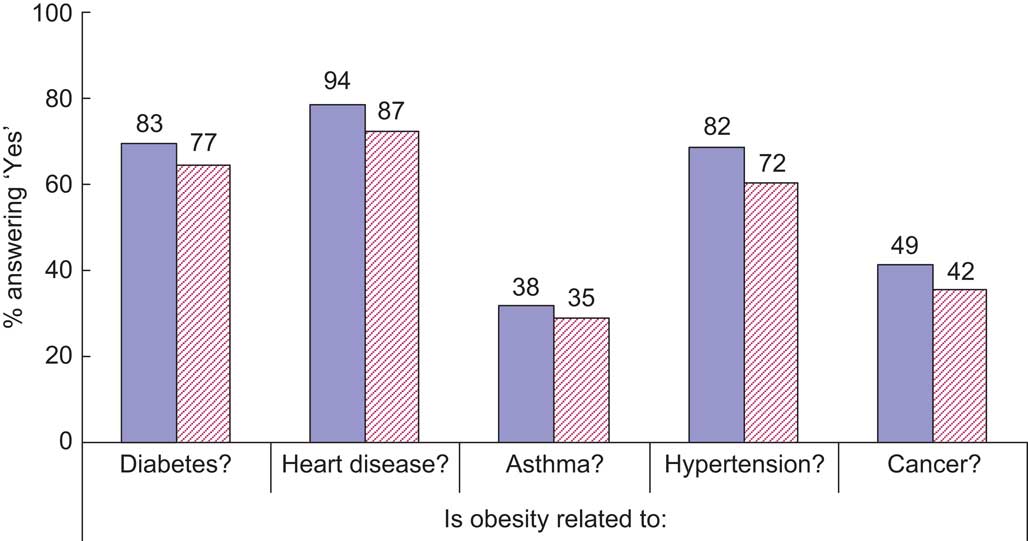
The majority of survey respondents knew that frequent consumption of soft drinks increases the risk of obesity (91 %), diabetes (90 %) and dental cavities among children (94 %; data not shown). However, fewer respondents knew that obesity is related to diabetes (79 %), heart disease (89 %), asthma (36 %), hypertension (75 %) or cancer (44 %). Respondents who reported consuming SSB in the last week were less likely to report that obesity is related to these conditions than were respondents who reported drinking no SSB in the last week; however, these differences were not statistically significant (Fig. 1).

Fig. 1 (colour online) Knowledge about health effects related to consumption of sugar-sweetened beverages (SSB) according to SSB consumption in the past week (![]() (solid), no;
(solid), no; ![]() (hatched), yes) among a random-digit dialled telephone sample of US adults (n 592), April 2009–June 2010. None of the differences were statistically significant (χ
2 test)
(hatched), yes) among a random-digit dialled telephone sample of US adults (n 592), April 2009–June 2010. None of the differences were statistically significant (χ
2 test)
Respondents were asked to consider what they would do if their state began collecting a 20 % tax on regular soda and SSB. Thirty-seven per cent said that it would have no impact at all, 20 % said that they would switch to untaxed drinks (e.g. diet soda and fruit drinks) and 39 % said that they would cut back on their consumption of SSB. Four per cent responded that they did not know what they would do (data not shown).
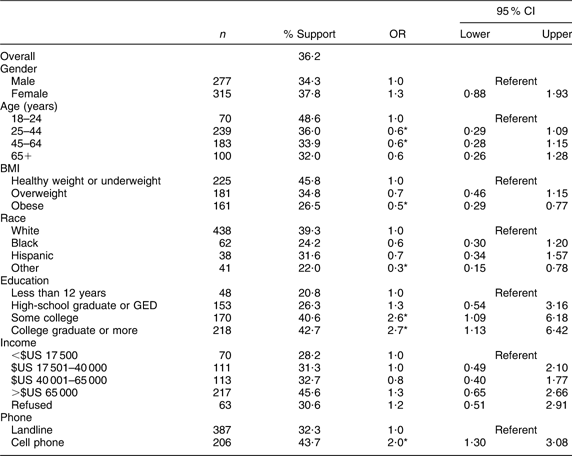
Overall, 36 % of respondents supported the implementation of a tax on pre-packaged SSB, with greatest support among those aged 18–24 years, those with BMI < 30 kg/m2 and those with higher levels of education (P < 0·05; Table 3). Also, those who responded to the survey on their cell phone were more likely to support a tax on SSB (44 %) than those who responded to the survey on a landline phone (32 %, P < 0·05 from χ 2 test; data not shown).
Table 3 Odds of reporting support for a tax on sugar-sweetened beverages: random-digit dialled telephone sample of US adults (n 592), April 2009–June 2010

GED, General Educational Development.
*OR and 95 % CI were significant in a logistic regression model controlling for each variable presented in the table: P < 0·05.
Discussion
The main finding from this nationally representative survey is that SSB consumption is high among adults, and that there exists a sizeable minority of the population that favours implementing a tax on SSB. This suggests that such a tax may in fact reduce consumption among some people, in addition to generating revenue for obesity prevention and health education.
We found that 69 % of adults surveyed reported drinking SSB in the past week, which is consistent with previous research; about two-thirds of adults report regular consumption of SSB( Reference Bleich, Wang and Wang 9 , Reference Finkelstein, Zhen and Nonnemaker 10 ). In fact, Bleich et al.( Reference Bleich, Wang and Wang 9 ) reported that consumption has increased over the past decade, concurrent with rising rates of obesity( Reference Wang and Beydoun 11 ) and type 2 diabetes( Reference Mokdad, Ford and Bowman 21 ). In our survey, adults reported consuming seven 12 oz servings of SSB per week, which according to other studies( Reference Wang and Beydoun 11 ) appears to be an underestimation of true consumption.
Our analysis shows the highest reported consumption of SSB among African Americans, those with a BMI of ≥30·0 kg/m2 and those with lower levels of education. Previous research has shown that minority and low socio-economic groups are disproportionately affected by obesity( Reference Wang and Beydoun 11 , Reference Mokdad, Ford and Bowman 21 ) and type 2 diabetes( Reference Mokdad, Ford and Bowman 21 ). However, this population subgroup is also the least likely to support a tax on SSB. When conducting a linear regression model (data not shown) assessing the number of SSB reported per week among SSB consumers, we found that the association of SSB consumption with race and with education disappeared. Therefore, we concluded that the association between SSB consumption and race and education is more a function of the decision to consume SSB at all, rather than an effect on increasing levels of consumption.
The response rate for the cell phone sample was higher (34 %) than for the landline phone sample (20 %). This is not surprising, because it is more likely when calling cell phones to receive a ‘Not in Service’ message, which is classified as ineligible. Numbers classified as ineligible are not included in the calculation of the response rate. In our cell phone sample, 46 % of the numbers dialled were classified as ineligible, compared with 22 % of the landline numbers dialled. With regard to consumption, we found that differences observed between the cell phone and landline sample could be explained by differences in the demographics of these two samples. This is reinforced by the data showing that likely cell user demographics (younger, male, African American) coincided with likely SSB consumer demographics (age 18–24 years, African American, males, BMI of ≥30·0 kg/m2, lower education levels). According to our results, the respondents who completed the interview via cell phone were more likely to report consumption of SSB and more likely to support a tax on these beverages. We found some evidence that cell phone respondents were more likely to support an SSB tax, even after adjusting for demographic differences (data not shown). The addition of cell phone respondents makes the sampling frame more complete; thus, studies that do not include a cell phone component may be underestimating population support for an SSB tax.
Based on this survey of US adults, and conservatively estimating that each serving of SSB is 418 kJ (100 kcal), we estimated that 76 billion beverages are consumed annually, translating into 31·8 × 1012 kJ (7·6 × 1012 kcal) per year from SSB alone. If a tax of $US 0·01 per ounce were implemented ($US 0·12 for each serving), over $US 9 billion in revenue would be generated annually. Using some of that revenue to fund nutrition and physical activity education would further help to combat obesity in the USA.
The present study has several limitations. First, our use of self-reported data may raise concern because of under-reporting. However, previous research has found that adults under-report their dietary consumption by as much as 25 %( Reference Bingham, Gill and Welch 20 ), and may do so more often for foods containing fats and sugars( Reference Bingham 22 ). Therefore, if there are inaccuracies, it is most likely that consumption of SSB is even higher than we reported. Second, our sample size was relatively small, which may limit the power of our analyses. However, the data are weighted to the demographic population of the USA. In order to increase the representativeness of our findings, we also included respondents who have only a cell phone and not a landline phone, as research has demonstrated a coverage error that may occur in telephone surveys that use only a landline frame, particularly for younger and lower-income adults( Reference Lavrakas, Shuttles and Steeh 23 ). Finally, although we predict that a tax on SSB may reduce consumption, the actual impact of such a tax is unclear until it is implemented and evaluated. However, Finkelstein et al.( Reference Finkelstein, Ruhm and Kosa 24 ) have noted the relationship between SSB intake, overall energy intake and rising obesity trends over time in their discussion of the economic impact of obesity in the USA. The authors note that a sizeable majority of health costs associated with obesity are levied by taxpayers, which serve as a motivator for government to reduce costs associated with this issue. Even if consumption was reduced by only modest amounts, the revenue potential of such a tax implication could be used to subsidize taxpayer burden of obesity costs( Reference Finkelstein, Ruhm and Kosa 24 ). Other researchers have proposed that tax revenue could be used to fund public education campaigns designed to highlight the health issues related to obesity, to point out of the sugar content of various beverages, and to raise awareness of the potential health impacts of consuming SSB( Reference Hattersley, Irwin and King 25 ). Such a campaign, in the presence of an SSB tax, could have a synergistic effect on beverage consumption.
In summary, these data suggest that a large majority of US adults regularly consume SSB and that a tax on these beverages may be helpful to decrease consumption. Opportunities also exist for educating the public about the health effects of obesity and the risks associated with frequent SSB consumption.
Acknowledgements
This project was provided by the SRDAR at Roswell Park Cancer Institute. The authors have no conflicts of interest. A.H., C.R. and S.E.M. designed the research, C.R. and D.S. conducted the research, C.R. and D.S. analysed the data, C.R., D.S., S.E.M. and A.H. wrote the paper, and C.R. had primary responsibility for the final content. All authors read and approved the final manuscript.


