


Introduction
Successful ecological restoration and reforestation depend on the survival of plants, particularly during the vulnerable early stage of seedling establishment (Elliott et al. Reference Elliott, Blakesley and Hardwick2013). During this critical phase, seedlings are highly susceptible to abiotic and biotic stresses such as drought, resource competition, and herbivory. Deciduous dipterocarp forest (DDF) is a dry tropical forest type dominated by trees in Dipterocarpaceae family and widely distributed across South and Southeast Asia. Agricultural conversion and urbanization are the main causes contributing to the destruction and fragmentation of DDFs (Bunyavejchewin et al. Reference Bunyavejchewin, Baker, Davies, McShea, Davies and Bhumpakphan2011). To mitigate these losses, seedlings of dipterocarp species, such as Dipterocarpus alatus, have been planted in several reforestation projects in various regions in Southeast Asia due to their native status, drought resistance, and economic and ecological values (Bupabanpot et al. Reference Bupabanpot, Rattanapracha, Poopath, Phueaknang and Danchoodham2013, Larpkern et al. Reference Larpkern, Eriksen and Waiboonya2017, Tigabu et al. Reference Tigabu, Savadogo, Odén and Xayvongsa2010, Tuan & Dinh Reference Tuan and Dinh2020). However, despite their numerous benefits, dipterocarp trees grow slowly and are commonly affected by insect herbivory in all stages of development, from seeds to mature trees (Bupabanpot et al. Reference Bupabanpot, Rattanapracha, Poopath, Phueaknang and Danchoodham2013).
Aerial vertebrate predators, including birds and bats, play a significant role in shaping ecosystems by controlling insect populations and subsequently improving growth and yield of plants (Gras et al. Reference Gras, Tscharntke, Maas, Tjoa, Hafsah and Clough2016, Karp & Daily, Reference Karp and Daily2014, Karp et al. Reference Karp, Mendenhall, Sandí, Chaumont, Ehrlich, Hadly and Daily2013), but their roles in controlling functions could vary among arthropod groups and ecosystems. For instance, birds have been observed to reduce infestations of the berry borer beetle in coffee plantations, while bats did not (Karp et al. Reference Karp, Mendenhall, Sandí, Chaumont, Ehrlich, Hadly and Daily2013). In another scenario, exclusion of bats resulted in a higher number of caterpillars, but this was not the case with birds (Gras et al. Reference Gras, Tscharntke, Maas, Tjoa, Hafsah and Clough2016). Moreover, several studies observed an increase of arthropod predators, or mesopredator release, in exclusion cage experiments when birds and bats were absent (Cassano et al. Reference Cassano, Silva, Mariano-Neto, Schroth and Faria2016, Ferreira et al. Reference Ferreira, Jarrett, Wandji, Atagana, Rebelo, Maas and Powell2023, Karp & Daily Reference Karp and Daily2014, Maas et al. Reference Maas, Clough and Tscharntke2013, Schmitt et al. Reference Schmitt, Greenberg, Ibarra-Núñez, Bichier, Gordon and Perfecto2021). Birds and bats also indirectly mitigate leaf damage in various ecosystems, such as oaks in temperate broad-leaf forests (Böhm et al., Reference Böhm, Wells and Kalko2011) and coffee and cocoa in agroforestry systems (Cassano et al. Reference Cassano, Silva, Mariano-Neto, Schroth and Faria2016, Van Bael et al., Reference Van Bael, Bichier and Greenberg2007; Van Bael et al., Reference Van Bael, Philpott, Greenberg, Bichier, Barber, Mooney and Gruner2008). However, the contrary results also have been reported in oaks (Giffard et al. Reference Giffard, Crocket, Barbaro and Jacktel2012). Moreover, the outcomes of birds and bats exclusion studies were not universal and could be influenced by various environmental conditions, such as seasonal variation (William-Guillén et al. Reference William-Guillén, Perfecto and Vandermeer2008), shading gradients (Barber & Marquis Reference Barber and Marquis2011, Gras et al. Reference Gras, Tscharntke, Maas, Tjoa, Hafsah and Clough2016), spatial scale (Linden et al. Reference Linden, Grass, Joubert, Tscharntke, Weier and Taylor2019, Rogers et al. Reference Rogers, Hille Ris Lambers, Miller and Tewksbury2012), and successional stages of vegetation (Szefer et al. Reference Szefer, Molem, Sau and Novotny2021).
Furthermore, most studies on the ecological role of birds and bats in controlling invertebrate prey populations have been conducted primarily in America continent and Europe, with fewer investigations in Asian ecosystems (Morante-Filho & Faria, Reference Morante-Filho and Faria2017). This gap in research points to the need for more understanding of the role of birds and bats in controlling insect populations and their indirect effects on plant growth and leaf damage, particularly in forest restoration, when vulnerable species like D. alatus are involved (Ly et al. Reference Ly, Nanthavong, Pooma, Barstow, Luu, Khou and Newman2017). To address this research gap, here we present (1) the direct effects of excluding birds and bats using diurnal and nocturnal exclosures (NE) on arthropod communities in D. alatus reforestation plots and (2) the indirect effects on dipterocarp seedling growth and leaf damage. We hypothesized that excluding birds and bats would reduce the control of phytophagous arthropods, thereby decreasing seedling growth and increasing leaf damage, and we also expected to see mesopredator release in the aerial predator exclusion.
Methodology
Study sites
This experiment was conducted at the Lainan Research and Technology Transfer Station (LRTTS) of Chulalongkorn University, located in Nan province, northern Thailand (coordinates: 18° 33’ 12” N, 100° 47’ 34” E; elevation: 215 m; area: 3.38 km2). The climate in this region falls into wet and dry seasons, as defined by Beck et al. (Reference Beck, Zimmermann, McVicar, Vergopolan, Berg and Wood2018). During the wet season (May-Oct), the average temperature is 27.5°C, with approximately 1050 mm of rainfall. In contrast, the average temperature during the dry season (November–April) is 24.8°C, with significantly less rainfall, around 170 mm (Thai Meteorological Department 2017).
The landscape of LRTTS was classified as a DDF, primarily characterized by the prevalence of trees of the family Dipterocarpaceae, from the genera Shorea and Dipterocarpus. These dipterocarp species coexisted with trees from lowland mixed deciduous forest, such as Terminalia spp. and Pterocarpus macrocarpus (Dumrongrojwatthana Reference Dumrongrojwatthana2009). The area includes ponds and a large reservoir, with buildings and structures constructed in small clusters. Within a 500-meter radius of the study site, agricultural activities included cultivating grass for animals at the research center and adjacent to the Lainan community forest, which covers a total area of 1.34 km2 (Wimolsakcharoen et al. Reference Wimolsakcharoen, Dumrongrojwatthana, Le Page, Bousquet and Trébuil2021). In the extended 2-kilometer vicinity, villagers grew seasonal cash crops, mainly rice and corn, during the wet season and planted other crops such as tobacco and pumpkin during the dry season.
Historically, the region faced disturbances from logging and frequent wildfires mostly initiated by human activities, leading to several grassy patches as forest gaps across the landscape. Consequently, the LRTTS initiated a long-term reforestation project in 2006 by planting seedlings from the Dipterocarpaceae family, including native species like Hopea odorata, Dipterocarpus obtusifolius, and D. alatus, in the forest gaps. These seedlings were inoculated by ectomycorrhizae (mixed species of Lactarius sp. and Russula spp.) to support their growth and establishment.
In this study, four reforestation plots, each 40 m × 40 m, were selected as experimental plots with a minimum distance of 250 m apart. All plots were planted with D. alatus, aged 1–4 years, and spaced two meters apart. The plants in all plots, which entered the study in 2018, were classified as seedlings, with an initial height of 85.24 ± 31.65 cm (mean ± SD). This classification was based on the fact that 90 percent of plants were less than breast height (130 cm), and those that reached this height had a diameter at breast height (DBH) of less than 2.5 cm (Woods, Reference Woods1989). Additionally, all seedlings were categorized as small trees, defined as having a DBH between 1 and 10 cm (Suzuki et al., Reference Suzuki, Numata, Okuda, Supardi and Kachi2009). During the early wet season, grass cover was removed as part of routine management. However, all the grass dried up in the dry season and was trodden flat on the ground when necessary for the convenience of observation.
Experimental design
The exclusion cages were constructed using brown polyvinyl chloride frames (PVC: outer diameter 22 mm), positioned at least 30 cm above the tops and branches of the seedlings (cage volume 0.6–2.6 m3). These cages were enclosed with agricultural netting with a mesh size of 2.5 × 2.5 cm, enabling insects to freely access while effectively preventing birds and bats from entry, as demonstrated in prior studies (Kalka et al. Reference Kalka, Smith and Kalko2008, Morrison & Lindell Reference Morrison and Lindell2012, William-Guillén et al. Reference William-Guillén, Perfecto and Vandermeer2008). All cages were designed as box-shaped structures with lids on top, and the side mesh could be conveniently rolled and secured to the frame to facilitate daily opening and closing at the specified times for data collection.
The exclusion treatments were divided into four treatments, including (1) control treatments (CT) in which the cage were covered with frames but no mesh, (2) permanent exclosures (PE), which were covered all the time to exclude all bat and bird activities, (3) NE, which were covered during nighttime (18:00 – 06:00) to exclude nocturnal bird and bat activities, and (4) diurnal exclosures (DE), which were covered during daytime (06:00 – 18:00) to exclude diurnal bird activities.
A randomized block design was utilized in which exclusion cages and control frames were applied to adjacent seedlings to ensure consistent surrounding conditions. This experimental unit of four treatments was replicated six times within each observation plot, resulting in a total of 96 seedlings (Figure S1).
Arthropods surveys
Biweekly arthropod observations were carried out six times in each wet season (August–October in 2018) and dry season (January–April in 2019), respectively. The method involved visual census and photography to prevent arthropod disturbance, following Williams-Guillén et al. (Reference William-Guillén, Perfecto and Vandermeer2008). Photographs were taken for identification, aiming to assign trophic guilds. Arthropods were identified to at least the order level and to subsequent lower classification until the species level where possible. Arthropods were visually recorded by counting the number of individuals, and these counts were later standardized to a per-square-meter basis of leaf area to ensure consistency across all treatments. Their sizes in millimeters, both width and length, were measured with the aid of graph paper grids (1×1 mm) during the field survey. Later, biomass was estimated using the length × width-mass regression model following Wardhaugh (Reference Wardhaugh2013).
The arthropods were categorized into trophic guilds, including (1) phytophagous insects (chewers and sapsuckers), (2) predatory arthropods or mesopredators (insect and non-insect predators), (3) parasitoids, (4) scavengers (primarily feeding on decaying organic matter), (5) tourists (non-predatory species and have no lasting association with dipterocarps), and (6) ants. Ants were later identified to genera and species, and classification as mesopredators was adopted when their foraging behavior was observed as predatory and opportunistic feeding (Forbes & Northfield Reference Forbes and Northfield2017) (see Table S2).
Seedling measurements
The indirect effects of birds and bats exclusion on plants were evaluated through quantitative data of seedling growth, including height extension and branch extension, following the methods outlined in Van Bael et al. (Reference Van Bael, Bichier and Greenberg2007) and Rossatto (Reference Rossatto2009). For each seedling, three branches were tagged. Furthermore, we calculated the rate of insect herbivory using this formula:
Rate of herbivory (%) = (Number of leaves with insect herbivory marks/Total number of the observed leaves) × 100.
Leaf area calculation
The leaf area of seedlings was measured at the end of each season. We measured only the width of all leaves due to leaf damage normally observed at the tip of the leaves and only on one side of the midrib, while the opposite side remained undamaged, so we could reliably estimate the leaf width based on the undamaged side. Predicted leaf area from width was calculated using the following formula:
Predicted leaf area (cm2) = EXP (0.212(W) + 2.908), where W represents the width of the leaf in centimeters.
This formula was developed by calculating the area of each of 1,760 undamaged leaves from D. alatus, including both young and mature specimens. The leaves were photographed; leaf width was measured and then the leaf area in cm2 was calculated using the ImageJ program (National Institutes of Health 2018: version 1.52i). Subsequently, we fitted generalized linear models (GLMs) with leaf area as the dependent variable and leaf width as the explanatory variable.
Leaf damage assessment
Leaf damage intensity was evaluated by tagging 10 healthy leaves, including both young and mature leaves, on each seedling at the beginning of each season. Subsequently, at the end of each season, these tagged leaves were photographed and analyzed using ImageJ software (National Institutes of Health 2018: version 1.52i) to determine the remaining leaf area. An example of insect herbivory marks was shown in Figure S2. The sampled leaves were then categorized based on the percentage of leaf damage into five distinct intensity groups: 0% (no damage), 1–5% (low damage), 6%–20% (moderate damage), 21%–50% (high damage), and 51%–100% (extreme damage).
Statistical analysis
Generalized estimating equations (GEE) were used to examine the effects of birds and bats exclusion on arthropod abundance, biomass, and their length size. This statistical method accounts for non-Gaussian errors when the outcome variable deviates from the normal distribution assumption for handling repeated measures data and focuses on estimating population-averaged effects (Koper & Manseau Reference Koper and Manseau2009). We evaluated the exclusion treatments, considering seasonal effects, for large-sized arthropods with a length size of ≥ 1 cm, which were susceptible to predation by birds and bats (Gras et al. Reference Gras, Tscharntke, Maas, Tjoa, Hafsah and Clough2016, Kalka & Kalko Reference Kalka and Kalko2006, Remmel et al. Reference Remmel, Davison and Tammaru2011, Van Bael et al. Reference Van Bael, Philpott, Greenberg, Bichier, Barber, Mooney and Gruner2008). We employed the negative binomial distribution with a log-link function for abundance data and utilized the Poisson-Gamma distribution (Tweedie) with a log-link function for biomass data to deal with abundance data where zeros were common. Additionally, the gamma distribution with log-link function was applied to analyze the comparison of length size in each exclusion treatment.
To investigate the indirect effects of birds and bats exclusion on seedling plants, we utilized GLMs with a gamma distribution to accommodate the positively skewed data for height and branch extension. In contrast, the analysis of leaf damage intensity required addressing data overdispersion using a GLM with an ordinal response scale. We used the multinomial distribution and a cumulative logit link function for this analysis. All statistical analyses were conducted using SPSS software, version 29.0 (IBM Corp, 2022).
Results
The total number of observed arthropods were 19,076 individuals with estimated total biomass of 2,311.55 grams. Only 2,437 individuals were classified as large-sized (body length ≥1 cm; average length 1.51 cm ± 1.05 (SD)), accounting for 12.8% of all arthropods, but they contributed 1,519.83 grams or 65.7% of the total arthropod biomass. This group of large arthropods encompassed phytophagous, predatory, parasitic, and scavenging species, as well as the large size ants and tourists. All large-sized ants are classified as mesopredators based on their predatory behavior and opportunistic feeding (Table S1).
The proportions of large-sized arthropod guilds differed significantly in terms of abundance and biomass. Mesopredators dominated the observed arthropod community, accounting for 83.7% of the total abundance mostly from ants, followed by phytophagous arthropods (13.3%), tourists (2.2%), scavengers (0.8%), and parasitoids (0.04%), respectively. In contrast, phytophagous arthropods and mesopredators shared a similar proportion in arthropod biomass, representing 47.3% and 46%, respectively. The other guilds, including tourists, scavengers, and parasitoids, accounted for 6%, 0.8%, and 0.03%, respectively (see Table S2 for detailed data).
Arthropod density and biomass
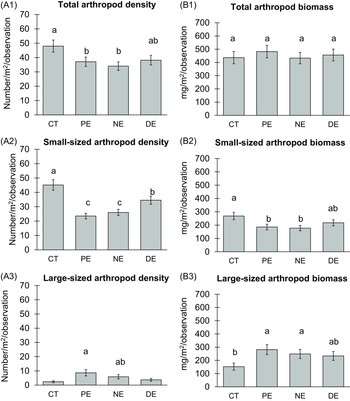
The analysis of aggregation data of all arthropods showed the total arthropod density in all exclusion treatments was significantly lower than the control (χ2 = 7.468, df = 3, p = .05; Figure 1: A1), while the total arthropod biomass was no significant different between the exclusion treatments and control (Figure 1: B1). Moreover, the birds and bats exclusion did not affect the density (χ² = 32.73, df = 3, p < .001; Figure 1: A2) and biomass (χ² = 8.08, df = 3, p = .04; Figure 1: B2) of the small-sized arthropods, which showed the highest values in control treatments.

Figure 1. Mean arthropod density and biomass analyzed by generalized estimating equations (GEE). Panel (A) shows mean arthropod density as the number of arthropods per square meter of leaf area per observation, while (B) shows mean biomass in milligrams per square meter of leaf area per observation. Each row represents different datasets: Row 1 (A1, B1) for total arthropods, Row 2 (A2, B2) for small-sized arthropods (length <1 cm), and Row 3 (A3, B3) for large-sized arthropod (length ≥1 cm). The exclusion treatments are control treatment (CT), permanent exclosures (PE), nocturnal exclosures (NE), and diurnal exclosures (DE). Values in the charts represent estimated marginal means of exclusion treatment effects ± SE. Significant mean differences at the 0.05 significance level are indicated by different letters.
Importantly, the exclusion treatments had a significant influence on the density and biomass of the entire large-sized arthropod community. Across both wet and dry seasons, the density of large-sized arthropods increased notably within PE and NE compared to the control (CT). However, there was no significant difference between DE and the control, nor between NE and DE (χ² = 13.61, df = 3, p = .003; Figure 1: A3). The analysis conducted separately for wet and dry seasons unveiled distinct patterns. While the trends in arthropod density during the wet season mirrored those of the dry season, it was in the latter (dry season) that a substantial difference emerged, with all exclusion treatments exhibiting a noteworthy increase (χ² = 30.12, df = 7, p < .001). The results revealed a significant interplay between the treatments and seasonal effects.
The analysis of the biomass of large-sized arthropods using GEE yielded patterns similar to those of large-sized arthropod abundance (χ² = 9.623, df = 3, p = .02; Figure 1: B3). The treatment factor had a significant impact on biomass (χ² = 7.833, df = 3, p = .05), as did the seasonal factor (χ² = 85.96, df = 1, p < .001) and their interaction (χ² = 129.33, df = 7, p < .001). When examining estimated marginal means for interaction effects, an increase in biomass was observed in all exclusion treatments (PE, NE, and DE) compared to the control during the dry season, mirroring the abundance results.
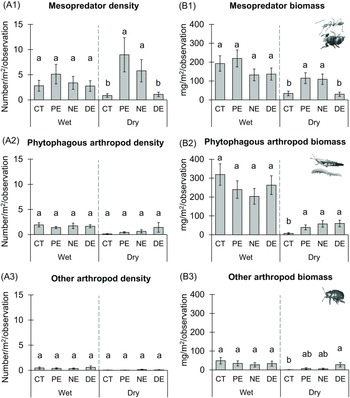
During the dry season, the mesopredator release was evident, with the highest density (χ² = 37.54, df = 7, p < .001) and biomass (χ² = 54.50, df = 7, p < .001) of the large-sized predatory arthropods observed in PE and NE, while CT and DE showed lower values (Figure 2: A1, B1). The exclusion treatments had no significant impact on the density of large-sized phytophagous arthropods, but their biomass was higher in all exclusion treatments (PE, NE, and DE) during the dry season (χ² = 115.118, df = 7, p < .001; Figure 2: A2, B2). The density and biomass of the other arthropods (scavengers and tourists) remained unaffected by the exclusion treatments (Figure 2: A3, B3). A detailed summary of the model effects for large-sized arthropods was presented in Table 1.

Figure 2. Mean differences between the exclusion treatments by seasons for mesopredators (ants, insect predators, and non-insect predators) and phytophagous arthropods (chewers and sapsuckers). Panels represent: (A) Arthropod density, and (B) Arthropod Biomass. Panels detail: (1) Large-sized mesopredators, (2) Large-sized phytophagous arthropods, (3) Other arthropods: scavengers and tourists. The exclusion treatments are control treatment (CT), permanent exclosures (PE), nocturnal exclosures (NE), and diurnal exclosures (DE). Values represent estimated marginal means of exclusion treatments and seasonal effects ± SE. Within each season significant mean differences at the 0.05 significance level are indicated by different letters.
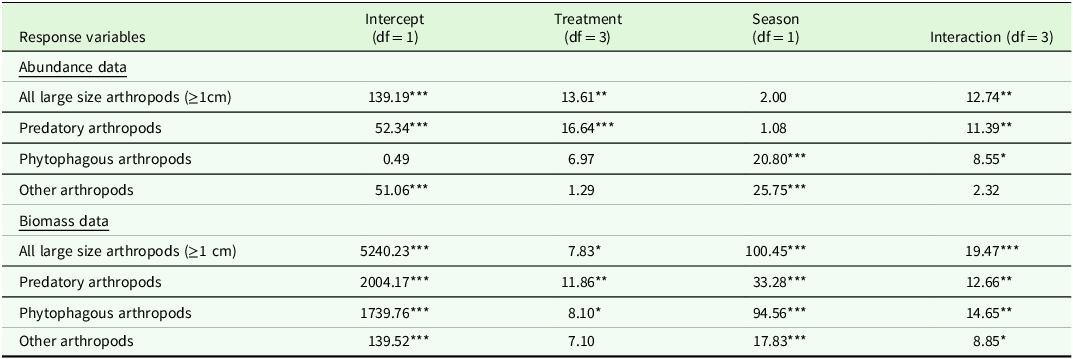
Table 1. Test of model effects using generalized estimating equations (GEE) for arthropod abundance and biomass data. The values represent Wald chi-square for the full model: (Intercept), exclusion treatments, seasons, exclusion treatments, and season. Significance levels are denoted by asterisks: * for p < .05, ** for p < .01, and *** for p < .001

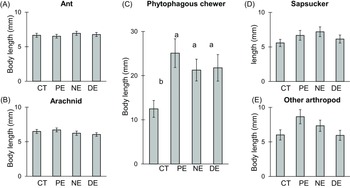
Interestingly, the mean length of phytophagous chewers demonstrated a significant increase in all exclusion treatments: PE = 25.1 mm, DE = 21.8 mm, NE = 21.3 mm, compared to the control group at 12.5 mm (χ² = 16.40, df = 3, p < .001). In contrast, ants, arachnids, sapsuckers, and other arthropods did not show any significant difference (Figure 3).

Figure 3. Mean length of arthropods observed across exclusion treatments. (A) Mesopredators: Ants, (B) Mesopredators: Arachnids (spiders and harvestmen), (C) Phytophagous chewers (Lepidoptera larvae and Orthoptera), (D) Phytophagous sapsuckers (Hemiptera), (E) Other arthropods (scavengers and tourists). The exclusion treatments are control treatment (CT), permanent exclosures (PE), nocturnal exclosures (NE), and diurnal exclosures (DE). Values represent estimated marginal means of exclusion treatment effects ± SE. Significant differences at the 0.05 level are indicated by different letters.
Indirect effects on seedling measurements
At the end of the experiment, the exclusion treatments showed no significant effects on seedling height extension (χ² = 0.68, df = 3, p > .05; Figure 4: A). Similarly, no significant effects were observed on branch extension (χ² = 0.91, df = 3, p > .05; Figure 4: B). Overall, seedling height increase (χ² = 25.26, df = 1, p < .001) and branch extension (χ² = 27.49, df = 1, p < .001) were significantly different between seasons. During the wet season, seedlings increased by 16.86 cm ± 1.68 SE in height and 14.94 cm ± 1.31 SE in branch extension. In the dry season, the observed mean height increase, and branch extension were 8.16 cm ± 0.85 SE and 7.79 cm ± 0.69 SE, respectively.

Figure 4. Mean seedling measurements by exclusion treatments and seasons. Panels represent: (A) Seedling height extension, (B) Branch extension. The exclusion treatments are control (CT), permanent exclosures (PE), nocturnal exclosures (NE), and diurnal exclosures (DE). Values represent estimated marginal means of exclusion treatments and seasonal effects ± SE. Significant differences at the 0.05 level are indicated by different letters.
Herbivory damage
The rates of herbivory were 52.1% and 68.2% during the wet and dry seasons, respectively. However, the extent of damage remained relatively low, most frequently 1%–5% of the leaf area (Figure 5). Furthermore, the exclusion treatments showed no influence on leaf damage intensity (χ² = 0.46, df = 3, p > .05), so the damage intensity levels were consistent across all exclusion treatments. Only seasonal factors showed significant affects damage intensity with a lower predicted level of damage in wet season when compared with dry season (χ² = 32.19, df = 1, p <.001; Figure 5). The association between treatment effects and season did not yield any statistical significance in this analysis.

Figure 5. The percentage of each leaf damage intensity category found in Dipterocarpus alatus seedlings by exclusion treatments and seasons. The exclusion treatments are control (CT), permanent exclosures (PE), nocturnal exclosures (NE), and diurnal exclosures (DE).
Discussion
Arthropod density and biomass
The outcomes of excluding top-down pressures from birds and bats on the arthropod community agreed with our expectations, resulting in higher biomass of large-sized phytophagous arthropods during the early stages of D. alatus reforestation. Our focus on larger body sizes was deliberate, as birds and bats tend to prefer larger prey (Gras et al. Reference Gras, Tscharntke, Maas, Tjoa, Hafsah and Clough2016, Kalka & Kalko Reference Kalka and Kalko2006, Remmel et al. Reference Remmel, Davison and Tammaru2011, Van Bael et al. Reference Van Bael, Philpott, Greenberg, Bichier, Barber, Mooney and Gruner2008), making their impact more evident in our analysis. Our findings of negative impacts of exclusion on phytophagous arthropods with low abundance (13.3%) but high in biomass (47.3%) concurred with the exclusion studies conducted in various ecosystems, such as agroecosystems (Gras et al. Reference Gras, Tscharntke, Maas, Tjoa, Hafsah and Clough2016, Koh Reference Koh2008, Van Bael et al. Reference Van Bael, Bichier and Greenberg2007, Williams-Guillén et al. Reference William-Guillén, Perfecto and Vandermeer2008) and tropical forests (Kalka et al. Reference Kalka, Smith and Kalko2008). However, as generalist predators, birds and bats also exert trophic pressure on mesopredators. In this study, consequences of top-down pressure on the biomass of both phytophages and mesopredators were obviously evident during the dry season, especially with the presence of migratory avian predators (Van Bael et al. Reference Van Bael, Philpott, Greenberg, Bichier, Barber, Mooney and Gruner2008, Barber & Wouk Reference Barber and Wouk2012, Planillo et al. Reference Planillo, Kramer-Schadt, Buchholz, Gras, von der Lippe and Radchuk2021). Furthermore, the depletion of food sources and shelters for arthropods during the dry season explained the lower overall abundance and biomass of arthropods (Kishimoto-Yamada & Itioka Reference Kishimoto-Yamada and Itioka2015), thus the exclusion effect was not evidently observed during the wet season when the overall arthropod abundance was higher.
Formicidae were the dominant predatory arthropod group in this study, and notable examples within this group included Dolichoderus thoracicus, which displayed aggressive behavior when disturbed and has been recognized as a biocontrol agent for insect pests in cocoa cultivation (See & Khoo Reference See and Khoo1996). Another species, Oecophylla smaragdina, was observed attacking weevils on D. alatus seedling and capturing termite larvae and Apis cerana on the ground. The higher density and biomass of large-sized mesopredators in PE and NE during the dry season was explained by the colonization of O. smaragdina (Figure 2: A1, B1).
In this study, the predation pressure from bats was not evident, possibly due to their foraging preferences and the limited information on the species composition and population density of bats in the study area. While some insectivorous bats, particularly gleaning species, forage by capturing insects resting on foliage or branches, many tropical bat species primarily target flying arthropods above the vegetation canopy or in open spaces, which may reduce their interaction with prey near seedling foliage (Surlykke et al. Reference Surlykke, Miller, Møhl, Andersen, Christensen-Dalsgaard and Jørgensen1993, Wanger et al. Reference Wanger, Darras, Bumrungsri, Tscharntke and Klein2014).
Intraguild predation may occur among mesopredators, affecting the abundance of various arthropods. Additionally, ground vertebrate predators, including Asian grass lizard Takydromus sexlineatus, Ocellated butterfly lizard Leiolepis ocellata, and Asian rice frog Fejervarya limnocharis could enter the exclosures. However, during our survey, Asian grass lizards were infrequently observed and rarely seen on the seedlings. In contrast, Ocellated butterfly lizards and frogs were found to be more effective at controlling insects on ground level.
Several studies have reported that top-down control effects depend on the surrounding factors, such as shade gradients (Gras et al. Reference Gras, Tscharntke, Maas, Tjoa, Hafsah and Clough2016, Ferreira et al. Reference Ferreira, Jarrett, Wandji, Atagana, Rebelo, Maas and Powell2023) and landscape scale (Linden et al. Reference Linden, Grass, Joubert, Tscharntke, Weier and Taylor2019, Rogers et al. Reference Rogers, Hille Ris Lambers, Miller and Tewksbury2012). However, the study by Cassano et al. (Reference Cassano, Silva, Mariano-Neto, Schroth and Faria2016) reported contrary results, showing that local shade levels did not influence this trophic cascade. In our case, we did not collect data to compare these factors, as our study area primarily consists of a monoculture of D. alatus seedlings in the open forest gaps, aimed at a reforestation project. Consequently, the overall area of each plot does not exhibit significant variation.
Indirect effects on seedlings
Contrary to our expectations, the influence of exclusion treatments on seedling measurements was not observed. However, it is essential to acknowledge certain limitations that should be considered when interpreting our findings. First, our study was conducted over a 3-month period per season. While this timeframe allowed us to observe significant changes in seedling height and branch extension, it may not capture all the nuances of the effects of both exclusion treatments and seasonal variations. Another factor that deserves consideration is the production of new leaves (Maas et al. Reference Maas, Clough and Tscharntke2013).
Furthermore, it is important to note that the seedlings of D. alatus in our study exhibited low leaf damage intensity, regardless of whether they were subjected to exclusion treatments or control. This finding concurred with previous research study on dipterocarp species showing low levels of damage intensity, frequently less than 10% (Howlett & Davidson Reference Howlett and Davidson2001), comparing to oaks with 40% (Böhm et al Reference Böhm, Wells and Kalko2011).
Notably, this study was conducted in well-maintained reforestation plots surrounded by an intact forest area likely providing habitats and refuge for other predators (Rossetto & Kooyman, 2021) These predators may compensate for the absence of birds and bats, providing functional redundancy in regulating herbivory (Rosenfeld, Reference Rosenfeld2002).
In conclusion, our findings highlight the complex dynamics of top-down control in the early stages of D. alatus reforestation. While the exclusion of birds and bats increased the biomass of large-sized phytophagous arthropods, the absence of significant effects on seedling growth and leaf damage underscores the compensatory role of other predators. These results emphasize the critical importance of maintaining habitat complexity and connectivity in reforestation projects to foster ecological redundancy and enhance resilience in predator–prey interactions. Future research should consider longer observation periods and broader spatial scales to deepen our understanding of how seasonal variations, predator behavior, and landscape features interact to shape these ecological processes.
Supplementary material
The supplementary material for this article can be found at https://doi.org/10.1017/S0266467425100138
Acknowledgements
We would like to thank Chulalongkorn University: Lainan Research and Transfer Station (LRTTS) in Nan Province for providing research resources and accommodation. We appreciate the valuable assistance of Mr. Naratip Chantarasawat and the members from Bee and Spider Research Unit (BSRU) in identifying arthropods. We also thank the reviewers and editors for their insightful feedback, which greatly contributed to the improvement of this manuscript.
Financial support
This work was supported by the Plant Genetic Conservation Project under the Royal Initiative of Her Royal Highness Princess Maha Chakri Siridhorn (C.C., grant number NRCT2559A10103026); and the Science Achievement Scholarship of Thailand (P.N., grant number CU0159/039).
Conflicts of interest
The authors declare no conflict of interest. The funding entities had no role in the study’s design, data collection, analysis, interpretation, manuscript writing, or the decision to publish this research.


 Open access