Improving the health and welfare of Australia’s Aboriginal and Torres Strait Islander peoples is of national concern(1). This population is at a much greater health disadvantage than non-Indigenous Australians(2, 3), with high rates of chronic diseases, a rate of diabetes at least three times that of non-Indigenous Australians(4), and a rate ratio for diabetes-related mortality in those aged 35–54 years of 23·1 for men and 37·2 for women relative to non-Indigenous Australians(2). The incidence of type 2 diabetes in Aboriginal and Torres Strait Islander youth is six times that of their non-Indigenous counterparts(Reference Craig, Femia and Broyda5). Improving the diet of children has been acknowledged as a strategy for reducing the risk of chronic diseases during childhood and adulthood both nationally(6, Reference Lobstein, Baur and Uauy7) and internationally(8, Reference Mikkla, Rasanen and Raitakari9).
To enable the monitoring of dietary consumption patterns at the population level, and the evaluation of health promotion and education programmes aimed at improving nutritional status, simple valid methods of measuring dietary consumption are required(Reference Rockett, Berkey and Colditz10). Methods of evaluating dietary consumption patterns in children and young people include 24 h dietary recall, food records, weighed food intake measures, food diaries, parent proxy report and FFQ(Reference Mikkla, Rasanen and Raitakari9, Reference Gibson11). Short dietary self-report instruments such as short FFQ (SFFQ) are designed to collect information at a population (group) level(Reference Flood, Webb and Rangan12) with less associated cost, low respondent burden and relative ease of administration compared with other methods(Reference Rutishauser, Webb and Abraham13). While it is recognised that young peoples’ dietary self-report is prone to inaccuracy(Reference Baxter14) and under-reporting may increase with age(Reference Livingstone, Robson and Wallace15), it is concluded that sufficient accuracy with recall is attained for 8- to 10-year-old children to provide reasonable population-level data(Reference Baxter14–Reference Baranowski and Domel16).
Although a number of FFQ have been validated for young people(Reference Rockett, Berkey and Colditz10, Reference Cade, Burley and Warm17), few SFFQ have been validated for use by children of primary school age internationally or nationally(Reference Flood, Webb and Rangan12), and no methods of evaluating dietary consumption have been validated with Australia’s Aboriginal and Torres Strait Islander children.
The appropriateness of SFFQ as a measure for use with Aboriginal and Torres Strait Islander children is important to establish, not only because of the lack of valid methods available to evaluate and monitor health programmes in this population which bears a high disease burden, but also because of concerns about the cultural appropriateness of this method(2, Reference Zubrick, Lawrence and Silburn18). There is a range of determinants linked to the poor nutritional health status of Australian Aboriginal and Torres Strait Islander peoples, including social marginalisation, lack of control over circumstances and lesser financial means(3). Aboriginal Health Workers (AHW) in the present study reported that as a result of these determinants Aboriginal and Torres Strait Islander children can be wary of non-Indigenous authority figures (who were present when data were collected) and concerned about giving a negative picture of their food behaviour. This may heighten their desire to give a ‘good’ impression and hide what they perceive to be problematic information, thus negatively influencing the usefulness of a tool such as this SFFQ.
The current study was conducted as part of the Many Rivers Diabetes Prevention project and its purpose was to determine the reproducibility (reliability) and relative validity of an Australian SFFQ for rural children aged 10 to 12 years, particularly Australian Aboriginal and Torres Strait Islander children. Reproducibility and validity were examined for twenty-eight short questions on food intake against the reference method of the mean of three 24 h previous-day recalls(Reference Cade, Burley and Warm17).
Materials and methods
Design
In the current cross-sectional study undertaken in the Australian summer of late 2005, each participant completed the SFFQ on two occasions two weeks apart, followed by three 24 h recalls completed over the subsequent one to two weeks. Reproducibility of the questionnaire was established by comparing the results of the two administrations of the questionnaire; concurrent validity was established against the criterion measure of three 24 h food recalls per participant, which included two weekdays and one weekend day.
Participants
In total, eleven Department of Education and Training primary schools in three regional areas on the north coast of the Australian state of New South Wales (NSW) were invited to participate in the study. These schools were chosen as they had the highest enrolment of Aboriginal and Torres Strait Islander children in their area.
Aboriginal and Torres Strait Islander and non-Indigenous parents and children in Years 5 and 6 at the selected schools in two areas were invited to consent to participate in the study; in the third area only Aboriginal and Torres Strait Islander parents and children were invited to ensure sufficient Aboriginal and Torres Strait Islander participation. AHW (Aboriginal and Torres Strait Islander people who are employed to work with Indigenous communities regarding all aspects of health care) coordinated the information and consent process within their own communities. In total 219 Aboriginal and Torres Strait Islander children and 562 non-Indigenous children were invited to participate.
Data collection procedures
Researchers recorded demographic information on each child including their sex, date of birth and Indigenous status. Height and weight were measured from which BMI (kg/m2) was calculated(Reference Cole, Bellizzi and Flegal19), and this information used in the assessment of plausibility of the data.
The SFFQ was adopted from the Dietary Intake Assessment Tool (DIAT) developed in Queensland for use with older primary and adolescent Australian children(Reference Flood, Webb and Rangan12) and included measures of recent ‘usual’ daily or weekly food intake. Minor modifications were made to some short questions by the research team to reflect current recommendations regarding food intake(20) and to include some foods identified as important by Aboriginal and Torres Strait Islander and non-Indigenous rural child and parent focus groups conducted previously in another phase of this programme of research with participants of the same age and from the same schools as those in the present study. To complete the SFFQ children were seated in a large group, given an introduction to the questionnaire, particularly regarding estimating amount and frequency of foods, and members of the research team (in a ratio of at least one assistant to five children) were available to assist participants.
The 24 h recalls were conducted as face-to-face individual interviews with each participant during school time. Prompts such as food models and food packaging were used to assist children’s recall.
The plausibility of participants’ reported nutrient intake (either implausibly low or high) as measured by 24 h recall was assessed using Goldberg(Reference Goldberg, Black and Jebb21) cut-offs for energy intake for reported physical activity level as described by Black(Reference Black22).
Measures
The SFFQ consisted of three demographic questions, twenty-eight short questions on usual food intake (three on food type, six on quantity and nineteen on frequency of consumption), two questions to clarify intake of sugar and other foods not listed, and four questions on food purchasing behaviour at school canteen and on way to/from school. The number of response categories per short question ranged from four to seven, and in the frequency questions category levels ranged from never to two or more times daily.
The multiple-pass 24 h recall method(Reference Johnson, Driscoll and Goran23) was used by research assistants, including AHW, who had been trained in the technique by the study research nutritionist. The details of each 24 h recall were recorded during the interview on an information sheet designed for the purposes of our study and in consultation with the AHW.
Aboriginal and Torres Strait Islander children
Culturally appropriate support was provided to Aboriginal and Torres Strait Islander children throughout the study. Central to this was the high-profile role of the AHW, who lived in the participating communities and were employed on the project to facilitate recruitment of Aboriginal and Torres Strait Islander children and support their completion of all study procedures. AHW liaised with schools; co-presented the introductory sessions; supported completion of the SFFQ; took height and weight measurements; administered the 24 h recalls to all Aboriginal and Torres Strait Islander children; and provided support to families and communities as needed.
Ethics approval for the study was provided by the NSW Hunter Area Health Service, the NSW Mid North Coast Area Health Service, the University of Newcastle, the NSW Department of Education and Training, and the Aboriginal Health and Medical Research Council of NSW. Parental informed consent and child assent was a requirement for participation.
Statistical methods
Reproducibility
The database was initially created in the SAS statistical software package version 9·1 (SAS Institute Inc., Cary, NC, USA). Quadratic weighted(Reference Brenner and Kliebsch24) and simple kappa coefficients(Reference Kirkwood and Sterne25) were calculated to examine the reliability of the short questions. Response categories were collapsed where the number of respondents for the category on both occasions of questionnaire completion was less than eight (and where doing so did not impinge on the capacity of the question to supply meaningful information). The kappa statistics were interpreted according to strength of agreement categories defined by Landis and Koch(Reference Landis and Koch26).
Direct validity
As the present study sought to establish the capacity of the SFFQ to assess consumption levels of food ‘groups’ only, the validation procedure involved comparing categorical data (from the SFFQ) and continuous data (24 h recall); thus the following statistical methods were used.
The short questions were validated against the multiple 24 h recalls using data from the questionnaire completed on the first occasion. Each participant required three recalls (one of which was a weekend day) to be included in the analysis. Each multiple 24 h recall and each participant’s height and weight data were entered into Foodworks Professional version 4 (Xyris Software Australia Pty Ltd, Brisbane, QLD, Australia), using AusNut 1999 as the nutrient database(27). Each food item in the recall database was linked with a specific short question from the questionnaire. Each takeaway meal occasion was coded for occasion of meal as well as for each item in the meal. Mixed food items were each allocated a proportion, which was then included in the relevant recall food group calculations for weight and frequency.
The mean daily intake of each food was calculated for each individual. The mean daily intake of all food items related to each short question was then calculated per response category for those who selected that category on the short question. The mean weight of takeaway meals was calculated by averaging the weight of each item and mean frequency calculated by averaging the number of takeaway occasions. All food and drink items are reported in both weight (grams) or volume (millilitres) and frequency, and in the present paper the term ‘weight’ refers also to volume as appropriate for drinks.
The data for most short questions were not normally distributed, and the Kruskal–Wallis test(Reference Kirkwood and Sterne25) (using SAS version 9·1) and the <nptrend> command in the STATA statistical software package version 10 (StataCorp LP, College Station, TX, USA) were used to compare the mean daily intake of foods by weight/volume and frequency as measured by the recalls across the response categories for each short question on the SFFQ. The <nptrend> command is an extension of the Wilcoxon rank-sum test(28, Reference Cuzick29). This non-parametric test assesses the existence of an increasing or decreasing trend across the increasing amounts of the survey response categories where there are three or more categories, and is highlighted in the reporting of results. To measure the strength of the association of the two rankings the Kendall tau rank correlation coefficient, which measures the correlation between two ordinal variables, was used(Reference Kendall30, Reference Salkind31). Questions on type of food consumed were examined using t tests (bread) and ANOVA (milk).
We report detailed information on questions for key food groups of interest for children generally and of particular concern to our study population: bread, vegetables, fruit, water, fruit juice, soft drinks, hot chips, crisps/salty snacks and takeaway foods.
Reproducibility and validity were both examined by Indigenous status and gender. Unless otherwise stated, a significance level of 5 % was used. For some questions P values <0·1 are also reported.
The milk type question was not examined by Indigenous status and gender due to sample size limitations. Questions on beans/lentils, traditional foods, soup and soup type and yoghurt recorded low consumption and there were inadequate data available to assess validity of these questions. The two clarifying and four food behaviour questions were either not completed by sufficient participants or implausible, and consequently were not included in the results. Finally a set of twenty-three (two on food type, six on quantity and fifteen on frequency of consumption) questions were available for validity data assessment.
Results
All eleven schools approached agreed to participate and the study population comprised 259 children, providing a response rate of 47 % (n 102) of Aboriginal and Torres Strait Islander children and 28 % (n 157) of non-Indigenous children. Of these, 256 children completed at least one 24 h food recall; 241 completed the SFFQ on two occasions two weeks apart and were included in the reproducibility study; and fifty-one had implausible or insufficient recall and/or SFFQ data. Finally 205 participants (seventy-eight Aboriginal and Torres Strait Islander children and eighty-seven boys) with a mean age of 10·8 (sd 0·7) years completed the first survey, had usable food recall data and were included in the validity analysis (Fig. 1).
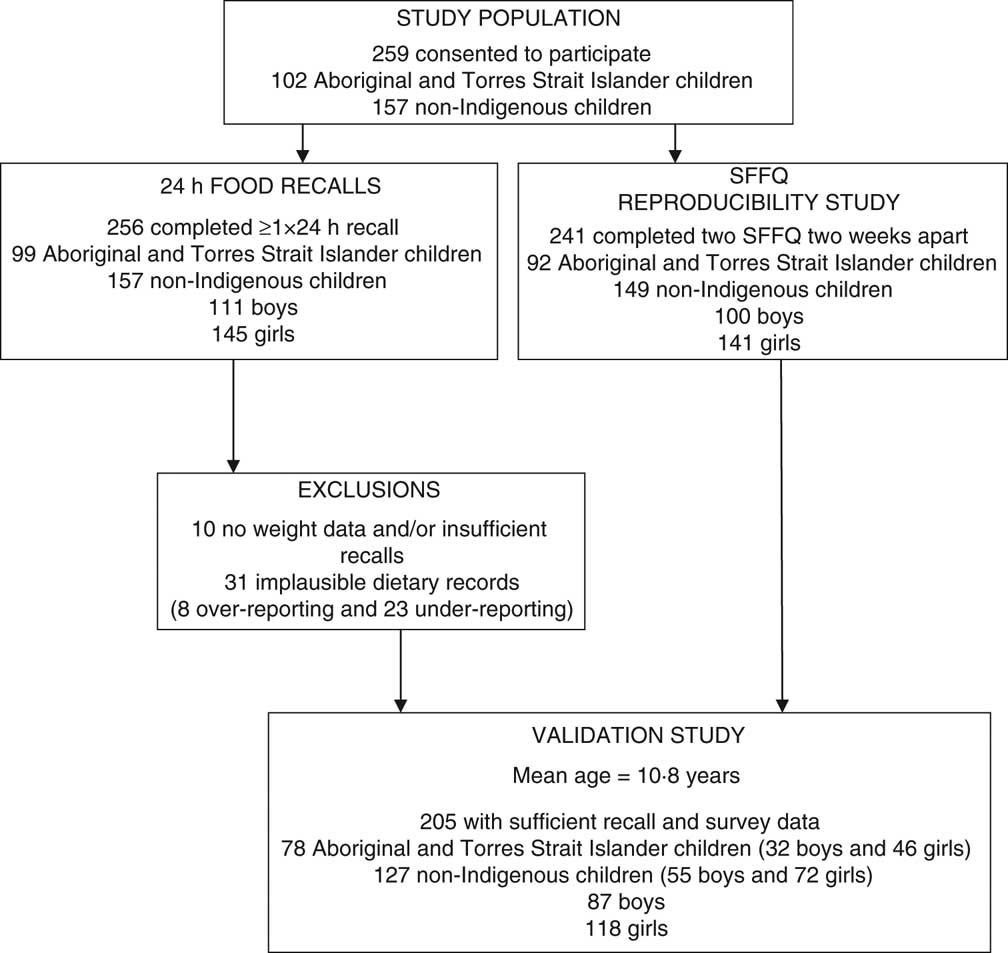
Fig. 1 Study population (SFFQ, short FFQ)
Reproducibility
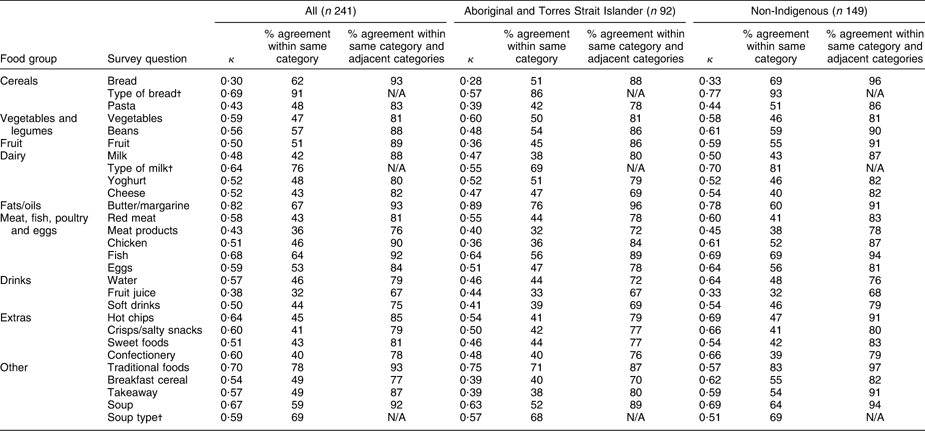
Overall (twenty-six of the twenty-eight short questions), the strength of agreement between the two SFFQ was moderate to good(Reference Landis and Koch26) with one question (butter/margarine) in the very good range with κ = 0·82 (Table 1). The observed proportion of agreement within the same category and within adjacent categories including the same ranged from 32 % to 91 % and from 75 % to 93 %, respectively (Table 1). Among all the children, the questions with good agreement were those on type of bread and milk, frequency of fish, hot chips and crisps/salty snacks, confectionery, soup and traditional foods. All key food group questions achieved moderate to good reproducibility.
Table 1 Reproducibility of short questions: quadratic weighted or simpleFootnote † kappa coefficientsFootnote ‡ and percentage agreement for all children and by Indigenous status
N/A, not applicable.
† Simple κ, the remainder being quadratic.
‡ κ < 0·20 indicates poor agreement; κ = 0·21–0·40 indicates fair agreement; κ = 0·41–0·60 indicates moderate agreement; κ = 0·61–0·80 indicates good agreement; κ = 0·81–1·00 indicates very good agreement.
Agreement between the two surveys was good for both Aboriginal and Torres Strait Islander and non-Indigenous children, with twenty-two questions being in the moderate to good/very good range for Aboriginal and Torres Strait Islander children and twenty-five questions in the moderate to good range among non-Indigenous children. For Aboriginal and Torres Strait Islander children the observed proportion of agreement within the same category and within adjacent categories including the same ranged from 32 % to 86 % and from 67 % to 96 %, respectively (Table 1).
Questions that demonstrated good agreement for Aboriginal and Torres Strait Islander children included fish, traditional foods, soup and margarine/butter, and those for non-Indigenous children were type of bread, type of milk, margarine/butter use, chicken, fish, hot chips, crisps/salty snacks and soup.
The survey demonstrated good reproducibility for both boys and girls; twenty questions among the boys and twenty-one questions among the girls showed moderate to good agreement. The κ statistic for repeated measures ranged from 0·29 to 0·69 for boys and from 0·23 to 0·72 for girls (data not shown).
Direct validity
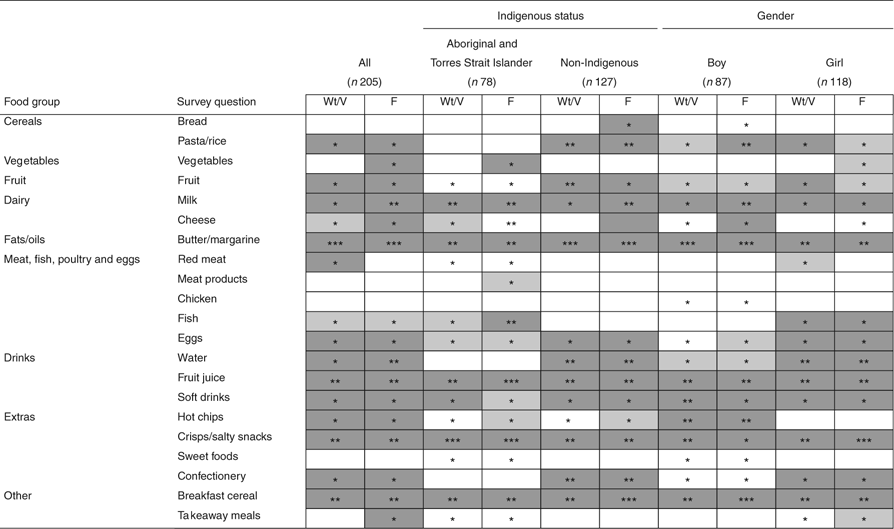
Sixteen of the twenty-one questions on quantity or frequency demonstrated statistically significant increasing trends for mean daily intake as response categories increased (fifteen showing moderate to good reproducibility). The Kendall tau rank correlation coefficients (assessing the strength of the association between the measures) ranged mostly between 0·15 and 0·32, demonstrating weak to moderate correspondence between the methods as the survey short question response categories increased (Table 2). When examining the questions on type of food consumed (bread and milk) the response categories for white bread and whole milk demonstrated a statistically significant association with mean daily intake as recorded on 24 h recall (Table 3).
Table 2 Non-parametric trend P value and Kendall tau correlation coefficient for short food frequency questionsFootnote † (weight/volume and frequency) by Indigenous status and gender
Wt, weight; V, volume; F, frequency.
† Type questions are reported elsewhere.
![]() , P ≥ 0·10;
, P ≥ 0·10; ![]() , P ≥ 0·05 to <0·10;
, P ≥ 0·05 to <0·10; ![]() , P < 0·05.
, P < 0·05.
![]() , Kendall τ < 0·1;
, Kendall τ < 0·1; ![]() , Kendall τ ≥ 0·1 to <0·2;
, Kendall τ ≥ 0·1 to <0·2; ![]() , Kendall τ ≥ 0·2 to <0·3;
, Kendall τ ≥ 0·2 to <0·3; ![]() , Kendall τ ≥ 0·3 to ≤0·45.
, Kendall τ ≥ 0·3 to ≤0·45.
Table 3 Mean daily intake (95 % confidence interval) by recall (g) categorised by response to short questions on milk and bread type
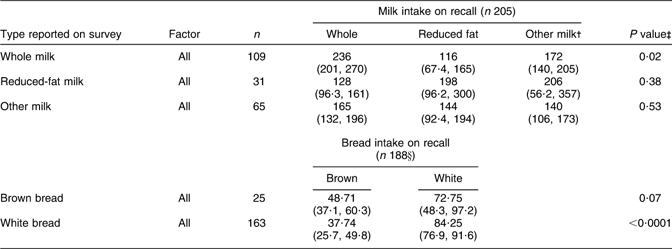
†All other types of milk including flavoured milk, which is consumed frequently (51 % of ‘other’ category; data not shown).
‡ANOVA (milk) and t test (bread).
§Those who selected ‘other’ or ‘not sure’ on the survey were not included in this analysis.
Questions which demonstrated statistically significant increasing trends for mean daily weight and frequency as the response categories on the short questions increased were pasta/rice, fruit, milk, butter/margarine, eggs, water, fruit juice, soft drinks, hot chips, crisps/salty snacks, confectionery and breakfast cereal. The questions on vegetables, cheese and takeaway foods demonstrated statistically significant increasing trends for mean daily frequency only, and red meat for mean daily weight only. Other questions demonstrated a marginally non-significant trend (P ≥ 0·05 to <0·10) and these were cheese (weight) and fish (weight and frequency).
Regardless of Indigenous status, the short questions on milk, cheese, butter/margarine, fruit juice, soft drinks, crisps/salty snacks and breakfast cereal demonstrated significant increasing trends for mean daily weight and/or frequency (with the trend for soft drinks frequency being marginally non-significant (P = 0·08) for Aboriginal and Torres Strait Islander children).
Thirteen questions demonstrated significant increasing trends (P < 0·05) for mean daily weight and/or frequency for non-Indigenous children, eleven showing moderate to good reproducibility. Of the nine questions demonstrating significant increasing trends (P < 0·05) for mean daily weight and/or frequency for Aboriginal and Torres Strait Islander children, eight showed moderate to good reproducibility including the key questions of vegetables, soft drinks and crisps/salty snacks.
Although more questions demonstrated a statistically significant trend (P ≤ 0·05) for non-Indigenous children, an equivalent number of short questions showed both a correlation >0·2 and a statistically significant trend (P < 0·05) in both groups, particularly for frequency. More short questions demonstrated a marginally non-significant trend (P ≥ 0·05 to <0·10) for Aboriginal and Torres Strait Islander (five questions) than for non-Indigenous children (one question), for which smaller sample size may be a contributor.
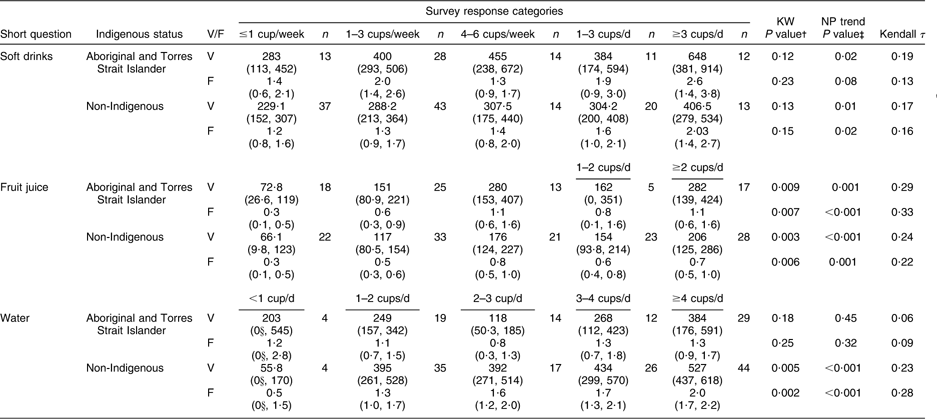
Tables 4, 5 and 6 provide detailed recall data for the response categories of selected food survey items by Indigenous status. Regardless of Indigenous status, all drink short questions showed statistically significant increasing trends for mean daily weight and/or frequency and modest correlation between the measures as the response categories increased, with the exception of the question on water for Aboriginal and Torres Strait Islander children which showed very weak correlation between measures and no statistically significant trends (Table 4).
Table 4 Mean daily volume and frequency of drinks (95 % confidence intervals) from multiple 24 h recalls (g) categorised by response to a short dietary question on soft drink, fruit juice and water by Indigenous status
V, volume; F, frequency.
†Kruskal–Wallis statistic.
‡Extension of the Wilcoxon rank-sum test.
§Values less than 0 are truncated to 0.
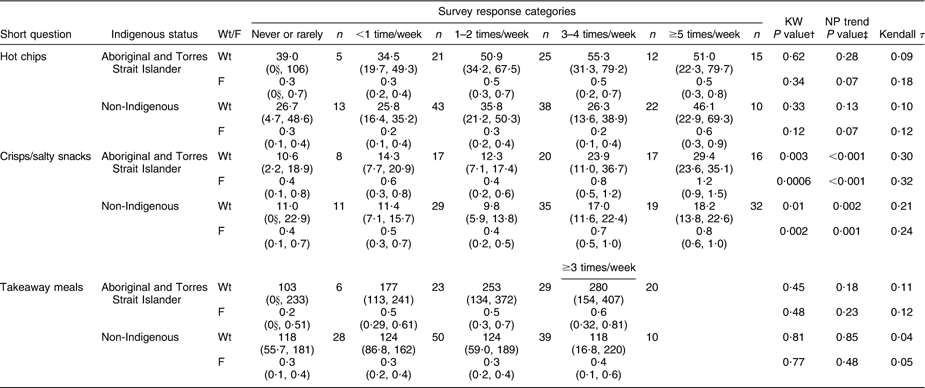
Table 5 Mean daily weight and frequency of foods (95 % confidence interval) from multiple 24 h recalls (g) categorised by response to a short dietary question on hot chips, takeaway meals and crisps/salty snacks by Indigenous status
Wt, weight; F, frequency.
†Kruskal–Wallis statistic.
‡Extension of the Wilcoxon rank-sum test.
§Values less than 0 are truncated to 0.
Table 6 Mean daily weight and frequency of foods (95 % confidence interval) from multiple 24 h recalls (g) categorised by response to a short dietary question on servings of fruit and vegetables by Indigenous status

Wt, weight; F, frequency.
†Kruskal–Wallis statistic.
‡Extension of the Wilcoxon rank-sum test.
§Values less than 0 are truncated to 0.
The short question on takeaway meals showed no statistically significant trends by Indigenous status across the survey response categories; that on crisps/salty snacks demonstrated a significantly increasing trend for both Aboriginal and Torres Strait Islander and non-Indigenous children; and the question on hot chip consumption showed a marginally non-significant trend for frequency only for all children (P = 0·07; Table 5).
The fruit question demonstrated a statistically significant increasing trend for mean daily weight and frequency for non-Indigenous children; the vegetable question showed a significant increasing trend for frequency for Aboriginal and Torres Strait Islander children only and modest correlation (Table 6).
Statistically significant increasing trends for weight and/or frequency were reported for nine of the SFFQ questions for boys and twelve for girls. Of these, five showed moderate to good reproducibility for boys and seven for girls. The questions on fruit, fish, eggs, water and confectionery showed statistically significant increasing trends for weight and/or frequency for girls only, and those on cheese (frequency) and hot chips (weight and frequency) for boys only.
Among those who reported on their survey that they ate white bread, there was a significant difference (P ≤ 0·0001) towards eating more white (mean intake 84 g) than brown (mean intake 38 g) bread. Those who reported eating brown bread had a higher mean white bread intake (73 g of white compared with 49 g brown) although this did not reach statistical significance, P = 0·07). Those who reported consuming whole milk had a statistically significantly higher mean daily intake of whole milk (236 ml) relative to reduced-fat milk (116 ml; P = 0·02). There was no significant difference found in type of milk consumed for those reporting reduced-fat or other types of milk on the survey (Table 3).
Questions on meats, chicken and bread frequency rarely attained a statistically significant trend across the response categories by gender or by Indigenous status.
Among all children the consumption amounts measured by the 24 h recalls differed from the amounts specified by the response categories in some short questions (e.g. soft drinks, hot chips and takeaway food questions) and this difference appeared to be more so for Aboriginal and Torres Strait Islander children. Among these questions all children reporting in the lower response categories tended to consume higher quantities according to the recalls than indicated from the SFFQ; for example, children reporting to consume only 1 cup of soft drinks or less per week on their SFFQ consumed approximately 1 cup per day according to their recalls. Regardless of the response category all children consumed lower quantities of fruit according to their recalls, and for all but the first category all children consumed lower quantities of vegetables.
Discussion
Reproducibility and validity
The present study is the first one to determine the reproducibility and validity of an Australian SFFQ for Australian rural children aged 10 to 12 years, particularly for Australian Aboriginal and Torres Strait Islander rural children. This SFFQ showed overall moderate to good reproducibility and good validity with statistically significant trends or t tests for most questions for all children, demonstrating that those who reported more frequent intakes consumed more of the food group than those who reported less frequent intakes. It should be noted that data obtained from this SFFQ are not reflective of actual intake (with reported food intake differences apparent between the measures) and consequently comparisons with quantitative targets such as the proportion meeting dietary guidelines are not advisable. This SFFQ can be used in studies that aim to monitor and/or evaluate dietary aspects of health programmes within a given population.
The results indicated equivalence between the numbers of questions demonstrating good validity for both Aboriginal and Torres Strait Islander and non-Indigenous children. Provided appropriate cultural support is given, those who administrator this SFFQ may have equal confidence in results obtained from questions demonstrating good validity regardless of Indigenous status. Actual consumption quantities may vary by Indigenous status; however, no statistical tests were undertaken in the study to examine this observation and further investigation is required.
Reproducibility results obtained in the present study, although higher than in some other international studies(Reference Field, Peterson and Gortmaker32), were similar to most other studies of dietary recall questionnaires(Reference Cade, Burley and Warm17, Reference Rockett, Wolf and Colditz33) including those of similar age (κ values from 0·31 to 0·86 and observed proportion of agreement of 39 % to 87 %)(Reference Vereecken and Maes34, Reference Moore, Tapper and Clark35) as well as in rural and ‘ethnically diverse’ populations(Reference Buzzard, Stanton and Figueiredo36, Reference Field, Colditz and Fox37).
Comparison with other studies
FFQ validity studies vary considerably in the number, scope and type of questions examined(Reference Cade, Burley and Warm17); there are few studies that focus on SFFQ and none could be located that used the same statistical methods, with most choosing to use correlation coefficients to measure agreement(Reference Cade, Burley and Warm17) rather than other methods examining sensitivity to trend. Many studies of FFQ in youth demonstrated fair to moderate validity(Reference Field, Peterson and Gortmaker32, Reference Vereecken and Maes34, Reference Moore, Tapper and Clark35). Another study concluded that their short questions were valid for ranking subjects only(Reference Field, Colditz and Fox37).
Two reports have been published in Australia which address the validity of some short questions, including questions similar to those in our study (vegetables, fruit, fruit juice, hot chips, crisps, bread and milk), although study populations differed, being adults and 18-month-old children(Reference Flood, Webb and Rangan12, Reference Riley, Rutishauser and Webb38). Both reported that mean intakes, as measured by dietary intake assessments such as weighed food records and 24 h recalls, were statistically significantly different (P < 0·05) across the response categories of the short questions examined. They also noted that consumption quantities increased across the categories; however, no statistical tests were performed to examine this ‘trend’.
Validity of key food questions, particularly with Australian Aboriginal and Torres Strait Islander children
The drink questions all demonstrated good validity within Aboriginal and Torres Strait Islander and non-Indigenous groups with the notable exception of the question on water for Aboriginal and Torres Strait Islander children. Unlike fruit juice and soft drinks water is not always consumed from a container, and many children in the Australian summer season when the current study was conducted reported drinking regularly from a bubbler (water fountain) at school, a glass or a refillable water bottle. This may result in difficulties for all children in estimating consumption quantities on both recall and SFFQ, and possibly more so for Aboriginal and Torres Strait Islander children, as AHW reported that although children possess water bottles at home they may not frequently carry them and will ‘drink from a tap when they need water’. The poor validity of the water question among this population may also reflect infrequent consumption, which has been noted to reduce children’s capacity to accurately recall the amount consumed(Reference Livingstone, Robson and Wallace15, Reference Baranowski and Domel16). Additional short questions or an alternative method of assessing the validity of this question may be more useful.
Infrequent consumption may also explain the poor validity of the fruit question for Aboriginal and Torres Strait Islander children relative to all other groups (mean intake in some categories was around half that of their non-Indigenous counterparts, although this difference has not been tested statistically) and to some other studies(Reference Edmunds and Ziebland39–Reference Mikkelsen, Sjurdur and Rasmussen41). Community focus groups conducted in another component of this programme of research reported that due to lesser financial means and the cost of these food items, fruit and vegetable purchases in rural Aboriginal and Torres Strait Islander communities are limited(Reference Cochrane42), and it has been reported that consumption levels in the general population are strongly positively associated with home availability(Reference Gallaway, Jago and Baranowski43). The poor validity results for the vegetable question overall may be related to difficulties in estimating serving size in our primary-school-aged population(Reference Livingstone, Robson and Wallace15, Reference Moore, Tapper and Clark35).
The question on crisps/salty snacks performed well, with recall possibly assisted by these pre-packaged food items being readily identifiable by our population. The hot chips and takeaway meals questions did not perform strongly, with the poor validity of the latter question possibly a factor of the known relationship between very frequent occurrence in the diet, as exhibited by our population, and poorer recall(Reference Baranowski and Domel16, Reference Livingstone and Robson44).
Limitations
A selection bias exists in our study with relatively low and differential participation rates of 47 % for Aboriginal and Torres Strait Islander children and 28 % for non-Indigenous children, the latter rate due to no follow-up in the recruitment process for non-Indigenous children. There is also the possibility of a differential Hawthorne effect, with Aboriginal and Torres Strait Islander children potentially over- or under-reporting due to involvement of the local Aboriginal and Torres Strait Islander communities and AHW. However, we believe that the involvement of the Aboriginal and Torres Strait Islander community addressed a pre-existing inequity where Aboriginal and Torres Strait Islander children, due to a lack of appropriate cultural support, underperformed on tasks devised and supervised by the dominant culture. Although not nutritionists, the AHW received training in the skills required to interview children for 24 h recall and very importantly are experts in their community and culture.
Both the SFFQ and the comparison measure used in the current validation study relied on child self-report and reporting errors may therefore be magnified(Reference Livingstone, Robson and Wallace15, Reference Moore, Tapper and Clark35). Dietary assessment methods such as the 24 h recall are commonly used as a reference method in validation studies(Reference Cade, Burley and Warm17, Reference Riley, Rutishauser and Webb38), including children’s(Reference McPherson, Hoelscher and Alexander45), despite possibly being influenced by the retention interval, interview format, prompts used and correlates such as gender, BMI and age(Reference Baxter14). To mitigate against this we used the mean of three 24 h recalls to provide more robust data from this method, which may be more appropriate to use cross-culturally and with low-income participants(Reference Rockett, Berkey and Colditz10) as well as with those who may be cautious about engaging in a study or for whom literacy is an issue(Reference Cade, Burley and Warm17).
The present study was undertaken in summer and reproducibility and validity have been examined for that season only. The SFFQ asks about ‘recent usual intake’ and suggests that ‘recent’ may be ‘over the past month’. Some children may therefore have included foods in their survey responses that were not captured on the 24 h recalls, which were administered following completion of the second SFFQ. In addition, the setting for data collection differed, (large group v. individual interview for the SFFQ and 24 h recall data collection, respectively) and this may have resulted in differing levels of recall between methods for participants.
Conclusions
This SFFQ is the first dietary evaluation tool whose validity and reliability have been examined with Australian Aboriginal and Torres Strait Islander rural children. Most short questions show moderate to good reproducibility and many also demonstrate statistically significant increasing trends for both non-Indigenous and Aboriginal and Torres Strait Islander rural children, for whom culturally appropriate support must be provided. Many short questions in this SFFQ are able to discriminate between different categories of food intake, providing information on reported consumption levels (not actual) within a given population, and can be used to monitor and/or evaluate population-wide health programmes, including those with Aboriginal and Torres Strait Islander children.
Acknowledgements
The authors would like to acknowledge the participating Aboriginal communities. This study was supported by grants from the following bodies: Telstra Foundation; Diabetes Australia; Eli Lilly; Commonwealth Government of Australia Department of Health and Aging; and the NSW Aboriginal Health Promotion Community grants scheme. The authors declare that they have no competing interests. J.D.G. and V.M.F. contributed to conception and design of the study. J.D.G., N.T. and J.C. collected the SFFQ and 24 h recall data. J.D.G., V.M.F., C.A.D. and J.R.A. contributed to data analysis. J.D.G. drafted the manuscript. All authors were involved in the preparation of the final manuscript.


