INTRODUCTION
Emerging infectious diseases in wild animals are not only a threat to domestic animal and human health, but also to sustaining global biodiversity [Reference Altizer1]. Disease has been implicated in the decline of a number of threatened species, such as the black-footed ferret (Mustela nigripes) [Reference Thorne and Williams2], the Ethiopian wolf (Canis simensis) [Reference Laurenson3] and a number of amphibian species on several continents [Reference Garner4]. The accidental or deliberate translocation of wildlife species has the inherent risk of exposing native wildlife species to exotic infectious agents [Reference Daszak, Cunningham and Hyatt5]. Besides introducing new diseases that may cross-over to native species, introduced species can also act as reservoir hosts for alien pathogens resulting in disease-mediated competition for susceptible native species [Reference Hudson and Greenman6]. The most common predisposing factors for such diseases to cause population decline or local extinction are small pre-epidemic population sizes and the presence of reservoir hosts [Reference de Castro and Bolker7].
It can be difficult to demonstrate whether disease-mediated competition rather than an alternative mechanism causes a species to decline in the presence of a superior competitor [Reference Tompkins and Hudson8]. In the case of red squirrels in the UK, the introduced North American grey squirrel (Sciurus carolinensis) causes the decline of the native red squirrels (Sciurus vulgaris) in the absence of disease [Reference Wauters9–Reference Gurnell13]. In addition, it has also been suggested that the presence of the squirrelpox virus (SQPV) in red and grey squirrels in the UK has led to disease-mediated competition between the two species with grey squirrels acting as a reservoir host [Reference Sainsbury14–Reference Sainsbury17]. Red squirrels infected by SQPV develop exudative erythematous dermatitis and ulceration with some lesions covered by haemorrahagic crusts. Lesions are commonly located around the eye, nose, mouth, genital region and on the digits [Reference Scott, Keymer and Labram18–Reference Sainsbury and Gurnell20]. SQPV in red squirrels has a high mortality rate and death occurs within 2–3 weeks of infection [Reference Tompkins16]. Seroprevalence of SQPV in grey squirrels in the UK is high [Reference Sainsbury15]. Grey squirrels do not normally exhibit any clinical signs following infection [Reference Sainsbury15, Reference Tompkins16]; in fact only one grey squirrel has been reported with pathological signs associated with a SQPV-like virus [Reference Duff, Scott and Keymer21].
In areas where grey squirrels are seropositive for SQPV, the rate of decline of red squirrels is in the order of 20 times faster than in areas where SQPV is absent [Reference Rushton10], reinforcing the idea that the grey squirrel is a reservoir host of SQPV [Reference Sainsbury14]. Understanding the dynamics of an infectious disease can offer important insights into how parasite–host systems operate [Reference Altizer1], and despite the potentially devastating impact of SQPV on the remaining red squirrel populations in Britain, little is known about its epidemiology. Moreover, the presence of SQPV in invading grey squirrels could seriously compromise current red squirrel conservation efforts. These efforts are focused on the creation of conservation refugia, which in many cases are in close proximity to populations of grey squirrels known to be seropositive for the disease agent. Attempts to manage red squirrel populations are severely hampered by a lack of understanding of the mode of transmission of SQPV. In red squirrels, an absence of seasonality of SQPV outbreaks suggests that a direct rather than vector-borne transmission route is more likely [Reference Sainsbury14, Reference Sainsbury17]. We define direct transmission as any transmission route that does not involve a third organism besides the virus and squirrels. Physical contact and environmental contamination are therefore both types of direct transmission. Further circumstantial evidence for a direct transmission route between red squirrels is provided by the temporal patterns of SQPV disease epizootics in translocated red squirrels [Reference Carroll22]. The way grey squirrels transmit SQPV to other squirrels is likely to differ from how red squirrels transmit the virus, as red squirrels may shed scabs containing virus particles from the lesions they develop [Reference Sainsbury14]. Understanding the transmission route from grey squirrels to red squirrels is particularly important, since grey squirrels may have the potential to repeatedly re-infect red squirrel populations.
In order to investigate the epidemiology of SQPV in grey squirrels, we examined the impact of season, weather, sex and body weight on grey squirrel SQPV antibody status using data on the serological status of grey squirrels derived from culling grey squirrels at the red/grey squirrel interface zone in northern England and southern Scotland. We used a combination of Generalized Linear Modelling and Structural Equation Modelling to investigate the relationship between seropositive status and the variables.
METHODS
Study area
The study area encompassed the counties of Cumbria and Northumberland in northern England and the western side of the Scottish Borders (Fig. 1). Cumbria and Northumberland were chosen as they represent the main red/grey squirrel interface zone in England with known presence of SQPV in both species [Reference Sainsbury17]. Southern Scotland is currently being invaded by grey squirrels moving south from the populations in the central belt of Scotland and also by grey squirrels moving into the Scottish Borders from northern England. Until recently, grey squirrels in Scotland were seronegative for SQPV [Reference Sainsbury15, Reference McInnes23]. The occurrence of the first seropositive grey squirrels in the Scottish Borders near Newcastleton in 2005 and the subsequent pattern of northwards expansion of seropositive animals [Reference McInnes23] suggest that SQPV spread into Scotland with infected animals originating from northern Cumbria. In order to include grey squirrel samples that originated from SQPV-exposed grey squirrel populations, all available grey squirrel blood-sample results for Scotland submitted to the Moredun Research Institute (MRI) (as described below) were plotted on a map and the geographical extent of seropositive grey squirrels in the Scottish Borders was identified. This area was then incorporated into the study area.
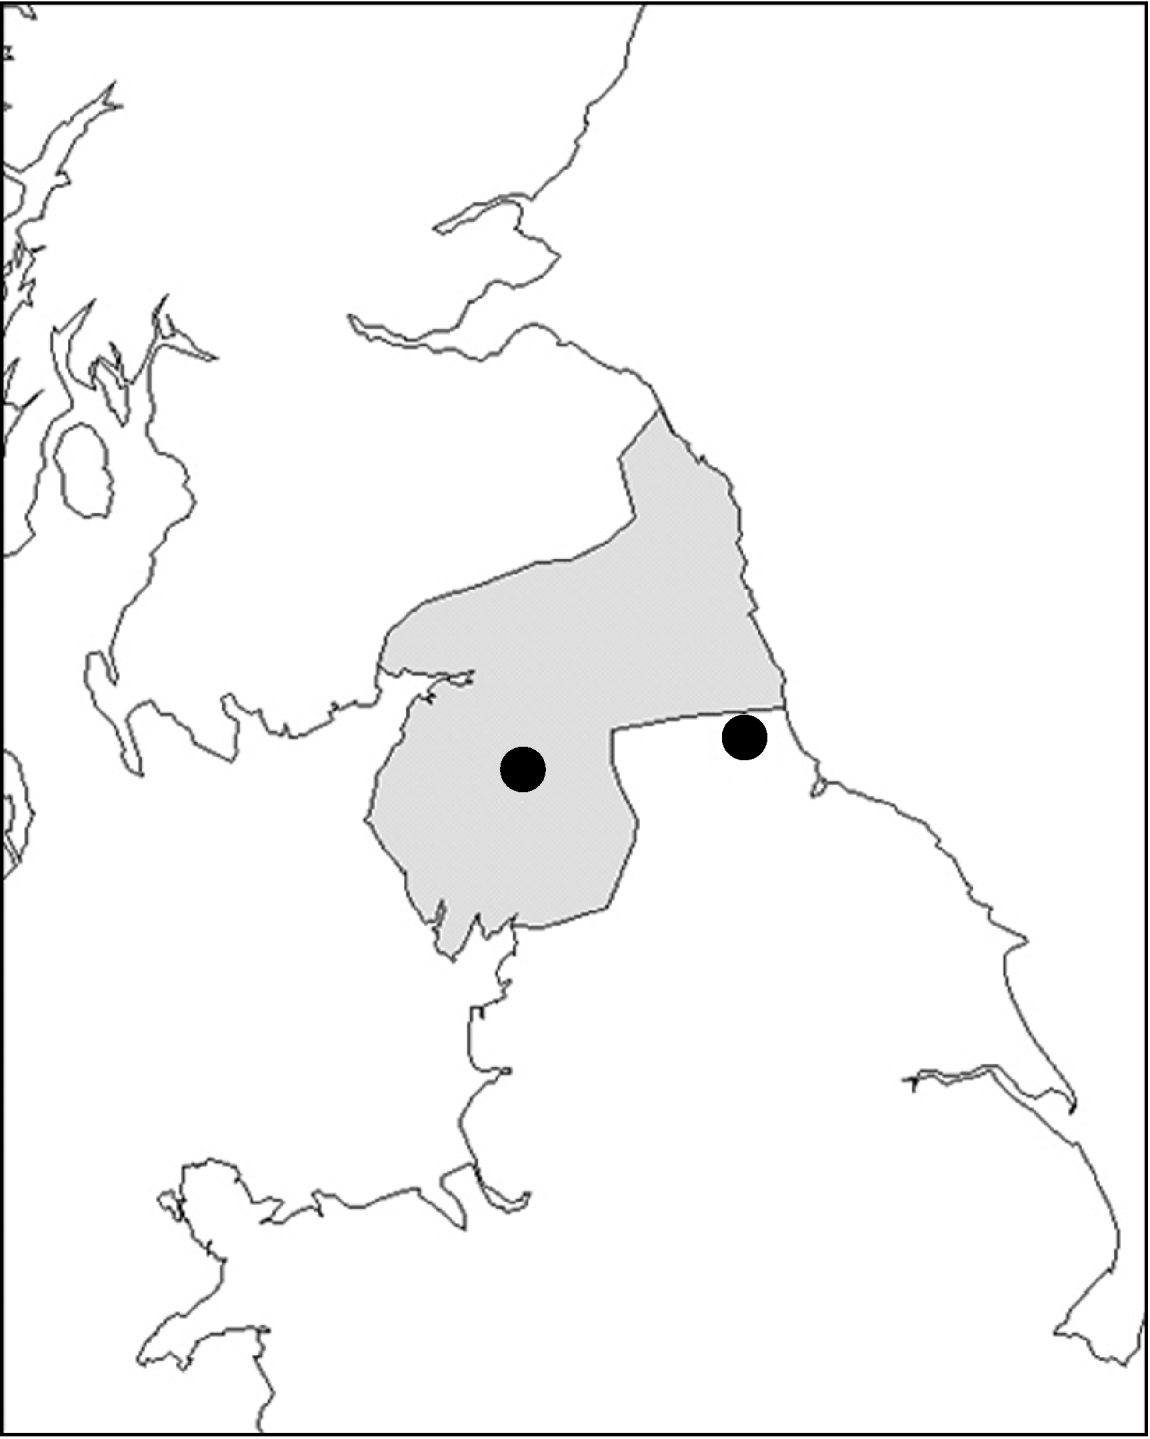
Fig. 1. Study area (![]() ) in northern England and southern Scotland with location of weather stations (•).
) in northern England and southern Scotland with location of weather stations (•).
Serology
As part of a SQPV surveillance scheme in grey squirrels initiated by the MRI, Edinburgh, red squirrel conservation projects requested local grey squirrel controllers within the study area to collect grey squirrel blood samples during cull operations. The majority of controllers were volunteers whose aim was to help with red squirrel conservation in their area. Data collection was therefore opportunistic. Grey squirrels were either shot or live-trapped and humanely dispatched before extracting blood samples [Reference Mayle, Pepper and Ferryman24]. Grey squirrel controllers were asked to submit blood samples to the MRI for analysis. This study utilized samples taken between February 2002 and February 2009 for which sex and body-weight information were available. Blood samples were tested for SQPV antibodies by direct enzyme-linked immunosorbent assay (ELISA) developed at the MRI as described in Sainsbury et al. [Reference Sainsbury15]. The cut-off point for a positive result was a corrected optical density of 0·2 [Reference Sainsbury15].
Data analysis
Binary logistic regression was used to investigate the relationship between presence of SQPV antibodies in blood samples and the following variables: sex, body weight, monthly average minimum temperature, monthly average maximum temperature, monthly total rainfall (mm), monthly total days of air frost and ‘season’. We used cosine and sine functions of time with a period of 12 months as harmonic covariates to investigate the impacts of seasonality [Reference Stolwijk, Straatman and Zielhuis25].
Weather data were obtained from the Meteorological Office website (www.metoffice.gov.uk/climate/uk/stationdata) using data from the Newton Rigg (Penrith) weather station for records from Cumbria and the Borders and data from the Durham weather station for records from Northumberland (Fig. 1).
Logistic regression was undertaken as a Generalized Linear Model (GLM) in R (R Foundation for Statistical Computing, Austria). Models were compared using Akaike's Information Criteria (AIC). Receiver Operating Characteristic plots (ROC) were used to assess model fit.
Model comparisons were undertaken for all combinations of the following parameters: sex, body weight, sex/body-weight interaction, ‘season’ and the four weather parameters.
Investigating the variables in terms of only direct effects on SQPV antibody status using GLMs is likely to give an incomplete picture of the mechanisms that influence the dynamics of the system. Extrinsic and intrinsic variables may also interact and affect the disease dynamics through indirect effects. Direct and indirect effects may also have opposite effects, resulting in a zero net effect [Reference Farji-Brener26]. Path analysis, a form of Structural Equation Model (SEM), is a technique that allows investigation of indirect effects [Reference Wootton27]. In path analysis the overall correlation among variables is partitioned into direct effects of one variable on the other, indirect effects mediated by other variables, and spurious effects due to common causes [Reference Palomares28–Reference Elmhagen and Rushton31]. Path analysis was used to investigate the relationship among the predictor variables and SQPV antibody status. Path diagrams showing the causal relationships among all variables in the system, based upon a priori knowledge of the relationships, was constructed for the full model, representing the working hypothesis about the causal relationships among variables [Reference Palomares28, Reference Smith, Brown and Valone29, Reference Mitchell32]. After testing the a priori models for each variable, we then compared this model with simpler models from which non-significant pathways were removed until a best fit model was obtained (the parsimonious model). The goodness of fit was assessed using χ2 (where a significant χ2 statistic, P<0·05, indicates that the model was not supported by the data), the root mean square error approximation (RMSEA, significant at P<0·05) and Bentler's comparative fit index (CFI). Values of CFI ranged between 0 and 1 with values of >0·9 indicating an acceptable fit of the model to the data [Reference Palomares28, Reference Mitchell32, Reference Blanc and Walters33].
RESULTS
Proportion of seropositive animals
The overall proportion of seropositive grey squirrels in this study was 53% (n=505). Males were more likely to be seropositive than females and the proportion of seropositive animals increased with weight class. Although sampling was opportunistic, the available data contained similar proportions of male and female grey squirrels and represented different weight categories (Fig. 2).
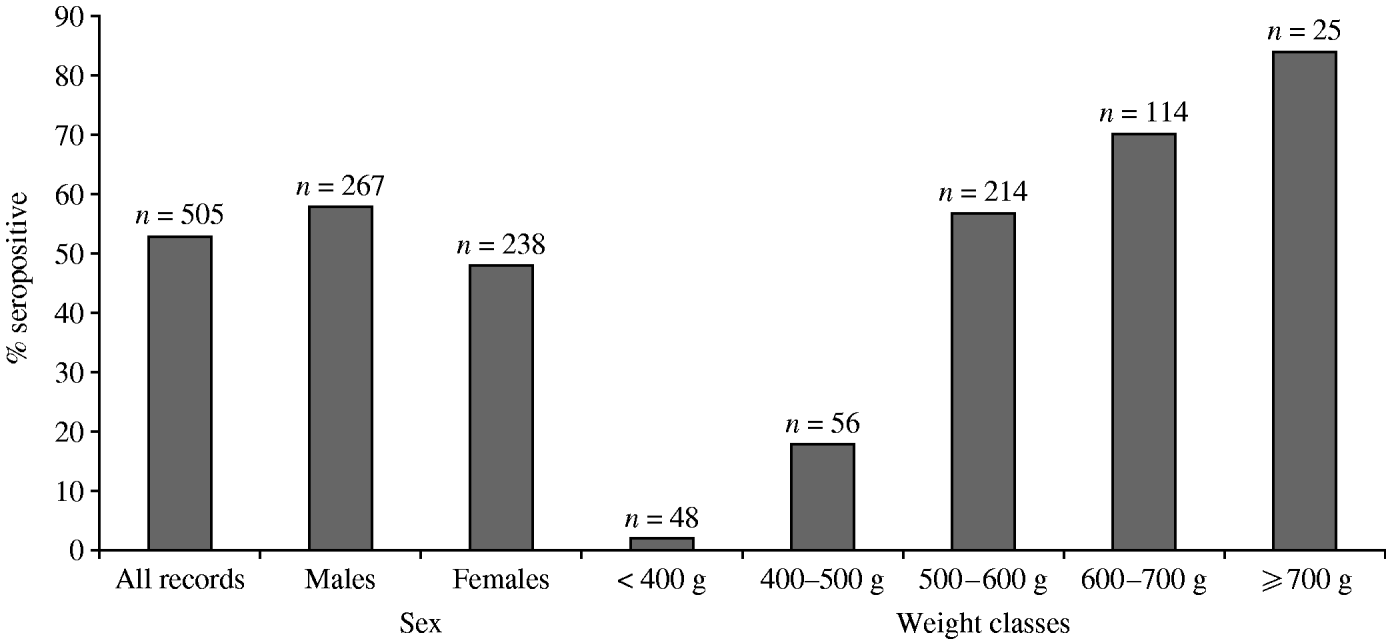
Fig. 2. Proportion of grey squirrels in this study testing seropositive to SQPV antibodies.
Generalized Linear Model
The full model was also the best model using the information theoretic approach (Table 1). For the harmonic variables representing ‘season’, cosine continuous month was significant but sine continuous month was not. All remaining variables were significant at P<0·05 with the exception of rain (P=0·069). Males were more likely to be seropositive than females (note that the negative sign on the coefficient for sex is caused by the inclusion of the sex/body-weight interaction). Rain and maximum temperature were negatively associated and body weight, minimum temperature and frost were positively associated with the presence of SQPV antibodies. The AUC value of the ROC plot was 0·82 (Table 1).
Table 1. Results from logistic regression with Akaike's Information Criteria (AIC) values and area under curve (AUC) value from the resulting Receiver Operating Characteristic plot
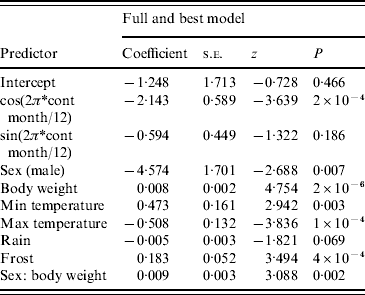
AIC=536·99, AUC=0·82.
Table 2. Parameter estimates from the structured equation modelling analysis of the pathways for the full model
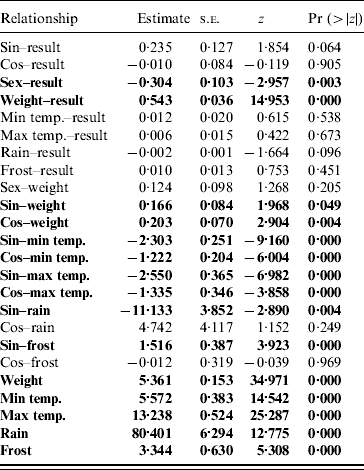
Significant pathways at P<0·05 level are highlighted in bold.
There was a strong association between body weight and SQPV antibody presence in grey squirrels, which was particularly pronounced in males (Fig. 3). The rate of change in seroprevalence in males was initially low until about 400 g, then seroprevalence rose sharply until it levelled off again around 600 g. No information on breeding status was submitted with blood samples and data for female squirrels were likely to include a proportion of pregnant animals. There were seasonal trends with a peak in spring and a low in autumn of seropositive animals (Fig. 4).
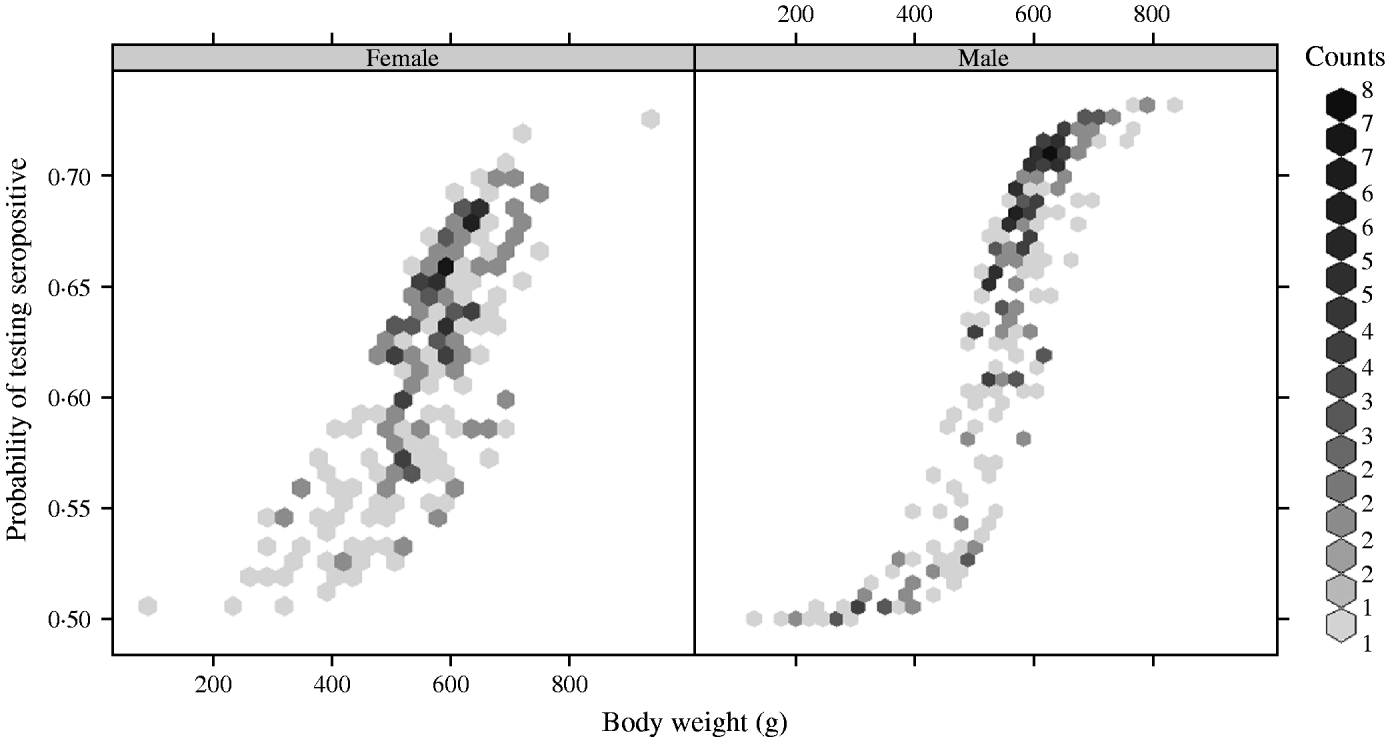
Fig. 3. Fitted probability of grey squirrels testing seropositive to SQPV antibodies in relation to body weight and based on the full/best Generalized Linear Model.
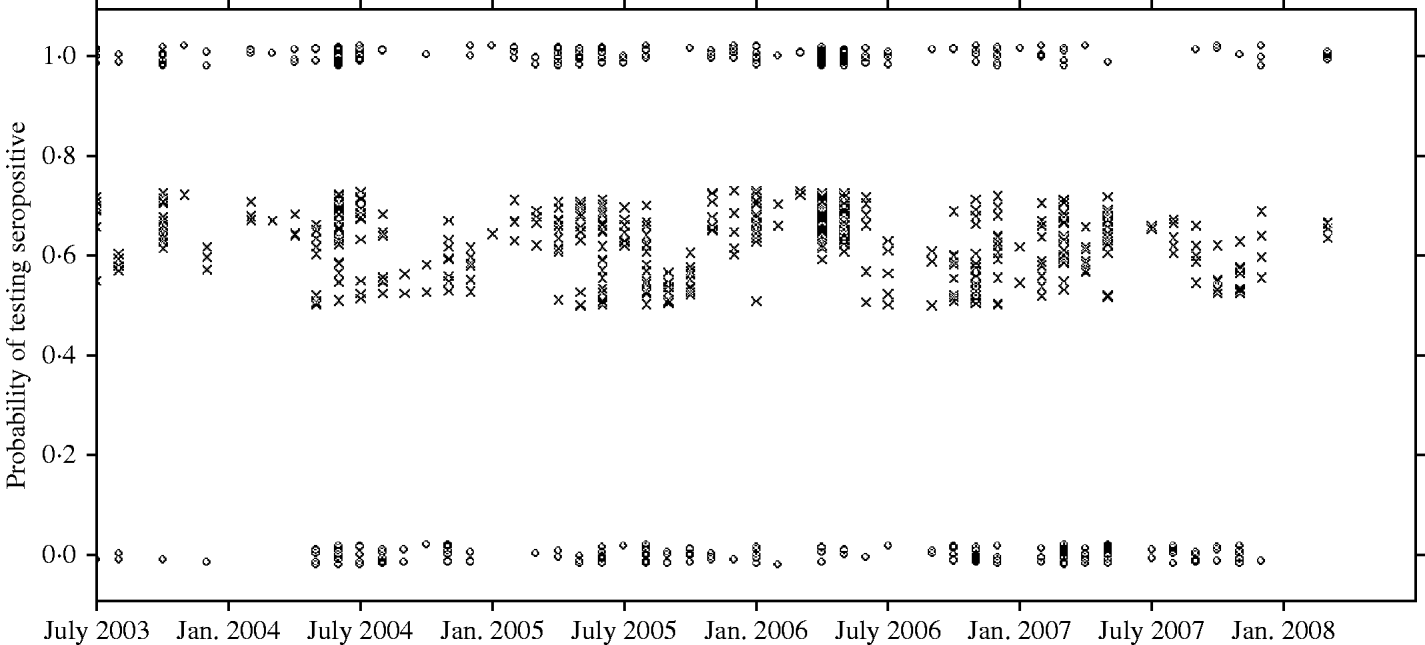
Fig. 4. Observed results (○) and fitted probability (×) of grey squirrels testing seropositive to SQPV antibodies over time and based on the full/best Generalized Linear Model. Note the observed data are jittered to allow representation of multiple points at y=0 and 1.
Structural Equation Models
The path diagram with causal relationships for the a priori and parsimonious model are shown in Figure 5. Arrows represent direct effects of one variable on another. The magnitude of the path coefficient (standardized regression coefficient) shows the degree to which predictor variables directly influence the criterion variable with all other variables held constant. Arrows not originating at a variable indicate residual (unexplained) variance. The parameter estimates for the models are given in Table 2. The model statistics, χ2, RMSEA and CFI all indicate that the causal scheme of the a priori path diagram is not an adequate description of the data (Fig. 5a).
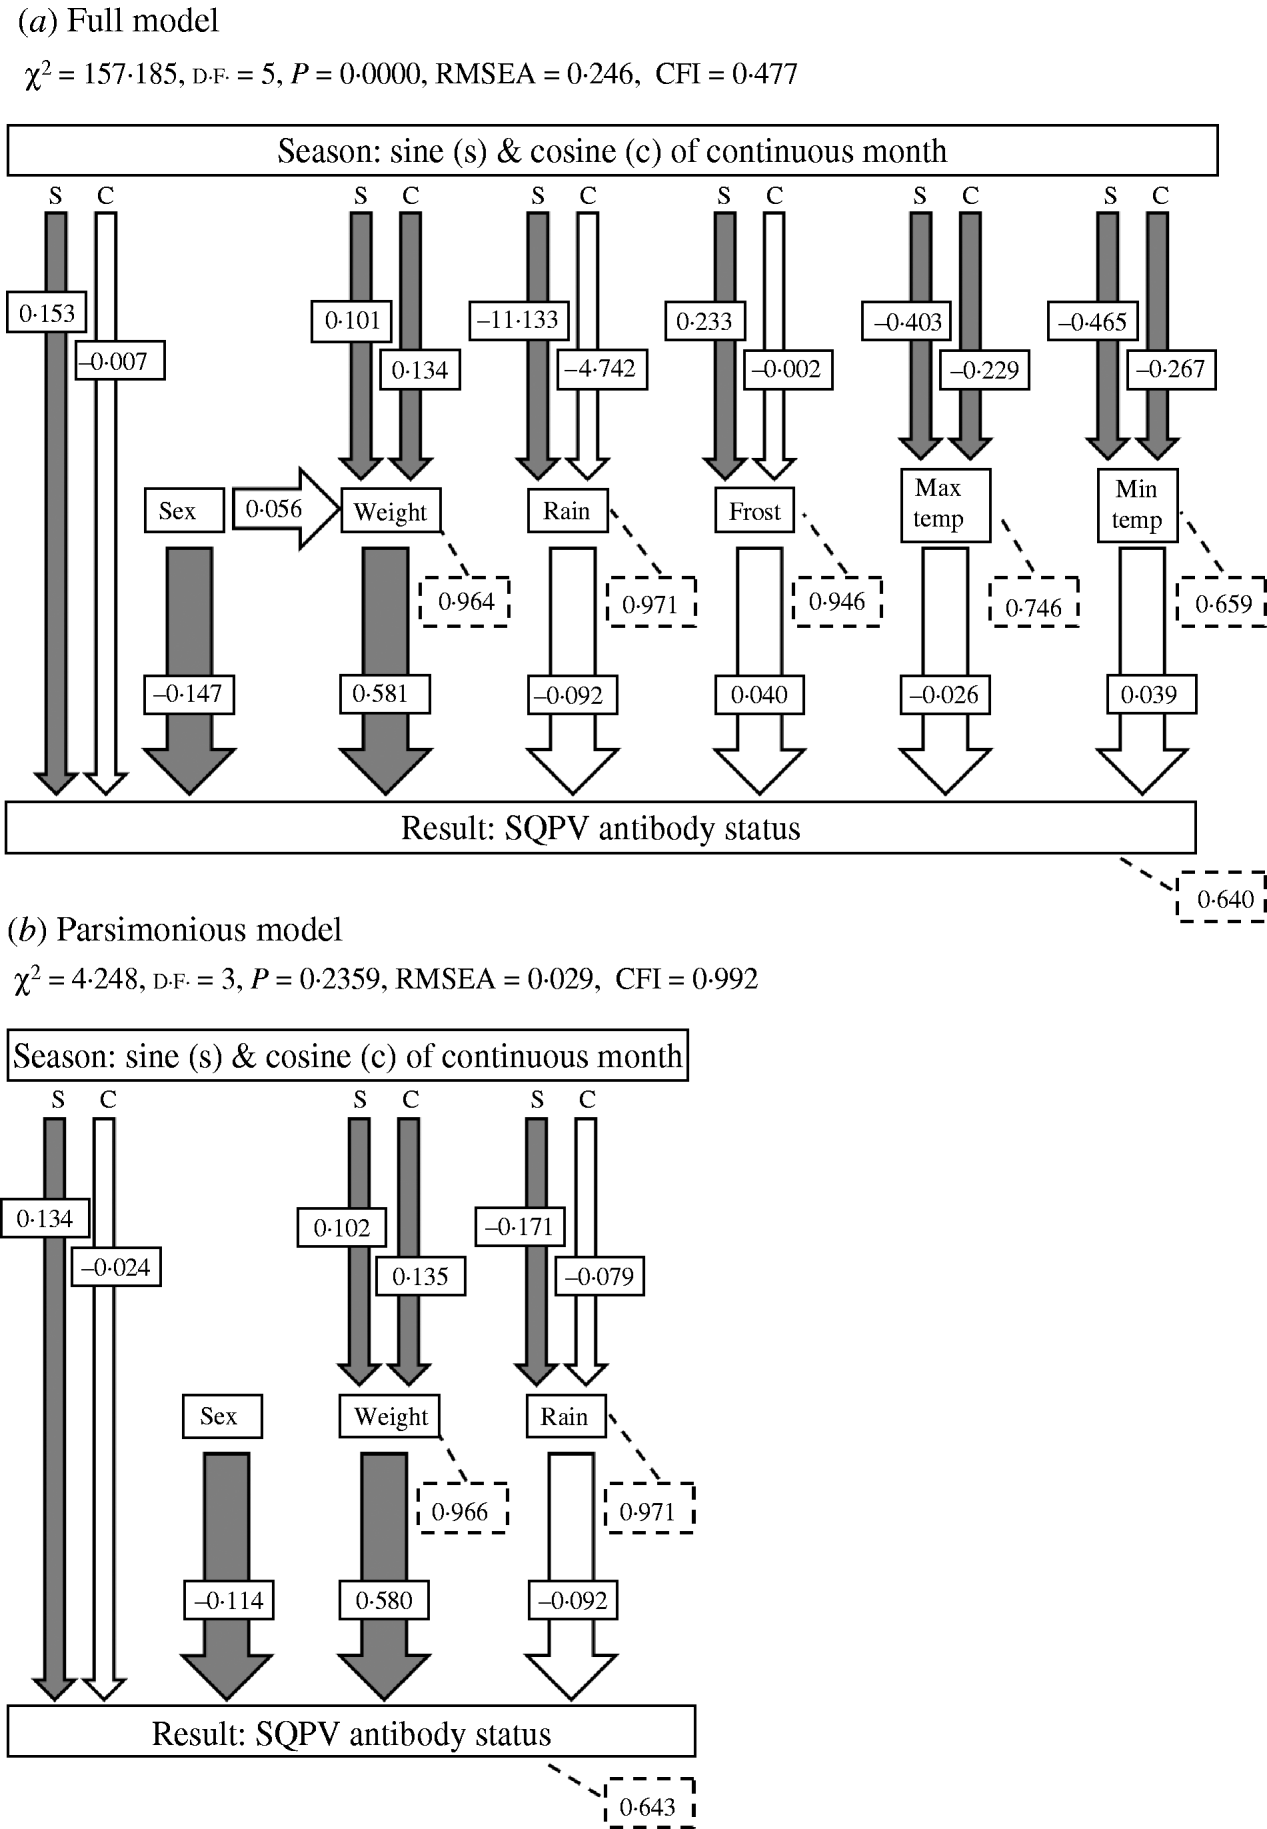
Fig. 5. The a priori models used in path analyses and summaries of path analysis results: (a) full model and (b) parsimonious model. Arrows indicate causal paths and path coefficients. Filled arrows indicate a significant causal path. Dashed boxes indicate the residual errors for the response variables. χ2, chi square value; d.f., degrees of freedom; RMSEA, root mean square error of approximation; CFI, Bentler's Comparative Fit Index.
None of the pathways from weather parameters to SQPV antibody status were significant. Removing minimum temperature, maximum temperature and frost resulted in the parsimonious model (Fig. 5b). The pathways from sine continuous month, sex and body weight to SQPV antibody status were significant. Also significant are sine and cosine continuous month on body weight, indicating that season influenced SQPV antibody status indirectly through body weight. χ2, RMSEA and CFI values all indicate that the parsimonious model adequately described the data. However, the model still only explained 36% of the variation in SQPV antibody status.
For the GLM, the best-fit model included all weather parameters. The SEM indicated that this is not due to a direct impact of weather on the SQPV antibody status, but to seasonal fluctuation in the weather parameters coinciding with the seasonal variation in body weight which directly influences SQPV antibody status.
The best model for the GLMs contained the ‘season’ variables, although not at the traditional significance level of P<0·05 for both ‘season’ variables. Also for the SEMs, only one of the two ‘season’ variables were significant, indicating that the seasonal patterns observed is mainly explained by squirrel body weight.
DISCUSSION
The analysis of the prevalence patterns for SQPV antibodies in grey squirrels at the red/grey interface zone in northern England/southern Scotland revealed a seasonal oscillation and a sex- and body-weight-biased infection rate. It should be noted that a seropositive status does not necessarily indicate that the animal is currently infected or infectious. It is unknown how long grey squirrels remain seropositive after exposure to SQPV and for what period of time they are infectious.
The observed male-biased SQPV antibody prevalence may be due to behavioural differences between males and females. Male home ranges tend to be larger than female home ranges [Reference Thompson34–Reference Gurnell37] and increase in size in spring when food supply is low and breeding activity high [Reference Thompson34, Reference Smith36]. Males may wander well outside their normal home range in search of females in heat [Reference Gurnell37, Reference Thompson38]. The increased area that male squirrels cover may result in a higher likelihood of male squirrels encountering a source of SQPV infection.
Differences in space use between age classes may explain the observed rise in seroprevalence with body weight, as the body weight of grey squirrels is partly related to age, as well as to food availability that fluctuates throughout the year and between years [Reference Gurnell39, Reference Kenward and Tonkin40]. Adult squirrels, particularly males, tend to have larger home ranges than juveniles [Reference Don41]. The greatest increment in size in juvenile grey squirrel home ranges is between 90 and 120 days after birth and the maximum home ranges size is reached at around 180 days after birth [Reference Thompson34]. At 90 days after birth, grey squirrels weigh roughly 300 g increasing to up to 500 g at 180 days after birth [Reference Shorten42, Reference Shorten43]. The increase in home-range size with body weight matches the rise in the proportion of seropositive grey squirrels with body weight (Fig. 4). Moreover, the rise in the proportion of seropositive animals around 400–500 g may represent young dispersing animals in the autumn with exposure to the virus in the environment or through involvement in agonistic behaviour with resident adult animals [Reference Thompson34, Reference Taylor35, Reference Don41, Reference Allen and Aspey44, Reference Ferryman, Mayle and Morgan45]. The autumn dispersal period also coincides with the observed seasonal rise in seroprevalence from autumn to winter. The levels of seroprevalence therefore correlate with weight/age-related increases in space-use patterns and thus an increased probability of encountering the virus.
The rise in seroprevalence does not coincide with the time of year when one would expect increased parasite burdens, indicating that a direct mode of transmission is more likely than vector-borne transmission. Direct transmission routes can involve physical contact between grey squirrels, e.g. fighting or mating, as well as environmental contamination particularly at focal points in space, e.g. scent marking posts, common dreys or feeding stations. The probable infection of a red squirrel through a handling cone that was previously used on a SQPV-exposed red squirrel provides further indication the virus can be spread through environmental contamination [Reference Carroll22]. If environmental contamination can arise from an infectious grey squirrel, this has implications for red squirrel management techniques. Caution is advisable when undertaking any management that brings red and grey squirrels into contact or attracts them to joint focal points, such as trapping or supplementary feeding. The design of red squirrel captive-breeding enclosures in areas with SQPV-exposed grey squirrels also needs to consider the threat of environmental contamination. The evidence regarding captive red squirrels in outdoor cages being infected with SQPV when free-ranging seropositive grey squirrels are in the vicinity is equivocal. For example, caged red squirrels at the Welsh Mountain Zoo did not become infected by the virus over a 9-year period despite the presence of seropositive grey squirrels in the area that were seen climbing on the cages [Reference Jackson, Collins and Cooper46]. However, some of the captive red squirrels did succumb to the virus after they were released into the wild. In contrast, captive red squirrels in outdoor cages at Thetford Forest with seropositive grey squirrels in the area became infected with SQPV (J. Gurnell, unpublished data) as did red squirrels at Munchester Castle (T. Warburton, personal communication). The latter would support the idea of environmental contamination of red squirrel cages with virus particles deposited by grey squirrels, but this is only conjecture. The fact that red squirrels at the Welsh Mountain Zoo did not become infected while in outdoor cages does not contradict the idea of environmental contamination but highlights our lack of knowledge with regard to the epidemiology of the virus in grey squirrels and the viability of potentially deposited virus particles in the environment. Furthermore, grey squirrels coming into contact with the cages may have been seropositive, but that does not necessarily indicate that they were infectious. Thus further research is required on viral contamination of the environment by grey squirrels and how red squirrels pick up the virus particles. Disentangling the various different factors impacting on the dynamics of SQPV in grey squirrels is difficult due to the interdependence of variables. The SEM indicated that the significant impact of the weather parameters shown in the GLM is not due to a direct impact on SQPV antibody status. This demonstrates that structural equation modelling in conjunction with GLMs allows exploration of causal links of predictor variables in relation to the response variable. While SEM sheds some light on the possible causal relationships between the variables, our model still only explained 36% of the variation in SQPV antibody status. In reality, many more variables are likely to directly or indirectly influence the dynamics of SQPV in grey squirrels, such as habitat type, food availability, squirrel densities, squirrel behaviour, human intervention (e.g. through trapping and feeding) and dynamics of other potential host populations. Sampling for this study was opportunistic and further explorations of impacts on SQPV status in grey squirrels may require a move to strategic sampling techniques. Future studies should focus on the effect of population densities which vary between seasons due to the impact of breeding and food availability. Food availability also affects population densities between years and between habitat types. Population densities and habitat type can influence encounter rates through, e.g. varying feeding behaviour, agonistic behaviour, scent marking and common use of dreys. In order to help interpret findings of this and future studies, it is vital to investigate the amount of time grey squirrels are infectious after exposure to the virus and how long animals remain seropositive.
Grey squirrels and SQPV provide a bleak prospect for red squirrel conservation in the UK, yet our understanding of the epidemiology of SQPV in grey squirrels is rudimentary. This study has provided some valuable, preliminary results in terms of seasonality and potential transmission routes. However, further research into SPQV is essential to help safeguard remaining red squirrel populations.
ACKNOWLEDGEMENTS
We thank the grey squirrel controllers in the study area for submitting grey squirrel blood samples and the current and previous Red Squirrel Project Officers in Cumbria, Northumberland and southern Scotland as well as Scottish Natural Heritage for their role in obtaining samples. We are grateful to the staff of the Virus Surveillance Unit at the Moredun Research Institute for testing the squirrel blood samples. We also thank Helen Schwantje, Marc Artois and an anonymous reviewer for providing valuable comments on the manuscript.
DECLARATION OF INTEREST
None.


