Hostname: page-component-745bb68f8f-grxwn Total loading time: 0 Render date: 2025-01-12T05:23:12.728Z Has data issue: false hasContentIssue false

Active noise control of a supersonic underexpanded planar jet guided by resolvent analysis

Published online by Cambridge University Press:  05 December 2024

Long-Long Liang
Affiliation:
Department of Modern Mechanics, University of Science and Technology of China, Hefei 230027, PR China
Zhen-Hua Wan*
Affiliation:
Department of Modern Mechanics, University of Science and Technology of China, Hefei 230027, PR China
Ming-Xuan She
Affiliation:
Department of Modern Mechanics, University of Science and Technology of China, Hefei 230027, PR China
Peng-Jun-Yi Zhang
Affiliation:
Department of Modern Mechanics, University of Science and Technology of China, Hefei 230027, PR China
De-Jun Sun
Affiliation:
Department of Modern Mechanics, University of Science and Technology of China, Hefei 230027, PR China
Xi-Yun Lu
Affiliation:
Department of Modern Mechanics, University of Science and Technology of China, Hefei 230027, PR China
*
Email address for correspondence: wanzh@ustc.edu.cn

Abstract

This study is dedicated to achieving efficient active noise control in a supersonic underexpanded planar jet, utilizing control parameters informed by resolvent analysis. The baseline supersonic underexpanded jet exhibits complex wave structures and substantial high-amplitude noise radiations. To perform the active control, unsteady blowing and suction are applied along the nozzle inner wall close to the exit. Employing both standard and acoustic resolvent analyses, a suitable frequency and spanwise wavenumber range for the blowing and suction is identified. Within this range, the control forcing can be significantly amplified in the near field, effectively altering the original sound-producing energetic structure while minimizing far-field amplification to prevent excessive noise. A series of large-eddy simulations are further conducted to validate the control efficiency, demonstrating an over 10 dB reduction in upstream-propagated screech noise. It is identified that the present unsteady control proves more effective than steady control at the same momentum coefficient. The controlled jet flow indicates that the shock structures become more stable, and the stronger the streamwise amplification of the forcing, the more likely it is to modify the mean flow characteristics, which is beneficial for reducing far-field noise radiation. Spectral proper orthogonal decomposition analysis of the controlled flow confirms that the control redistributes energy to higher forcing frequencies and suppresses large-scale antisymmetric and symmetric modes related to screech and its harmonics. The findings of this study highlight the potential of resolvent-guided control techniques in reducing noise in supersonic underexpanded jets and provide a detailed understanding of the inherent mechanisms for effective noise reduction through active control strategies.

Type
JFM Papers
Copyright
© The Author(s), 2024. Published by Cambridge University Press

1. Introduction

The study of supersonic underexpanded jets is of great significance in aerospace applications. A high-speed shock-containing jet will produce intense noise (Powell Reference Powell1953) that not only affects human health but also may even cause fatigue damage to the nozzle. Therefore, the noise reduction of supersonic underexpanded jets has become particularly important, and research in this area has been incremental to date (Zigunov, Sellappan & Alvi Reference Zigunov, Sellappan and Alvi2022). In recent decades, jet noise control methods have been classified as passive control and active control (Martens & Haber Reference Martens and Haber2008). Passive noise reduction techniques are often simple modifications to existing nozzle geometries, such as chevron nozzles (Nesbitt et al. Reference Nesbitt, Brusniak, Underbrink, Lynch and Martinez2007; Rask, Kastner & Gutmark Reference Rask, Kastner and Gutmark2011), internal corrugations (Seiner, Ukeiley & Jansen Reference Seiner, Ukeiley and Jansen2005; Powers & McLaughlin Reference Powers and McLaughlin2012) and, more recently, lip roughness (Alapati & Srinivasa Reference Alapati and Srinivasa2024). Although passive noise reduction technology has the advantage of being easy to implement and low cost, it can also have a negative impact on aircraft performance and fail to achieve noise reduction over a wide range of operating conditions. In contrast, active control technologies, including plasma (Samimy et al. Reference Samimy, Kim, Kastner, Adamovich and Utkin2007a,Reference Samimy, Kim, Kastner, Adamovich and Utkinb; Prasad & Unnikrishnan Reference Prasad and Unnikrishnan2023Reference Prasad and Unnikrishnan2024b), fluidic (Morris, McLaughlin & Kuo Reference Morris, McLaughlin and Kuo2013; Prasad & Morris Reference Prasad and Morris2020) and synthetic (Tamburello & Amitay Reference Tamburello and Amitay2008) actuators, offer greater attractiveness (Liu, Prasad & Gaitonde Reference Liu, Prasad and Gaitonde2022) and flexibility (Gautam et al. Reference Gautam, Karnam, Mohammed, Saleem and Gutmark2024) in flow and noise control.

Generally, active control technology can be divided into steady and unsteady control. In terms of steady control, numerous studies have been performed on controlling jet noise. Henderson (Reference Henderson2010) reviewed the influence of fluid steady injection on jet noise reduction over the last five decades up to 2010. In the early stage of utilizing fluid injection to reduce jet noise, mass flow rate and injection mesons were used more as control parameters to change the velocity profile as much as possible to achieve noise reduction. Overall sound pressure level (OASPL) reductions over 10 dB were found using water (Norum Reference Norum2004) and foam (Manson & Burge Reference Manson and Burge1971) injection in supersonic jet systems, with mass flow rates of the order of the main jet. These methods, however, may not be suitable for aircraft jet engines due to the additional weight storage requirements. This necessitates further research on compressed air microjet actuators in order to effectively suppress jet noise. Many experimental studies (Arakeri et al. Reference Arakeri, Krothapalli, Siddavaram, Alkislar and Lourenco2003; Greska & Krothapalli Reference Greska and Krothapalli2005; Castelain et al. Reference Castelain, Sunyach, Juvé and Bera2008; Zaman Reference Zaman2010) have shown that air microjet actuators are significantly weaker in reducing jet noise, with OASPL reductions of approximately 2–3 dB. Alkislar, Krothapalli & Butler (Reference Alkislar, Krothapalli and Butler2007) found, in subsonic jet experiments, that the interaction of the injecting jet with the main jet produces counter-rotating vortex pairs, which are bent by the mean flow to form longitudinal vortex pairs (Henderson Reference Henderson2010). The formation of longitudinal vortex pairs can lead to the breakdown of large-scale turbulent structures and enhanced turbulent mixing, thereby reducing turbulent mixing noise. Coderoni, Lyrintzis & Blaisdell (Reference Coderoni, Lyrintzis and Blaisdell2019) also observed streamwise vortices by visualization using $Q$-criterion in the numerical simulation of supersonic jets. The research by Nogueira et al. (Reference Nogueira, Cavalieri, Jordan and Jaunet2019) and Pickering et al. (Reference Pickering, Rigas, Nogueira, Cavalieri, Schmidt and Colonius2020a) indicates that due to the active lift-up mechanism in the jet, streamwise vortices lead to the formation of large-scale streak structures. These large-scale streaks persist downstream and tend to stabilize the Kelvin–Helmholtz (K-H) instability wave packets, thereby suppressing noise generation. More recent efforts (Morris et al. Reference Morris, McLaughlin and Kuo2013; Gautam et al. Reference Gautam, Karnam, Mohammed, Saleem and Gutmark2024) have suggested that injecting air into the divergent section of a convergent–divergent nozzle can more effectively alter the shock pattern and reduce shock-associated noise, with OASPL reductions of approximately 4–6 dB. The application of steady control has yielded certain effectiveness and comprehension in the realm of jet noise reduction. In comparison, there remains a dearth of knowledge regarding unsteady control.

The utilization of unsteady actuators in the noise reduction strategy may offer greater potential, as the incorporation of frequency parameters presents a wider range of possibilities for effectively mitigating noise. Unsteady control typically relies on a small perturbation control strategy, which may make the control technique scalable and cost-effective (Prasad & Unnikrishnan Reference Prasad and Unnikrishnan2024b). The small perturbation-based technique must excite the instability of the jet shear layer; however, determining the appropriate excitation frequency to achieve maximum amplification between forcing and response poses a significant challenge. The utilization of unsteady pulsed jets has been previously explored in order to induce natural jet instabilities (Raman & Cornelius Reference Raman and Cornelius1995; Kibens et al. Reference Kibens, Dorris, Smith and Mossman1999; Ibrahim, Kunimura & Nakamura Reference Ibrahim, Kunimura and Nakamura2002), but none resulted in favourable noise gains. Kibens et al. (Reference Kibens, Dorris, Smith and Mossman1999) noted even a 10 dB increase in noise when unsteady injections with a lower Strouhal number were used on a full-size engine nozzle. Ibrahim et al. (Reference Ibrahim, Kunimura and Nakamura2002) similarly observed an increase in noise in ideally expanded and underexpanded convergent nozzle using pulsed jets with a diameter-based Strouhal number of 0.16 which is close to one of the subharmonics of screeching frequency. Experimental studies (Samimy, Kim & Kearney-Fischer Reference Samimy, Kim and Kearney-Fischer2009; Samimy et al. Reference Samimy, Kim, Kearney-Fischer and Sinha2010Reference Samimy, Webb, Esfahani and Leahy2023) on the active control of jet noise with a wide range of excitation frequencies have shown that high-frequency actuation is more effective in making large-scale coherent structures smaller and less coherent, which is more beneficial for noise reduction. Most recently, Prasad & Unnikrishnan (Reference Prasad and Unnikrishnan2024a) performed numerical studies on imperfectly expanded rectangular jets to analyse the noise reduction effect and mechanism of unsteady plasma actuators. They selected a control Strouhal number of 1, which is close to three times the screeching frequency, based on previous numerical simulations (Prasad & Unnikrishnan Reference Prasad and Unnikrishnan2023) and extensive experiments (Samimy et al. Reference Samimy, Kim and Kearney-Fischer2009Reference Samimy, Kim, Kearney-Fischer and Sinha2010), achieving a noise reduction effect of 4–6 dB. Prasad & Unnikrishnan (Reference Prasad and Unnikrishnan2024a) found that the actuation leads to smaller shock cells, a larger diffusion rate and a thicker shear layer compared with the baseline jet. Therefore, identifying the underlying mechanisms associated with noise reduction using unsteady perturbations necessitates further investigation.

In addition to the forcing frequency, the spatial wavenumbers are also sensitive parameters for exciting shear layer instability (Gaitonde & Samimy Reference Gaitonde and Samimy2010Reference Gaitonde and Samimy2011). Tam & Hu (Reference Tam and Hu2023) anticipated a promising beginning for jet noise reduction and suggested that by exciting instability waves at frequencies and wavenumbers corresponding to the largest global spatial growth, significant impacts on jet noise radiation can be achieved. They found that once effective control is established, finding the optimal frequency and spatial wavenumbers to minimize jet noise becomes particularly important. Currently, the research on unsteady control of high-speed jet noise is relatively scarce. Zigunov et al. (Reference Zigunov, Sellappan and Alvi2022) achieved significant noise reduction by guiding the spatial distribution of steady actuators in experiments using genetic algorithms. Some previous efforts focused on parameter studies of supersonic jet noise control (Kibens et al. Reference Kibens, Dorris, Smith and Mossman1999; Ibrahim et al. Reference Ibrahim, Kunimura and Nakamura2002; Prasad & Unnikrishnan Reference Prasad and Unnikrishnan2024a), merely examining the flow response to forcing frequencies. However, there is a lack of quantitative theoretical support for characterizing the overall frequency response of supersonic underexpanded jets. Moreover, the detailed knowledge of the effective frequency and wavenumber range for controlling supersonic underexpanded jet noise is still limited.

With recent developments, resolvent analysis has become a valuable method for studying the input–output characteristics of fluid flow systems. In the work of Trefethen et al. (Reference Trefethen, Trefethen, Reddy and Driscoll1993), resolvent analysis was first used to study the response of linearly stable flows to deterministic external disturbances, identifying the non-normality of the linearized operator as the cause of transient energy amplification of disturbances. The potential of resolvent approach has gradually been uncovered since McKeon & Sharma (Reference McKeon and Sharma2010) demonstrated that resolvent analysis could reveal structural elements in wall turbulence by treating the nonlinear term in the Fourier-transformed Navier–Stokes equations as an exogenous harmonic forcing. Reduced-order models based on resolvent analysis have also been studied in various flow systems, such as turbulent boundary layers (Bae, Dawson & McKeon Reference Bae, Dawson and McKeon2020), turbulent pipe flow (Sharma et al. Reference Sharma, Moarref, McKeon, Park, Graham and Willis2016; Abreu et al. Reference Abreu, Cavalieri, Schlatter, Vinuesa and Henningson2020) and turbulent jets (Schmidt et al. Reference Schmidt, Towne, Rigas, Colonius and Bres2018; Lesshafft et al. Reference Lesshafft, Semeraro, Jaunet, Cavalieri and Jordan2019). Additionally, resolvent analysis has also been applied to noise modelling (Pickering et al. Reference Pickering, Towne, Jordan and Colonius2020bReference Pickering, Towne, Jordan and Colonius2021b; Bugeat et al. Reference Bugeat, Karban, Agarwal, Lesshafft and Jordan2024). Another exciting recent development is the use of resolvent analysis to guide flow control (Yeh & Taira Reference Yeh and Taira2019; Liu et al. Reference Liu, Sun, Yeh, Ukeiley, Cattafesta and Taira2021). Towne, Schmidt & Colonius (Reference Towne, Schmidt and Colonius2018) demonstrated that the response modes obtained from the resolvent analysis can be viewed as a non-empirical approximation of the spectral proper orthogonal decomposition (SPOD) modes under the assumption of white-noise nonlinear forcing. Nevertheless, the input modes from resolvent analysis offer deep insights into the most amplified flow structures, the most sensitive actuator regions and the most responsive control input parameters (Herrmann et al. Reference Herrmann, Baddoo, Semaan, Brunton and McKeon2021). The resolvent analysis is related to the pseudospectra of a linear operator (Trefethen & Embree Reference Trefethen and Embree2005). Yeh & Taira (Reference Yeh and Taira2019) indicated that for a non-normal operator, a linear pseudoresonance mechanism can also lead to significant amplification of forcing, even when the forcing frequency is far from the spectrum of the operator, demonstrating that the most unstable frequency is not necessarily the one that reduces the noise in the flow field the most. Yeh & Taira (Reference Yeh and Taira2019) have successfully predicted effective frequency and wavenumber ranges based on resolvent analysis for airfoil separation flow control. Similarly, Liu et al. (Reference Liu, Sun, Yeh, Ukeiley, Cattafesta and Taira2021) successfully controlled pressure fluctuations in the flow field based on resolvent analysis in supersonic cavity flow with feedback processes. In many flow control applications, the application prospects of resolvent analysis have been well demonstrated.

The objective of this study is to determine the effective control frequency and wavenumber ranges for mitigating noise in supersonic underexpanded jets, utilizing resolvent analysis as a guiding tool. Moreover, an investigation into the intrinsic mechanisms of noise reduction will be conducted based on high-fidelity large-eddy simulation (LES) data. We begin our investigation by delving into the fundamental flow and acoustic properties of the supersonic underexpanded planar jet. The intense noise motivates us to explore unsteady control strategies to attenuate the jet noise. However, the indiscriminate selection of control parameters could lead to substantial trial-and-error expenses. To mitigate this, resolvent analysis is introduced as a guiding tool for the judicious selection of control parameters. Following this, we utilize the results from LES of the controlled flow to substantiate the efficacy of control strategies informed by resolvent analysis. Additionally, we delve into the influence of control on the fundamental near-field and far-field characteristics, nonlinear interactions and coherent structures.

The remainder of this paper is laid out as follows. The LES set-up, details of the unsteady control and the resolvent analysis method are presented in § 2. The basic flow and acoustic characteristics of the supersonic underexpanded jet, and the input–output properties of the base flow from the resolvent method, are discussed in § 3 to identify the effective control parameter range. The impact of control on the basic near-field and far-field characteristics, screech resonance loop and coherent structures is shown in § 4 to elucidate the noise reduction mechanism. Finally, the main findings are summarised in § 5.

2. Simulation details and analysis methods

2.1. Simulation set-up

In this work, LES of a supersonic underexpanded planar jet is conducted with a Reynolds number based on the nozzle height of $Re_h =\rho _\infty a_\infty h/{\mu _\infty } = 1.86 \times 10^5$, where $\rho _\infty$, $a_\infty$ and $\mu _\infty$ denote the far-field density, sound velocity and molecular viscosity, respectively. The compressible LES governing equations are non-dimensionalized by the nozzle exit height ($h$) and ambient physical parameters ($\rho _\infty$, $a_\infty$, $T_\infty$, $\mu _\infty$). The lip thickness ($\delta _p$) of the jet nozzle is $h/8$. The nozzle design Mach number ($M_d$) is 1, operating under conditions with a nozzle pressure ratio (ratio of internal pressure (${p_e}$) to ambient pressure (${p_\infty }$)) of 2.09. The ideally expanded Mach number $M_j = U_j/a_j$ is 1.55, where $U_j=430.9\ {\rm m}\ {\rm s}^{-1}$ and $a_j=278\ {\rm m}\ {\rm s}^{-1}$ are velocity and sound speeds at ideally expanded conditions of the jet. The momentum thickness of the boundary layer ($\delta _\theta /h$) at the nozzle inlet is $5.0 \times 10^{-3}$. In general, the current jet parameters are very close to the previous experiment of Raman (Reference Raman1997) and numerical simulations of Berland, Bogey & Bailly (Reference Berland, Bogey and Bailly2007) and Ye et al. (Reference Ye, Zhang, Wan, Sun and Lu2020). The results obtained with the current jet parameters show good agreement with experimental and numerical simulation results, as elaborated in our previous study (Liang et al. Reference Liang, Wan, Ye, Zhang, Sun and Lu2023).

High-order finite difference methods are utilized to discretize the compressible governing equations in an in-house compressible flow solver HiResX, which has been validated in various flow systems (Li et al. Reference Li, Ye, Wan, Liu, Sun and Lu2020a; Ye et al. Reference Ye, Zhang, Wan, Sun and Lu2020Reference Ye, Zhang, Wan, Yan and Sun2022). To capture the discontinuities caused by shock waves in the supersonic jet plume, a fifth-order alternative formulation of the weighted essentially non-oscillatory scheme (Jiang, Shu & Zhang Reference Jiang, Shu and Zhang2013) is employed for discretizing the convective fluxes. The derivatives of viscous fluxes are discretized by applying the sixth-order central difference scheme. The subgrid-scale term can be modelled by a wall-adapting local eddy viscosity model (Nicoud & Ducros Reference Nicoud and Ducros1999). The temporal advancement is performed by the three-stage total variation diminishing Runge–Kutta scheme (Shu & Osher Reference Shu and Osher1988) to ensure temporal accuracy. Additionally, all cases were computed on clusters of graphics processing units.

Figure 1 presents the schematic diagram of the computational domain and boundary conditions for numerical simulations. A relatively large computational domain is utilized, with sponge zones set up around the physical domain to prevent spurious reflections at the boundaries. The computational domain extends from $-20h$ to $80h$ in the $x$ direction, from $-25h$ to $25h$ in the $y$ direction and from $-2.5h$ to $2.5h$ in the $z$ direction. The origin of the coordinate system is fixed at the centre of the nozzle exit. The baseline case uses a structured mesh with $62.3\times 10^6$ cells to discretize the computational domain. For the control case, local mesh refinement is applied near the forcing region, resulting in a total of $64.0\times 10^6$ mesh cells. On the solid wall, no-slip adiabatic boundary conditions are used. Riemann characteristic boundary conditions are set on the outflow and transverse boundaries of the computational domain, while the periodic boundary conditions are used in the spanwise direction. Initially, the flow solver is initialized to a static flow condition. For all cases, simulations are performed for 200 dimensionless time units to ensure that turbulence is fully developed, followed by an additional 300 dimensionless time units for statistical analysis. The time step is fixed at $\Delta ta_\infty /h = 8 \times 10^{-4}$. The number of stored instantaneous full three-dimensional (3-D) flow fields is 1000 with a time interval of $0.16$. A total number of 5000 slice snapshots parallel to the $y$ direction are stored with a time interval of $0.04$, to ensure that these data have a sufficient temporal resolution for statistical analysis.

Figure 1. Schematic diagram of computational domain and boundary conditions for numerical simulations (not to scale). (a) Computational set-up for supersonic underexpanded planar jets; (b) magnified view of nozzle; (c) unsteady forcing with the spanwise wavenumber $k_ch=2 {\rm \pi}$.

2.2. Unsteady control set-up

A periodic wall-normal momentum perturbation is introduced by implementing a periodic suction and blowing at the wall to achieve active control of jet noise. The actuator is simultaneously applied on both the upper and lower surfaces of the nozzle in the vicinity of the nozzle exit, centred at $L_a/h=-0.2$ with a width of $L_x/h=0.1$. Here $L_a$ and $L_x$ represent the centre position and streamwise length of the actuator, respectively. The actuators are in-phase. This configuration is illustrated by the red dashed line in figure 1(b). The wall-normal suction and blowing velocity profile follows previous investigations (Liu et al. Reference Liu, Sun, Yeh, Ukeiley, Cattafesta and Taira2021), which is modelled as

(2.1)\begin{equation} v_{jet}(x,z,t) = A\sin ({\omega}_at){\it \varTheta}(x,L_a,L_x) \cos (k_cz), \end{equation}

where $A$ is the forcing amplitude, $\omega _a$ and $k_c$ represent the forcing frequency and spanwise wavenumber, respectively. Here ${\it \varTheta }(x,L_a,L_x)$ is the function describing the imposed spatial velocity distribution, defined as follows:

(2.2)\begin{equation} {\it \varTheta}(x,L_a,L_x) = \tfrac{1}{4}\{1+\tanh [\eta_1(x-L_a+L_x/\eta_2)] \}\{1-\tanh [\eta_1(x-L_a-L_x/\eta_2)] \}, \end{equation}

avoiding velocity discontinuity in the streamwise direction, as shown in figure 1(c). In this study, $\eta _1=2000$ and $\eta _2=2.6$ are chosen. The suction and blowing capability of the actuator is characterized by the unsteady momentum coefficient, defined as

(2.3)\begin{equation} C_{\mu} \equiv \frac{I}{\tfrac{1}{2}{\rho_\infty}{a_\infty^2}L_zh}, \end{equation}

where $I=({\rho _w}/{T_a})\int _{0}^{T_a}\int _{-L_z/2}^{L_z/2} \int _{L_a-L_x/2}^{L_a+L_x/2}v_{jet}^2(x,z,t)\,\mathrm {d}\kern0.06em x\,\mathrm {d}z\,\mathrm {d}t$ is the time-averaged jet momentum, $\rho _w$ is the density at the wall, $T_a=2{\rm \pi} /\omega _a$ is the period of unsteady forcing. In this study, we select two momentum coefficients, $C_\mu =0.0015 (A=33.87\ {\rm m}\ {\rm s}^{-1})$ and $0.0094 (86.38\ {\rm m}\ {\rm s}^{-1})$, to validate the effectiveness of the frequency and wavenumber guided by the resolvent analysis at different amplitudes.

The noise reduction effectiveness is evaluated by the average difference in OASPL between the controlled and baseline flow fields across monitoring points distributed upstream and downstream, which is defined as

(2.4)\begin{equation} \Delta{OASPL_{avg}}=\frac{1}{N_m}\sum_{i=1}^{N_m}(OASPL_{i}^{Controlled}- OASPL_{i}^{Baseline}), \end{equation}

where $(\bullet )^{Controlled}$ and $(\bullet )^{Baseline}$, respectively, represent the variables of the controlled and baseline cases. Here $(\bullet )_{avg}$ is the average value of the variables and $N_m$ is the number of monitoring points arranged in the flow field. As shown in figure 2, the arrangement of monitoring points is relatively extensive, with those marked in green participating in the averaging. Therefore, $\Delta {OASPL_{avg}}$ is considered to be a satisfactory quantitative measure for assessing the effectiveness of noise reduction.

Figure 2. A schematic diagram illustrating the spatial distribution of all monitoring points. The dashed lines indicate the regions of forcing and response for the acoustic resolvent analysis.

2.3. Standard and acoustic resolvent formulation

Resolvent analysis is an operator-based modal decomposition method that characterizes the input–output properties of a dynamic system and analyses the response to harmonic forcing input at a given state. The Reynolds decomposition

(2.5)\begin{equation} \boldsymbol{q}(\boldsymbol{x},t)=\bar{\boldsymbol{q}} (\boldsymbol{x})+\boldsymbol{q^{\prime}}(\boldsymbol{x},t) , \end{equation}

is introduced to partition the flow state variable $\boldsymbol {q}$ into a statistically steady time-averaged component $\bar {\boldsymbol {q}}$ and a fluctuating component $\boldsymbol {q}^{\prime }$. Substituting the Reynolds decomposition of the state variables into the compressible Navier–Stokes equation yields the governing equation for flow field perturbations

(2.6)\begin{equation} \frac{\partial{\boldsymbol{q^{\prime}}}}{\partial t} =\boldsymbol{N}(\bar{\boldsymbol{q}})\boldsymbol{q^{\prime}}+ \boldsymbol{Pf^{\prime}},\end{equation}

where $\boldsymbol {N(\bar {q})}$ is the linearized Navier–Stokes equations operator. Here $\boldsymbol {f^{\prime }}$ is considered to be the external forcing in this study, the $\boldsymbol {P}$ matrix is introduced to restrict forcing to a local range of interest in the flow field or specific forcing components (Bugeat et al. Reference Bugeat, Chassaing, Robinet and Sagaut2019; Farghadan, Martini & Towne Reference Farghadan, Martini and Towne2023).

The set-up of periodic boundary conditions in the spanwise direction allows for time- and spanwise-averaged flow as the base flow $\bar {\boldsymbol {q}}$. The fluctuation $\boldsymbol {q^{\prime }}$ and forcing $\boldsymbol {f^{\prime }}$ can be expressed as a sum of temporal and spanwise Fourier modes, described as (Theofilis Reference Theofilis2003; Yeh & Taira Reference Yeh and Taira2019)

(2.7)\begin{equation} \boldsymbol{q^{\prime}}(\boldsymbol{x},t)= \int_{-\infty}^{\infty}\int_{-\infty}^{\infty} \boldsymbol{\breve{q}}_{\omega,k_z}(x,y)\,{\rm e}^{{\rm i} (k_zz+\omega t)}\,{\rm d}\omega \,{\rm d}k_z ,\end{equation}

and

(2.8)\begin{equation} \boldsymbol{f^{\prime}}(\boldsymbol{x},t)=\int_{-\infty}^{\infty} \int_{-\infty}^{\infty}\boldsymbol{\breve{f}}_{\omega,k_z}(x,y) \,{\rm e}^{{\rm i}(k_zz+\omega t)}\,{\rm d}\omega \,{\rm d}k_z, \end{equation}

where $k_z$ and $\omega$ are the real spanwise wavenumber and angular frequency, respectively. Substituting equations (2.7) and (2.8) into (2.6), the transfer function between the forcing and the response is obtained as follows:

(2.9)\begin{equation} \boldsymbol{\breve{q}}_{\omega,k_z} = [{\rm i}\omega \boldsymbol{I}-\boldsymbol{N}(\bar{\boldsymbol{q}},k_z)]^{-1} \boldsymbol{P}\boldsymbol{\breve{f}}_{\omega,k_z}= \mathcal{R}(\bar{\boldsymbol{q}};\omega,k_z) \boldsymbol{\breve{f}}_{\omega,k_z}, \end{equation}

where $\mathcal {R}(\bar {\boldsymbol {q}};\omega,k_z)$ is called the resolvent operator, $\boldsymbol {I}$ is the identity matrix.

For a stable system, resolvent analysis is most natural (Farghadan et al. Reference Farghadan, Martini and Towne2023). However, for an unstable system, perturbations exhibit exponential growth within a linear framework. Consequently, the input–output characteristics of a dynamic system are masked by unstable frequencies and wavenumber, which is highly detrimental to system control. Here, the exponential discounting approach (Jovanovic Reference Jovanovic2004; Yeh & Taira Reference Yeh and Taira2019; Yeh et al. Reference Yeh, Benton, Taira and Garmann2020; Liu et al. Reference Liu, Sun, Yeh, Ukeiley, Cattafesta and Taira2021) is considered to be incorporated into the unstable base flow, where a temporal damping function ${\rm e}^{-st}$ is multiplied with the primitive variables as $[\boldsymbol {q^{\prime }}_s,\boldsymbol {f^{\prime }}_s]={\rm e}^{-st}[\boldsymbol {q^{\prime }},\boldsymbol {f^{\prime }}]$. Introducing the above discounted variables into (2.6), we get the discounted resolvent operator

(2.10)\begin{equation} \mathcal{R}(\bar{\boldsymbol{q}};\omega,k_z,s)=[(s+{\rm i}\omega) \boldsymbol{I}-\boldsymbol{N}(\bar{\boldsymbol{q}},k_z)]^{-1} \boldsymbol{P}. \end{equation}

The discounting approach moves the unstable eigenvalues of the linear operator towards the stable plane by discounting parameter $s$, hence the discounting parameter must be greater than the maximum growth rate of an unstable system. The resolvent method can be regarded as amplification characteristics between forcing and response within a finite time frame, reflecting the short-term input–output properties of a system. Here, a larger discounting parameter implies a shorter response time of interest for the forcing. The energy gain between forcing and response is now defined as

(2.11)\begin{equation} \beta^2=\frac{\|\boldsymbol{{\breve{q}}}_{\omega, k_z}\|_q^2}{\|\,\boldsymbol{{\breve{f}}}_{\omega,k_z}\|_f^2}, \end{equation}

where

(2.12a,b)\begin{equation} \|\boldsymbol{{\breve{q}}}_{\omega,k_z}\|_q^2={\langle} \boldsymbol{{\breve{q}}},\boldsymbol{{\breve{q}}}{\rangle}_q= \boldsymbol{{\breve{q}}}^{*}\boldsymbol{W}_q\boldsymbol{{\breve{q}}} \quad {\rm and} \quad \|\,\boldsymbol{{\breve{f}}}_{\omega,k_z}\|_f^2={\langle} \,\boldsymbol{{\breve{f}}},\boldsymbol{{\breve{f}}}{\rangle}_f= \boldsymbol{{\breve{f}}}^{*}\boldsymbol{W}_f \boldsymbol{{\breve{f}}},\end{equation}

represent the energy norms of the response and forcing. The matrices $\boldsymbol {W}_q$ and $\boldsymbol {W}_f$ represent measures of energy for the response and forcing fields, respectively. For compressible flows, the energy norm for the response is typically defined as the compressible energy norm of Chu (Reference Chu1965), while the energy norm for the forcing does not necessarily need to be consistent with the response (Farghadan et al. Reference Farghadan, Martini and Towne2023). They are, respectively, defined as

(2.13)\begin{equation} E_q=\frac{1}{2}\int_{{\varOmega}}\left[\frac{\bar{T}}{\bar{\rho} \gamma {Ma}_{\infty}^2}(\rho^{\prime})^2+{\bar{\rho}}|\boldsymbol{u}^{\prime}|^2 +\frac{\bar{\rho}}{(\gamma-1)\gamma {Ma}_{\infty}^2 \bar{T}} (T^{\prime})^2\right]{\rm d}\kern0.06em \boldsymbol{x}, \end{equation}

and

(2.14)\begin{equation} E_f=\int_{{\varLambda}}\boldsymbol{{\breve{f}}}^{*} \boldsymbol{{\breve{f}}}\,{\rm d}\kern0.06em \boldsymbol{x}, \end{equation}

where $(\bullet )^*$ denotes the conjugate transpose and integral domain $\varLambda$ represents the projection area of the computational domain onto the $x$$y$ plane. The integration domain ${\varOmega }$ can be restricted to the region of interest to compute the response energy, thereby obtaining different physical definitions of the gain in (2.11). By substituting equations (2.9) and (2.12a,b) into (2.11), the gain can be recast as a generalized Rayleigh quotient problem (Bugeat et al. Reference Bugeat, Chassaing, Robinet and Sagaut2019)

(2.15)\begin{equation} \beta^2=\frac{\boldsymbol{{\breve{f}}}^{*}\mathcal{R}^{*} \boldsymbol{W}_q\mathcal{R}\boldsymbol{{\breve{f}}}}{\boldsymbol{{\breve{f}}}^{*} \boldsymbol{W}_f\boldsymbol{{\breve{f}}}}. \end{equation}

The optimization solution to the generalized Rayleigh quotient problem can be equivalently described as computing the generalized singular value decomposition of the resolvent operator (Sipp & Marquet Reference Sipp and Marquet2013), as follows:

(2.16)$$\begin{gather} \mathcal{R}=\boldsymbol{Q}{\varSigma}\boldsymbol{F}^{*}\boldsymbol{W}_f, \end{gather}$$
(2.17)$$\begin{gather}\boldsymbol{Q}^{*}\boldsymbol{W}_q\boldsymbol{Q}=\boldsymbol{F}^{*} \boldsymbol{W}_f\boldsymbol{F}=\boldsymbol{I}. \end{gather}$$

The left singular matrix $\boldsymbol {Q}=[\boldsymbol {{\breve {q}}}_1, \boldsymbol {{\breve {q}}}_2,\ldots,\boldsymbol {{\breve {q}}}_n]$ and the right singular matrix $\boldsymbol {F}=[\,\boldsymbol {{\breve {f}}}_1, \boldsymbol {{\breve {f}}}_2,\ldots,\boldsymbol {{\breve {f}}}_n]$, respectively, represent a series of response modes and forcing modes. The diagonal matrix ${\varSigma }={\rm diag}(\beta _1,\beta _2,\ldots,\beta _n)$ is the singular value matrix, which represents the energy amplification between forcing and response modes, sorted in descending order.

In this paper, our primary objective is to control flow field noise, while the imposition of forcing itself can introduce some actuation noise. We not only aim to maximize the amplification of the applied harmonics in the flow field to modify the original flow field sound-producing energetic structures but also strive to minimize the amplification between the applied forcing and far-field noise, which motivates the use of acoustic resolvents (Bugeat et al. Reference Bugeat, Karban, Agarwal, Lesshafft and Jordan2024). The implementation of acoustic resolvents involves restricting the spatial domains of forcing and response. The domains for response and forcing are defined by setting ${\varOmega }$ and matrix $\boldsymbol {P}$, respectively, as shown in figure 2. For the standard resolvent, the forcing and response regions are the entire computational domain.

3. The baseline case

3.1. Flow and acoustic features

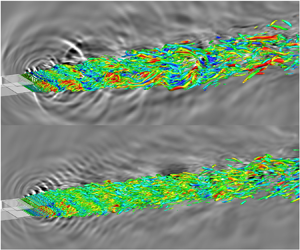
We begin by introducing the fundamental characteristics of flow and acoustics in supersonic underexpanded jets. Figure 3 shows the distributions of the normalized mean streamwise velocity ($\bar {u}/U_j$) and the snapshot of the instantaneous density gradient on logarithmic scales (Karami et al. Reference Karami, Edgington-Mitchell, Theofilis and Soria2020a,Reference Karami, Stegeman, Ooi, Theofilis and Soriab). Complex shock-cell structures exist in supersonic underexpanded jet plumes, formed through the interaction of shock/expansion waves with the shear layer within the jet plume. Along the streamwise direction, the intensity of the shock cells diminishes gradually while their oscillations intensify, which is also one of the contributing factors to the generation of intense noise. The instantaneous vortex structures in the jet plume, with the $Q$-criterion coloured by longitudinal velocity and background with the divergence of velocity are presented in figure 4(a). The coherent structures formed by the instability of the shear layer near the nozzle lip convect downstream at supersonic speeds, resulting in significant directional Mach wave radiation noise. Subsequently, the interaction between shock waves and vortices generates shock-associated broadband noise and upstream-propagating screech noise. Furthermore, the breakdown of large-scale coherent structures also produces turbulent mixing noise. Therefore, the complex composition of noise sources and their wide distribution in supersonic underexpanded jet plumes pose significant challenges for noise control.

Figure 3. (a) The axial mean velocity fields normalized by the ideally expanded velocity $(\bar {u}/U_j)$ and (b) the instantaneous snapshots of the density gradient on a logarithmic scale $(\log _{10} |\nabla \rho |)$ along the $z/h=0$ plane. The dashed vertical white lines show the locations of the mean shock cell spacing based on the oblique shock reflection points in the jet shear layer.

Figure 4. (a) The instantaneous vortex structures in the jet plume with the $Q$-criterion $(Q=1)$ coloured by longitudinal velocity $v$ and the background is shown by the divergence of velocity. (b) Power spectral density of pressure fluctuations at the monitoring point M1 $(x/h,y/h,z/h)=(-0.39,0.85,0)$ and M3 $(x/h,y/h,z/h)=(30.13,10,0)$. The jet screech frequency $(St_s=0.113)$ and its harmonics are marked by vertical red dashed lines and the purple vertical dashed lines represent the predicted frequencies $(St_{th}=0.116)$ of the model.

The power spectral density (PSD) of pressure fluctuations at two monitoring points M1 and M3, located upstream and downstream at positions $(x/h,y/h,z/h)=(-0.39,0.85,0)$ and $(30.13,10,0)$, is displayed in figure 4(b). Points M1 and M3 can also be found in figure 2. Welch's method is used to estimate the PSD with a frequency resolution of 370 Hz, employing a Hanning window and $50\,\%$ overlap. At point M1, several prominent peaks appear in the spectrum, corresponding to the screech noise and its harmonic frequencies generated by resonant feedback loops. This indicates the upstream propagation characteristics of the screech noise. However, at point M3, low-frequency large-scale turbulent mixing noise dominates. To validate the screech frequency, a modified classical frequency prediction model (Powell Reference Powell1953) is used as follows:

(3.1)\begin{equation} St_{th}=\frac{M_c k_s}{2{\rm \pi} (1+{M_c}/{u_{th}})}\frac{a_\infty}{U_j},\end{equation}

where $St_{th}$ is the frequency predicted based on the upstream-propagating guided jet $(k_{th}^-)$ wave (Edgington-Mitchell et al. Reference Edgington-Mitchell, Wang, Nogueira, Schmidt, Jaunet, Duke, Jordan and Towne2021), $M_c=U_c/a_\infty$ is the convective Mach number, $k_s$ is the wavenumber for the average shock-cell spacing and $u_{th}$ is the non-dimensional phase velocity of the $k_{th}^-$ wave. The screech frequency predicted by the LES exhibits agreement with the model results, thereby further verifying our numerical simulation (Liang et al. Reference Liang, Wan, Ye, Zhang, Sun and Lu2023).

In order to identify the energetic structures in the flow field associated with the screech mode, we perform the SPOD (Towne et al. Reference Towne, Schmidt and Colonius2018) on a series of 3-D flow field snapshots. We utilize 1000 3-D flow fields to perform SPOD with a time interval of $0.16$, which adequately resolves the screech frequency. The eigenvalue spectra of SPOD and isosurfaces of the real part of the streamwise velocity for SPOD modes at the screech frequency $St=0.113$ are shown in figure 5. In figure 5(a), a distinct peak can be observed, corresponding to the screech frequency, indicating that the near-field coherent structure associated with the screech mode is highly energetic. An antisymmetric mode is observed at the screech frequency in figure 5(b), which is attributed to the oscillatory motion of the shock cells or shear layer in the $y$-direction (Gojon, Gutmark & Mihaescu Reference Gojon, Gutmark and Mihaescu2019). Notably, the modal structure of the screech exhibits significant spanwise coherence and spanwise wavenumbers close to zero, providing a clear contrast with the SPOD results of the flow field after control in subsequent sections.

Figure 5. (a) The eigenvalue spectra of SPOD for the baseline jet. (b) The isosurfaces $(\pm 0.01)$ of the real part of the streamwise velocity for SPOD modes at the screech frequency $St=0.113$ (6097 Hz). The eigenvalue and frequency corresponding to the screech mode are marked with a red circle in the eigenvalue spectra.

3.2. Global stability and resolvent analysis

The flow and acoustic characteristics of the supersonic underexpanded jet have been introduced above. Here, we conduct a resolvent analysis of the jet to determine the frequency and wavenumber of the forcing. The discounted resolvent analysis is currently performed due to the instability of the linear operator. The effect of the discounted parameter on resolvent analysis can be interpreted as the temporal window of the system response (Yeh et al. Reference Yeh, Benton, Taira and Garmann2020). A larger discounted parameter indicates a shorter response time for the forcing of interest. Next, we evaluate the stability characteristics of the linear operator $\boldsymbol {N}(\bar {\boldsymbol {q}})$ to determine the discounting parameter. The nozzle is included in our global stability analysis. The eigenspectra of $\boldsymbol {N}(\bar {\boldsymbol {q}})$ for the spanwise wavenumber $k_zh=0$ are presented in figure 6(a), where the real $(\lambda _r)$ and imaginary $(\lambda _i)$ parts of the eigenvalues represent the growth rate and frequency, respectively. An unstable mode is identified with a positive growth rate $(\lambda _rh/a_\infty =0.04)$ and a frequency $(St=0.117)$ close to the screech frequency, indicating that the linear operator $\boldsymbol {N}(\bar {\boldsymbol {q}})$ is unstable and that this unstable mode corresponds to the screech mode. This unstable mode was also identified in the supersonic underexpanded jet system of Beneddine, Mettot & Sipp (Reference Beneddine, Mettot and Sipp2015) by performing a global stability analysis. Their global stability analysis was also performed with the nozzle, which was consistent with ours. Furthermore, Nogueira et al. (Reference Nogueira, Jordan, Jaunet, Cavalieri, Towne and Edgington-Mitchell2022b) also demonstrated the absolute instability characteristics of the screech mode through a spatially periodic linear stability analysis. The spatial structures of two typical modes are depicted in figure 6(b), corresponding to the screech mode and the Mach wave radiation mode, with their eigenvalues labelled by black circles in figure 6(a). For the screech mode, the upstream-propagating sound wavefront is observed, mainly attributed to the oscillations of the shock cells and the interaction between shock waves and vortices (Suzuki & Lele Reference Suzuki and Lele2003). This finding is also consistent with the results obtained by Beneddine et al. (Reference Beneddine, Mettot and Sipp2015) and Edgington-Mitchell et al. (Reference Edgington-Mitchell, Wang, Nogueira, Schmidt, Jaunet, Duke, Jordan and Towne2021) through global stability analysis in supersonic underexpanded jets. In figure 6(b ii), the mode exhibits a distinctive wave-like structure, propagates at a certain angle, and has a high frequency and short wavelength. This behaviour aligns with the Mach wave radiation observed by Kearney-Fischer, Kim & Samimy (Reference Kearney-Fischer, Kim and Samimy2011) in supersonic jet experiments. Additionally, the wave radiation angle of this mode ($45^{\circ }$) meet the estimated minimum radiation angle $(\theta ={\rm arcsin}(1/M_j)\approx 40^{\circ })$ requirement of Mach wave radiation. Therefore, we refer to this mode as the Mach wave radiation mode. For the Mach wave radiation mode, the sound wavefront propagates downstream, associated with the downstream convection of large-scale coherent structures.

Figure 6. (a) The eigenspectra of $\boldsymbol {N}(\bar {\boldsymbol {q}})$ for spanwise wavenumbers $k_zh=0$. The red dashed line represents the neutral stability line. (b) The screech mode (i) and Mach wave radiation mode (ii) are expressed in terms of the real part of the streamwise velocity component.

Here, we choose a sufficiently large discounted parameter $sh/a_{\infty }=0.5$ to ensure the smoothness of the gain curve. The selection of different resolvent parameters does not affect the range of optimal gain between forcing and response, as verified by Yeh & Taira (Reference Yeh and Taira2019) and Liu et al. (Reference Liu, Sun, Yeh, Ukeiley, Cattafesta and Taira2021). Figure 7 illustrates the leading energy amplification between harmonic forcing and response for standard and acoustic resolvent analyses. The standard resolvent analysis reflects the amplification ability between forcing and near-field flow structures, while acoustic resolvent analysis reflects the amplification characteristics between forcing and far-field noise. We aim for two objectives: maximizing the impact of the forcing within the flow field to alter the sound-producing energetic structures as much as possible while minimizing the far-field noise generated by the forcing itself. In figure 7(a), we observe significant energy amplification between harmonic forcing and flow structures in the range of $0.4< St_f<1.7$ and $3{\rm \pi} /2< k_z h <6{\rm \pi}$. In figure 7(b), a rough boundary line separating red and blue regions can be observed. The region above the boundary line indicates a smaller amplification between forcing and far-field noise, greatly reducing the parameter space for control. The combination of standard and acoustic resolvent analysis enabled us to identify a roughly favourable range of control parameters, as indicated by the triangular region formed by the red dashed lines in figure 7. Subsequently, we will demonstrate that this range of control parameters is effective, although not all identified parameters exhibit equal effectiveness. It should be emphasized that resolvent analysis-guided noise control strategies can significantly reduce the parameter space; however, validation through numerical simulations or experiments is imperative. Additionally, it should be noted that our resolvent gain or mode differ from the expected results for jets (Pickering et al. Reference Pickering, Rigas, Sipp, Schmidt and Colonius2019). This is because our method and the objective we aim to achieve differ from those of Pickering et al. (Reference Pickering, Rigas, Sipp, Schmidt and Colonius2019). We employed the discounting method, a linear damping technique. Our focus is on the amplification characteristics between forcing and response within a finite time frame. This discounting method is currently primarily applied in noise control (Yeh & Taira Reference Yeh and Taira2019; Liu et al. Reference Liu, Sun, Yeh, Ukeiley, Cattafesta and Taira2021). However, Pickering et al. (Reference Pickering, Rigas, Sipp, Schmidt and Colonius2019) employs an eddy viscosity method to model the nonlinear terms of the fluid governing equations, focusing more on noise modelling issues (Pickering et al. Reference Pickering, Towne, Jordan and Colonius2020bReference Pickering, Rigas, Schmidt, Sipp and Colonius2021a,Reference Pickering, Towne, Jordan and Coloniusb). From a methodological perspective, the discounting method has lower damping at high frequencies and wavenumbers compared with the eddy viscosity model (Pickering et al. Reference Pickering, Rigas, Sipp, Schmidt and Colonius2019; Liu et al. Reference Liu, Sun, Yeh, Ukeiley, Cattafesta and Taira2021). Although both Pickering et al. (Reference Pickering, Rigas, Sipp, Schmidt and Colonius2019) and our study focus on jet systems, there are significant differences in our computational parameters, such as the Mach number. This may lead to substantial differences in the physical mechanisms of the flow, which can also result in variations in the resolvent mode structures.

Figure 7. The leading energy amplification between forcing and response for (a) standard resolvent and (b) acoustic resolvent.

The forcing and response modes of the standard resolvent analysis are, respectively, shown in figures 8(a) and 8(b) at frequencies $St_f=0.113$, $1.13$ and $2.0$ with spanwise wavenumbers $k_zh=0$, $2{\rm \pi}$, $4{\rm \pi}$ and $6{\rm \pi}$. For both forcing and response modes, as the frequency increases, the streamwise wavenumber of the mode structures also increases, leading to finer structures. Conversely, as the spanwise wavenumber increases, the mode structures become more compact. For the condition $(k_zh, St_f) = (0, 0.113)$, $(0, 1.13)$ and $(0, 2.0)$, acoustic radiation can be clearly observed, but for cases with higher wavenumbers, such as $k_zh=4{\rm \pi}$ and $6{\rm \pi}$, it noticeably weakens. This implies that the forcing with a higher spanwise wavenumber will not inherently generate significant noise radiation, which aligns with the findings depicted in figure 7(b). As shown in the forcing modes, there is high-level fluctuation near the nozzle exit. This suggests that placing the actuator near the nozzle exit could better utilize the amplification characteristics between input and output, thereby reinforcing our selection of control location discussed in § 2.2.

Figure 8. The (a) forcing and (b) response modes of the standard resolvent for the real part of the streamwise velocity at frequencies $St_f=0.113$, $1.13$ and $2.0$ with spanwise wavenumbers $k_zh=0$, $2{\rm \pi}$, $4{\rm \pi}$ and $6{\rm \pi}$.

4. Controlled cases

In the previous section, we provided the expected effective range of control parameters, i.e. frequency and spanwise wavenumber, through a combined consideration of standard and acoustic resolvent analysis. Here, the LES method is first employed to evaluate the performance of these control parameters. We choose two momentum coefficients ($C_\mu = 0.0015$ and $0.0094$) to assess the efficacy of the control method. The guidance provided by the control method is expected to remain effective under various operating conditions (amplitude of control, measurement, position, etc.). Next, we attempt to elucidate the mechanisms behind noise reduction of the supersonic underexpanded jet via active control from different perspectives.

4.1. Evaluation of control effectiveness

We conducted extensive 3-D LES to assess the effectiveness of the control parameter range given by resolvent analysis. Due to the substantial noise generated upstream and downstream in the supersonic underexpanded jet flow, the distribution of monitoring points aims to encompass the noise contributed by primary noise sources, as shown in figure 2. Figure 9 illustrates the phase diagram of the mean reduction in OASPL between controlled and baseline cases under different control parameters, defined in (2.4). In figure 9, the darker and larger the circular labels, the better the noise reduction effect. Although resolvent analysis cannot provide information on the control amplitude, it is interesting that for different control amplitudes, the control parameters of the top-performing several cases fall within the triangular range guided by the resolvent analysis. This demonstrates the effectiveness and a certain degree of scalability of resolvent analysis guidance. Furthermore, the noise reduction effectiveness of steady control is significantly weaker than that of the best-performing unsteady control. However, blindly applying unsteady control can often lead to results deviating from expectations, or even worse than steady control, which can greatly increase time and computational costs. Therefore, the guidance from resolvent analysis may play a critical role in unsteady control.

Figure 9. Phase diagram of the average OASPL reduction $(\Delta {OASPL_{avg}})$ in the control parameter space at different frequencies and spanwise wavenumbers for (a) $C_\mu =0.0015$ and (b) $C_\mu =0.0094$. Circular and square labels represent noise reduction and noise amplification, respectively.

Comparing figures 9(a) and 9(b), for some control parameters like $(k_zh,St_f)=(4{\rm \pi}, 0.5)$ and $(4{\rm \pi}, 1.13)$, the noise reduction effect of low-amplitude forcing is better. This indicates that in unsteady control, larger forcing amplitudes are not necessarily better. The introduction of forcing in the original flow will inevitably modify the characteristics of the base flow, which largely determines the effectiveness of the control. Forcing at different amplitudes undergoes varying degrees of amplification and nonlinear interactions in the original flow, which continuously modifies the characteristics of the base flow. To quantitatively assess the degree of change in the mean flow characteristics due to different control amplitudes, we introduce a gain ratio variable, $\beta _{sa}/\beta _{la}$, where $\beta _{sa}$ is obtained from the resolvent analysis of the mean flow after applying small-amplitude forcing, and $\beta _{la}$ is obtained from the resolvent analysis of the mean flow after applying large-amplitude forcing. Figure 10 shows the contour lines of the gain ratio ($\beta _{sa}/\beta _{la}$) for the modified base flows between different amplitudes for two controlled parameters. In figures 10(a) and 10(b), the low-amplitude control case attains a higher optimal gain across a broad range of parameter space, which could account for its superior noise reduction performance to some extent. A modified base flow with greater gain generally leads to stronger sustained amplification of the forcing, which could be beneficial for noise reduction.

Figure 10. The contour lines of the gain ratio ($\beta _{sa}/\beta _{la}$) for the modified base flows between different control amplitudes. Here $\beta _{sa}$ denotes the gain obtained with small amplitude control and $\beta _{la}$ represents the gain achieved with large amplitude control. Two controlled parameters are considered: (a) the control parameter of $(k_z h, St_f)=(4{\rm \pi}, 0.5)$ and (b) the control parameter of $(4{\rm \pi}, 1.13)$.

In low-amplitude blowing and suction conditions, we selected the cases with the best-performing spanwise wavenumber $(k_zh=4{\rm \pi} )$ to demonstrate the OASPL at different spatial locations, as shown in figure 11. The results indicate that blowing and suction control can reduce the noise levels both upstream and downstream of the supersonic underexpanded jet. The maximum noise reduction reaches 10 dB in the upstream direction, which implies a significant decrease in the screeching noise. The conditions $(k_z h, St_f)=(4{\rm \pi}, 0.5)$, $(4{\rm \pi}, 0.8)$ and $(4{\rm \pi}, 1.13)$ represent the three cases with the best noise reduction performance. Their control frequencies fall between 4 to 10 times the screeching frequency. This is consistent with some experimental studies (Samimy et al. Reference Samimy, Kim and Kearney-Fischer2009Reference Samimy, Kim, Kearney-Fischer and Sinha2010Reference Samimy, Webb, Esfahani and Leahy2023) that have found high-frequency excitation to be more beneficial for noise reduction, and also explains why some previous unsteady control studies failed to reduce noise by targeting low frequencies (Kibens et al. Reference Kibens, Dorris, Smith and Mossman1999) close to or even lower than the screeching frequency (Ibrahim et al. Reference Ibrahim, Kunimura and Nakamura2002).

Figure 11. The OASPL for the baseline and controlled cases on the $z/h=0$ plane along the lines of (a$\sqrt {((x/h)^2+(y/h)^2)}=8$ and (b$y/h=10$.

4.2. Impact on near-field flow dynamics and far-field noise

In this subsection, the influence of control on some basic characteristics of the near field and far field is studied. We selected the best noise reduction case of $(k_zh, St_f, C_{\mu })=(4{\rm \pi},0.5,0.0015)$ and a less effective noise reduction case of $(k_zh, St_f, C_{\mu })=(2{\rm \pi},1.13,0.0015)$ for comparison with the baseline case, aiming to elucidate the mechanisms of noise reduction. Additionally, the case of $(4{\rm \pi}, 0.5, 0.0094)$ was chosen to explain the significant differences in noise reduction effectiveness between different control amplitudes. The selected cases are highlighted by green dashed boxes in figure 9. The comparison between the baseline and controlled cases with respect to the axial mean velocity fields and the r.m.s. of the fluctuating longitudinal velocity along the $z/h=0$ plane is shown in figure 12. The locations of the first four shocks for each case are labelled by the vertical dashed lines, which are obtained based on the oblique shock reflection points in the shear layer (Li et al. Reference Li, Zhang, Hao and He2020b). For the controlled case with $(k_z h, St_f, C_{\mu })=(4{\rm \pi},0.5,0.0015)$, it is found that the mean shock-cell spacing decreases, and the r.m.s. value of the fluctuating longitudinal velocity in the jet plume is notably weaker compared with the baseline case. This also implies a reduction in the oscillations of the shear layer, which can significantly reduce noise levels. Comparing the cases of low amplitude $(4{\rm \pi}, 0.5, 0.0015)$ and high amplitude $(4{\rm \pi}, 0.5, 0.0094)$, it is observed that the mean shock-cell spacing remains relatively consistent and the r.m.s. value of the fluctuating longitudinal velocity in the high amplitude case is slightly larger than that in the low amplitude case. However, this slight difference in shear layer oscillations is currently insufficient to explain the significant disparity in noise reduction between different control amplitudes. Further exploration will be conducted in the following. For the case of $(2{\rm \pi}, 0.5, 0.0015)$, the jet wake exhibits a high level of oscillations in the shear layer and shock waves, contributing to its poorer noise reduction performance.

Figure 12. The axial mean velocity fields normalized by the ideally expanded velocity $(\bar {u}/U_j)$ and the root-mean-square (r.m.s.) of the fluctuating longitudinal velocity ($v_{rms}/U_j$) along $z/h=0$ plane for the (a) baseline and (b) controlled cases. The dashed vertical white lines show the locations of the mean shock-cell spacing based on the oblique shock reflection points in the jet shear layer.

To further quantitatively analyse the noise reduction mechanism of active control, we present the mean pressure distribution along the centreline of the jet and the evolution of shear layer thickness along the streamwise direction, as shown in figure 13. The shear layer thickness is defined by the $y$-axis range bounded by $10\,\%$ and $90\,\%$ of the centreline streamwise velocity (Papamoschou & Roshko Reference Papamoschou and Roshko1988; Prasad & Unnikrishnan Reference Prasad and Unnikrishnan2024b). Before the expansion waves impinge the shear layer, the initial stages of jet expansion are similar for all cases. Hence, the mean pressure curves coincide near the nozzle exit $(x/h\leq 1)$, as shown in figure 13(a). Subsequently, due to the varying shear layer thickness, the mean pressure curves exhibit different trends. In the cases of $(4{\rm \pi}, 0.5, 0.0015)$ and $(4{\rm \pi}, 0.5, 0.0094)$, larger pressure peaks are observed, and significant pressure peaks are still visible downstream. However, for the baseline case and case of $(2{\rm \pi}, 0.5, 0.0015)$, the pressure peaks decay rapidly downstream. In figure 13(b), for the cases of $(4{\rm \pi}, 0.5, 0.0015)$ and $(4{\rm \pi}, 0.5, 0.0094)$, the shear layer thickness is greater near the nozzle exit $(x/h\leq 1)$ compared with other cases. This implies that the expansion waves at the nozzle exit are more rapidly reflected by the shear layer to form shock waves, leading to a reduction in mean shock-cell spacing compared with other cases. Interestingly, for the case of $(4{\rm \pi}, 0.5, 0.0015)$, the shear layer thickness becomes smaller than the baseline after $x/h = 13.2$. However, for the cases of $(4{\rm \pi}, 0.5, 0.0094)$ and $(2{\rm \pi}, 1.13, 0.0015)$, this occurs at $x/h = 11.0$ and $7.8$, respectively. This suggests that the external forcing in the case of $(4{\rm \pi}, 0.5, 0.0015)$ can be sustainedly amplified to farther downstream regions. The ability of the forcing to sustain downstream amplification should be a crucial factor in modifying the mean flow, which subsequently influences noise reduction.

Figure 13. (a) Mean pressure distribution along centreline of the jet and (b) shear layer thickness.

Next, we present the instantaneous vortical structures within the jet plume, as identified by the $Q$-criterion, with the background illustrated by the velocity divergence, as depicted in figure 14. Compared with the baseline case, the oscillation of vortex structures in the $y$-direction is significantly reduced in the cases of $(4{\rm \pi}, 0.5, 0.0015)$ and $(4{\rm \pi}, 0.5, 0.0094)$. For each controlled case, the amplified forcing perturbs the vortex structures inherent to the flow field, leading to a proliferation of smaller, more fragmented vortices. However, the ability of the forcing to sustain amplification downstream determines the extent of change in the sound-production structures in the original flow field, thereby facilitating the observation of increasingly fragmented vortices at extended streamwise locations, particularly in the case of $(4{\rm \pi}, 0.5, 0.0015)$. Recognizing that the introduction of forcing will inevitably alter the sound-producing energetic structures and potentially generate new sound-producing structures, we combined standard and acoustic resolvent analyses to inform our control strategies previously.

Figure 14. The instantaneous vortex structures in the jet plume with the $Q$-criterion $(Q=1)$ coloured by longitudinal velocity $v$ and the background is shown by the divergence of velocity for (a) baseline and (bd) controlled cases.

The far-field acoustic response of near-field structures for different cases is demonstrated using the PSD of pressure fluctuations, as shown in figure 15. In the upstream direction (monitoring point M1), the case of $(4{\rm \pi}, 0.5, 0.0094)$ shows a reduction of the screech peak by more than 10 dB compared with the baseline case. Additionally, the screech harmonics $(2St_s)$ and higher harmonics $(3St_s, 4St_s,\ldots )$ are also significantly suppressed. In our planar screeching jet, there is no complex staging behaviour, and the generation of the screech is related to the primary shock wave number peak (Edgington-Mitchell et al. Reference Edgington-Mitchell, Li, Liu, He, Wong, Mackenzie and Nogueira2022; Nogueira et al. Reference Nogueira, Jaunet, Mancinelli, Jordan and Edgington-Mitchell2022a). Therefore, the reduction in mean shock-cell spacing also results in a higher screech frequency. Furthermore, a high-frequency peak at $St=1.0$ is observed, which corresponds to the harmonic noise of the forcing frequency $(St_f=0.5)$. The imposition of forcing inevitably introduces some actuation noise. For the case of $(4{\rm \pi}, 0.5, 0.0094)$, both the screech frequency and the harmonic peak values are somewhat reduced, but to a much lesser extent compared with the case of $(4{\rm \pi}, 0.5, 0.0015)$. Moreover, more high-frequency peaks $(St\geq 1.0)$ are observed. In the case of $(2{\rm \pi}, 1.13, 0.0015)$, not only is the reduction in screech frequency and harmonic peak values less significant but also a large number of high-frequency peaks $(St>1.0)$ are detected. This suggests the presence of strong nonlinear interactions between the forcing and the flow field structures for the case of $(2{\rm \pi}, 1.13, 0.0015)$. In the downstream direction (monitoring point M3), the noise reduction effectiveness of the cases of $(4{\rm \pi}, 0.5, 0.0015)$ and $(4{\rm \pi}, 0.5, 0.0094)$ is generally better compared with the case of $(2{\rm \pi}, 1.13, 0.0015)$. This is attributed to the more fragmented vortex structures observed in their flow fields.

Figure 15. The PSD of pressure fluctuations at the monitoring point (a,c,e) M1 $(x/h,y/h,z/h)=(-0.39,0.85,0)$ and (b,d,f) M3 $(x/h,y/h,z/h)=(30.13,10,0)$.

4.3. Impact on the self-sustained resonance loops

In the previous subsection, we have found that active control can effectively suppress screech tones and provided an explanation based on the near-field flow characteristics. Here, we delve deeper into the mechanisms of screech noise suppression. The generation of screech has been extensively studied, with various works contributing to the understanding of this phenomenon (Merle Reference Merle1956; Raman Reference Raman1997; Gojon, Bogey & Mihaescu Reference Gojon, Bogey and Mihaescu2018; Li et al. Reference Li, Zhang, Hao and He2020b; Edgington-Mitchell et al. Reference Edgington-Mitchell, Li, Liu, He, Wong, Mackenzie and Nogueira2022). The concept of self-sustained resonance loops is widely used to account for the screeching in supersonic jets (Powell Reference Powell1953; Tam Reference Tam1995). These resonance loops typically consist of four distinct processes (Edgington-Mitchell Reference Edgington-Mitchell2019): a downstream-travelling wave; a downstream-reflection mechanism; an upstream-travelling wave; a receptivity mechanism near the nozzle lip. The downstream-travelling wave is primarily characterized by K-H instability wave packets, which originate from shear layer instabilities and are sustained by continuously extracting energy from the mean flow. The upstream-travelling wave mainly comprises guided jet waves that propagate within the shear layer, formed through the interaction of shock waves and vortices in the downstream reflection process. This upstream wave excites new instability waves near the nozzle lip, thereby closing the resonance loop. In addition to the K-H instability waves and guided jet waves within the shear layer, trapped waves confined in the jet core by the shear layer also play a significant role in the resonance loops. The resonance loop can be visually observed in the schematic diagram in figure 16.

Figure 16. Schematic of an underexpanded supersonic jet.

Since the generation of screech is closely related to the wave propagation characteristics in the jet plume, the frequency–wavenumber spectra of pressure fluctuations, obtained through spatiotemporal Fourier transform along the lines $(y/h, z/h)=(0.5, 0)$ and $(0, 0)$, are depicted in figures 17 and 18, respectively. In figure 17, positive and negative wavenumbers represent waves propagating downstream and upstream, respectively. The red dashed line indicates the approximate convective velocity $(0.6U_j)$ of the K-H instability waves (Liang et al. Reference Liang, Wan, Ye, Zhang, Sun and Lu2023). For the baseline case, distinct energy peaks appear at $St=0.11$, $0.22$ and $0.33$, corresponding to the screech frequency and its harmonics. The downstream-propagating K-H instability wave packet, marked by the red line, also exhibits significant energy. These waves, both upstream and downstream propagating, substantially contribute to the generation of screech tones. For the case of $(k_zh, St_f, C_{\mu })=(4{\rm \pi},0.5,0.0015)$, energy peaks manifest at $St=0.5$ and $1.0$, corresponding to the forcing frequency and its harmonic. The energy of the waves corresponding to the screech frequency and its harmonics is significantly reduced, suggesting that the nonlinear interactions in the flow field are weakened and the screech resonance loops are mitigated. In contrast, for the cases of $(4{\rm \pi}, 0.5, 0.0094)$ and $(2{\rm \pi}, 1.13, 0.0015)$, the energy of waves associated with the screech frequency and its harmonics remains at a relatively high level. In figure 18, similar findings to those in figure 17 can be found. Especially for the screech harmonics, the energy amplitude is significantly suppressed compared with the uncontrolled case and the $(k_z h, St_f, C_{\mu })=(4{\rm \pi},0.5,0.0015)$ case, which corresponds to the substantial suppression of screech harmonic noise in figure 15(a). This phenomenon is mainly related to the suppression of the screech harmonic mode (varicose mode), which will be further discussed in the next subsection. The upstream and downstream propagating waves in the jet core region are most effectively suppressed in the case of $(k_z h, St_f, C_{\mu })=(4{\rm \pi},0.5,0.0015)$. We can conclude that the sustained amplification of forcing in the streamwise direction can weaken the upstream and downstream wave processes within the resonance loops, thereby suppressing the generation of screech noise.

Figure 17. Frequency–wavenumber spectra of the pressure fluctuation for four cases along the straight line of $(y/h, z/h)=(0.5, 0)$. The greyscale range is logarithmic and the red dashed line indicates the group velocity of the K-H instability waves.

Figure 18. Frequency–wavenumber spectra of the pressure fluctuation for four cases along the straight line of $(y/h, z/h)=(0, 0)$. The greyscale range is logarithmic.

4.4. Impact on the coherent structures

The convection and oscillation of coherent turbulent structures in the jet shear layer and their interaction with shock waves in the jet plume are often accompanied by intense noise. These noise sources are non-compact, resulting in significant directivity of the noise (Papamoschou Reference Papamoschou2018; Prasad & Unnikrishnan Reference Prasad and Unnikrishnan2024b). Identifying the dynamic behaviour of near-field coherent structures is beneficial for understanding the far-field noise radiation characteristics. Therefore, the influence of control on near-field coherent structures needs to be investigated using the 3-D SPOD method (Towne et al. Reference Towne, Schmidt and Colonius2018), which is performed in a subdomain of $0\leq x/h\leq 20$, $-2.5\leq y/h\leq 2.5$ and $-2.5\leq z/h\leq 2.5$.

The comparison of the eigenvalue spectra between the baseline and controlled cases for the leading two SPOD modes is shown in figures 19(a) and 19(b). In the leading SPOD mode, for the baseline jet, peaks appear at the screech frequency $(St = 0.113)$ and its harmonics $(St = 0.226, 0.339, \ldots )$. Considering the controlled case with $(k_zh, St_f, C_{\mu })=(4{\rm \pi},0.5,0.0015)$, peaks are induced at the forcing frequency, $St_f = 0.5$, and its harmonic, $St = 1.0$, while screech-related peaks are well suppressed. The amplification of forcing in the streamwise direction extracts energy from the mean flow and engages in nonlinear interactions within the flow field, altering the growth of screech-related wave packets in the original flow field. This causes the energy of the screech-related coherent structures to shift to the higher forcing frequency and its harmonics. For the case of $(4{\rm \pi},0.5,0.0094)$, the screech peak magnitude is reduced compared with the baseline case, and peaks at the forcing frequency and its harmonic are also observed. However, the peak magnitudes at the forcing frequency and its harmonics are slightly smaller than those in the case of $(4{\rm \pi},0.5,0.0015)$. This is attributed to the result that lower amplitude forcing results in more sustained amplification in the streamwise direction. In the second SPOD mode, the effect of control is relatively minor, and forcing peaks do not appear.

Figure 19. The comparison of the eigenvalue spectra between the baseline and controlled cases for the first two most energetic modes.

It is worth emphasizing that for the noise reduction mechanisms, the nonlinear interactions induced by forcing should be critically important. This viewpoint is quantitatively supported by the global stability analysis results for the baseline and controlled cases, as shown in table 1. In the resolvent framework, the application of the actuation signal primarily affects the mean flow and the nonlinear characteristics of the flow system. However, the results of table 1 indicate that the growth rate of the screech mode did not significantly decrease, and even increased for the case with the best noise reduction effect. This suggests that changes in the linear response of mean flow cannot explain the noise control mechanism. It also implies that the nonlinear interactions induced by the forcing not only alter the mean flow but also significantly impact the nonlinear characteristics of the flow system. Nonlinear interactions in combination of the modified mean flow should play a dominant role in noise control.

Table 1. Growth rates obtained through global stability analysis for baseline and controlled cases.

To investigate the impact of control on coherent structures, the spatial support of the leading SPOD modes at three representative frequencies (screech frequency, screech harmonic and forcing frequency) is shown in figure 20. At the screech frequency, antisymmetric modes are observed in all cases, which are induced by shear layer flapping. However, compared with the baseline case, the spanwise coherent structures in the cases with better noise reduction (the case of $(k_z h, St_f, C_{\mu })=(4{\rm \pi},0.5,0.0015)$) become more distorted and fragmented, which can also be observed in the two-dimensional spanwise-decomposed Fourier modes. At the screech harmonic frequency, a symmetric mode is found in the baseline case, consistent with the observations of Tam & Norum (Reference Tam and Norum1992). The generation of the symmetric mode is attributed to the varicose motions of the jet shear layer. In all controlled cases, particularly for the case of $(k_z h, St_f, C_{\mu })=(4{\rm \pi},0.5,0.0015)$, the varicose mode with large-scale spanwise structures ($k_zh=0$) is significantly suppressed. Instead, the relatively disordered turbulent structures (high spanwise wavenumber structures) are predominant, leading to significant suppression of noise at screech harmonic in figure 15(a). At the forcing frequency, the control cases transform the disordered turbulent structures in the original flow field into organized structures with the forcing frequency and wavenumber. These structures are highly energetic and gradually become fragmented as they develop downstream. The organized coherent structures in the case of $(2{\rm \pi},1.13,0.0015)$ exhibit a comparatively faster breakdown and dissipation, impeding their downstream development and resulting in less effective control of jet noise.

Figure 20. Isolevels of the leading SPOD modes of streamwise velocity, and its spanwise decomposed Fourier modes for four different cases at the screech frequency, screech harmonics and forcing frequency. The four different cases are (a) uncontrolled, (b$(k_z h, St_f, C_{\mu })=(4{\rm \pi},0.5,0.0015)$, (c$(4{\rm \pi},0.5,0.0094)$ and (d$(2{\rm \pi},1.13,0.0015)$. Contour levels are uniformly set to $\pm 0.01$.

It is worth emphasizing that the control framework based on resolvent analysis is grounded in linear assumptions, and the actual control process cannot apply global forcing in the flow field. This discrepancy may lead to differences between the amplification characteristics from the applied forcing and the resolvent response modes. While the resolvent analysis may occasionally deviate from expectations under certain parameter conditions, it still identifies effective control parameter ranges at a significantly lower cost than numerical simulations and experiments. To perform detailed evaluations within these parameter spaces using simulations or experiments would be more efficient and faster.

5. Summary and conclusion

This study has demonstrated the utility of resolvent analysis in providing a physics-based approach to identify effective control parameters for reducing noise in supersonic underexpanded jets. The LES results have validated the theoretical insights gained from the resolvent analysis, showcasing a significant reduction in screech noise levels through unsteady active control strategies.

The LES results indicate the presence of complex noise components in the supersonic underexpanded jet, which are associated with vortex convection, mixing and interactions with shock waves. Notably, the upstream-propagating screech noise exhibits an extreme amplitude, with its SPOD modes presenting large-scale antisymmetric structures. Through a global stability analysis of the base flow, it was found that the jet system is unstable and the unstable modes correspond to the screech modes. To reduce jet noise, an unsteady active control technique is applied. Standard resolvent and acoustic resolvent analyses are performed to obtain the energy amplification between the forcing and flow structures, and between forcing and far-field noise, respectively. An appropriate range of forcing frequencies and spanwise wavenumber has been identified, where the forcing significantly amplifies in the flow field to alter the original flow field noise sources while minimizing amplification in the far field to result in lower actuator noise. For the resolvent analysis, the structure of the response modes is primarily concentrated in the shear layer, while the forced mode structure is mainly concentrated near the nozzle exit. Therefore, introducing 3-D forcing inputs near the nozzle exit within the identified frequency and spanwise wavenumber range may effectively alter the flow structure.

A series of 3-D unsteady control cases with $C_\mu = 0.0015$ and $0.0094$ were performed, substantiating the efficacy of the resolvent-guided parameter range in attenuating jet noise. The effective control frequencies are approximately between 4 to 10 times the screech frequency. This discovery provides insight into the shortcomings of prior unsteady control investigations that may have underperformed due to the selection of control frequencies that were too low, approaching or falling below the screech frequency (Kibens et al. Reference Kibens, Dorris, Smith and Mossman1999; Ibrahim et al. Reference Ibrahim, Kunimura and Nakamura2002). The LES results also revealed an important fact: a higher control amplitude does not necessarily lead to improving noise reduction outcomes. Interestingly, the lower amplitude forcing here is more effective at reshaping the flow attributes, leading to a more pronounced reduction in noise generation. Furthermore, we find that unsteady control shows a superior noise reduction performance compared with steady control at different control amplitudes. In the best control case, the screech noise is reduced by over 10 dB, and the harmonics of the screech noise are also significantly suppressed. This can be attributed to the enhanced intensity of the near-field shock waves and the suppression of shear layer oscillations. The introduction of forcing has been observed to thicken the shear layer and induce a higher degree of fragmentation in vortex structures. The ability of forcing to sustain amplification in the streamwise direction determines the extent of vortex fragmentation or modification of mean flow, which is a crucial factor for reducing noise.

Furthermore, the frequency–wavenumber spectra of pressure fluctuations indicate that the energy amplitudes of waves related to the screech frequency and its harmonics, propagating upstream and downstream in the jet shear layer and core region, are significantly attenuated. This suggests that active control can reduce screech and harmonic noise by suppressing self-sustained resonance loops. The SPOD eigenvalue spectra demonstrate that effective control redistributes energy to higher frequencies (forcing frequency and its harmonics), weakening the acoustic radiation efficiency of low-frequency coherent structures. The study of spatial coherent structures identified that effective control suppresses the oscillation (antisymmetric mode) and varicose motions (symmetric mode) of large-scale coherent structures, promoting the formation of organized wave packets at the forcing frequency. The high-frequency modes exhibit lower noise radiation efficiency compared with the low-frequency symmetric and antisymmetric modes.

In short, this study shows that resolvent analysis, grounded in physics, can provide effective control parameter ranges to reduce noise in supersonic jet noise. The sustained amplification capability of control inputs is directly related to the extent of changes in the base flow characteristics, which in turn can reduce far-field noise. While the resolvent-guided control techniques are based on a linear assumption framework, further simulation or experimental validation is necessary to assess their effectiveness against nonlinear dynamics. Resolvent analysis can assist in narrowing down the range of control parameters; however, simulations or optimization algorithms such as genetic algorithms (Zigunov et al. Reference Zigunov, Sellappan and Alvi2022) or Bayesian optimization (Mahfoze et al. Reference Mahfoze, Moody, Wynn, Whalley and Laizet2019) are still required to determine the optimal control settings. These methods are computationally intensive when used individually, but integrating them with the resolvent framework shows promise for efficient noise reduction. Additionally, it is worth mentioning that the resolvent-guided control is not limited by the type of actuation. Presently, we applied suction and blowing control, which may be challenging to implement experimentally at such high frequencies guided by the resolvent analysis. However, plasma actuation can be adjusted from 0 to 200 kHz in experiments (Samimy et al. Reference Samimy, Kim, Kearney-Fischer and Sinha2010), which fully covers the effective frequency range guided by our resolvent analysis. Experimental studies (Samimy et al. Reference Samimy, Kim and Kearney-Fischer2009Reference Samimy, Kim, Kearney-Fischer and Sinha2010Reference Samimy, Webb, Esfahani and Leahy2023) on the active control of jet noise using plasma actuation with a wide range of excitation frequencies have shown that high-frequency actuation is more effective in making large-scale coherent structures smaller and less coherent, which is more beneficial for noise reduction. This aligns with our conclusion that higher frequencies guided by the resolvent analysis are more effective for noise reduction, thereby further substantiating the applicability of resolvent-guided control in experimental settings.

Acknowledgements

The numerical computations were performed at Hefei Advanced Computing Center. We sincerely appreciate the anonymous reviewers’ valuable insights and constructive feedback, which have greatly improved our manuscript.

Funding

This work was supported by the National Natural Science Foundation of China under grant nos. 12322210, 92252202, 12402258 and 12388101; and the Strategic Priority Research Program of the Chinese Academy of Sciences (grant no. XDB0500301).

Declaration of interests

The authors report no conflict of interest.

References

Abreu, L.I., Cavalieri, A.V.G., Schlatter, P., Vinuesa, R. & Henningson, D.S. 2020 Spectral proper orthogonal decomposition and resolvent analysis of near-wall coherent structures in turbulent pipe flows. J. Fluid Mech. 900, A11.CrossRefGoogle Scholar
Alapati, J.K.K. & Srinivasa, K. 2024 Screech receptivity control using exit lip surface roughness for under-expanded jet noise reduction. Phys. Fluids 36 (1), 016113.CrossRefGoogle Scholar
Alkislar, M.B., Krothapalli, A. & Butler, G.W. 2007 The effect of streamwise vortices on the aeroacoustics of a Mach 0.9 jet. J. Fluid Mech. 578, 139169.CrossRefGoogle Scholar
Arakeri, V., Krothapalli, A., Siddavaram, V., Alkislar, M.B. & Lourenco, L.M. 2003 On the use of microjets to suppress turbulence in a Mach 0.9 axisymmetric jet. J. Fluid Mech. 490, 7598.CrossRefGoogle Scholar
Bae, H.J., Dawson, S.T.M. & McKeon, B.J. 2020 Resolvent-based study of compressibility effects on supersonic turbulent boundary layers. J. Fluid Mech. 883, A29.CrossRefGoogle Scholar
Beneddine, S., Mettot, C. & Sipp, D. 2015 Global stability analysis of underexpanded screeching jets. Eur. J. Mech. (B/Fluids) 49, 392399.CrossRefGoogle Scholar
Berland, J., Bogey, C. & Bailly, C. 2007 Numerical study of screech generation in a planar supersonic jet. Phys. Fluids 19 (7), 075105.CrossRefGoogle Scholar
Bugeat, B., Chassaing, J.-C., Robinet, J.-C. & Sagaut, P. 2019 3d global optimal forcing and response of the supersonic boundary layer. J. Comput. Phys. 398, 108888.CrossRefGoogle Scholar
Bugeat, B., Karban, U., Agarwal, A., Lesshafft, L. & Jordan, P. 2024 Acoustic resolvent analysis of turbulent jets. Theor. Comput. Fluid Dyn. 38, 687706.CrossRefGoogle Scholar
Castelain, T., Sunyach, M., Juvé, D. & Bera, J.-C. 2008 Jet-noise reduction by impinging microjets: an acoustic investigation testing microjet parameters. AIAA J. 46 (5), 10811087.CrossRefGoogle Scholar
Chu, B.-T. 1965 On the energy transfer to small disturbances in fluid flow (part I). Acta Mech. 1 (3), 215234.CrossRefGoogle Scholar
Coderoni, M., Lyrintzis, A.S. & Blaisdell, G.A. 2019 Large-eddy simulations analysis of supersonic heated jets with fluid injection for noise reduction. AIAA J. 57 (8), 34423455.CrossRefGoogle Scholar
Edgington-Mitchell, D. 2019 Aeroacoustic resonance and self-excitation in screeching and impinging supersonic jets–a review. Intl J. Aeroacoust. 18 (2-3), 118188.CrossRefGoogle Scholar
Edgington-Mitchell, D., Li, X., Liu, N., He, F., Wong, T.Y., Mackenzie, J. & Nogueira, P. 2022 A unifying theory of jet screech. J. Fluid Mech. 945, A8.CrossRefGoogle Scholar
Edgington-Mitchell, D., Wang, T., Nogueira, P., Schmidt, O., Jaunet, V., Duke, D., Jordan, P. & Towne, A. 2021 Waves in screeching jets. J. Fluid Mech. 913, A7.CrossRefGoogle Scholar
Farghadan, A., Martini, E. & Towne, A. 2023 Scalable resolvent analysis for three-dimensional flows. Preprint, arXiv:2309.04617.Google Scholar
Gaitonde, D. & Samimy, M. 2010 Effect of plasma-based azimuthal mode excitation on supersonic jet flow. AIAA Paper 2010-4416.CrossRefGoogle Scholar
Gaitonde, D. & Samimy, M. 2011 Coherent structures in plasma-actuator controlled supersonic jets: axisymmetric and mixed azimuthal modes. Phys. Fluids 23 (9), 095104.CrossRefGoogle Scholar
Gautam, K., Karnam, A., Mohammed, A., Saleem, M. & Gutmark, E. 2024 Internal fluidic injection for the control of supersonic rectangular jet noise. AIAA Paper 2024-2464.CrossRefGoogle Scholar
Gojon, R., Bogey, C. & Mihaescu, M. 2018 Oscillation modes in screeching jets. AIAA J. 56 (7), 29182924.CrossRefGoogle Scholar
Gojon, R., Gutmark, E. & Mihaescu, M. 2019 Antisymmetric oscillation modes in rectangular screeching jets. AIAA J. 57 (8), 34223441.CrossRefGoogle Scholar
Greska, B. & Krothapalli, A. 2005 The near-field effects of microjet injection. AIAA Paper 2005-3046.CrossRefGoogle Scholar
Henderson, B. 2010 Fifty years of fluidic injection for jet noise reduction. Intl J. Aeroacoust. 9 (1-2), 91122.CrossRefGoogle Scholar
Herrmann, B., Baddoo, P.J., Semaan, R., Brunton, S.L. & McKeon, B.J. 2021 Data-driven resolvent analysis. J. Fluid Mech. 918, A10.CrossRefGoogle Scholar
Ibrahim, M.K., Kunimura, R. & Nakamura, Y. 2002 Mixing enhancement of compressible jets by using unsteady microjets as actuators. AIAA J. 40 (4), 681688.CrossRefGoogle Scholar
Jiang, Y., Shu, C.W. & Zhang, M. 2013 An alternative formulation of finite difference weighted ENO schemes with Lax–Wendroff time discretization for conservation laws. SIAM J. Sci. Comput. 35 (2), A1137A1160.CrossRefGoogle Scholar
Jovanovic, M.R. 2004 Modeling, analysis, and control of spatially distributed systems. PhD thesis, University of California, Santa Barbara.Google Scholar
Karami, S., Edgington-Mitchell, D., Theofilis, V. & Soria, J. 2020 a Characteristics of acoustic and hydrodynamic waves in under-expanded supersonic impinging jets. J. Fluid Mech. 905, A34.CrossRefGoogle Scholar
Karami, S., Stegeman, P.C., Ooi, A., Theofilis, V. & Soria, J. 2020 b Receptivity characteristics of under-expanded supersonic impinging jets. J. Fluid Mech. 889, A27.CrossRefGoogle Scholar
Kearney-Fischer, M., Kim, J.-H. & Samimy, M. 2011 A study of Mach wave radiation using active control. J. Fluid Mech. 681, 261292.CrossRefGoogle Scholar
Kibens, V., Dorris, J. III, Smith, D. & Mossman, M. 1999 Active flow control technology transition-the boeing ACE program. AIAA Paper 1999-3507.CrossRefGoogle Scholar
Lesshafft, L., Semeraro, O., Jaunet, V., Cavalieri, A.V.G. & Jordan, P. 2019 Resolvent-based modeling of coherent wave packets in a turbulent jet. Phys. Rev. Fluids 4 (6), 063901.CrossRefGoogle Scholar
Li, B., Ye, C.C., Wan, Z.H., Liu, N.S., Sun, D.J. & Lu, X.Y. 2020 a Noise control of subsonic flow past open cavities based on porous floors. Phys. Fluids 32 (12), 125101.CrossRefGoogle Scholar
Li, X.R., Zhang, X.W., Hao, P.F. & He, F. 2020 b Acoustic feedback loops for screech tones of underexpanded free round jets at different modes. J. Fluid Mech. 902, A17.CrossRefGoogle Scholar
Liang, L.-L., Wan, Z.-H., Ye, C.-C., Zhang, P.-J.-Y., Sun, D.-J. & Lu, X.-Y. 2023 Flow dynamics and noise generation mechanisms in supersonic underexpanded rectangular and planar jets. AIP Adv. 13 (6), 065128.CrossRefGoogle Scholar
Liu, Q., Prasad, C. & Gaitonde, D.V. 2022 Resolvent analysis of an under-expanded planar supersonic impinging jet. AIAA Paper 2022-3408, p. 3408.Google Scholar
Liu, Q., Sun, Y.Y., Yeh, C.-A., Ukeiley, L.S., Cattafesta, L.N. & Taira, K. 2021 Unsteady control of supersonic turbulent cavity flow based on resolvent analysis. J. Fluid Mech. 925, A5.CrossRefGoogle Scholar
Mahfoze, O.A., Moody, A., Wynn, A., Whalley, R.D. & Laizet, S. 2019 Reducing the skin-friction drag of a turbulent boundary-layer flow with low-amplitude wall-normal blowing within a bayesian optimization framework. Phys. Rev. Fluids 4 (9), 094601.CrossRefGoogle Scholar
Manson, L. & Burge, H.L. 1971 Jet-noise reduction through liquid-base foam injection. Acoust. Soc. Am. 50 (4A), 10671074.CrossRefGoogle Scholar
Martens, S. & Haber, L. 2008 Jet noise reduction for high speed exhaust systems. In Turbo Expo: Power for Land, Sea, and Air, vol. 43161, pp. 805–814. ASME.CrossRefGoogle Scholar
McKeon, B.J. & Sharma, A.S. 2010 A critical-layer framework for turbulent pipe flow. J. Fluid Mech. 658, 336382.CrossRefGoogle Scholar
Merle, M. 1956 Sur la frequence des ondes sonores emises par un jet dair a grande vitesse. C. R. Hebd. Seances Acad. Sci. 243 (5), 490493.Google Scholar
Morris, P.J., McLaughlin, D.K. & Kuo, C.W. 2013 Noise reduction in supersonic jets by nozzle fluidic inserts. J. Sound Vib. 332 (17), 39924003.CrossRefGoogle Scholar
Nesbitt, E., Brusniak, L., Underbrink, J., Lynch, D. & Martinez, M. 2007 Effects of chevrons on engine jet noise structure. AIAA Paper 2007-3597.CrossRefGoogle Scholar
Nicoud, F. & Ducros, F. 1999 Subgrid-scale stress modelling based on the square of the velocity gradient tensor. Flow Turbul. Combust. 62 (3), 183200.CrossRefGoogle Scholar
Nogueira, P.A.S., Cavalieri, A.V.G., Jordan, P. & Jaunet, V. 2019 Large-scale streaky structures in turbulent jets. J. Fluid Mech. 873, 211237.CrossRefGoogle Scholar
Nogueira, P.A.S., Jaunet, V., Mancinelli, M., Jordan, P. & Edgington-Mitchell, D. 2022 a Closure mechanism of the A1 and A2 modes in jet screech. J. Fluid Mech. 936, A10.CrossRefGoogle Scholar
Nogueira, P.A.S., Jordan, P., Jaunet, V., Cavalieri, A.V.G., Towne, A. & Edgington-Mitchell, D. 2022 b Absolute instability in shock-containing jets. J. Fluid Mech. 930, A10.CrossRefGoogle Scholar
Norum, T. 2004 Reductions in multi-component jet noise by water injection. AIAA Paper 2004-2976.CrossRefGoogle Scholar
Papamoschou, D. 2018 Wavepacket modeling of the jet noise source. Intl J. Aeroacoust. 17 (1-2), 5269.CrossRefGoogle Scholar
Papamoschou, D. & Roshko, A. 1988 The compressible turbulent shear layer: an experimental study. J. Fluid Mech. 197, 453477.CrossRefGoogle Scholar
Pickering, E., Rigas, G., Nogueira, P.A.S., Cavalieri, A.V.G., Schmidt, O.T. & Colonius, T. 2020 a Lift-up, Kelvin–Helmholtz and orr mechanisms in turbulent jets. J. Fluid Mech. 896, A2.CrossRefGoogle Scholar
Pickering, E., Rigas, G., Schmidt, O.T., Sipp, D. & Colonius, T. 2021 a Optimal eddy viscosity for resolvent-based models of coherent structures in turbulent jets. J. Fluid Mech. 917, A29.CrossRefGoogle Scholar
Pickering, E., Rigas, G., Sipp, D., Schmidt, O.T. & Colonius, T. 2019 Eddy viscosity for resolvent-based jet noise models. AIAA paper 2019-2454.CrossRefGoogle Scholar
Pickering, E., Towne, A., Jordan, P. & Colonius, T. 2021 b Resolvent-based modeling of turbulent jet noise. J. Acoust. Soc. Am. 150 (4), 24212433.CrossRefGoogle ScholarPubMed
Pickering, E., Towne, A., Jordan, P. & Colonius, T. 2020 b Resolvent-based jet noise models: a projection approach. In AIAA Scitech 2020 Forum, p. 0999. AIAA.CrossRefGoogle Scholar
Powell, A. 1953 On the mechanism of choked jet noise. Proc. Phys. Soc. 66, 10391056.CrossRefGoogle Scholar
Powers, R. & McLaughlin, D. 2012 Acoustics measurements of scale models of military style supersonic beveled nozzle jets with interior corrugations. AIAA Paper 2012-2116.CrossRefGoogle Scholar
Prasad, A.L.N. & Unnikrishnan, S. 2023 Effect of plasma actuator-based control on flow-field and acoustics of supersonic rectangular jets. J. Fluid Mech. 964, A11.CrossRefGoogle Scholar
Prasad, A.L.N. & Unnikrishnan, S. 2024 a Flow-field and acoustics of over-expanded rectangular jets subjected to LAFPA based control. AIAA Paper 2024-2304.Google Scholar
Prasad, A.L.N. & Unnikrishnan, S. 2024 b Noise mitigation in rectangular jets through plasma actuator-based shear layer control. J. Fluid Mech. 979, A16.CrossRefGoogle Scholar
Prasad, C. & Morris, P.J. 2020 A study of noise reduction mechanisms of jets with fluid inserts. J. Sound Vib. 476, 115331.CrossRefGoogle Scholar
Raman, G. 1997 Cessation of screech in underexpanded jets. J. Fluid Mech. 336, 6990.CrossRefGoogle Scholar
Raman, G. & Cornelius, D. 1995 Jet mixing control using excitation from miniature oscillating jets. AIAA J. 33 (2), 365368.CrossRefGoogle Scholar
Rask, O., Kastner, J. & Gutmark, E. 2011 Understanding how chevrons modify noise in supersonic jet with flight effects. AIAA J. 49 (8), 15691576.CrossRefGoogle Scholar
Samimy, M., Kim, J.-H., Kastner, J., Adamovich, I. & Utkin, Y. 2007 a Active control of a Mach 0.9 jet for noise mitigation using plasma actuators. AIAA J. 45 (4), 890901.CrossRefGoogle Scholar
Samimy, M., Kim, J.-H., Kastner, J., Adamovich, I. & Utkin, Y. 2007 b Active control of high-speed and high-Reynolds-number jets using plasma actuators. J. Fluid Mech. 578, 305330.CrossRefGoogle Scholar
Samimy, M., Kim, J.-H. & Kearney-Fischer, M. 2009 Active control of noise in supersonic jets using plasma actuators. AIAA Paper 2009-97107, p. 48821.Google Scholar
Samimy, M., Kim, J.-H., Kearney-Fischer, M. & Sinha, A. 2010 Acoustic and flow fields of an excited high Reynolds number axisymmetric supersonic jet. J. Fluid Mech. 656, 507529.CrossRefGoogle Scholar
Samimy, M., Webb, N., Esfahani, A. & Leahy, R. 2023 Perturbation-based active flow control in overexpanded to underexpanded supersonic rectangular twin jets. J. Fluid Mech. 959, A13.CrossRefGoogle Scholar
Schmidt, O.T., Towne, A., Rigas, G., Colonius, T. & Bres, G.A. 2018 Spectral analysis of jet turbulence. J. Fluid Mech. 855, 953982.CrossRefGoogle Scholar
Seiner, J., Ukeiley, L. & Jansen, B. 2005 Aero-performance efficient noise reduction for the f404-400 engine. AIAA Paper 2005-3048.CrossRefGoogle Scholar
Sharma, A.S., Moarref, R., McKeon, B.J., Park, J.S., Graham, M.D. & Willis, A.P. 2016 Low-dimensional representations of exact coherent states of the Navier–Stokes equations from the resolvent model of wall turbulence. Phys. Rev. E 93 (2), 021102.CrossRefGoogle ScholarPubMed
Shu, C.W. & Osher, S. 1988 Efficient implementation of essentially non-oscillatory shock-capturing schemes. J. Comput. Phys. 77 (2), 439471.CrossRefGoogle Scholar
Sipp, D. & Marquet, O. 2013 Characterization of noise amplifiers with global singular modes: the case of the leading-edge flat-plate boundary layer. Theor. Comput. Fluid Dyn. 27, 617635.CrossRefGoogle Scholar
Suzuki, T. & Lele, S.K. 2003 Shock leakage through an unsteady vortex-laden mixing layer: application to jet screech. J. Fluid Mech. 490, 139167.CrossRefGoogle Scholar
Tam, C.K. 1995 Supersonic jet noise. Annu. Rev. Fluid Mech. 27 (1), 1743.CrossRefGoogle Scholar
Tam, C.K. & Hu, F.Q. 2023 Jet noise reduction: a fresh start. AIAA Paper 2023-4519, p. 4519.Google Scholar
Tam, C.K. & Norum, T.D. 1992 Impingement tones of large aspect ratio supersonic rectangular jets. AIAA J. 30 (2), 304311.CrossRefGoogle Scholar
Tamburello, D.A. & Amitay, M. 2008 Active control of a free jet using a synthetic jet. Intl J. Heat Fluid Flow 29 (4), 967984.CrossRefGoogle Scholar
Theofilis, V. 2003 Advances in global linear instability analysis of nonparallel and three-dimensional flows. Prog. Aerosp. Sci. 39 (4), 249315.CrossRefGoogle Scholar
Towne, A., Schmidt, O.T. & Colonius, T. 2018 Spectral proper orthogonal decomposition and its relationship to dynamic mode decomposition and resolvent analysis. J. Fluid Mech. 847, 821867.CrossRefGoogle Scholar
Trefethen, L.N. & Embree, M. 2005 Spectra and Pseudospectra: The Behavior of Nonnormal Matrices and Operators. Princeton University Press.CrossRefGoogle Scholar
Trefethen, L.N., Trefethen, A.E., Reddy, S.C. & Driscoll, T.A. 1993 Hydrodynamic stability without eigenvalues. Science 261 (5121), 578584.CrossRefGoogle ScholarPubMed
Ye, C.C., Zhang, P.J.Y., Wan, Z.H., Sun, D.J. & Lu, X.Y. 2020 Numerical investigation of the bevelled effects on shock structure and screech noise in planar supersonic jets. Phys. Fluids 32 (8), 086103.CrossRefGoogle Scholar
Ye, C.C., Zhang, P.J.Y., Wan, Z.H., Yan, R. & Sun, D.J. 2022 Accelerating CFD simulation with high order finite difference method on curvilinear coordinates for modern GPU clusters. Adv. Aerodyn. 4 (1), 132.CrossRefGoogle Scholar
Yeh, C.-A., Benton, S.I., Taira, K. & Garmann, D.J. 2020 Resolvent analysis of an airfoil laminar separation bubble at $re= 500 000$. Phys. Rev. Fluids 5 (8), 083906.CrossRefGoogle Scholar
Yeh, C.-A. & Taira, K. 2019 Resolvent-analysis-based design of airfoil separation control. J. Fluid Mech. 867, 572610.CrossRefGoogle Scholar
Zaman, K.B.M.Q. 2010 Subsonic jet noise reduction by microjets-a parametric study. Intl J. Aeroacoust. 9 (6), 705732.CrossRefGoogle Scholar
Zigunov, F., Sellappan, P. & Alvi, F.S. 2022 Reduction of noise in cold and hot supersonic jets using active flow control guided by a genetic algorithm. J. Fluid Mech. 952, A40.CrossRefGoogle Scholar
Figure 0

Figure 1. Schematic diagram of computational domain and boundary conditions for numerical simulations (not to scale). (a) Computational set-up for supersonic underexpanded planar jets; (b) magnified view of nozzle; (c) unsteady forcing with the spanwise wavenumber $k_ch=2 {\rm \pi}$.

Figure 1

Figure 2. A schematic diagram illustrating the spatial distribution of all monitoring points. The dashed lines indicate the regions of forcing and response for the acoustic resolvent analysis.

Figure 2

Figure 3. (a) The axial mean velocity fields normalized by the ideally expanded velocity $(\bar {u}/U_j)$ and (b) the instantaneous snapshots of the density gradient on a logarithmic scale $(\log _{10} |\nabla \rho |)$ along the $z/h=0$ plane. The dashed vertical white lines show the locations of the mean shock cell spacing based on the oblique shock reflection points in the jet shear layer.

Figure 3

Figure 4. (a) The instantaneous vortex structures in the jet plume with the $Q$-criterion $(Q=1)$ coloured by longitudinal velocity $v$ and the background is shown by the divergence of velocity. (b) Power spectral density of pressure fluctuations at the monitoring point M1 $(x/h,y/h,z/h)=(-0.39,0.85,0)$ and M3 $(x/h,y/h,z/h)=(30.13,10,0)$. The jet screech frequency $(St_s=0.113)$ and its harmonics are marked by vertical red dashed lines and the purple vertical dashed lines represent the predicted frequencies $(St_{th}=0.116)$ of the model.

Figure 4

Figure 5. (a) The eigenvalue spectra of SPOD for the baseline jet. (b) The isosurfaces $(\pm 0.01)$ of the real part of the streamwise velocity for SPOD modes at the screech frequency $St=0.113$ (6097 Hz). The eigenvalue and frequency corresponding to the screech mode are marked with a red circle in the eigenvalue spectra.

Figure 5

Figure 6. (a) The eigenspectra of $\boldsymbol {N}(\bar {\boldsymbol {q}})$ for spanwise wavenumbers $k_zh=0$. The red dashed line represents the neutral stability line. (b) The screech mode (i) and Mach wave radiation mode (ii) are expressed in terms of the real part of the streamwise velocity component.

Figure 6

Figure 7. The leading energy amplification between forcing and response for (a) standard resolvent and (b) acoustic resolvent.

Figure 7

Figure 8. The (a) forcing and (b) response modes of the standard resolvent for the real part of the streamwise velocity at frequencies $St_f=0.113$, $1.13$ and $2.0$ with spanwise wavenumbers $k_zh=0$, $2{\rm \pi}$, $4{\rm \pi}$ and $6{\rm \pi}$.

Figure 8

Figure 9. Phase diagram of the average OASPL reduction $(\Delta {OASPL_{avg}})$ in the control parameter space at different frequencies and spanwise wavenumbers for (a) $C_\mu =0.0015$ and (b) $C_\mu =0.0094$. Circular and square labels represent noise reduction and noise amplification, respectively.

Figure 9

Figure 10. The contour lines of the gain ratio ($\beta _{sa}/\beta _{la}$) for the modified base flows between different control amplitudes. Here $\beta _{sa}$ denotes the gain obtained with small amplitude control and $\beta _{la}$ represents the gain achieved with large amplitude control. Two controlled parameters are considered: (a) the control parameter of $(k_z h, St_f)=(4{\rm \pi}, 0.5)$ and (b) the control parameter of $(4{\rm \pi}, 1.13)$.

Figure 10

Figure 11. The OASPL for the baseline and controlled cases on the $z/h=0$ plane along the lines of (a$\sqrt {((x/h)^2+(y/h)^2)}=8$ and (b$y/h=10$.

Figure 11

Figure 12. The axial mean velocity fields normalized by the ideally expanded velocity $(\bar {u}/U_j)$ and the root-mean-square (r.m.s.) of the fluctuating longitudinal velocity ($v_{rms}/U_j$) along $z/h=0$ plane for the (a) baseline and (b) controlled cases. The dashed vertical white lines show the locations of the mean shock-cell spacing based on the oblique shock reflection points in the jet shear layer.

Figure 12

Figure 13. (a) Mean pressure distribution along centreline of the jet and (b) shear layer thickness.

Figure 13

Figure 14. The instantaneous vortex structures in the jet plume with the $Q$-criterion $(Q=1)$ coloured by longitudinal velocity $v$ and the background is shown by the divergence of velocity for (a) baseline and (bd) controlled cases.

Figure 14

Figure 15. The PSD of pressure fluctuations at the monitoring point (a,c,e) M1 $(x/h,y/h,z/h)=(-0.39,0.85,0)$ and (b,d,f) M3 $(x/h,y/h,z/h)=(30.13,10,0)$.

Figure 15

Figure 16. Schematic of an underexpanded supersonic jet.

Figure 16

Figure 17. Frequency–wavenumber spectra of the pressure fluctuation for four cases along the straight line of $(y/h, z/h)=(0.5, 0)$. The greyscale range is logarithmic and the red dashed line indicates the group velocity of the K-H instability waves.

Figure 17

Figure 18. Frequency–wavenumber spectra of the pressure fluctuation for four cases along the straight line of $(y/h, z/h)=(0, 0)$. The greyscale range is logarithmic.

Figure 18

Figure 19. The comparison of the eigenvalue spectra between the baseline and controlled cases for the first two most energetic modes.

Figure 19

Table 1. Growth rates obtained through global stability analysis for baseline and controlled cases.

Figure 20

Figure 20. Isolevels of the leading SPOD modes of streamwise velocity, and its spanwise decomposed Fourier modes for four different cases at the screech frequency, screech harmonics and forcing frequency. The four different cases are (a) uncontrolled, (b$(k_z h, St_f, C_{\mu })=(4{\rm \pi},0.5,0.0015)$, (c$(4{\rm \pi},0.5,0.0094)$ and (d$(2{\rm \pi},1.13,0.0015)$. Contour levels are uniformly set to $\pm 0.01$.