INTRODUCTION
The past decade has seen concerns expressed over blooms, future biogeographical expansion and habitat capitalization by pelagic species of the phylum Cnidaria (Mills, Reference Mills2001; Brodeur et al., Reference Brodeur, Sugisaki and Hunt2002; Lynam et al., Reference Lynam, Gibbons, Axelsen, Sparks, Coetzee, Heywood and Brierley2006; Attrill et al., Reference Attrill, Wright and Edwards2007; Purcell et al., Reference Purcell, Uye and Lo2007; Richardson et al., Reference Richardson, Bakun, Hays and Gibbons2009). Gelatinous plankton (subsequently referred to as jellyfish) blooms in coastal waters can have negative implications for human activities (Purcell et al., Reference Purcell, Uye and Lo2007; Purcell, Reference Purcell2009), with both social and economic repercussions (Doyle et al., Reference Doyle, Houghton, Buckley, Hays and Davenport2007), as well as potential impacts on other species competing for the same habitat (Lynam et al., Reference Lynam, Heath, Hay and Brierley2005a).
Fluctuations in jellyfish abundance have potentially been linked with climate indices such as the North Atlantic Oscillation (NAO) and the North Pacific Decadal Oscillation (NPDO) (e.g. Lynam et al., Reference Lynam, Hay and Brierley2004, Reference Lynam, Hay and Brierley2005b; Purcell, Reference Purcell2005) as well as variation in sea surface temperature (SST) (e.g. Lynam et al., Reference Lynam, Lilley, Bastian, Doyle, Beggs and Hays2011), pH (Attrill et al., Reference Attrill, Wright and Edwards2007), salinity (Bastian et al., Reference Bastian, Haberlin, Purcell, Hays, Davenport, McAllen and Doyle2011a), eutrophication (Purcell et al., Reference Purcell, Uye and Lo2007) and habitat modification (Richardson et al., Reference Richardson, Bakun, Hays and Gibbons2009). Future climate change may modify oceanographic dynamics, thereby further influencing (positively or negatively) abundance and distribution of marine planktonic communities (Hays et al., Reference Hays, Richardson and Robinson2005). These factors may also be related to increases in abundance associated with opportunistic expansion, following decreased predatory pressure as a result of declining fish abundance due to commercial fisheries (Pauly et al., Reference Pauly, Christensen, Dalsgaard, Froese and Torres1998; Mills, Reference Mills2001; Lynam et al., Reference Lynam, Gibbons, Axelsen, Sparks, Coetzee, Heywood and Brierley2006).
Large-scale spatial knowledge and understanding of jellyfish ecology is data deficient (Doyle et al., Reference Doyle, Houghton, Buckley, Hays and Davenport2007; Purcell, Reference Purcell2009), although local scale insight has improved. For coastal waters of the UK, an extensive review of historic literature (~100 years) (Russell, Reference Russell1970) exists, and more recently, jellyfish medusae studies have focused on the waters of the Celtic, Irish, and North Seas as well as the Solent estuarine system on the south coast of the UK. These studies have used a variety of methods to obtain data, including: ships of opportunity (Doyle et al., Reference Doyle, Houghton, Buckley, Hays and Davenport2007; Bastian et al., Reference Bastian, Haberlin, Purcell, Hays, Davenport, McAllen and Doyle2011a); trawl surveys (primarily as by-catch; Lynam et al., Reference Lynam, Hay and Brierley2005b, Reference Lynam, Lilley, Bastian, Doyle, Beggs and Hays2011; Bastian et al., Reference Bastian, Stokes, Kelleher, Hays, Davenport and Doyle2011b); aerial surveys (Houghton et al., Reference Houghton, Doyle, Davenport and Hays2006a, Reference Houghton, Doyle, Wilson, Davenport and Haysb; Lilley et al., Reference Lilley, Houghton and Hays2009); electronic tagging (Hays et al., Reference Hays, Bastian, Doyle, Fossette, Gleiss, Gravenor, Hobson, Humphries, Lilley, Pade and Sims2011); shoreline surveys (Doyle et al., Reference Doyle, Houghton, Buckley, Hays and Davenport2007); and analysis of historical records (Lilley et al., Reference Lilley, Houghton and Hays2009).
Analyses of incidentally-collected sightings/strandings data, from public recording schemes for other marine species, have identified significant spatial and temporal patterns and trends and provided insight into regional and large-scale national distributions (Witt et al., Reference Witt, Broderick, Johns, Martin, Penrose, Hoogmoed and Godley2007, Reference Witt, Hardy, Johnson, McClellan, Pikesley, Ranger, Richardson, Solandt, Speedie and Williams2012; Leeney et al., Reference Leeney, Amies, Broderick, Witt, Loveridge, Doyle and Godley2008; Pikesley et al., Reference Pikesley, Witt, Hardy, Loveridge, Loveridge, Williams and Godley2012). In the UK, a public sightings scheme (http://www.mcsuk.org/sightings/jellyfish.php) managed by the Marine Conservation Society (MCS), UK, allows members of the public and other interested parties to report sightings and strandings data for eight species of Cnidaria. These include six species of the class Scyphozoa: Aurelia aurita (Linnaeus, 1758) (moon); Cyanea capillata (Linnaeus, 1758) (lion's mane); Chrysaora hysoscella (Linnaeus, 1766) (compass); Cyanea lamarckii (Péron & Lesueur, 1810) (blue); Pelagia noctiluca (Forsskål, 1775) (mauve stinger) and Rhizostoma octopus (Macri, 1778) (root mouth or barrel); and two species of the class Hydrozoa: Physalia physalis (Linnaeus, 1758) (Portuguese man-of-war); and Velella velella (Linnaeus, 1758) (by-the-wind-sailor). The last two species are not true ‘jellyfish’ but are included in the MCS ‘Jellyfish’ Survey data for completeness, as they are occasionally found in coastal waters and on beaches of the UK. As far as we are aware, this database has the largest spatial and temporal coverage for jellyfish sightings in UK coastal waters.
Here we describe spatial and temporal patterns (including seasonal and annual trends) for these eight species of the phylum Cnidaria, across the coastal waters of the UK, between 2003 and 2011 (9 years), as recorded by the MCS UK national ‘Jellyfish’ Survey database.
MATERIALS AND METHODS
Data preparation
The MCS ‘Jellyfish’ Survey was initiated in 2003 to enhance the understanding of the spatial and temporal patterns of jellyfish occurrence in UK coastal waters, through the recording of sightings and strandings of the adult medusae. The MCS promotes public awareness of this scheme annually, typically at the end of July, through national and regional media releases (newspaper, radio and television). Awareness of the scheme is also furthered by marketing via the MCS website and by distribution of promotional materials, including electronic and hard copy ID cards (Supplementary Figure S1). Members of the public were required to submit their written records of sightings and strandings by post, using a standardized form, but this was superseded in 2007 by an on-line submission form.
The MCS UK database held 7229 records (2003–2011). A Geographical Information System (GIS) (ArcMap 10: ESRI, Redlands, US, http://www.esri.com) basemap was used for the UK and Ireland using coordinates conforming to the British National Grid (BNG) projection (metres). The locations of all sightings/strandings, hereafter referred to as sightings, were converted from Ordnance Survey grid references to decimal degree coordinates (longitude, latitude: WGS84); the year and month of occurrence for all sightings were also determined. These location data were added to the basemap, applying a transformation from WGS84 to BNG. These data were then validated as follows. Records without location data and/or date (N = 110, 1.5% of records), without species identification (N = 444, 6.1% of records) were removed. Absence records (no sightings recorded) (N = 673, 9.3% of records) were removed as there was no record of effort associated with these data and therefore they could not provide a meaningful contribution to the analysis. One individual recorder was identified within the dataset who had contributed data between 2004 and 2009 (N = 951, 13.2% of records) from a single location, Harlech Bay, North Wales, (~5.5 km of coastline). As these data, in part, conformed to a pseudo-standardized survey method they were removed to minimize bias and analysed separately. In total, 5051 records were retained for eight species of Cnidaria. Each of these remaining records represented single or multiple sightings, beached or at sea.
Statistical analysis
To investigate any relationship between sightings by year and preceding winter NAO (December, January, February and March) climate indices data were sourced (UCAR, 2013). To contextualize the number of yearly records received in relation to public awareness of the sightings scheme, a measure of yearly promotional effort (number of press hits that publicised the scheme) for printed media (2003 to 2010) was categorized using an ordinal scale of 1 (minimum) to 3 (maximum).
Spearman's rank correlations were calculated to investigate any relationship within our data between sightings by year as a proportion of all sightings and (a) preceding winter NAO and (b) promotional effort of the database. Generalized linear modelling (GLM) was used to investigate species-specific sightings as proportion of all sightings by year. Statistical analysis was undertaken with the program R (R Development Core Team, 2008).
To calculate the density of sightings we used a polygon sampling grid, divided by UK regional areas, to sum the coincident length of coastline and sightings locations for each polygon. This enabled us to calculate sightings km−1 for each region. To ascertain a spatial pattern of species richness we used a polygon sampling grid of 50 × 50 km squares to sum individual species occurring in each grid square. To investigate the potential for spatial patterns in cnidarian aggregations we used the same polygon sampling grid to sum individual species-specific sightings of 100 Cnidaria or more.
RESULTS
Temporal variation and species composition
MAIN DATABASE
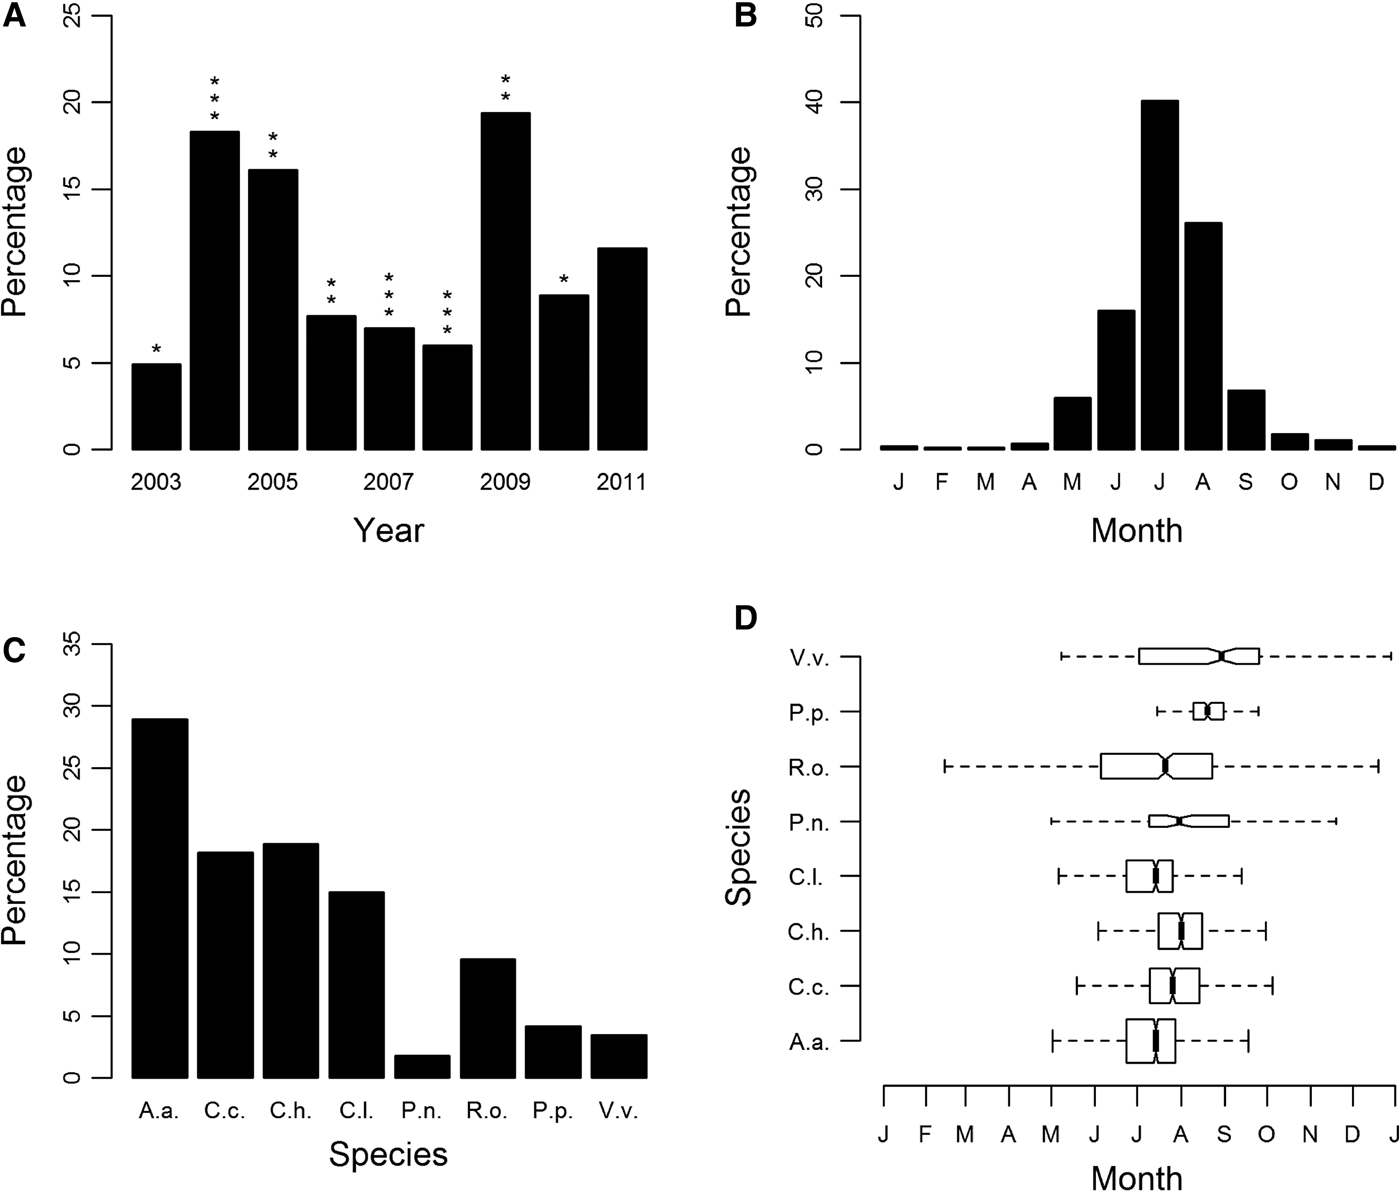
Sightings of jellyfish fluctuated annually, with peak years being 2004, 2005 and 2009 (Figure 1A; Supplementary Figure S2). There was no statistically significant correlation between yearly sightings and promotional effort of the scheme or between yearly sightings and winter NAO. Seasonality was clearly evident, with the number of records peaking in the months of June, July and August (Figure 1B).

Fig. 1. Sightings for all cnidarian species expressed as a percentage of sightings from 2003 to 2011 (main database): (A) by year; (B) by month; (C) species-specific sightings expressed as a percentage of all sightings from 2003 to 2011; (D) species-specific sightings by month. Box shows median and inter-quartile ranges. Box widths are proportional to the square-roots of the number of observations in the box, outliers are not drawn. In (A) asterisks indicate an assessment of the yearly promotional effort of the jellyfish sightings scheme categorized using an ordinal scale of 1 (minimum) to 3 (maximum) promotional effort. In (C) and (D) species are identified as follows: A.a., Aurelia aurita; C.c., Cyanea capillata; C.h., Chrysaora hysoscella; C.l., Cyanea lamarckii; P.n., Pelagia noctiluca; R.o., Rhizostoma octopus; P.p., Physalia physalis; V.v., Velella velella.
The most commonly sighted species was Aurelia aurita (N = 1460, 28.9% (of validated records)), there were also regular sightings for Cyanea capillata (N = 920, 18.2%), Chrysaora hysoscella (N = 955, 18.9%), Cyanea lamarckii (N = 756, 15%) and Rhizostoma octopus (N = 483, 9.6%) (Figure 1C). Of these, R. octopus was the only species with year-round presence (Figure 1D). The only other scyphozoan or ‘true’ jellyfish, Pelagia noctiluca was only recorded occasionally (N = 91, 1.8%), with infrequent sightings (Supplementary Figure S3E). Chrysaora hysoscella sightings significantly decreased during this study (GLM: F1,7 = 12.39, P < 0.01); this was the only species for which there was a statistically significant trend. The Hydrozoa, Physalia physalis (N = 211, 4.2%) and Velella velella (N = 175 3.5%) were also recorded infrequently with P. physalis having a very short sightings season (Figure 1D), with the vast majority of sightings occurring in 2008 and 2009; 93% of all P. physalis records were attributable to these years (Supplementary Figure S3G).
HARLECH BAY DATABASE
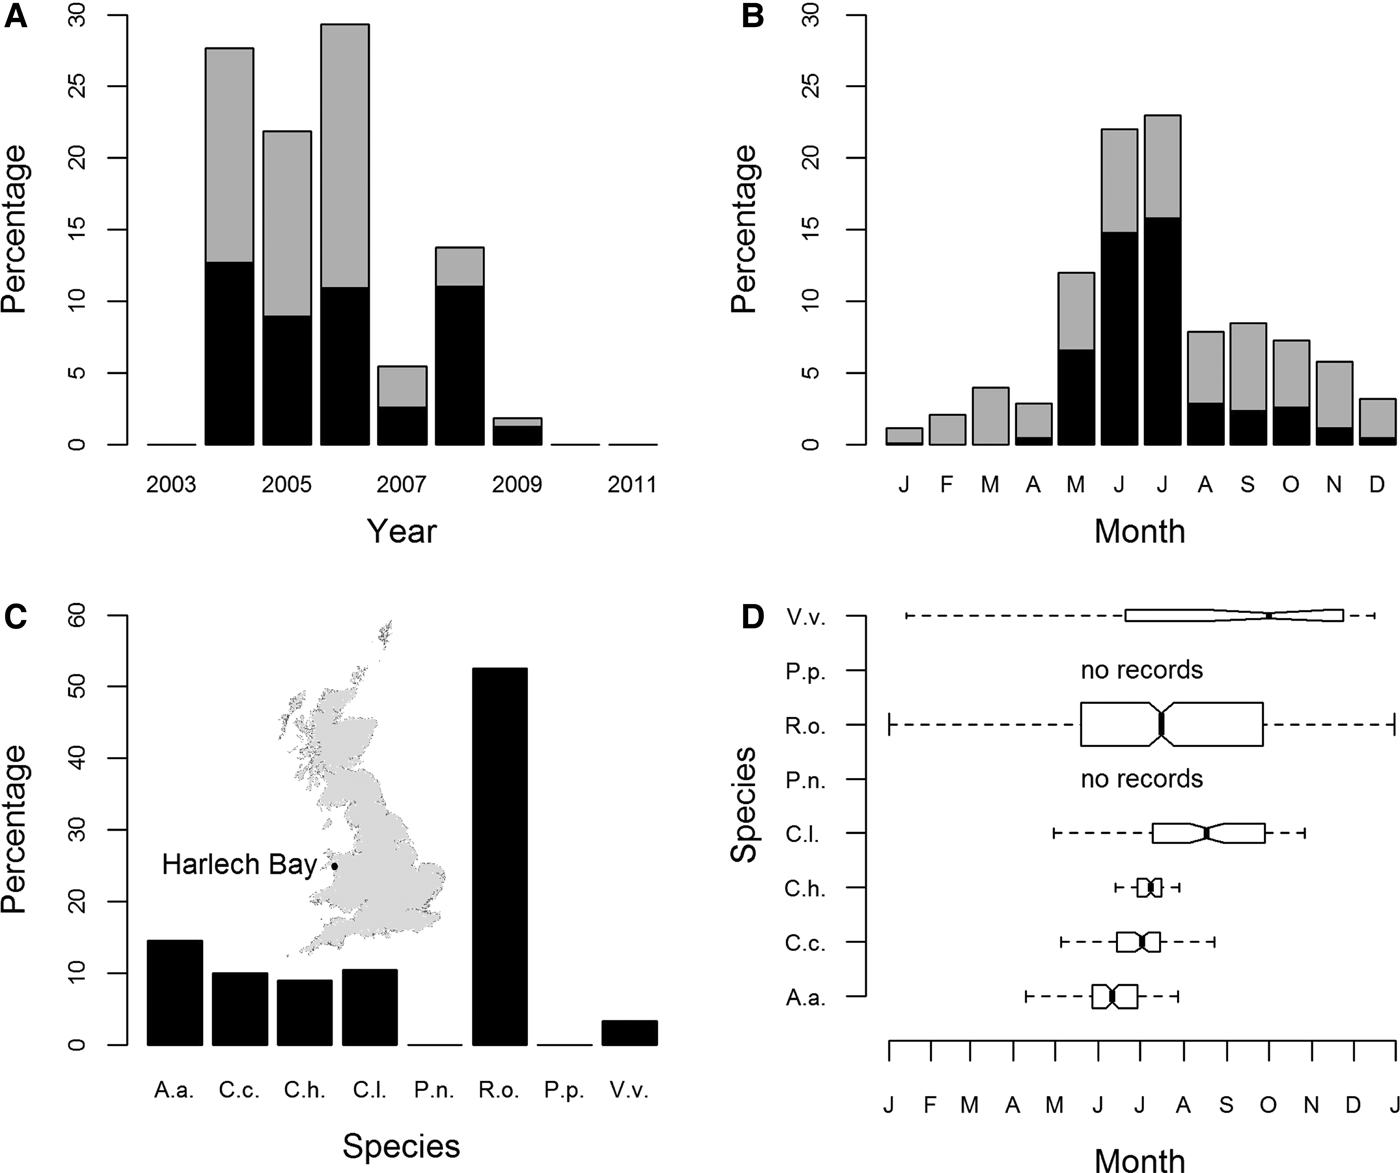
Peak years for sightings of jellyfish from Harlech Bay (location map: inset Figure 2C) were 2004, 2005 and 2006; records of sightings were lower for 2007, 2008 and 2009. There were no sightings data available for 2003, 2010 or 2011 (Figure 2A). Seasonality was clearly evident with the number of records peaking in the months of June and July (Figure 2B).

Fig. 2. Sightings for all cnidarian species expressed as a percentage of sightings from 2004 to 2009 (Harlech Bay database); (A) by year; (B) by month; (C) species-specific sightings expressed as a percentage of all sightings from 2004 to 2009; (D) species-specific sightings by month. Box widths are proportional to the square-roots of the number of observations in the box, outliers are not drawn. In (A) and (B) R. octopus sightings are shown as mid-grey, all other species as black. In (C) and (D) species are identified as in Figure 1. The inset in part (C) shows the location of Harlech Bay in relation to the UK.
The most commonly sighted species was R. octopus (N = 499, 52.5% (of validated records)) (Figure 2C). Five other species were regularly sighted: A. aurita (N = 139, 14.6%); C. capillata (N = 95, 10%); C. hysoscella (N = 86, 9%); C. lamarckii (N = 100, 10.5%); and V. velella (N = 32, 3.4%). Of these, R. octopus and V. velella were sighted throughout the year (Figure 2D). There was a marked decrease in the proportion of R. octopus sightings in 2008 and 2009, 20% and 33% of annual sightings, respectively, compared with the peak year for R. octopus sightings 2006, 63% of annual sightings (Supplementary Figure S4E). There were no recorded sightings for P. noctiluca or P. physalis (Figure 2D).
Spatial distribution
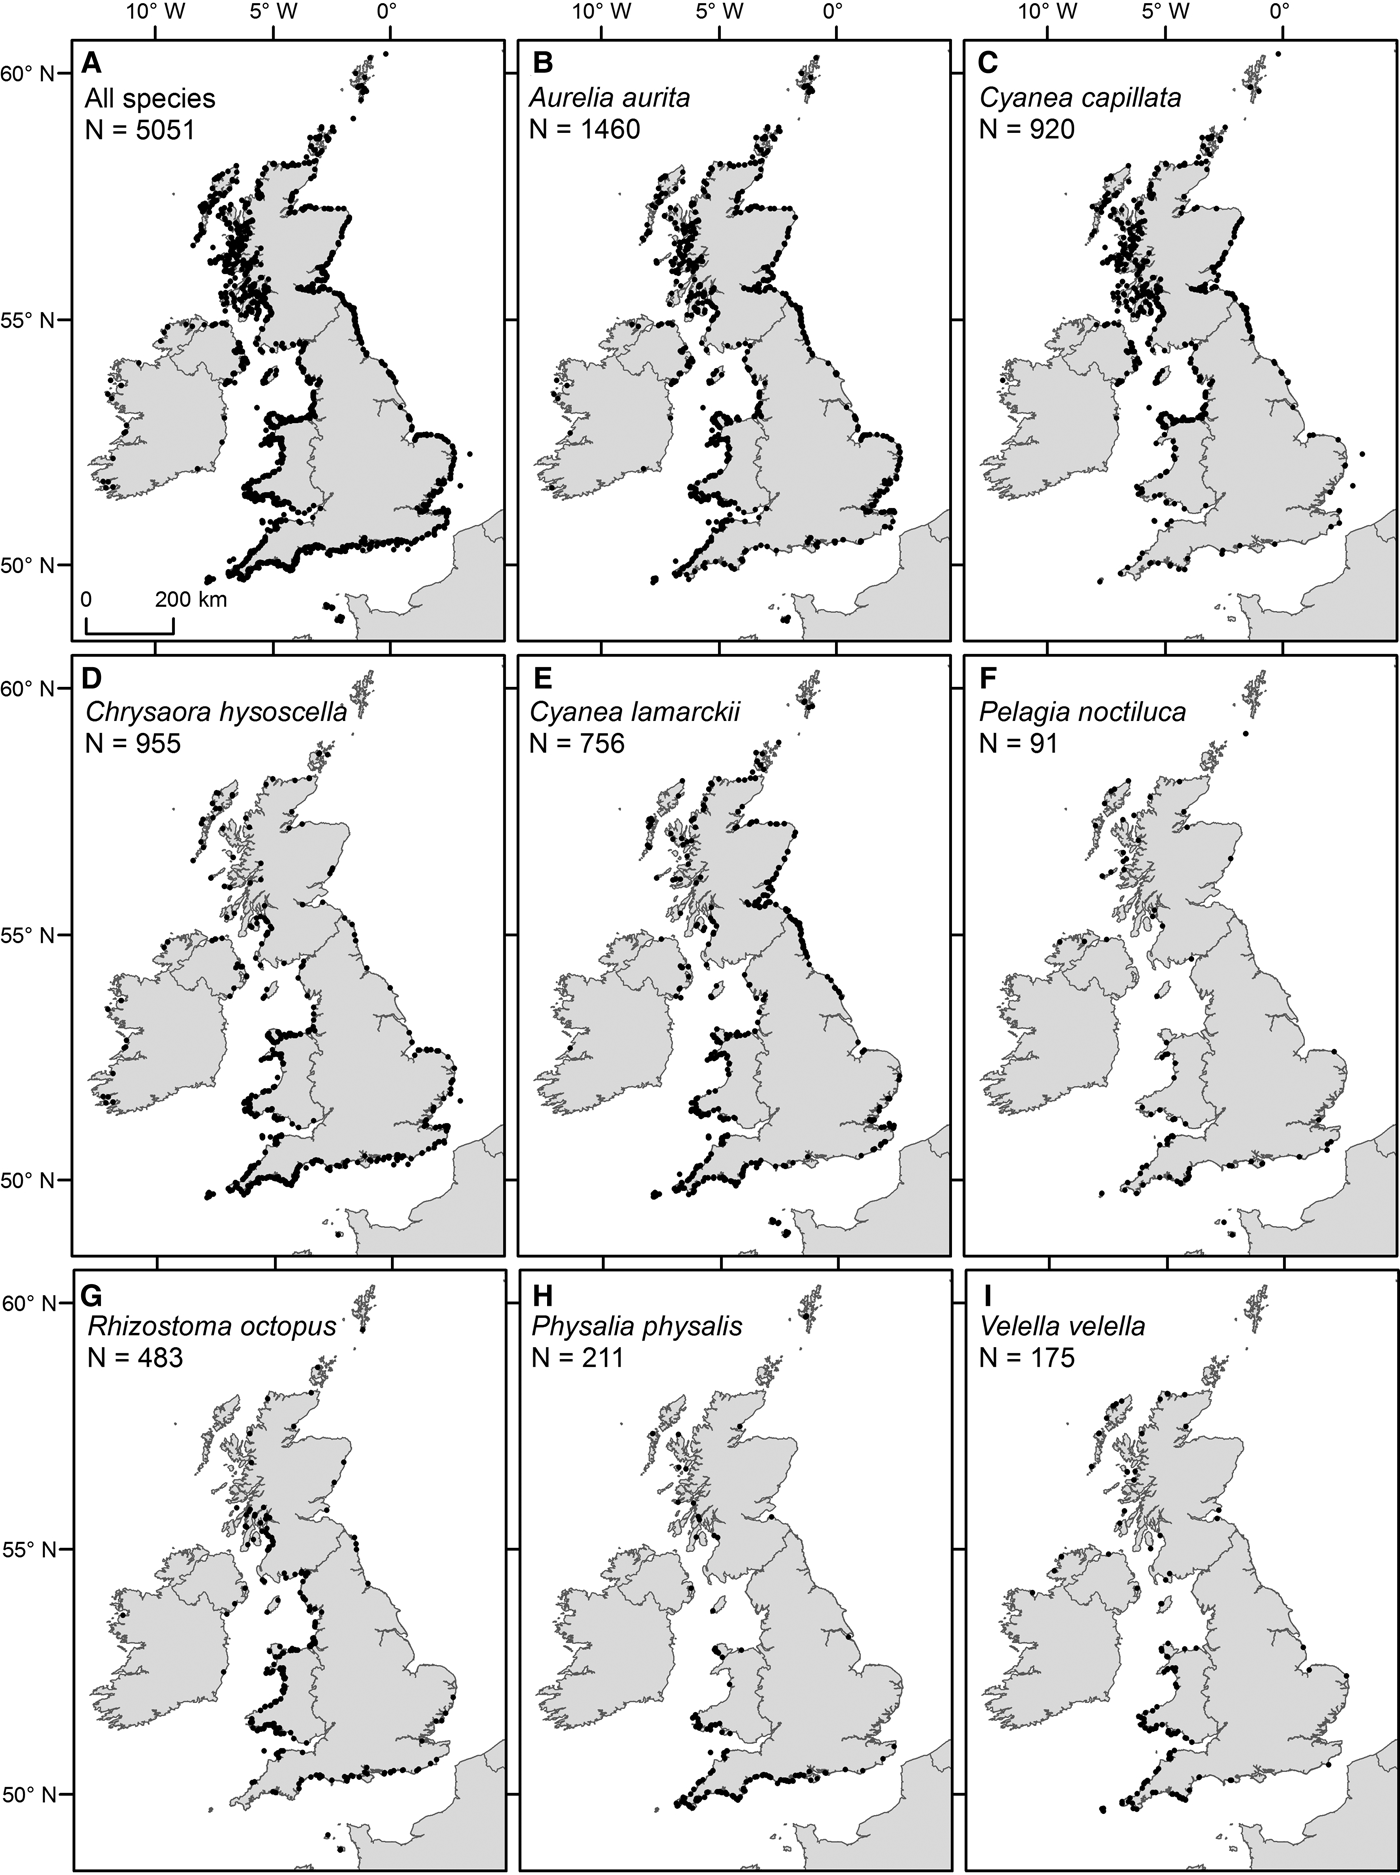
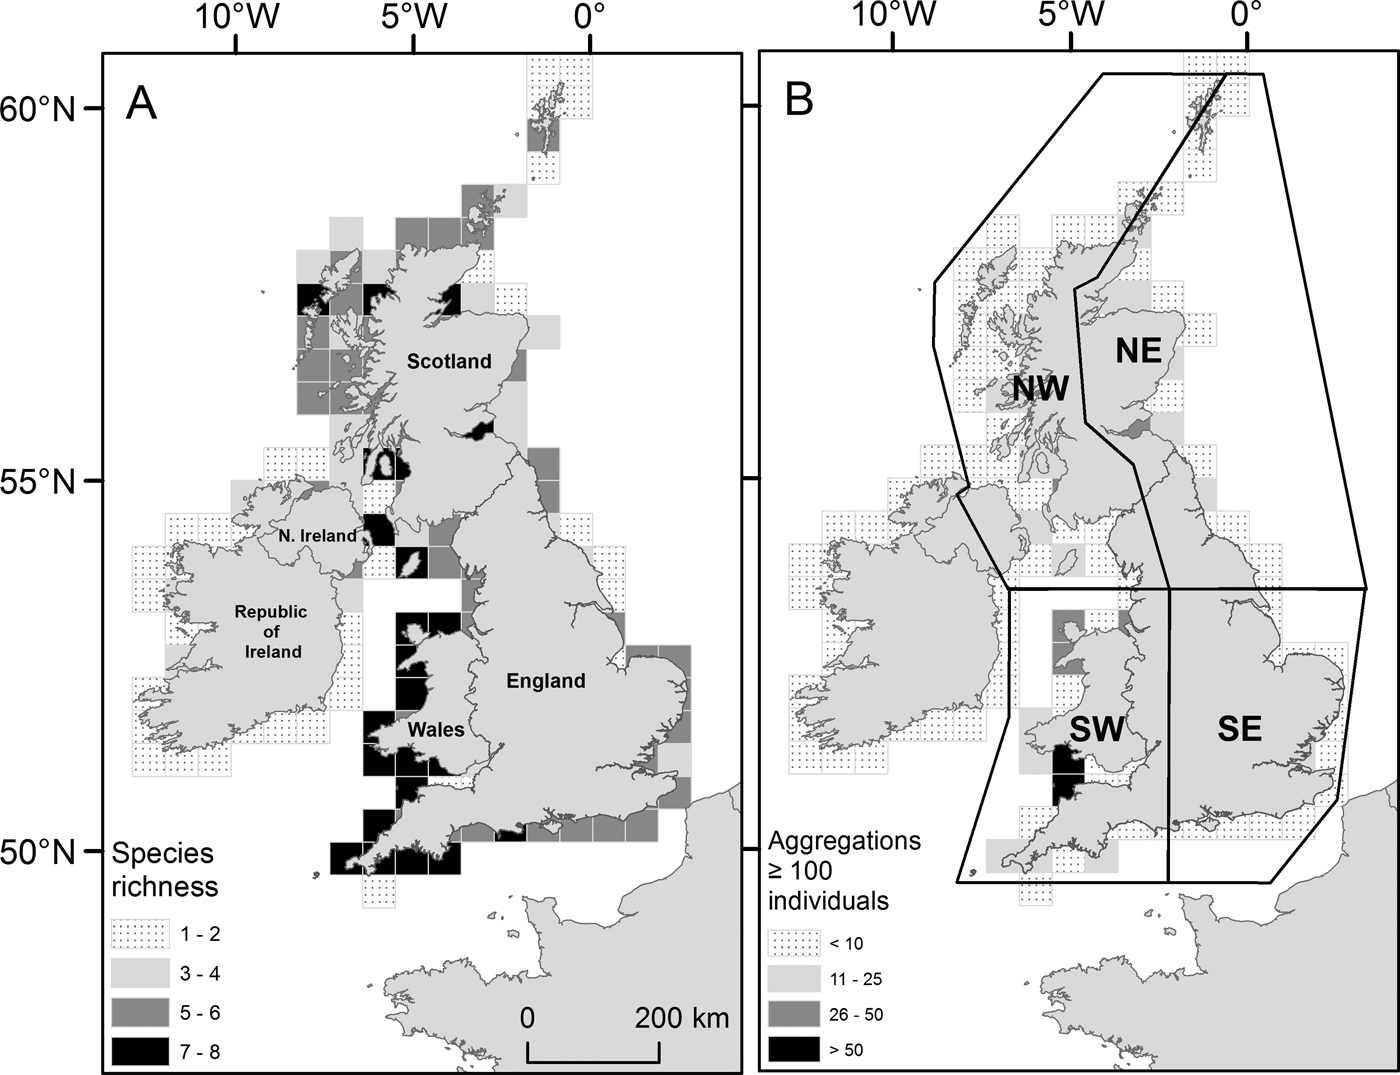
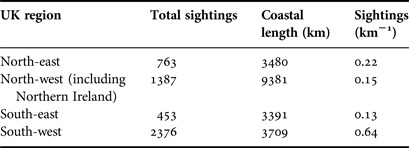
Within the main database for UK coastal waters (excluding the Republic of Ireland) the greatest number of sightings were from western shores (Figure 3A; Table 1). The south-west had the highest density of sightings (0. 64 sightings km−1), higher than the north-east (0.22 sightings km−1), the north-west (including Northern Ireland) (0.15 sightings km−1) and the south-east, which presented the lowest (0.13 sightings km−1); species richness was also greatest in the south-west (Figure 4A). The Bristol Channel had the highest incidence of species-specific cnidarian aggregations (Figure 4B).

Fig. 3. Spatial distribution of sightings from 2003 to 2011 (main database), for (A) all species and (B–I) specified species, as detailed in figure parts.

Fig. 4. (A) Species richness for Cnidaria sighted from 2003 to 2011 (main database) in UK coastal waters. Total number of individual species present summed by a 50 × 50 km sampling grid; (B) Cnidaria aggregations for UK coastal waters from 2003 to 2011 (main database). Species-specific sightings of 100 Cnidaria or more were summed using the same sampling grid as in (A). (A) and (B) are displayed in accordance with their respective monochrome shaded legend. UK regional areas are drawn in part (B): north-west (NW); north-east (NE); south-east (SE); and south-west (SW).
Table 1. Cnidaria sightings for UK coastal regions as defined in Figure 4B.

Of the most commonly sighted species, A. aurita were ubiquitously distributed (Figure 3B), C. capillata and C. hysoscella had a clear north/south divide in their distributions (Figure 3C, D) and C. lamarckii had a greater number of sightings to the south-west and north-east (Figure 3E). The key areas for sightings of R. octopus were the coastal waters of Wales and western Scotland (Figure 3G). Pelagia noctiluca, P. physalis and V. velella were predominantly sighted to the south and west of the UK (Figure 3F, H, I).
DISCUSSION
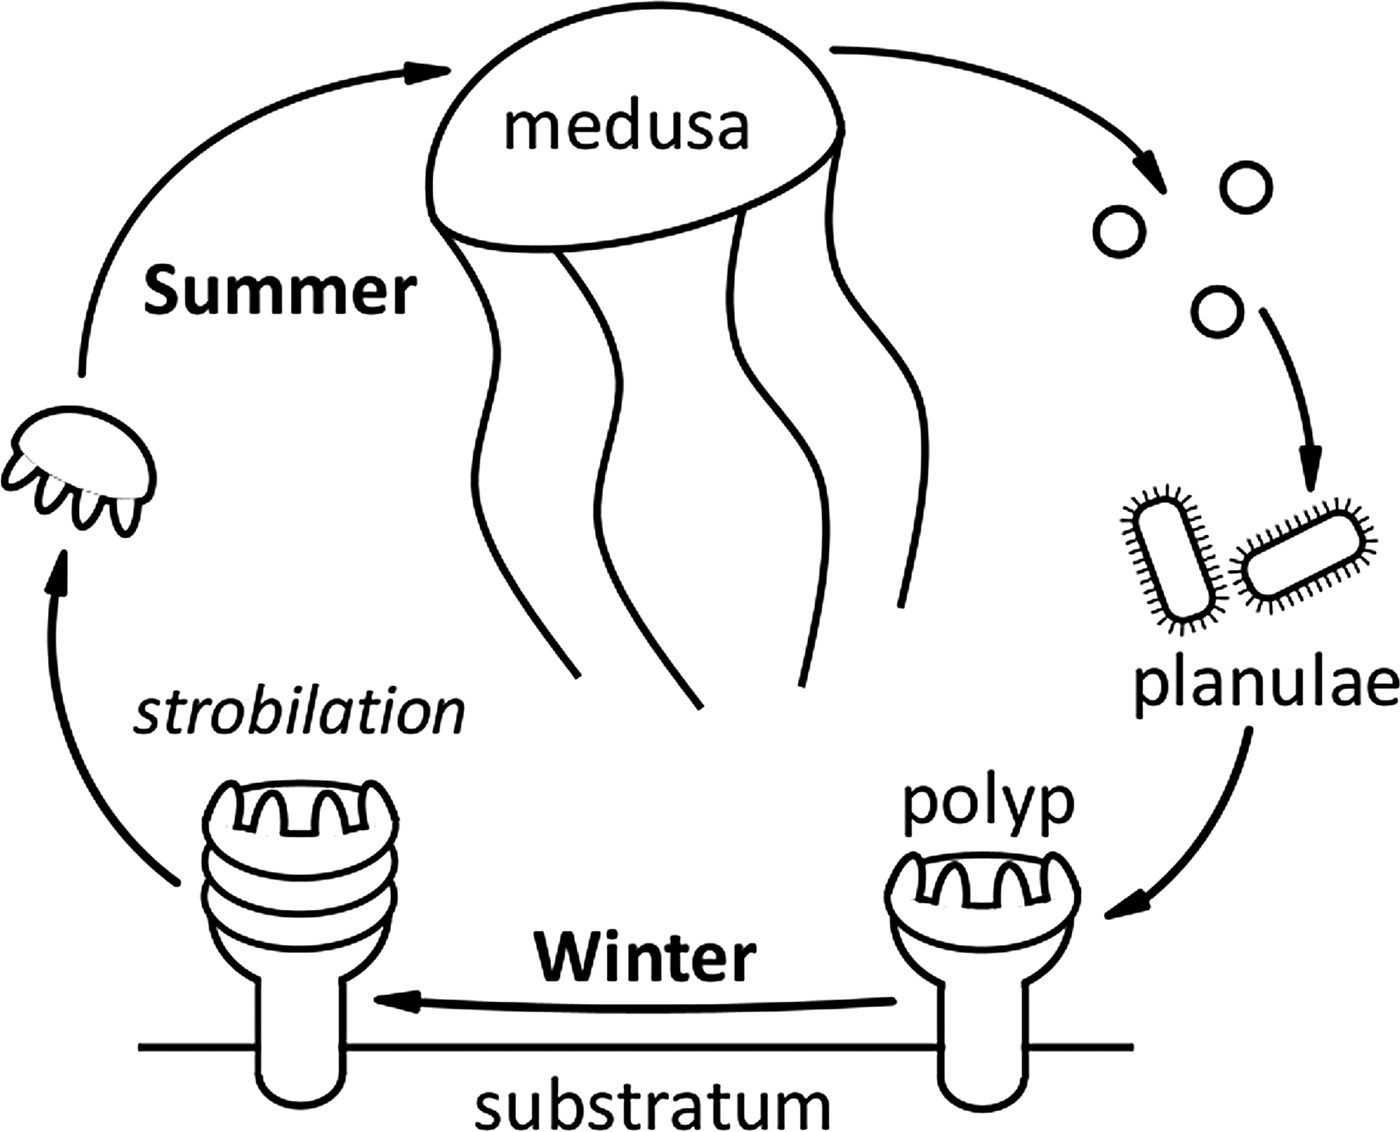
Six species of scyphomedusae are indigenous to UK coastal waters (Russell, Reference Russell1970). A typical scyphozoan life cycle results in adult medusae being present in the water column during the summer months (Figure 5). The presence of adult medusae then characteristically decreases through the autumn once eggs or planulae have been released. With the exception of the holopelagic Pelagia noctiluca, a suitable shallow, shaded, benthic substrata is required for attachment of these planulae and further development of the scyphistoma (Russell, Reference Russell1970). Both the main sightings database and the Harlech Bay subset reflected this life cycle, with seasonality of sightings of adult medusae clearly evident. The majority of Scyphozoa sightings occurred in the months of June, July and August; Aurelia aurita and Cyanea lamarckii appeared earlier in the season than Cyanea capillata and Chrysaora hysoscella, similar patterns have been previously recorded (e.g. Doyle et al., Reference Doyle, Houghton, Buckley, Hays and Davenport2007; Bastian et al., Reference Bastian, Haberlin, Purcell, Hays, Davenport, McAllen and Doyle2011a). Rhizostoma octopus had the longest sighting season of all Scyphozoa, which may be attributable to this species surviving into winter at greater depths (Russell, Reference Russell1970). The seasonality of R. octopus sightings also reflected previous studies (Doyle et al., Reference Doyle, Houghton, Buckley, Hays and Davenport2007).

Fig. 5. A typical Scyphozoa life cycle. A suitable shallow, shaded, benthic substrata is required for attachment of planulae and further development of the scyphistoma. Note: Pelagia noctiluca is an oceanic species with direct development and has no benthic stage; C. hysoscella is a hermaphrodite (Russell, Reference Russell1970).
Seasonality of Hydrozoa sightings varied considerably. Within the main database Velella velella were sighted March to January whereas Physalia physalis were predominantly sighted in late August, this was driven by mass sightings events in 2008 and 2009. Within the Harlech Bay data, sightings of V. velella were recorded throughout the year; no sightings were recorded for P. physalis. This lack of sightings for P. physalis seems contradictory, as both V. velella and P. physalis are oceanic, surface free-floating species, and therefore their distribution has the potential to be driven by prevailing wind conditions. Velella velella and P. physalis had similar spatial distribution patterns, with the majority of sightings from south-west shores. However, closer inspection revealed that P. physalis tended to be concentrated to the south of this region and V. velella to the north. This fine-scale nuance in distribution may be an artefact of P. physalis sightings being associated with the mass sightings events of 2008 and 2009.
There was no clear temporal trend in annual cnidarian sightings within the main database or the Harlech Bay subset; however, sightings from Harlech Bay decreased between 2007 and 2009. This decrease may be attributable to a diminished survey effort, although preceding years represented near continuous survey effort (MCS, personal communication). The main database showed inter-annual variability with notable peaks and troughs. There was no correlation between these and promotional effort of the sightings scheme or NAO. Timing and periodicity of recruitment of planulae to the seabed depends on a number of biotic and abiotic factors, such as sexual maturation and reproductive strategy of the medusa, water temperature and turbulence, and physical characteristics of the substratum (Lucas, Reference Lucas2001). Subsequent development of the scyphistoma (budding/strobilation), has been linked with factors such as temperature, salinity, light intensity and photoperiod (e.g. Purcell, Reference Purcell2007), dissolved oxygen concentrations (Condon et al., Reference Condon, Decker and Purcell2001) and prey availability (Han & Uye, Reference Han and Uye2010). Inter-annual variability may also be driven by hydroclimatic forcing such as wind stress, temperature or currents (Lynam et al., Reference Lynam, Hay and Brierley2004) or through transition in climate regimes (Brodeur et al., Reference Brodeur, Decker, Ciannelli, Purcell, Bond, Stabeno, Acuna and Hunt2008). There is also evidence for contrasting relationships between climate indices and Scyphozoa abundance that may also be related to locally variable oceanographic parameters (Lynam et al., Reference Lynam, Hay and Brierley2005b, Reference Lynam, Lilley, Bastian, Doyle, Beggs and Hays2011; Attrill et al., Reference Attrill, Wright and Edwards2007). As this study holds records for multiple species over a wide spatial extent, it is unlikely that one environmental or biological parameter can explain variability in temporal trends. The observed patterns are likely manifest from environmental forcing resulting in a combination of environmental and biological drivers influencing species biology.
Species-specific inter-annual variability was also evident, and the records of no one cnidarian species displayed a uniform temporal pattern. There was a significant decreasing trend for C. hysoscella. However, our data spans a short time-frame (9 years) and this trend may not be representative of long-term trends. Indeed, evidence exists for worldwide oscillations in jellyfish populations of approximate 20 year periodicity (Condon et al., Reference Condon, Duarte, Pitt, Robinson, Lucas, Sutherland, Mianzan, Bogeberg, Purcell, Decker, Uye, Madin, Brodeur, Haddock, Malej, Parry, Eriksen, Quiñones, Acha, Harvey, Arthur and Graham2013). However, robust detection of trends in jellyfish populations are hampered by a lack of a defined baseline; more specifically there is a paucity of long-term data sets, >20 years (Condon et al., Reference Condon, Graham, Duarte, Pitt, Lucas, Haddock, Sutherland, Robinson, Dawson, Decker, Mills, Purcell, Malej, Mianzan, Uye, Gelcich and Madin2012).
The south-west region had the highest number of sightings (and greatest coastline densities), greatest species richness, and also had the highest incidence of cnidarian aggregations. Aurelia aurita were universally distributed throughout the regions with highest abundance of all species, this is recognized as a cosmopolitan species (Russell, Reference Russell1970; Lucas, Reference Lucas2001). However, there were clear geographical demarcations between some species; C. hysoscella were nearly always observed in southerly waters, whereas C. capillata were sighted in northerly waters. This spatial delineation probably reflects the availability of suitable thermal niches for these species (Holst, Reference Holst2012). Rhizostoma octopus were principally sighted in coastal waters of western Scotland and Wales. The Harlech Bay database identified this area as a hotspot for R. octopus, with this species accounting for 57% of all sightings between 2004 and 2007, although there was a marked decrease of sightings during 2008/2009, the reason for which is unclear. Pelagia noctiluca were primarily sighted in south-west and north-west waters. There were no sightings from Harlech Bay. This is an oceanic species with direct development (no benthic life cycle stage), and is previously described as occurring off western shores in association with oceanic waters (Russell, Reference Russell1970). The distribution patterns for V. velella and P. physalis were comparable to each other, with the majority of sightings from south-west shores. As south-westerly winds prevail for winter, summer and autumn across the UK (Lapworth & McGregor, Reference Lapworth and McGregor2008) these spatial patterns potentially reflect the wind conditions at the time, driving the distribution of these free-floating surface species.
Without quantification of sightings effort, analysis of incidentally collected data should be made cautiously. However, data collected through citizen-science schemes can provide a valuable resource (Silvertown, Reference Silvertown2009), and with appropriate care, these data can provide an insight into species' regional and national patterns and trends (Pikesley et al., Reference Pikesley, Witt, Hardy, Loveridge, Loveridge, Williams and Godley2012; Witt et al., Reference Witt, Hardy, Johnson, McClellan, Pikesley, Ranger, Richardson, Solandt, Speedie and Williams2012). In this study, incidentally-collected data for cnidarian species have been seen to reflect previously-documented temporal and spatial patterns. In addition, data collected from a single location over a significant timescale have revealed location-specific trends.
Although studies of this nature may not be able to isolate the drivers behind observed patterns, they can provide for large-scale (spatial and temporal) coverage that would otherwise be logistically and financially unfeasible. We also suggest that they have the potential to contribute significantly to baselines, providing both seasonality and distribution data (particularly when data are derived from survey schemes that are ongoing), from which future changes in patterns or trends may be identified. The likelihood of important insights being more robustly elaborated would be greatly increased by the incorporation of focused, effort-corrected surveys at locations along the UK coastline, including all nil returns, in at least some locations across the geographical footprint of the project.
ACKNOWLEDGEMENTS
The authors thank Derryck Greenwood and all participants in the Marine Conservation Society (MCS) jellyfish survey who generously contributed their data. The authors acknowledge the constructive input from two anonymous referees and the Associate Editor.
FINANCIAL SUPPORT
This work was funded by MCS. B.J.G. receives funding from the EU (Interreg 3a-MERiFIC; Intelligent Energy SOWFIA; European Social Fund) and the Natural Environment Research Council.
Supplementary materials and methods
The supplementary material refered to in this paper can be found online at journals.cambridge.org/mbi.

