


1. Introduction
Historically, designers have been found to empathize more easily with users who are similar to them (Li & Hölttä-Otto Reference Li and Hölttä-Otto2020; Li et al. Reference Li2021). As a result, they may struggle to identify with users who they perceive to be different from themselves, whether this is due to differences in their bodies, demographics or culture. The lack of demographic diversity in the US engineering workforce thus presents challenges when designing for a wide variety of end users with diverse needs. For example, although many widespread products, such as cars, are intended for use by the general population, less than 20% engineers in the US are women (United States Bureau of Labor Statistics 2023), meaning that women’s perspectives are greatly underrepresented in design processes. Historically, only test dummies representing the average-sized male body have been used in vehicle crash safety assessments (Linder & Svensson Reference Linder and Svensson2019), resulting in car safety systems, such as seat belts, being optimized for men’s bodies instead of women’s bodies. Consequently, women are 47% more likely than men to sustain severe injuries in a comparable seatbelt-restrained car accident (Bose, Segui-Gomez, & Crandall Reference Bose, Segui-Gomez and Crandall2011).
Availability bias is the tendency to bias judgments toward information that most readily comes to mind (Tversky & Kahneman Reference Tversky and Kahneman1973). In design, availability bias has been found to lead engineers to over- or underestimate the size of a potential market based on their preexisting understanding of customer needs and demand or based on their personal knowledge of the market (Fillingim, Shapiro, & Fu Reference Fillingim, Shapiro and Fu2022). We posit that availability bias may also manifest as designers projecting their own needs, wants or characteristics onto a hypothetical user, resulting in the aforementioned lack of consideration for diverse users. This paper will present findings from a design activity developed to elicit availability bias in professional engineers and designers, allowing an investigation of how this implicit cognitive bias may impact concept development as well as perceptions of users. The second main goal of this study is to formalize a cognitive bias mitigation treatment and examine its impact on the outcomes of the design activity.
1.1. Empathy in design
Empathy-building is a key factor for successful design and should be applied throughout the design process (Chang-Arana et al. Reference Chang-Arana2022), but it is most critical early in the design process when user involvement is high (Surma-Aho, Björklund, & Hölttä-Otto Reference Surma-Aho, Björklund and Hölttä-Otto2018). The Stanford d.school model of human-centered design features empathy as the “centerpiece” and first step of human-centered design processes, followed by problem definition, ideation, prototyping and testing (Hasso Plattner Institute of Design 2010). Surma-aho and Hölttä-Otto (Reference Surma-aho and Hölttä-Otto2022) identified understanding, action, research, orientation and mental processes as the five core principles that form the concept of empathy in design. Empathy-building may be integrated into customer need-finding methods through user observations, interviews, focus groups, complaints or surveys (Ulrich & Eppinger Reference Ulrich and Eppinger2007; ideo.org 2015). The modality through which a design problem is communicated to a design team, such as narrative storytelling or personas (fictional representations of users), can also foster engagement and empathy between a designer and user (Grudin Reference Grudin2006; Chen, Nivala, & Chen Reference Chen, Nivala, Chen and Stephanidis2011; Carmel-Gilfilen & Portillo Reference Carmel-Gilfilen and Portillo2016; Marsden & Haag Reference Marsden and Haag2016). Despite these strategies, designers’ inherent cognitive biases can inhibit the development of equitable designs, although this phenomenon is not well-studied in the field of mechanical design.
Work on wearable simulations has sought to expand designers’ ability to empathize with physically disabled users (Heylighen & Dong Reference Heylighen and Dong2019). For example, McDonagh, Woodcock, and Iqbal (Reference McDonagh, Woodcock and Iqbal2018)) found that using glasses, ear plugs and gloves to reduce hand sensation to simulate the experience of users with reduced physical senses was effective in building empathy in designers. Raviselvam, Hölttä-Otto, and Wood (Reference Raviselvam, Hölttä-Otto and Wood2016)) found that simulating visual impairments in designers resulted in higher empathy and more creative designs developed for visually impaired users compared to designers who were simply briefed about the target users, and these benefits were enhanced when designers had a pre-existing connection to the target user population (Raviselvam et al. Reference Raviselvam2017). Designers in a study by Boffi et al. (Reference Boffi2014) wore a hand-shaking device to simulate the experience of users with Parkinson’s disease while using a product, but researchers ultimately found that a greater understanding of the end-users resulted from close observation and interaction with them. The Engineering Design Center at the University of Cambridge offers an online Inclusive Design Toolkit containing resources such as a calculator allowing designers to calculate the percentage of British adults who would be unable to effectively use a product or service and the opportunity to purchase glasses and gloves that simulate vision loss or mobility limitations (Engineering Design Centre, University of Cambridge 2024).
Cook stoves make an excellent case study for failure to empathize with the end user while designing a product. In South Asia, 75% of families use biomass fuels for energy (Bailis et al. Reference Bailis2015). When used indoors, biomass stoves create toxic fumes that are responsible for 2.9 million yearly deaths worldwide (Olopade et al. Reference Olopade2017). However, efforts to develop and implement improved cookstoves have low adoption rates because they lack basic design attributes that would meet the needs of users (Khandelwal et al. Reference Khandelwal2017), causing an increase in cooking time and active attendance to the stove (Perez Reference Perez2019). In this scenario, the problem was that stove designers, men located in the U.S., did not consult the Bangladeshi women who would be using the stove, instead prioritizing technical parameters in their design process. As a result, 98% of the population of rural Bangladesh continued to use traditional biofuel-burning stoves, despite hundreds of attempts to introduce cleaner stoves since the 1980s (Bailis et al. Reference Bailis2015; Perez Reference Perez2019).
As a counterexample, the Embrace baby incubator is an award-winning incubator designed for low-birth-weight babies in countries with less industrialized economies (“Embrace”, no date). While designing this product, the design team traveled to rural Nepal to conduct their need-finding, where they found that an incubator would be useless to the customers who needed it most if it was to run on electricity and be kept in a hospital. The result of this project was the Embrace incubator, which was developed to keep babies warm using a packet of phase-change material inside a type of sleeping bag that was designed for easy integration into local culture (Misra Reference Misra2014). This case study reinforces the need for empathic design and successfully implements some of the techniques described above. Given its success, further study is needed to understand the factors that cause the story of the failed cookstoves to be more common than the story of the successful Embrace incubator and to explore the effect of designers’ empathy with end users.
These studies highlight dramatic challenges that can arise when designing for an end user outside of one’s own culture. Even within the same community and culture, a breakdown in understanding and empathy between designers and users can have catastrophic impacts. As previously discussed, the usage of male-bodied crash test dummies has resulted in higher rates of severe injuries for women in seatbelt-restrained car accidents compared to men (Bose et al. Reference Bose, Segui-Gomez and Crandall2011; Linder & Svensson Reference Linder and Svensson2019). Even more dangerous than being a woman driver is being a pregnant woman driver – the largest cause of accidental death for pregnant women is automobile accidents. Guidance on how to properly position a seatbelt on one’s body is challenging and uncomfortable to apply to a pregnant body, resulting in decreased seatbelt use among pregnant women (Acar, Edwards, & Aldah Reference Acar, Edwards and Aldah2018). To better protect pregnant women and their fetuses, products such as seat belt extenders have been created to be used as an aftermarket modification to seat belts.
Despite the positivity of innovations such as this, the question remains: why don’t cars accommodate women’s pregnant bodies in the first place? With over 3 million births registered in the United States in 2020 (National Center for Health Statistics 2022), pregnant women comprise a not-insignificant proportion of automobile users. Even when not pregnant, women still expose themselves to significantly more risk than men do when driving a car. While this design flaw (and others) has been retroactively identified as harmful to women, the damage has been done. There has been little formal investigation into when and how the design process disadvantages women or other members of underrepresented groups in engineering. A deeper understanding of how the design process is affected by cognitive bias would allow designers to proactively prevent situations such as this, rather than remaining blind to them until statistics begin to show consequences.
1.2. Cognitive bias in design
Although heuristics (defined by Fu, Yang, and Wood (Reference Fu, Yang and Wood2016)) as “a context-dependent directive, based on intuition, tacit knowledge, or experiential understanding, which provides design process direction to increase the chance of reaching a satisfactory but not necessarily optimal solution” are often leveraged in engineering as valuable education tools, the erroneous application of heuristics as mental shortcuts may manifest as cognitive bias in a variety of scenarios (Tversky & Kahneman Reference Tversky and Kahneman1974). Korteling and Toet (Reference Korteling, Toet and Sala2022) identified four “tendencies,” or categories of cognitive bias, that humans exhibit when carrying out high-complexity tasks such as decision-making. In short, these tendencies are (1) to associate (unrelated) information, (2) to prioritize information in accordance with present beliefs, (3) to retain information or to falsely believe that information is relevant and (4) to ignore relevant information while focusing on more accessible information (Korteling & Toet Reference Korteling, Toet and Sala2022). The following paragraphs will provide examples of cognitive biases that correspond to each tendency and a brief discussion of how the biases may manifest in the design field.
The tendency to establish relationships and patterns by associating information that may not be related can often manifest as representativeness bias, stereotyping, or superstition (Korteling & Toet Reference Korteling, Toet and Sala2022). The representativeness heuristic leads people to evaluate the probability of an occurrence based on similarities to a “typical case” rather than by simple base rate (Kahneman & Tversky Reference Kahneman and Tversky1972). In other words, people may falsely believe that a small sample of information is representative of a larger population. Representativeness bias can also lead to drawing inaccurate conclusions about large groups from small or incomplete samples, which, in design, may manifest as the stereotyping of a target user group (Hallihan, Cheong, & Shu Reference Hallihan, Cheong and Shu2013). In some cases, people are even able to recognize that they hold erroneous stereotypes and associations, but superstition leads them to follow these beliefs regardless (Risen Reference Risen2016).
The tendency to prioritize information according to current expectations, knowledge and choices may manifest as sunk cost fallacy, belief bias, cognitive dissonance, familiarity bias, status quo bias or system justification (Korteling & Toet Reference Korteling, Toet and Sala2022). Both status quo bias and sunk cost fallacy can lead to negative outcomes as a result of the desire to “stay the course” or maintain a current plan or decision (Samuelson & Zeckhauser Reference Samuelson and Zeckhauser1988; Arkes & Ayton Reference Arkes and Ayton1999). In particular, sunk cost fallacy results from a desire to save money, time or effort (Arkes & Blumer Reference Arkes and Blumer1985). In engineering, when time and resources have been invested into developing physical prototypes, designers tend to fixate on concepts that have been prototyped as a way of avoiding perceived wastefulness (Viswanathan & Linsey Reference Viswanathan and Linsey2013). Design fixation, sunk cost fallacy and status quo bias contribute toward less innovation, novelty and variety in ideation and in design solutions (Fillingim et al. Reference Fillingim, Shapiro and Fu2022).
The tendency to retain information that is irrelevant or better ignored can lead to decision-making based on impertinent information and may manifest as hindsight bias, anchoring bias, outcome bias or framing bias (Korteling & Toet Reference Korteling, Toet and Sala2022). For example, framing a question about a design problem or concept with either positive or negative connotations can impact the way designers answer the questions (Tversky & Kahneman Reference Tversky and Kahneman1981; Fillingim et al. Reference Fillingim, Shapiro and Fu2022). The effort heuristic, in which solution alternatives are evaluated based on the amount of effort put into developing them rather than their actual value (Kruger et al. Reference Kruger2004), can also impact designers’ desire to bring a product to market based on the amount of effort they felt they had put into developing the product (Fillingim et al. Reference Fillingim, Shapiro and Fu2022). The views and preferences of teammates may account for potential sources of bias in design decision-making. The bandwagon effect can lead to a tendency to “join the crowd” (Leibenstein Reference Leibenstein1950), resulting in a bias toward the majority opinion or preference on a design team (Fillingim et al. Reference Fillingim, Shapiro and Fu2022). Another finding related to bias impacting design teams by Fillingim et al. (Reference Fillingim, Shapiro and Fu2022)) revealed that designers exhibited hindsight bias by believing that they should have advocated more for their ideas throughout the course of a design project, or that mistakes made should have been easily avoidable.
Finally, the tendency to focus on certain information for decision-making while neglecting relevant information may manifest as confirmation bias, availability bias, survivorship bias, ego-centric bias or the priority heuristic (Korteling & Toet Reference Korteling, Toet and Sala2022). Most of these biases relate to erroneous prioritization of information; for example, the priority heuristic refers to a tendency to base decisions on a single prominent piece of information (Brandstätter, Gigerenzer, & Hertwig Reference Brandstätter, Gigerenzer and Hertwig2006). Confirmation bias is a tendency to seek out and interpret evidence or information that supports one’s pre-existing beliefs, often accompanied by a disregard for disconfirming information (Nickerson Reference Nickerson1998). Confirmation bias has been directly studied in the design field, with researchers finding that the bias may lead to the discounting of unexpected information about a product or user group (Hallihan et al. Reference Hallihan, Cheong and Shu2013), or a preference toward making design decisions in line with user feedback that confirmed designers’ initial beliefs (Fillingim et al. Reference Fillingim, Shapiro and Fu2022).
Availability bias is the tendency to bias judgments toward information that most readily comes to mind (Tversky & Kahneman Reference Tversky and Kahneman1973). In design, this may lead engineers to over- or underestimate the size of a potential market based on their preexisting understanding of customer needs and demand or based on their personal knowledge of the market (Fillingim et al. Reference Fillingim, Shapiro and Fu2022). Similarly, ownership bias may result in the inflated importance of customer needs that a designer was previously aware of Fillingim et al. (Reference Fillingim, Shapiro and Fu2022), but it may also manifest as a preference for one’s own ideas compared to others’ ideas on a design team (Toh et al. Reference Toh2016). Toh, Strohmetz, and Miller (Reference Toh, Strohmetz and Miller2016)) further explored ownership bias in engineering design teams and found that while men exhibited ownership bias as a preference toward their own ideas, women were more likely to show the opposite bias by selecting ideas generated by their teammates. Survivorship bias, the tendency to overlook elements that did not survive a selection process (Brown et al. Reference Brown1992), may also manifest in concept selection in the form of discarding customer needs or design features that were not prioritized in the selected concept.
1.3. Bias mitigation
Education or training specifically designed for raising awareness of bias, such as workshops (Carnes et al. Reference Carnes2015) or brochures (Legault, Gutsell, & Inzlicht Reference Legault, Gutsell and Inzlicht2011), has been tested in a diverse range of fields to varying degrees of success. In “draw a scientist” tests (DASTs), researchers were able to increase the proportion of women scientists drawn by children after an intervention involving classroom visits with women scientists (Flick Reference Flick1990). This technique can be used to reduce bias even when it is not performed face to face; exposure to information about women’s successes in traditionally masculine occupations has been found to be successful in reducing gender bias in hiring selection decisions (Heilman & Martell Reference Heilman and Martell1986). An intervention developed by Jenkins and Youngstrom (Reference Jenkins and Youngstrom2016) was successful in reducing occurrences of base rate neglect and search-satisfying bias. The intervention consisted of education on common cognitive pitfalls when making diagnoses of pediatric bipolar disorder, as well as information on avoiding these common pitfalls in the future. However, similar interventions targeting self-serving bias (Babcock & Loewenstein Reference Babcock and Loewenstein1997), availability bias and search-satisfying bias (Sherbino et al. Reference Sherbino2011, Reference Sherbino2014) did not yield a significant improvement in participants’ decision-making skills.
A similar form of bias education, video interventions for diversity in STEM (VIDS), was developed by Moss-Racusin et al. (Reference Moss-Racusin2018) with the goal of targeting gender biases that contribute to the underrepresentation of women in STEM. VIDS leveraged both narrative storytelling as well as facts presented by experts to successfully increase awareness of gender bias, positive attitudes toward women in STEM, anger, empathy and motivation to promote gender parity in STEM fields (Moss-Racusin et al. Reference Moss-Racusin2018). Serious games, or applied games, have been shown to be even more effective than bias training videos due to their interactive elements (Dunbar et al. Reference Dunbar2017). Missing is one such educational game in which participants search for a missing neighbor in a first-person point-of-view game targeted at eliciting and mitigating bias blind spot, confirmation bias and fundamental attribution error (Barton et al. Reference Barton2016). The game was not only successful in producing debiasing effects within the initial study session but also in producing positive effects that persisted for at least 2 months (Morewedge et al. Reference Morewedge2015). Similarly, Heuristica is a modular puzzle game targeted at reducing the same three biases as Missing and was similarly successful in promoting knowledge of cognitive biases as well as enduring bias mitigation effects (Mullinix et al. Reference Mullinix2013).
Checklists are tools that are often used in bias mitigation scenarios to facilitate metacognition, which can aid in reflection (Chew, Durning, & van Merriënboer Reference Chew, Durning and van Merriënboer2016). These interventions have often been validated in medical settings, in part thanks to a well-established body of work on the impacts of bias in the medical field (Agyemang, Andreae, & McComb Reference Agyemang, Andreae and McComb2023). For example, checklists have been found to enhance electrocardiogram interpretation by reducing errors; although the decisions took longer to make with the checklist, perceived cognitive load did not increase (Sibbald, de Bruin, & Merrienboer Reference Sibbald, de Bruin and Merrienboer2013). Another checklist was found to increase the accuracy of cardiac exam diagnostics, but only if the user retained access to the checklist and was able to return freely to it (Sibbald et al. Reference Sibbald2013). Yet another study of 76 doctors found that a cognitive forcing tool did not significantly impact the amount of diagnostic errors made, but qualitative results from a smaller pool of participants revealed that doctors had an overall positive experience with the checklist, claiming that it helped them “slow down and avoid bias” (O’Sullivan & Schofield Reference O’Sullivan and Schofield2019). Formalized step-by-step procedures have also been developed and recommended for bias mitigation and error management in fields such as fire engineering (Kinsey et al. Reference Kinsey2021) and the aerospace sector (Emmons et al. Reference Emmons2018).
Another method of reducing cognitive bias is by removing the opportunity for people to apply stereotypes or biases toward their interpretation of a situation or group of people. This can be done by selectively presenting data to participants in a way that is expected to minimize bias. For example, Mourad and Tewfik (Reference Mourad and Tewfik2016) developed an algorithm to select and order data in a way that would aid participants in making optimal, unbiased decisions. Selection bias can also be mitigated through the use of data visualization tools such as DataPilot, developed by Narechania et al. (Reference Narechania2023). “Blinding” data, or removing demographic markers that may otherwise result in the application of stereotypes or bias, is another way to mitigate cognitive biases that may arise from demographic factors. In research projects conducted at the Hubble Space Telescope, male principal investigators were more likely than women to have research proposals accepted (Reid Reference Reid2014); however, women’s success rate increased when proposals were anonymized (Johnson & Kirk Reference Johnson and Kirk2020). Similarly, more women were hired to symphony orchestras when auditions were “blinded” with candidates concealed behind a screen (Goldin & Rouse Reference Goldin and Rouse2000).
A more drastic method of reducing cognitive-biased behavior is to confront people with their biases. Many methods have been developed and validated for measuring or quantifying implicit cognitive biases. For example, the “beads task” is a method of measuring participants’ likelihood of “jumping to conclusions” based on available information (Phillips & Edwards Reference Phillips and Edwards1966), while the “Hinting Task” measures social cognition, particularly one’s proficiency at “mental state reasoning” (Lindgren et al. Reference Lindgren2018). In line with the previous discussions of bias mitigation in medical fields, many of these scales were developed to assess psychosis or delusion in participants with a history of mental illness (Green et al. Reference Green2008; van der Gaag et al. Reference van der Gaag2013). Enumerating individuals’ bias is useful not only as a method of tracking changes in cognitive bias over time but also as a mitigation tool. Being presented with a quantification of one’s own implicit gender biases using the Harvard Implicit Association Test (Nosek, Banaji, & Greenwald Reference Nosek, Banaji and Greenwald2002) has been found to reduce the number of gender-biased decisions made in reporting by journalists (Kalra & Boukes Reference Kalra and Boukes2021). In addition, the serious games previously described each contained a feedback element in order to educate participants on the amount of biased decisions they personally made (Mullinix et al. Reference Mullinix2013; Morewedge et al. Reference Morewedge2015; Dunbar et al. Reference Dunbar2017).
1.4. Bias mitigation in design practice
The techniques previously discussed to encourage empathy in design may also be used to reduce gender bias in design. Gender bias and difficulty with empathy-building are closely tied in engineering design due to the disparity in the proportion of women engineers (United States Bureau of Labor Statistics 2023) compared to the proportion of women in the general population (U.S. Census Bureau 2023), indicating that many engineers may struggle to empathize with women users (Li & Hölttä-Otto Reference Li and Hölttä-Otto2020; Li et al. Reference Li2021). Similar to the “draw a scientist” intervention, interactions with sample users may help designers to reframe women as an important user of their product. Representing women users throughout the design process builds designers’ ability to empathize with them (Heylighen & Dong Reference Heylighen and Dong2019), increasing the chances that a product will be accessible to them.
Similarly, user personas are a previously discussed tool to help designers build empathy for users’ specific needs. Visser and Stappers (Reference Visser and Stappers2007) found that personas with more visual detail stimulate more empathy and a deeper view of users’ needs, and a separate study by Riggs and Knobloch–Westerwick found that audio passages are more effective at stimulating feelings of empathy compared to textual narratives. GenderMag is a tool that encourages developers of problem-solving software to adopt the mindset of sample user personas to identify any issues with their product’s gender inclusivity (Burnett, Stumpf, et al. Reference Burnett and Stumpf2016). In testing, the tool has been effective in enabling participants to identify gender-inclusiveness issues (Burnett, Peters, et al. Reference Burnett and Peters2016), and the developers of the tool speculate that its scope could be widened and applied to a larger range of products (Burnett et al. Reference Burnett and Stumpf2016). One practical application of GenderMag not only closed the gender gap for successfully using the software by improving women’s success rates, but men’s success rates also increased when using the more gender-inclusive software (Vorvoreanu et al. Reference Vorvoreanu2019). A systematic analysis such as the Social Impact Evaluation Analysis may also be an effective tool for helping designers consider far-reaching social impacts of their design work (Armstrong et al. Reference Armstrong2024).
Genco et al. (Reference Genco2012) developed the Empathic Experience Design (EED) method to engage designers in “bodystorming,” which Kelley and Littman (Reference Kelley and Littman2001) define as a process where designers “act out current behavior/usage patterns and see how they might be altered. The five steps of the EED are to (1) define the design problem, (2) define typical and empathic users and usage environments, (3) design empathic experiences, (4) simulate empathic experiences and (5) generate concepts (Genco et al. Reference Genco2012). Participants who interacted with products while experiencing a simulated impairment in vision or dexterity developed concepts with significantly higher originality with no decrease in technical quality. The wearable simulations discussed previously are other methods of bodystorming that can build designers’ creativity and ability to empathize with users with physical disabilities (Boffi et al. Reference Boffi2014; Raviselvam et al. Reference Raviselvam, Hölttä-Otto and Wood2016; Raviselvam et al. Reference Raviselvam2017; McDonagh et al. Reference McDonagh, Woodcock and Iqbal2018).
There have been many recent attempts to develop protocols or methodologies for mitigating the effects of design fixation, a form of sunk cost bias. For example, Zahner et al. (Reference Zahner2010) found that presenting problem statements in more abstract forms resulted in more original ideas, although the solutions developed did not necessarily conform to the constraints of the problem. It was found that even more novel solutions were developed by designers who conducted the re-representation of a problem statement themselves; in other words, participants who were given a concrete design problem and then rewrote it as a more generalized problem statement were more original when developing concepts to solve the problem (Zahner et al. Reference Zahner2010). Moreno et al. tested two design-by-analogy methods, WordTree and SCAMPER, finding that although both methods were effective in increasing the novelty of generated ideas, which addressed one potential consequence of sunk cost bias, only the WordTree method was effective in mitigating design fixation (Moreno et al. Reference Moreno2016). Chrysikou and Weisberg (Reference Chrysikou and Weisberg2005) found that providing pictorial examples in a design problem-solving scenario can cause fixation resulting in the inclusion of unsuitable features from the examples, although inclusion of specific defixation instructions resulted in fewer design features indicative of fixation.
As previously established, cognitive bias commonly manifests at the concept development or concept selection stages of the design process. Tools such as weighted decision matrices or Pugh charts provide methods of facilitating concept selection (Dieter & Schmidt Reference Dieter and Schmidt2013). Hallihan et al. (Reference Hallihan, Cheong and Shu2013) applied a formalized decision matrix to a concept evaluation design activity and found that participants who used the decision matrix were less biased and more thorough when evaluating data. This finding validated the use of guided decision-making as a method for mitigating confirmation bias. However, engineering students often tend to rely on their own intuition over formalized methodologies for problem-solving (Taleyarkhan et al. Reference Taleyarkhan2023), and as a result, three out of seven graduate student participants in the study by Hallihan et al. expressed that the decision matrix was an “unnatural” way of thinking for them. This participant discomfort, in addition to the increased cognitive effort required to utilize the procedure compared to relying on intuition, may present an obstacle to the widespread adoption of formalized bias mitigation in design (Hallihan et al. Reference Hallihan, Cheong and Shu2013).
2. Aims
Through a design activity with 30 professional engineers and designers, the following research questions were investigated in this study:
RQ1: How do indicators of availability bias manifest through design outcomes in a brainstorming and sketching design activity?
Because participants worked on two design problems at a time with a limited amount of time to complete both problems, it was hypothesized that availability bias may lead participants to prioritize the design problems according to their level of interest in the topic or whether or not they felt that they would be a target user for the product. This was expected to result in more brainstormed ideas being developed for the problem that participants identified more strongly with (H1-A). It was also hypothesized that participants would make less considerations for end users other than themselves as a result of availability bias, leading to fewer user representations in design sketches for the problem that was more relatable to participants (H1-B), since Makhlouf et al. (Reference Makhlouf2023) have connected sketches of users with greater consideration for users.
RQ2: How do indicators of availability bias manifest through designers’ perceptions of the market for a product and the value of a product?
Based on findings from Fillingim et al. (Reference Fillingim, Shapiro and Fu2022)), it was expected that availability bias would play a role in how participants viewed the marketability and likelihood of success for the products they design. In particular, it was expected that participants would overvalue the market size and value of the product that was more relatable to them and undervalue the market size and value of the product that they found less relatable (H2-A). For both design problems, it was expected that high value and market size would be positively correlated with participants’ level of interest in the product (H2-B). It was also expected that in a head-to-head comparison, participants would display preference toward the product that was more relatable to them in positively framed questions about the market (H2-C).
RQ3: How does a checklist-style bias mitigation intervention impact manifestations of availability bias and considerations made for a diverse collection of users?
The checklist-style bias mitigation intervention was expected to reduce the markers of availability bias discussed in RQ1 and RQ2. For example, it was expected that the number of brainstormed ideas for the two design problems would be more similar post-intervention compared to pre-intervention (H3-A). The checklist was intended to help designers develop an awareness of diverse potential users, so it was hypothesized that more representations of users would be present in the post-intervention sketches compared to the pre-intervention sketches (H3-B). Finally, it was expected that the intervention would reduce the positive correlations between participants’ interest in a product and their view of the product’s value and market size, as well as lead to more evenly distributed scores in the head-to-head comparison of the two products (H3-C).
3. Materials and methods
To explore the research questions, data were collected during an eight-step within-subjects design activity, as shown in Figure 1. Participants were recruited from a selection of employees at a Midwestern kitchen appliance company who had chosen to participate in a half-day design workshop. First, participants read and agreed to a consent document. The study, including the consent procedure, was conducted under the guidance of the Institutional Review Board at Georgia Institute of Technology. After agreeing to participate in the study, participants were given 7 minutes to complete Step 1 of the study, which contained two design problems for each of which participants developed a written list of brainstormed ideas. The two design problems involved the development of features that could be included in an innovative “smart grill” or “smart laundry machine,” and the prompt suggested that participants could include concepts from artificial intelligence (AI), the internet of things (IoT) or robotics. Participants were given a total of 7 minutes to complete both design problems and were allowed to allocate their time however they preferred.
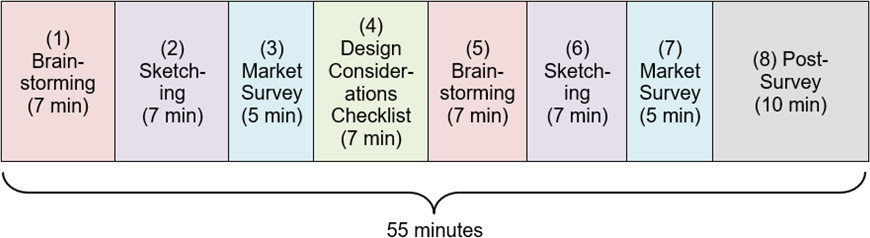
Figure 1. Timeline of study.
Next, participants moved on to Step 2, the sketching phase of the study. Participants were instructed to create one detailed concept sketch for each of the two design problems that incorporated features from their brainstormed list from Step 1. Once again, participants were given 7 minutes to allocate toward the two sketch problems as they preferred.
After completing their sketches, participants were given 5 minutes to complete Step 3, the market survey. First, participants provided a written response to the open-ended questions: “Who is the smart [grill/laundry machine] for? Who do you imagine would use it?” (Makhlouf et al. Reference Makhlouf2023). Next, they provided an estimate to the nearest $100 of how much the smart grill/laundry machine would be sold for. They then used a 1–5 Likert scale to assess their level of agreement with a series of seven statements regarding their design, such as “The market for the smart [grill/laundry machine] is large,” and “The smart [grill/laundry machine] is likely to be commercially successful.” Participants answered the open-ended question, price question and Likert questions twice each: once while considering the smart grill concept they sketched, and once while considering the smart laundry machine concept that they sketched in Step 2. Finally, participants used a 1–5 Likert scale (1 – definitely the grill, 2 – probably the grill, 3 – neither the grill nor the laundry machine, 4 – probably the laundry machine, 5 – definitely the laundry machine) to answer a series of four questions directly comparing their concepts for the smart grill and smart laundry machine, such as “Which is more likely to be commercially successful?” and “Which would you use more often?”
After completion of the brainstorming, sketching and market survey (Steps 1–3), participants completed the Design Considerations Checklist (full text in the Appendix). The checklist contained 10 questions that were intended to guide participants in reflecting on the decisions and considerations that they had made during Steps 1–3. For example, some questions were “What assumptions did you make while creating this design?” and “How was your design influenced by your judgement of who the user is? Did you apply stereotypical associations to your perception of the user?” Participants were given 7 minutes to complete the Design Considerations Checklist. They were instructed to check the box next to each question when they felt that they had sufficiently considered it, and space was provided under each checklist item for participants to reflect or take notes. The development of the checklist items is discussed further in Section 3.1.
Because of the within-subjects format of Study III, participants repeated Steps 1–3 after the intervention. The instructions for each of the three parts were identical to the first time they were presented, except for that during the brainstorming phase, participants were told to feel free to repeat any ideas from their first round of brainstorming. After repeating each of the three steps, participants were given 10 minutes to complete the post-survey. In the post-survey, participants filled out demographic information, including their age, gender identity, race/ethnicity, higher education and professional experience as an engineer or designer. They also evaluated their level of familiarity with smart appliances, AI, IoT and robotics on a scale from 1 (novice) to 5 (expert). In the second section of the post-survey, participants considered their typical interactions with a grill and with a laundry machine. They provided information such as whether or not they own the appliance, who in their household typically interacts with the appliance, how many times per week they use the appliance and how much they enjoy using the appliance. In the final section of the post-survey, participants reflected on their experience with the Design Considerations Checklist intervention, evaluating how helpful they felt it was while reflecting on their designs from the first round of brainstorming and sketching, as well as while developing new concepts in the second round of brainstorming and sketching. Finally, they provided a written response to the open-ended question “How did the checklist impact the way you approached the design problems and questions in the second round?”
3.1. Study material development
The smart grill and smart laundry machine design problems were selected due to the likelihood that they would elicit availability bias in participants. During the design of the study, researchers hypothesized that participants would prioritize the grill problem over the laundry machine problem due to (1) the relationship between the demographics of the participant pool and the stereotypical gendered breakdown of household tasks and (2) the connection between the grill problem and the participants’ roles as kitchen appliance engineers.
Because the participant demographics were skewed toward men, it was expected that differences in the way various household tasks are gender-stereotyped could impact the way participants interacted with the design problems. A 2015 survey of American households found that the primary griller was twice as likely to be a man than a woman (Applegate 2015). Conversely, a 2019 Gallup poll about household chore breakdowns in heterosexual American households found that women were more than twice as likely as men to be primarily responsible for doing the household’s laundry (Brenan Reference Brenan2020). Because 23 out of the 29 study participants who provided their gender identified as men, it is likely that participants would feel more connected or have more prior experience with the grill problem. This was expected to manifest in various ways – for example, it was hypothesized that participants would develop more grill concepts, place a higher value on their grill concept and view the user of the smart grill as more similar to themselves, potentially resulting in an over-expanded view of the market for the smart grill.
Originally, the two design problems were a smart outdoor grill and a smart indoor stovetop due to their functional similarity; however, this iteration of the study design was unsuccessful during piloting because of the functional similarity – pilot participants developed near-identical feature lists for the two design problems during Step 1 and near-identical sketches during Step 2. Replacing the indoor stovetop with a laundry machine had the advantage of differentiating the design problems and also provided another opportunity for availability bias to impact participants: because all participants were presently employed at a kitchen appliance design company, it was expected that they may show a preference toward the grill problem due to their level of familiarity with the design and engineering of cooking appliances compared to cleaning appliances.
The order in which the smart grill and smart laundry machine were presented was randomized for each participant to mitigate the impact of serial position bias, as people tend to show a preference for the first item presented in a sequence (Mantonakis et al. Reference Mantonakis2009). When experimental packets were passed out, participants were assigned a numeric identifier so that data could be collected anonymously. Participants with odd-numbered packets received the grill problem first in Step 1, the laundry problem first in Step 2 and the grill problem first in Step 3, with the pattern repeating post-intervention. Participants with even-numbered packets received the laundry problem first in Step 1, with the order of the problems alternating thereafter.
A checklist-style bias mitigation tool was selected due to its ease of use and its ability to be customized and applied to various design scenarios. The Design Considerations Checklist was developed from a range of proposed or validated decision checklists intended to reduce bias or error in users. Because such a checklist had not previously been formalized for the field of engineering design, the 10 items on the checklist were derived from protocols related to fire engineering (Kinsey et al. Reference Kinsey2021), data crowdsourcing (Draws et al. Reference Draws2021), weather (Walmsley & Gilbey Reference Walmsley and Gilbey2019), energy (Cao et al. Reference Cao2016), emergency medicine (Jin, Anaebere, & Haar Reference Jin, Anaebere and Haar2021), behavioral economics (Kahneman, Lovallo, & Sibony Reference Kahneman, Lovallo and Sibony2011) and pilot training (Murata, Nakamura, & Karwowski Reference Murata, Nakamura and Karwowski2015). For example, the emergency medicine checklist encouraged medical practitioners to ask themselves “Are there cultural differences in the patient’s expression of frustration and control?” when determining whether to physically restrain an agitated patient (Jin et al. Reference Jin, Anaebere and Haar2021). In the Design Considerations Checklist, this concept was adapted to the design field with the checklist item, “Are there cultural differences in the way people might use this product?” Questions on the checklist were aimed at mitigating bias by encouraging designers to reflect on how their past experiences or implicit biases may have influenced their thought process. Specifically, several items on the checklist targeted availability bias by encouraging participants to think beyond their own needs or preferences as a consumer, and instead consider how a variety of users with different backgrounds and needs may interact with products.
3.2. Participants
In total, 30 workshop participants attended the workshop and provided consent for their data to be used. Of the participants who provided demographic data, 23 were men, 5 were women, and 1 identified as non-binary. The average participant was 35 years old (±10.6 SD) and had 11.8 years (±9.9) of professional experience in design or engineering. Of participants who reported their race, 23 were White; 2 were Hispanic or Latino; 2 were Asian, Native Hawaiian, or Other Pacific Islander and 1 identified as more than one race. All participants held a bachelor’s degree, with the most common being a Bachelor of Science in Electrical Engineering (11 participants), Computer Engineering (6), Mechanical Engineering (5) and Computer Science (5). In addition, three participants held a Master of Science in Electrical Engineering, and other degrees included an MBA, as well as bachelor’s degrees in Engineering, Software Engineering, English Literature, Physics, Systems Engineering, Information Systems and Software Development. When asked to evaluate their level of familiarity with various technologies as novice, beginner, proficient, advanced or expert (corresponding to a scale from 1–5), participants reported average experience levels of 3.13 (±1.15 SD) with smart appliances, 2.30 (±0.86 SD) with artificial intelligence, 3.07 (±1.03 SD) with Internet of Things and 2.43 (±0.92 SD) with robotics.
4. Results and analysis
Statistical analysis was conducted using R 4.1.2 and RStudio. Because the sample size (n = 30) was sufficient to apply the Central Limit Theorem and assume a normal distribution (Islam Reference Islam2018), data were analyzed using analysis of variance (ANOVA) tests at a significance level of α = 0.05 to consider all variables as well as their potential interactions. When a significant relationship was indicated by ANOVA, Dunn’s test was used to perform multiple pairwise comparisons (Dunn Reference Dunn1964). Reported p-values have been corrected for multiple pairwise comparisons. The Kendall rank correlation coefficient (τ) was selected to check for statistically significant correlations between variables, due to the ordinal nature of the data and the prevalence of ties (Kendall Reference Kendall1938).
Cohen’s Kappa was used in Section 4.1 to validate a coding rubric in which codes were mutually exclusive (only one code is applied to each data point). Because Cohen’s Kappa cannot be calculated when codes are not mutually exclusive (more than one code can be applied to each data point), simple percentage agreement was used to validate the rubric in Section 4.2.
4.1. Brainstorming and sketching (RQ1)
The quantity of concepts brainstormed for each design problem at the pre- and post-intervention phases of the study was of interest because a high number of generated ideas may be an indicator of increased creativity (Shah, Smith, & Vargas-Hernandez Reference Shah, Smith and Vargas-Hernandez2003). In total, 104 concept lists were analyzed to determine the number of concepts that each participant brainstormed throughout the course of the design activity. When counting concepts, only the overarching concept was counted in cases in which sub-concepts or bulleted details were included. In addition, post-intervention cases in which participants wrote “same as Brainstorm 1” or “no new ideas” were not counted, although concepts that were repeated between the pre-intervention and post-intervention brainstorm were counted. For the grill problem, participants brainstormed an average of 6.250 concepts pre-intervention and 4.800 concepts post-intervention. For the laundry machine problem, participants developed an average of 5.250 concepts pre-intervention and 4.926 concepts post-intervention, as shown in Figure 2. However, neither the intervention (p = 0.235) nor the design problem (p = 0.629) had a statistically significant impact on the number of concepts generated, contradicting Hypotheses H1-A and H3-A.
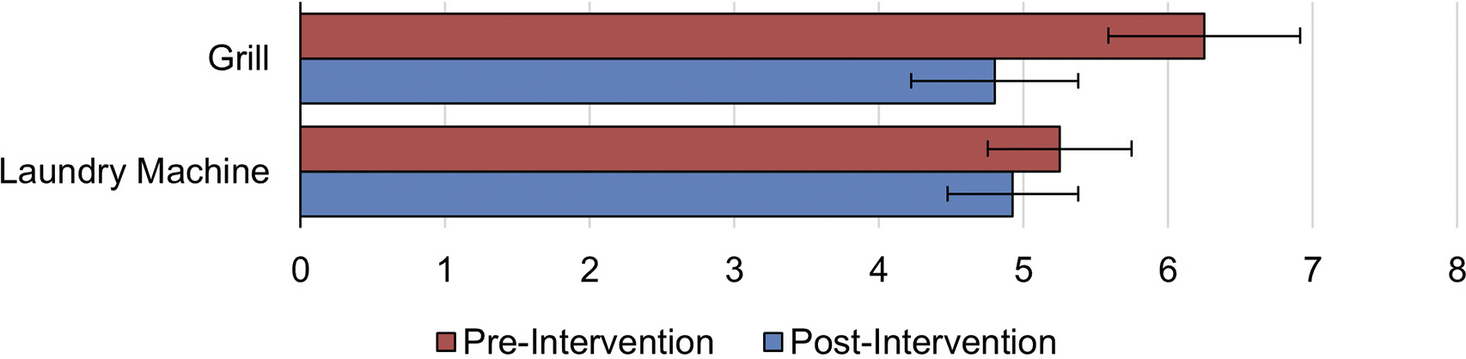
Figure 2. Average number of brainstormed concepts pre- and post-intervention for the smart grill and smart laundry machine design problems; error bars indicate ±1 SE.
In Step 2 of the study, participants were instructed to “include how a user would interact with the concept” when creating the sketches of their smart grill and laundry machine concepts. For analysis of the sketches, the presence of a user or person interacting with the smart grill or laundry machine was of particular interest due to findings from Makhlouf et al. (Reference Makhlouf2023) that sketches containing drawings of people result in more consideration of social and physical use contexts. A total of 94 sketches were examined for indication of a visual depiction of a user interacting with the sketched concepts. Two independent judges categorized each sketch as either containing (example shown in Figure 3) or not containing (example shown in Figure 4) a visual representation of a user, achieving a sufficient Cohen’s Kappa of 0.963. In total, 6 out of 48 (12.5%) pre-intervention sketches and 10 out of 46 (21.7%) post-intervention sketches included some visual depiction of a user interacting with the concept, manifesting either as a stick figure or as a hand interacting with some component of the sketch. This increase in user depictions after the intervention supported Hypothesis H3-B; however, Pearson’s chi-squared test found that this difference was not statistically significant (χ2 = 1.420, p = 0.233).
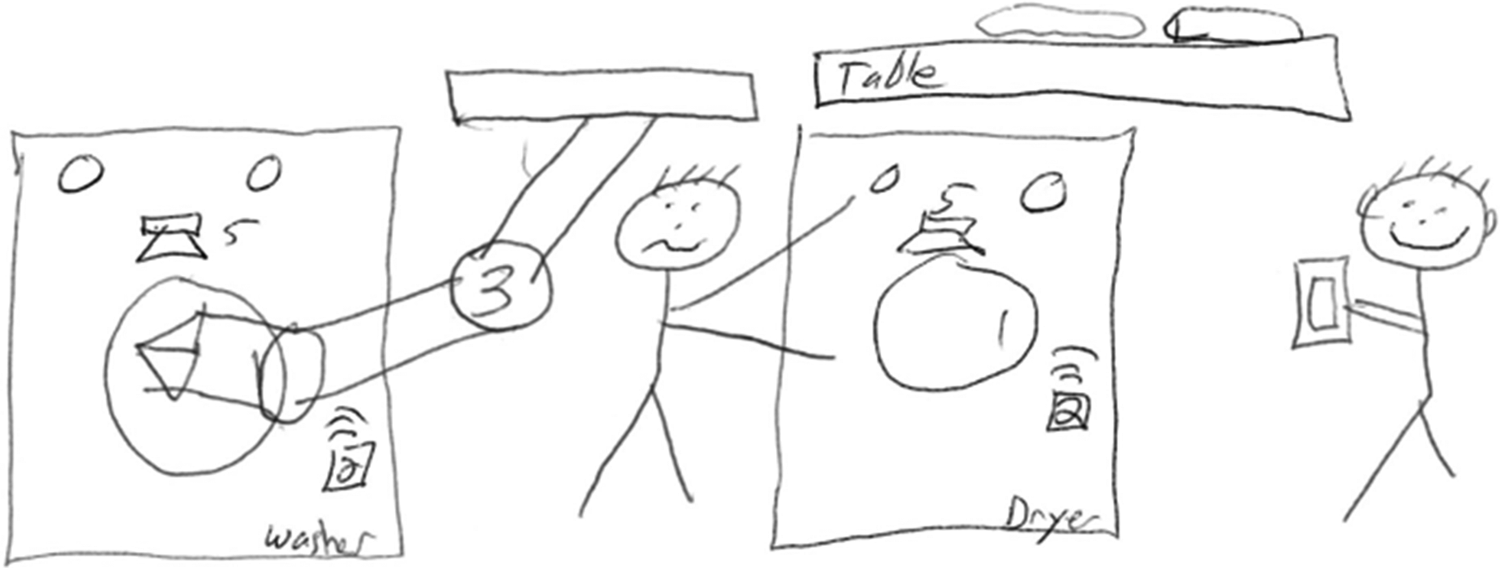
Figure 3. Post-intervention smart laundry machine sketch by Participant 11. Note the depiction of two representative users in the form of stick figures.
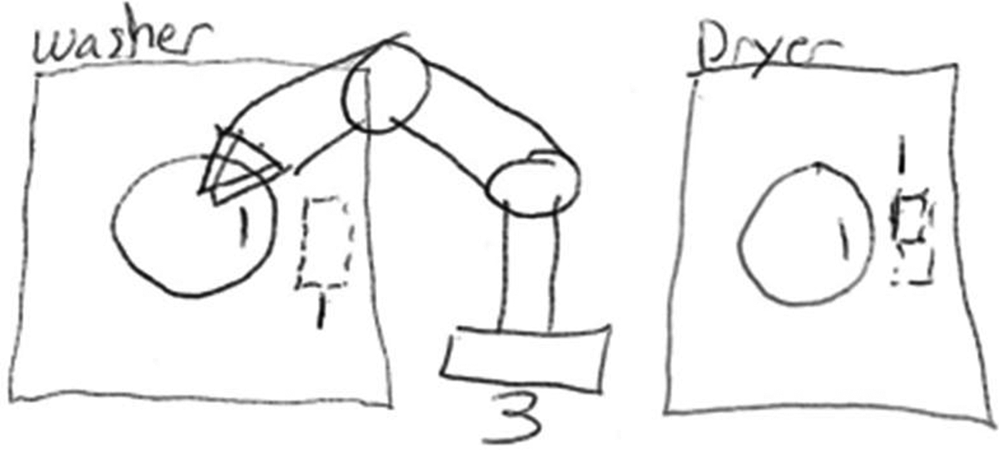
Figure 4. Pre-intervention smart laundry machine sketch by Participant 11. Note the focus of the sketch on the components of the machine and the lack of a depiction of a user.
At the pre-intervention stage, 3 out of 26 (11.5%) grill concept sketches and 3 out of 22 (13.6%) laundry machine concept sketches featured a visual representation of a user, as shown in Figure 5. At the post-intervention stage, these numbers increased to 4 out of 22 (18.2%) and 6 out of 24 (25.0%) for the grill and laundry machine sketches, respectively. Although it was expected that there would be more user representations among the smart laundry machine sketches, these differences were insignificant, contradicting Hypothesis H1-B.
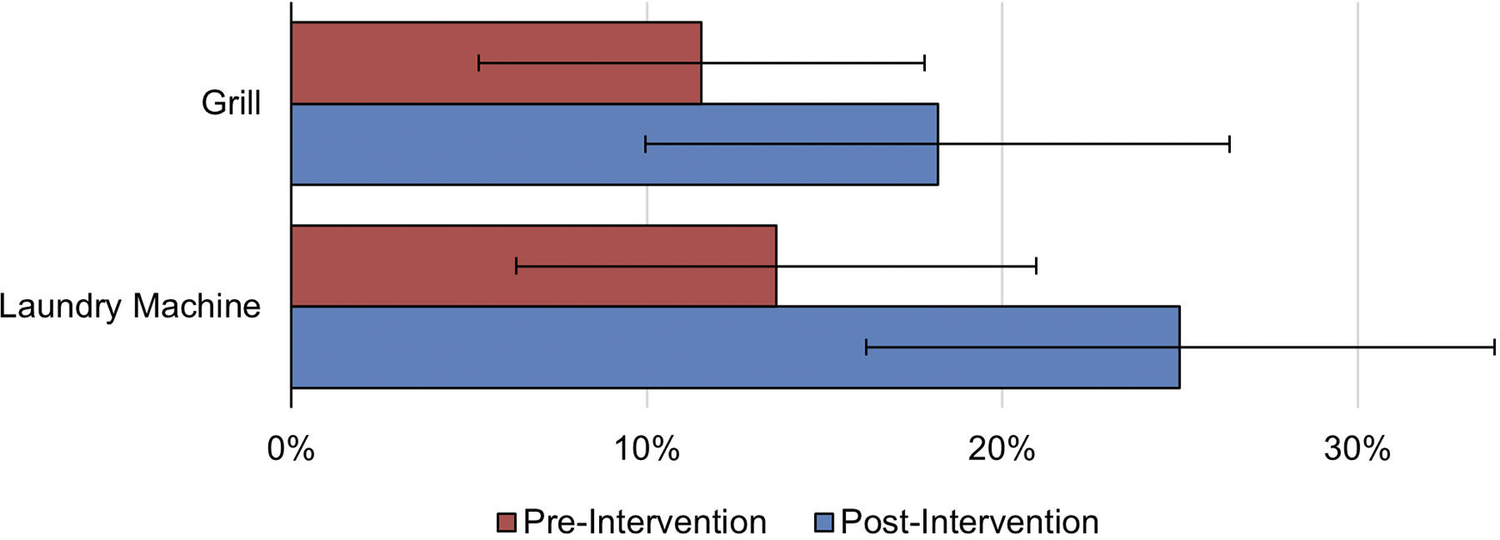
Figure 5. Percentage of sketches featuring a representation of a user pre- and post-intervention for the smart grill and smart laundry machine design problems; error bars indicate ±1 SE.
4.2. Market survey (RQ2 and RQ3)
Upon beginning the market survey, participants provided a written response to the questions “Who is the smart [grill/laundry machine] for? Who do you imagine would use it?” One judge utilized an inductive coding scheme (Boyatzis Reference Boyatzis1998) to develop a rubric of 18 recurring themes from the data, as detailed in Table 1. Because of the number of possible codes, percent agreement was calculated for two independent judges rather than Cohen’s Kappa, and the judges achieved sufficient agreement of 83.1% on the full data set. Participants wrote an average of 11.2 words (±0.7 SE) in response to the questions and appeared to be non-statistically significantly less verbose post-intervention (p = 0.150), as the number of words written decreased from 12.4 (±1.1 SE) to 10.2 (±0.8 SE).
Table 1. List of themes and sample responses for the market survey question “Who is the smart [grill/laundry machine] for? Who do you imagine would use it?”
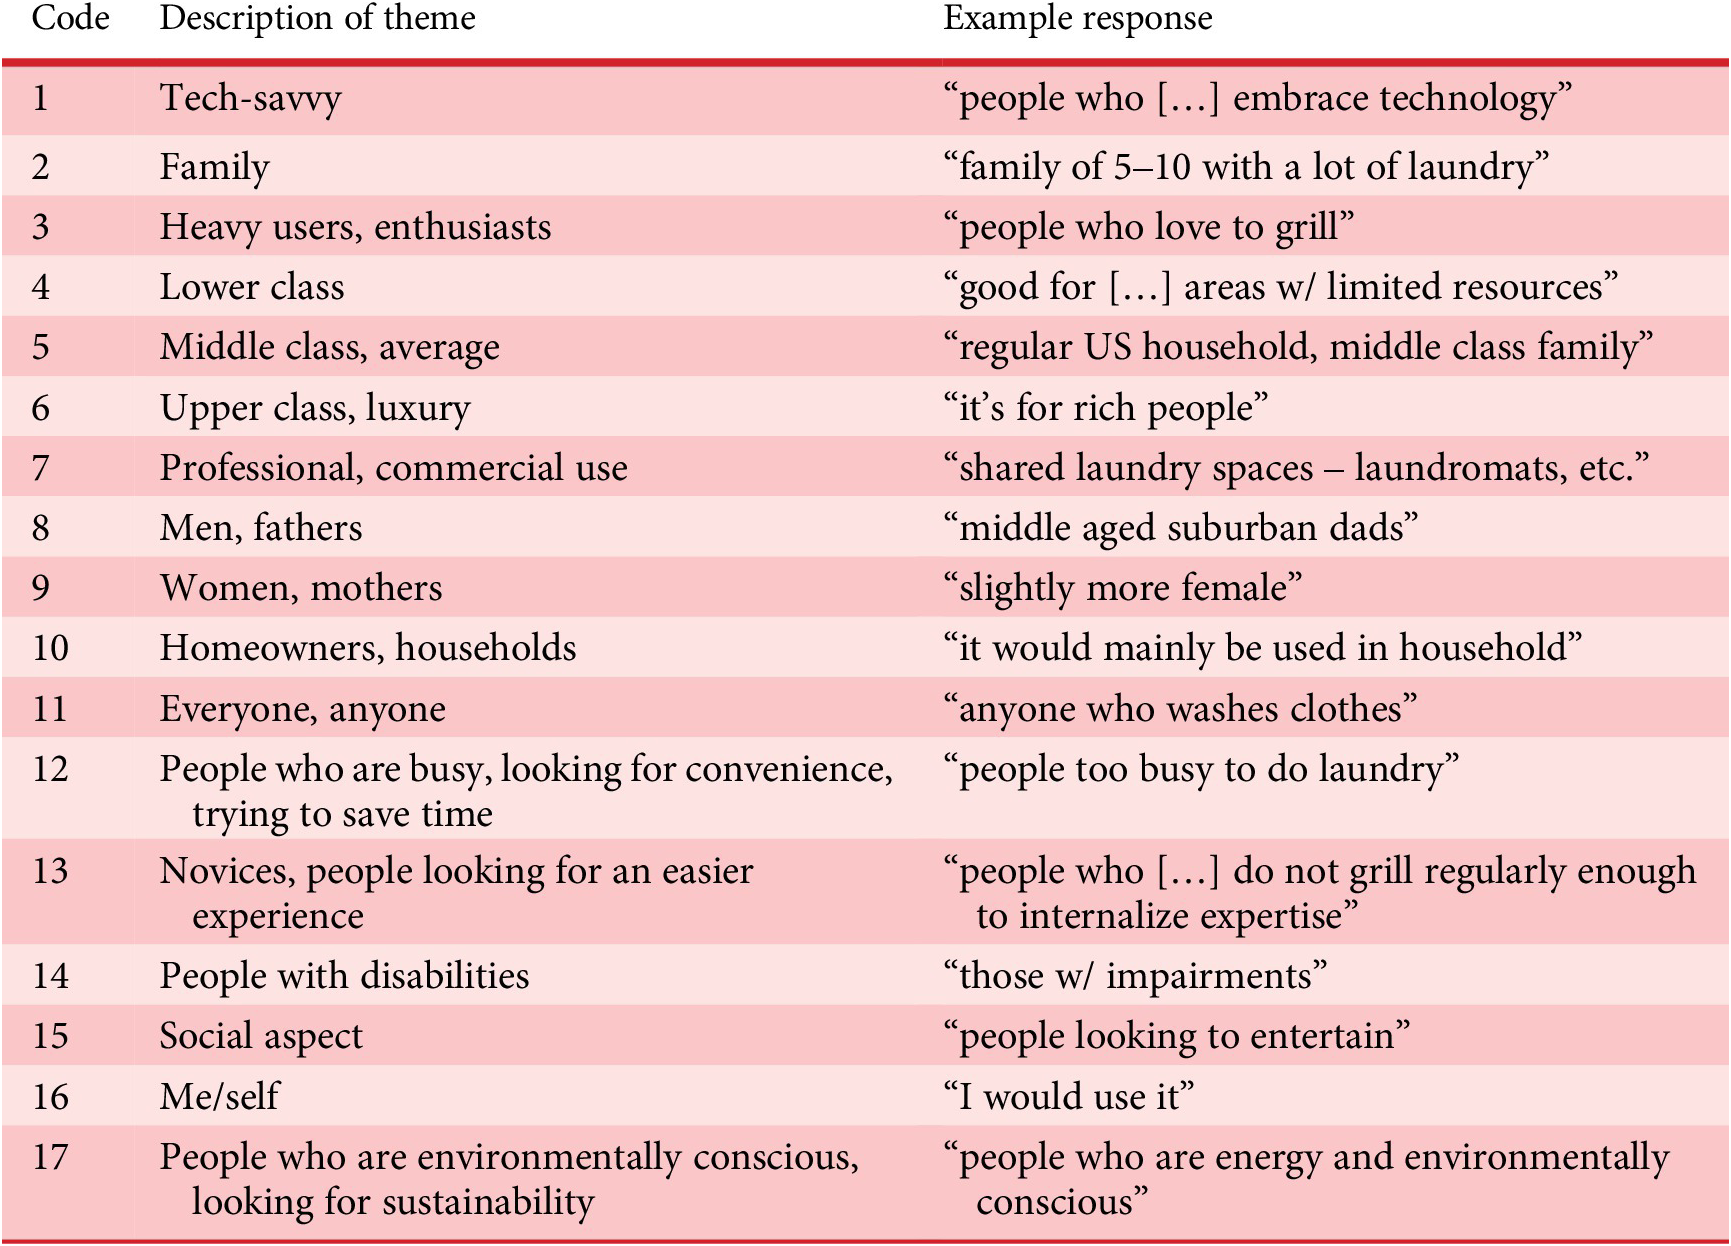
Figure 6 shows the breakdown of the number of occurrences of each theme across the responses. The most commonly referenced theme was the theme of an upper-class or “luxury” user. While smart appliances are typically associated with a higher price point, this finding may also be indicative of availability bias. All participants worked for a luxury appliance company, meaning that they may have applied the profile of the user that they typically encounter at work to this design problem. The number of appearances of this theme decreased from 20 to 14 after the bias mitigation intervention, indicating that the intervention was successful in reducing availability bias. Another theme with a reduction in appearance after the intervention was the idea of a “tech-savvy” user, which decreased from 16 to 10 appearances. Participants seemed to realize that targeting a tech-savvy user excluded many other potential users.
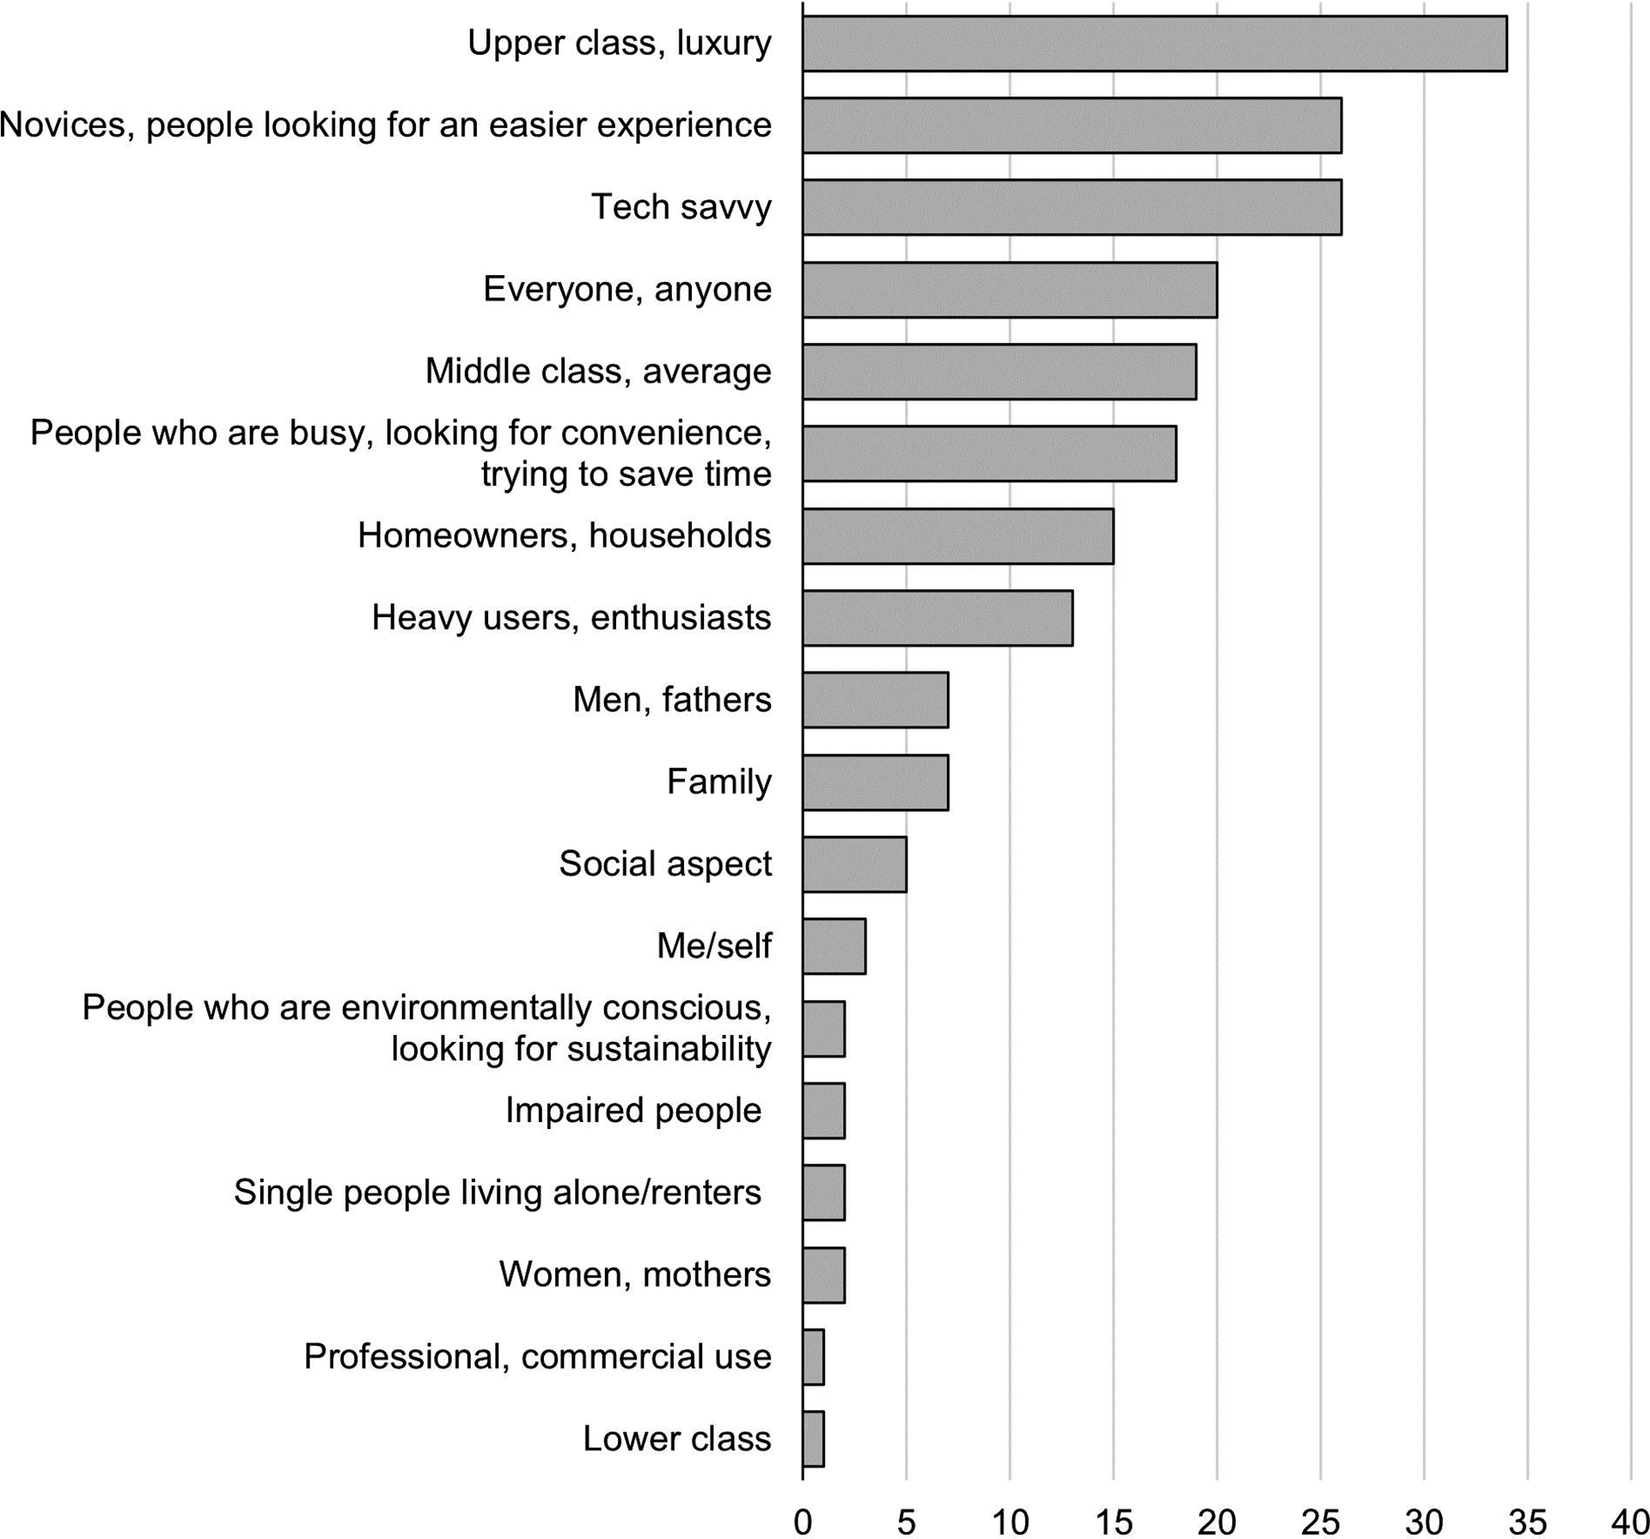
Figure 6. Number of occurrences of qualitative themes across 110 written responses to “Who is the smart [grill/laundry machine] for? Who do you imagine would use it?”
Another commonly occurring theme was that of a novice or inexperienced user who was looking for a smart appliance to make a task easier. While the number of participants who applied this theme to their description of the smart laundry machine user did not change, the use of this theme in relation to the smart grill user decreased from 12 to 4 instances after the intervention. It was somewhat unexpected that the Design Considerations Checklist would lead the designers to make fewer considerations for inexperienced users; however, this finding makes sense in the context of the accompanying decrease in usage of the “tech-savvy” theme, as a user who is neither tech-savvy nor skilled at using a grill would likely find the appliance undesirable or too difficult to use.
Some themes were only applied to either the grill or the laundry machine. For example, the smart grill was associated with social gatherings five times, while the smart laundry machine never was. Similarly, 12 responses associated the grill user with an enthusiast or heavy user, while only 1 response made the same connection to the laundry machine user. Rather, the smart laundry machine was more often associated with homeowners and busy people more often than the smart grill, perhaps because laundry was viewed as a more integral chore for running a household compared to grilling.
Figure 7 contains a more detailed view of how some themes were applied at the different stages of the study and to the different design problems. One notable result is that, as expected, participants appeared to apply gender-stereotyping to their belief of who would use the products. Seven responses referenced “men” or “fathers” as users of the smart grill, and two responses referenced “women” or “mothers” as users of the smart laundry machine, but each of these themes were never applied in relation to the other appliance. One participant playfully mused that she was designing a “mojo dojo casa grill,” referencing the satirical description of toxic masculinity from the 2023 film Barbie (2023) and indicating a perceived lack of belonging to the target user group for the smart grill.
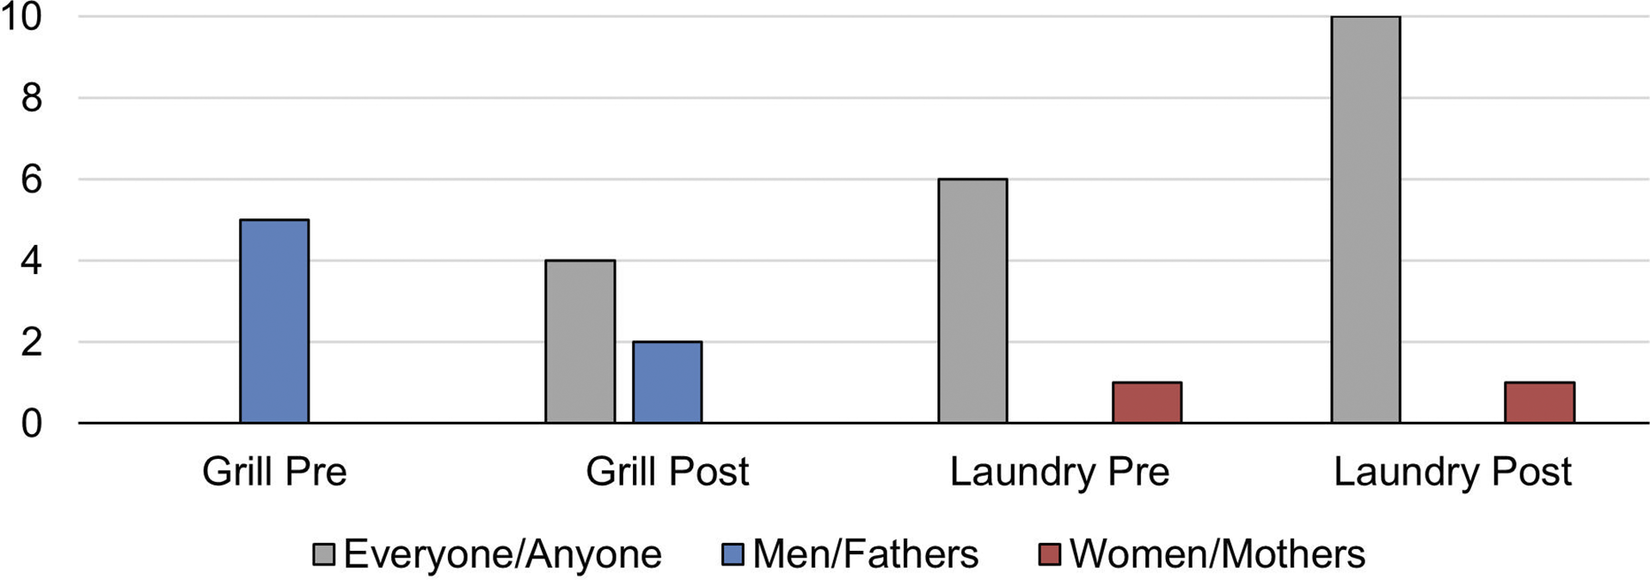
Figure 7. Number of occurrences of select themes broken out by design problem and intervention stage (pre-intervention or post-intervention).
Of particular note is the notion that “anyone” or “everyone” could be a potential user of the product. In both the smart grill and smart laundry machine cases, four additional participants referenced “everyone/anyone” as a target user for their product after the intervention. While participants may have intended to indicate that their product was suitable for a wide range of users, Makhlouf et al. (Reference Makhlouf2023) suggest that designers’ claims of a “general user” may indicate that they are designing for an “average” user, potentially leading to androcentrism, or a default assumption that a person of unspecified gender is a man (Schauer et al. Reference Schauer2024), in addition to a lack of consideration for diverse users’ specific needs. The Design Considerations Checklist attempted to encourage reflection beyond a “general user” by asking questions such as: “Are there any people who are unlikely to benefit from this design? Are there any people or groups of people who this design would not work for?” However, richer detail in both bias mitigation and data collection may be needed to understand the intentions of participants who claim that their designs are suitable for “everyone.” Accompanied by the decrease in occurrence of mentions of a “luxury” or “tech savvy” user, this result indicates that the items on the checklist were successful in helping participants design for a wider range of potential users. A checklist similar to this could be introduced as part of engineering design education alongside similar cognitive forcing/checklisting techniques, such as SCAMPER (Boonpracha Reference Boonpracha2023).
The prices generated by participants when asked to imagine how much each of their concepts would be sold for were used to understand the value that the participants placed on each of their concepts. As a result, responses to the market survey question initially ranged from $60 to $58,000, potentially because the participants were employed as engineers and designers and likely did not have a firm understanding of the business- and marketing-related aspects of the products. The method for omitting outliers proposed by Clark-Carter (Reference Clark-Carter1997), in which values greater than three sample standard deviations from the sample mean were eliminated, was applied to the data for analysis. From the pre-intervention to the post-intervention market survey, the monetary value that participants assigned to their grill designs decreased non-statistically significantly (p = 0.559) from $2,905.96 (±$517.75 SE) to $2,225.00 (±$376.26 SE). Conversely, the monetary value placed upon participants’ laundry machine designs increased non-statistically significantly (p = 0.383) from $2,511.25 (±$369.27 SE) to $3,232.90 (±$483.46 SE), as shown in Figure 8. The higher value assigned to the grill compared to the laundry machine at the pre-intervention stage supported Hypothesis H2-A; however, the difference in the prices assigned to the smart grill and smart laundry machine was not significantly different at either the pre-intervention (p = 1.000) or post-intervention (p = 0.136) market surveys.
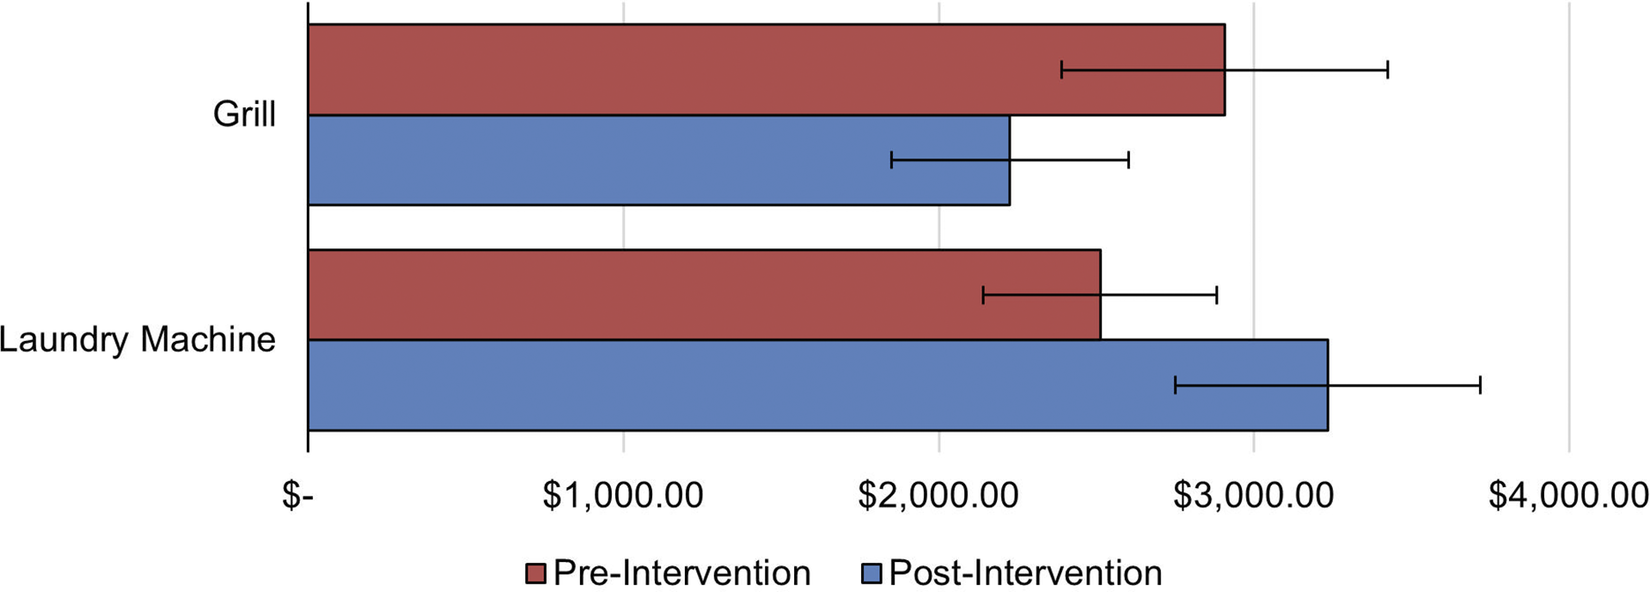
Figure 8. Average responses in USD to the market survey question “To the nearest $100, how much do you think the smart [grill/laundry machine] would be sold for?” pre- and post-intervention for the smart grill and smart laundry machine design problems; error bars indicate ±1 SE.
The next part of the market survey was the Likert scale responses indicating participants’ level of agreement with various statements about their sketched concepts. For each of the statements, an ANOVA model was created to examine the impact of (1) the pre- or post-intervention stage and (2) the smart grill or smart laundry machine problem statement, as summarized in Figures 9 and 10. Results showed that participants agreed more strongly with the statement “The market for the smart grill is niche” compared to “The market for the smart laundry machine is niche” at both the pre-intervention (p = 0.003) and post-intervention stages (p < 0.001). As discussed by Fillingim et al. (Reference Fillingim, Shapiro and Fu2022)), the reference to the market as “niche” could be interpreted as a negative framing of the market, reflecting negative feelings toward the grill concepts, which contradicted Hypothesis H2-A.
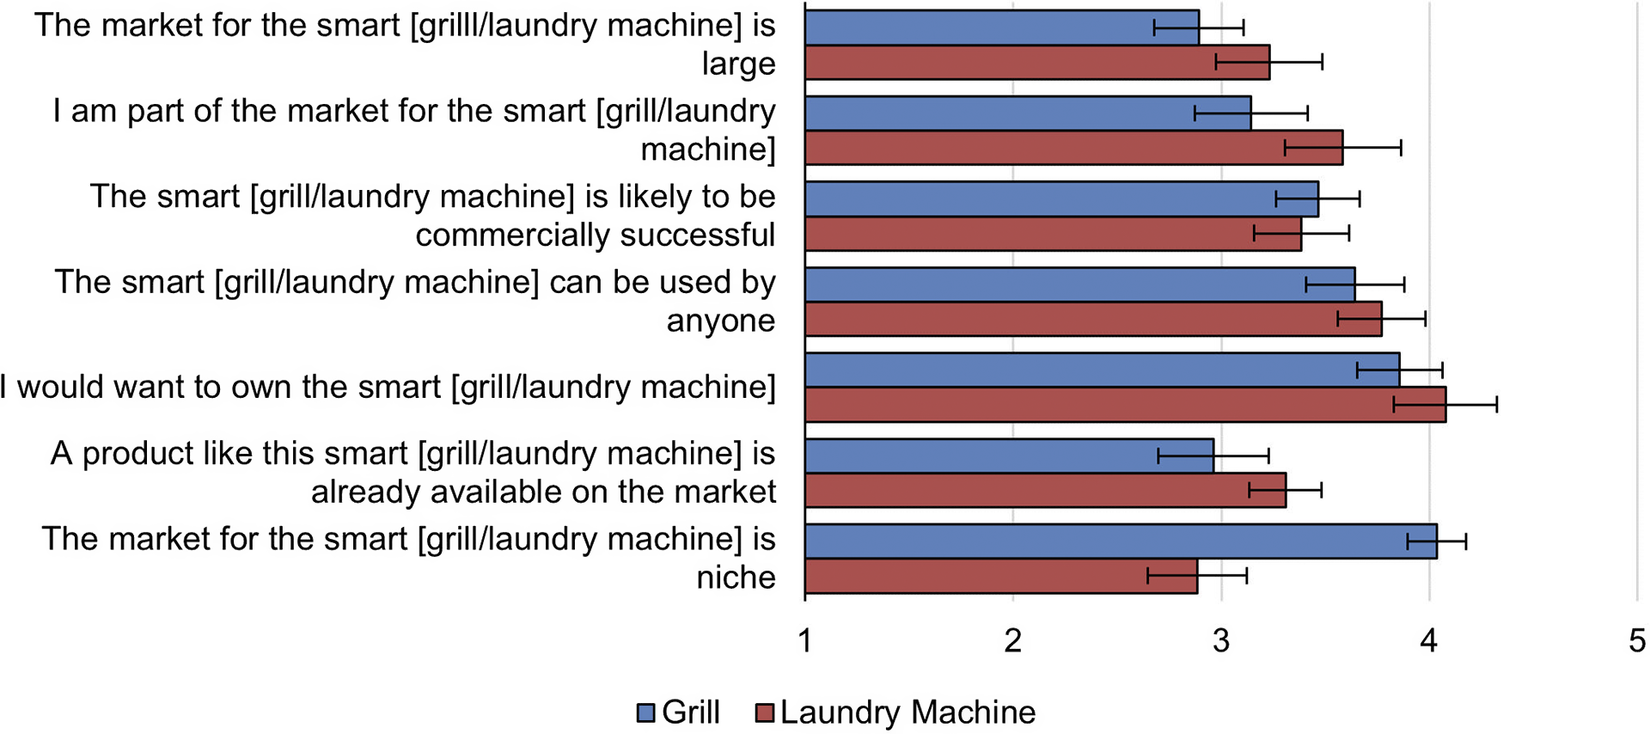
Figure 9. Pre-intervention comparison of participants’ agreement (1 – Strongly disagree, 2 – Somewhat disagree, 3 – Neutral, 4 – Somewhat agree, 5 – Strongly agree) with statements about the market for sketched smart grill and smart laundry machine concepts; error bars indicate ±1 SE.
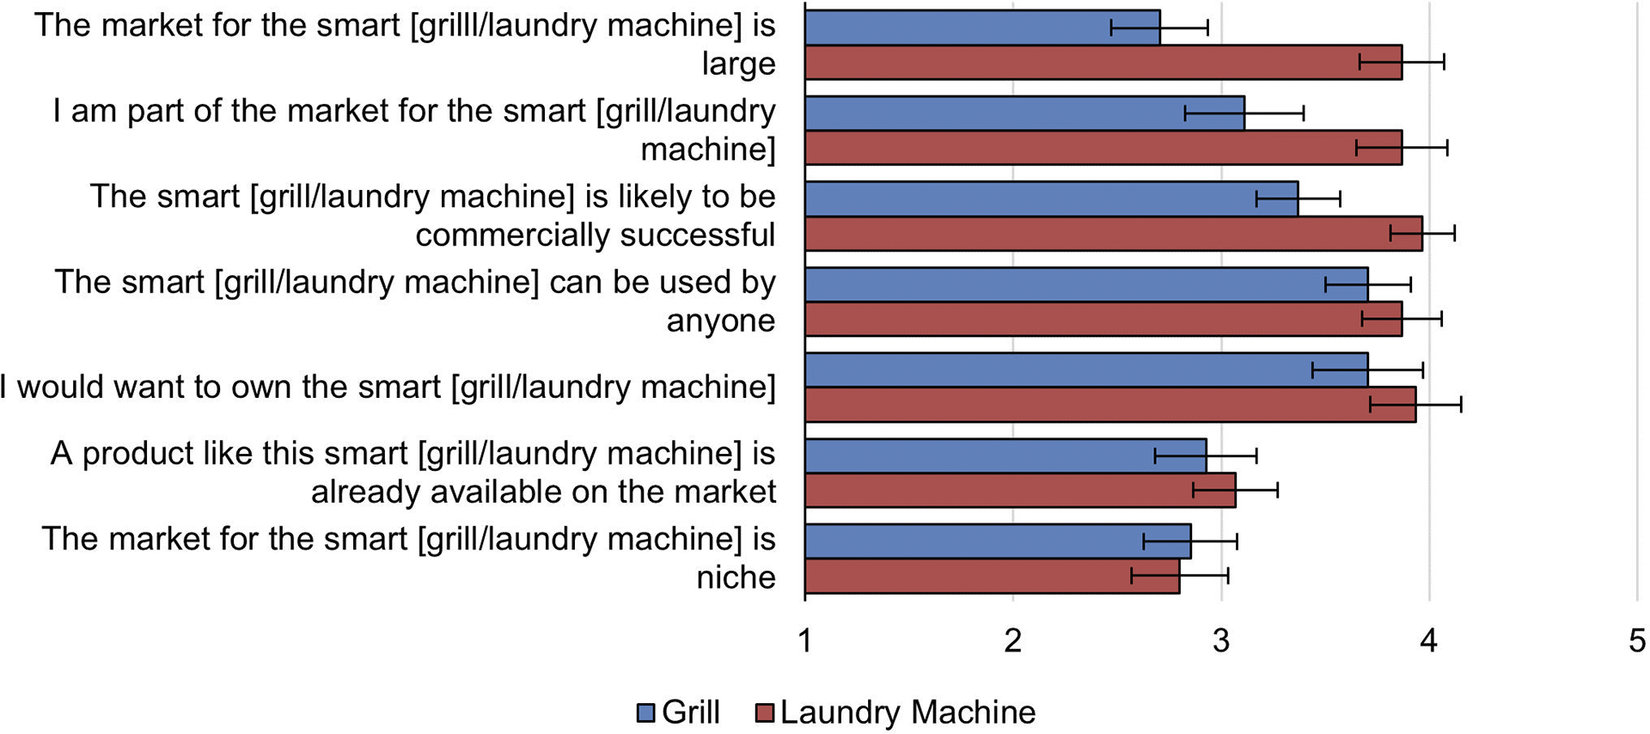
Figure 10. Post-intervention comparison of participants’ agreement (1 – Strongly disagree, 2 – Somewhat disagree, 3 – Neutral, 4 – Somewhat agree, 5 – Strongly agree) with statements about the market for sketched smart grill and smart laundry machine concepts; error bars indicate ±1 SE.
However, other statements presented a more positive framing of the market: “The market for the smart [grill/laundry machine] is large,” and “The smart [grill/laundry machine] is likely to be commercially successful.” For each of these statements, there was no significant difference when comparing participants’ agreement with the statements pertaining to the smart grill and smart laundry machine at the pre-intervention stage (p = 0.288 and 0.956, respectively), as shown in Figure 9. However, at the post-intervention stage, as shown in Figure 10, participants agreed more strongly with the statements when they were applied to the smart laundry machine concept compared to the smart grill concept (p = 0.001 and 0.026, respectively). Similarly, at the pre-intervention stage, there was no statistically significant difference in the responses to “I am part of the market for the grill” and “I am part of the market for the smart laundry machine” (p = 0.250); however, after the intervention, participants identified more strongly with the smart laundry machine market compared to the smart grill market (p = 0.045). These three statements with which participants agreed more strongly post-intervention for the smart laundry machine compared to the smart grill can all be interpreted as being positively framed, indicating that participants took on a more positive view of the smart laundry machine, or a more negative view of the smart grill, after the intervention, despite the lack of a statistically significant increase or decrease. This somewhat supported Hypothesis H3-C, as it was predicted that the intervention would lead to an increase in favorable sentiments toward the laundry machine problem. The Design Considerations Checklist focused heavily on encouraging participants to reflect on user groups that would or would not be able to access their designs, so it is possible that the intervention was successful in reducing availability bias that caused participants to initially misjudge the potential user groups for their smart grill (overestimated) and smart laundry machine (underestimated) designs.
Kendall’s tau-b correlation coefficient (1938) was calculated for every combination of questions from the market survey to determine if there were any strong positive or negative correlations between participants’ Likert scale responses. For example, a significant positive correlation was found for all experimental cases between “The market for the smart [grill/laundry machine] is large” and “The smart [grill/laundry machine] is likely to be commercially successful” (τ = 0.548, p < 0.001). This finding also validates the notion that participants may have viewed the “large market” statement as positively framed, since it was positively associated with commercial success. Similarly, there was a significant positive correlation for all experimental cases between “I am part of the market for the smart [grill/laundry machine]” and “I would want to own the smart [grill/laundry machine]” (τ = 0.576, p < 0.001).
Prior investigation into cognitive bias in design by Fillingim et al. (Reference Fillingim, Shapiro and Fu2022) proposed that correlation between believing that one is part of a market for a product and believing that the market for a product is large may be indicative of availability bias. With that in mind, correlations between responses to the market survey statements “I am part of the market for the smart [grill/laundry machine]” and “The market for the smart [grill/laundry machine] is large” were checked. While there was no significant correlation between responses to these statements pertaining to the smart grill (τ = 0.179, p = 0.113), there was a significant positive correlation between responses to the statements regarding the smart laundry machine at both the pre-intervention (τ = 0.511, p = 0.002) and post-intervention (τ = 0.391, p = 0.014) stages. At the post-intervention stage, there was also a significant positive correlation between “I am part of the market for the smart laundry machine” and “The smart laundry machine is likely to be commercially successful” (τ = 0.445, p = 0.006).
Similarly, there was a significant negative correlation between “I am part of the market for the smart laundry machine” and “The market for the smart laundry machine is niche” at both the pre-intervention (τ = -0.420, p = 0.012) and post-intervention (τ = -0.317, p = 0.042) stages, while there was no significant correlation between responses to these statements pertaining to the smart grill (τ = 0.037, p = 0.750). In other words, participants were more likely to think that the market for the smart laundry machine was large if they personally felt that they were part of the target market for it, while having this sense of belonging to the market did not impact how large the participants felt the market for the smart grill was. This finding is suggestive of availability bias displayed by participants toward the smart laundry machine design problem, as their interpretation of the smart laundry machine market may have been driven by whether they personally identified with it, indicating that participants projected their own experience or desire for a product onto the larger group of potential users. However, the grill was viewed as marketable to a large number of people, regardless of whether designers personally felt as if they were the target market. Also, the bias mitigation intervention did not impact the availability bias exhibited by the designers toward the smart laundry machine, as this positive correlation persisted in the post-intervention market survey. These findings partially support Hypothesis H2-B, as it was expected that these correlations would be present for both the grill and laundry machine concepts based on the predicted effect of availability bias.
A variety of confounding factors may have impacted these correlations, as well as the unexpected lack of availability bias exhibited toward the grill. A laundry machine could be viewed as more “necessary” or “valuable” to a household compared to a grill, as the alternatives to a household laundry machine are offsite laundry or tediously handwashing clothes, whereas the alternative to an outdoor grill is an indoor stovetop. All 30 participants lived in a household with a laundry machine, while 24 out of 30 participants owned a grill. Participants who owned both also reported that their household used the laundry machine around four times more often than they used the grill on a weekly basis.
The feminine-stereotyping of laundry chores compared to the masculine-stereotyping of grilling chores may have impacted the observed correlations; perhaps participants’ view of the size of the grill market was not impacted by their personal level of interest in the product because they subconsciously recognized the inherent value of the product in accordance with the tendency to ascribe higher value to masculine-stereotyped tasks or traits (Eveleth Reference Eveleth2013; Bailey, LaFrance, & Dovidio Reference Bailey, LaFrance and Dovidio2019). Also, participants may have felt that the “smart” aspect of the laundry machine was unnecessary, especially since most participants were not the majority user of their household’s laundry machine: the average participant estimated that of the time their household spent doing laundry, they personally did laundry 38.4% (±6.0% SE) of the time. Conversely, participants spent 65.0% (±7.9% SE) of household time grilling, which was significantly more than the percent of time participants spent doing laundry (p < 0.001). There was also a significant negative correlation between participant age and percent of household time spent doing laundry (τ = −0.466, p = 0.001), indicating that older men participants may have been more likely to adhere to stereotypical gender roles in household chore assignment.
In the final section of the market survey, participants directly compared their perception of their smart grill and smart laundry machine concepts. The means of these responses were compared at both the pre-intervention and post-intervention stages to determine whether the intervention impacted the relative value that participants assigned to each concept. As shown in Figure 11, the intervention did not have a statistically significant impact on which design participants felt they would use more often (p = 0.783), which they would rather own (p = 0.928), which has a larger user base (p = 0.930) or which was more likely to be commercially successful (p = 0.284). It is likely that the factors described in previous paragraphs somewhat “cemented” participants’ views of each item, and as the Design Considerations Checklist was mostly focused on encouraging participants to consider their own experiences and assumptions in the context of the design problem rather than the design problem itself, participants did not significantly change the way they valued or perceived either of the items.
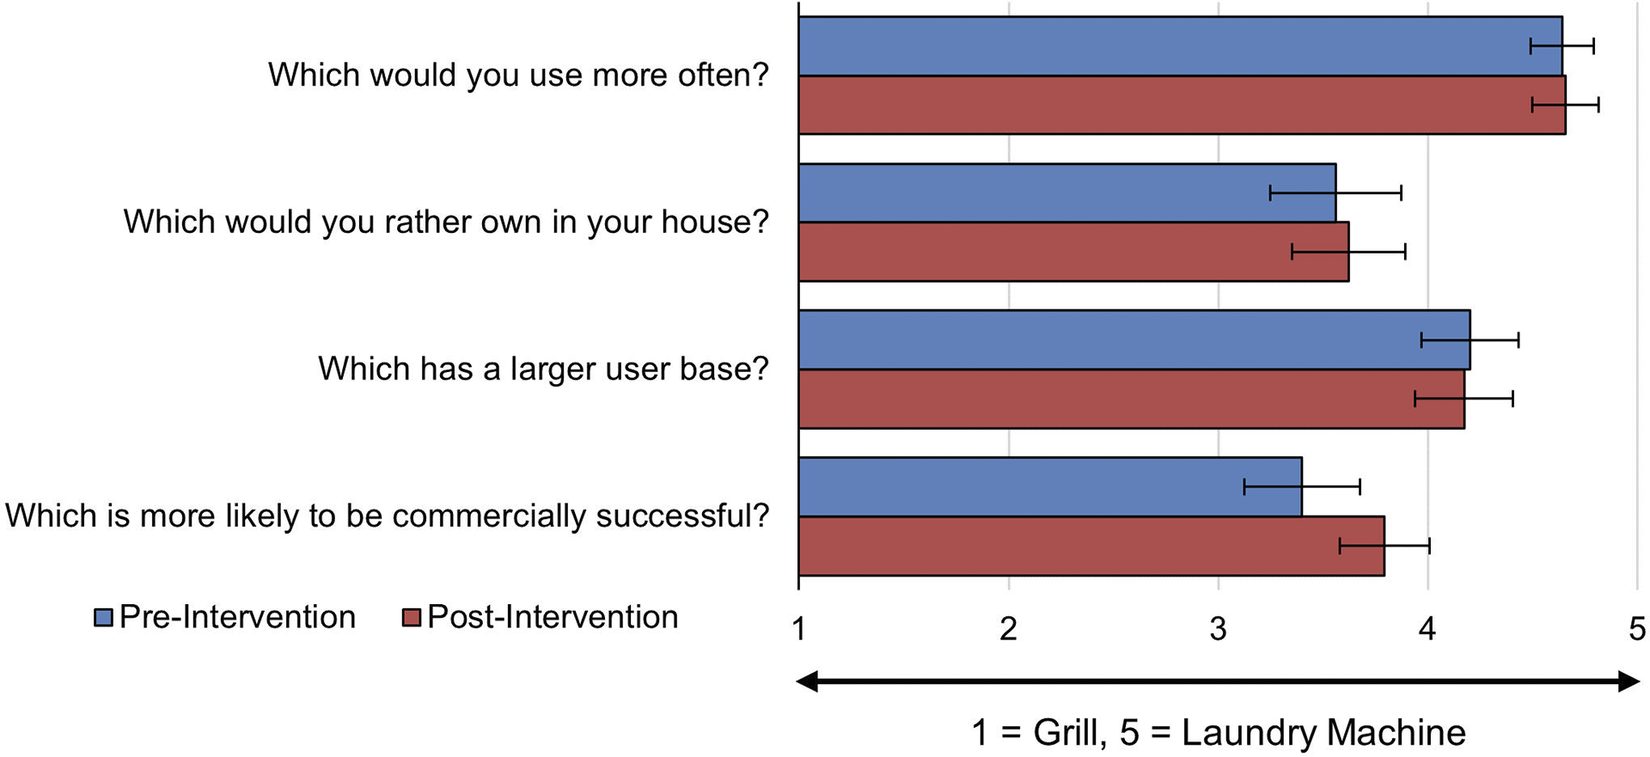
Figure 11. Participant perceptions of statements comparing their sketched concepts for the smart grill and smart laundry machine problems; error bars indicate ±1 SE.
Participants displayed an unexpected preference toward the laundry machine for all four questions, contradicting Hypothesis H2-C. As shown in Figures 12 and 13, a minimum of 60% of participants responded that they “probably” or “definitely” preferred the laundry machine for each of the four questions at both the pre-intervention and post-intervention stages. As previously discussed, it is possible that participants recognized the value of the laundry machine for their household despite not personally interacting with it as much, leading them to display a preference toward it in positively framed questions.
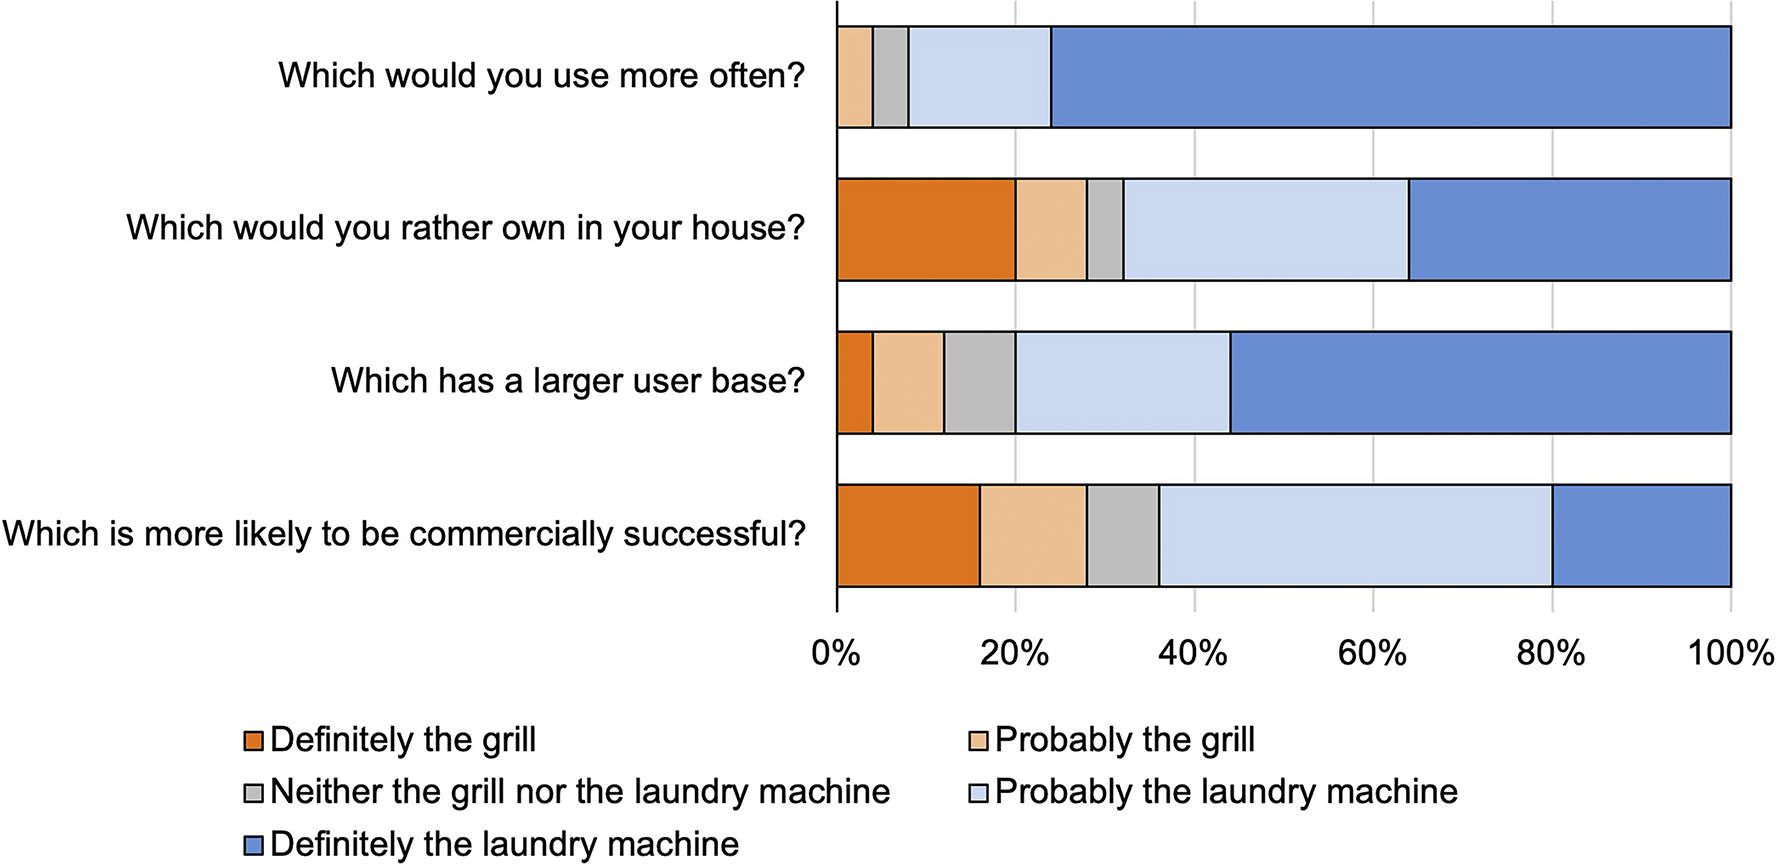
Figure 12. Direct comparison of participants’ sketched smart grill and smart laundry machine concepts, pre-intervention.
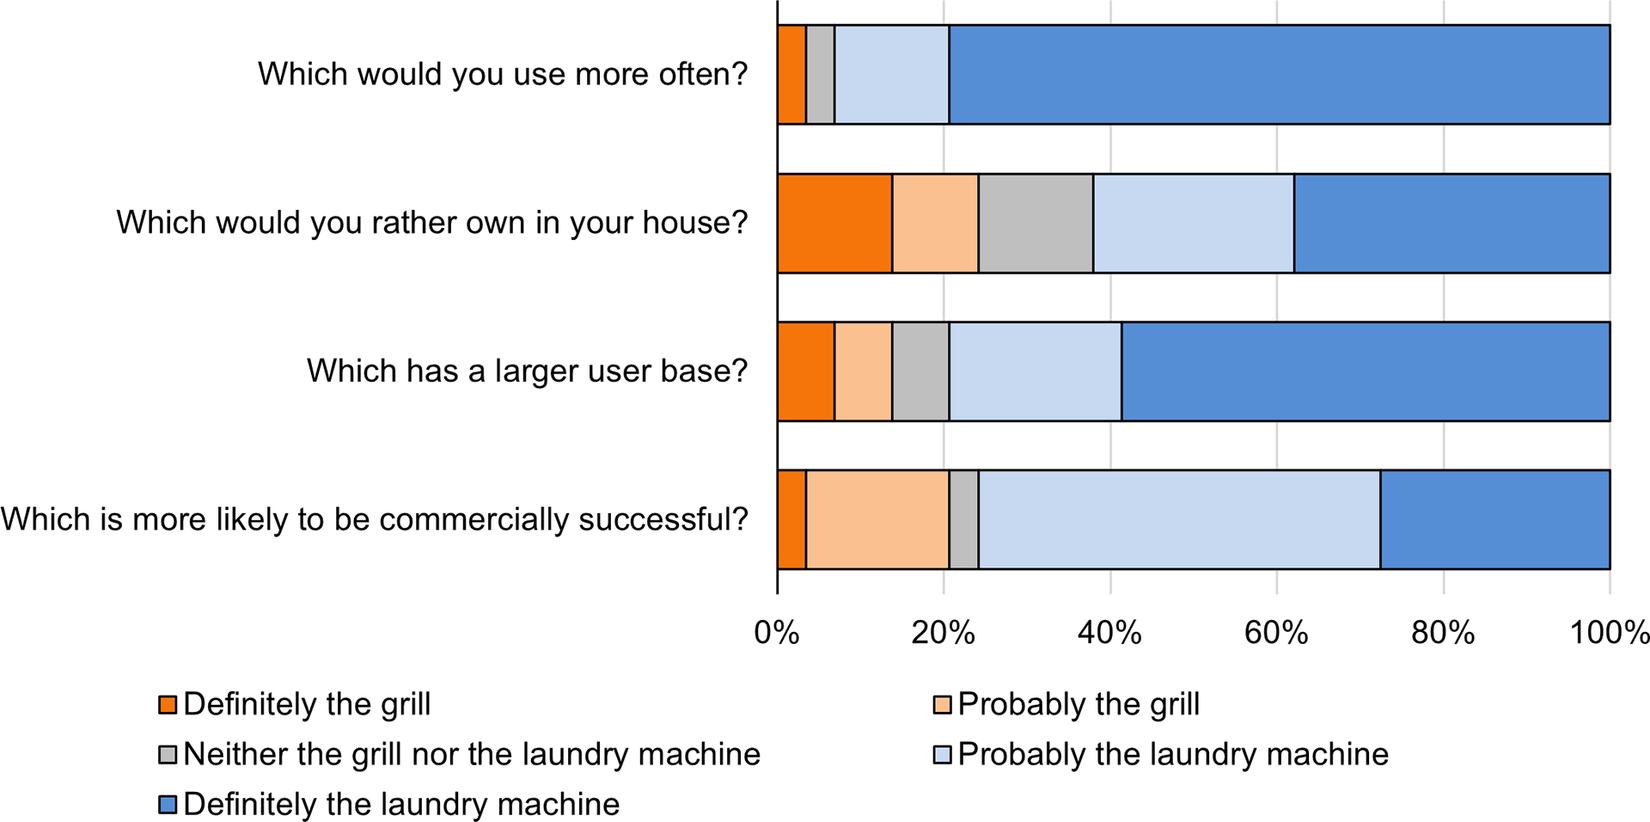
Figure 13. Direct comparison of participants’ sketched smart grill and smart laundry machine concepts, post-intervention.
4.3. Reflections and post-survey (RQ3)
The post-survey investigated participants’ typical interactions with grills and laundry machines. In addition to reporting how often their household used each item and whether or not they personally used each item, participants also reported how much they enjoyed using each item. On a scale from 1 to 5 (1 – strongly dislike, 2 – somewhat dislike, 3 – neither like nor dislike, 4 – somewhat like, 5 – strongly like), participants reported that they enjoy grilling (mean = 3.750±0.190 SE) significantly more than they enjoy doing laundry (mean = 3.150±0.154 SE, p = 0.009). At the pre-intervention stage, there was a significant positive correlation between how much participants reported enjoying using a laundry machine and their agreement with the statement “The smart laundry machine is likely to be commercially successful” (τ = 0.349, p = 0.042), although this correlation was no longer significant after the intervention (τ = 0.151, p = 0.353). Although findings from the market survey did not support Hypothesis H3-C, this finding suggests that the intervention reduced availability bias in participants as it pertains to their belief that the smart laundry machine would be commercially successful, lending support to the hypothesis.
Participants used a 1–5 Likert scale (1 – extremely unhelpful, 2 – somewhat unhelpful, 3 – neither helpful nor unhelpful, 4 – somewhat helpful, 5 – extremely helpful) to describe how helpful they found the Design Considerations Checklist. As shown in Figure 14, over 70% of participants stated that the Design Considerations Checklist was “somewhat” or “extremely” helpful in reflecting on their designs from the pre-intervention stages, while over 60% stated that the checklist was “somewhat” or “extremely” helpful as they developed new designs post-intervention. This slight difference was somewhat expected, as the instructions for the Design Considerations Checklist explicitly instructed participants to “reflect on each question as it pertains to each of your two sketch concepts,” and made no mention of keeping the considerations in mind throughout the remainder of the activity. Notably, less than 10% of participants indicated that the Design Considerations Checklist was “somewhat” or “extremely” unhelpful during the design activities, highlighting its promise as a decision-making tool.
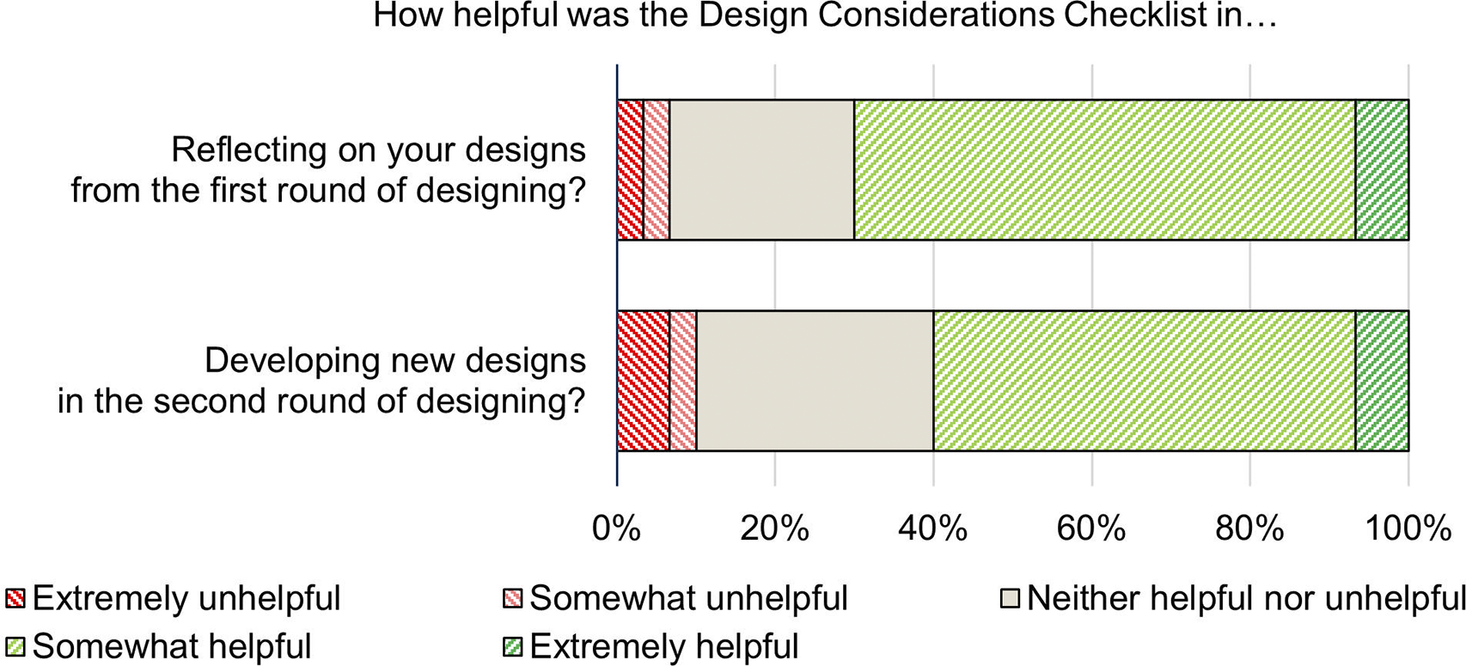
Figure 14. Participants’ perceptions of the helpfulness of the Design Considerations Checklist intervention during the two phases of the study.
Finally, participants provided a written response to the question “How did the checklist impact the way you approached the design problems and questions in the second round?” One judge utilized an inductive coding scheme to develop a rubric of 11 recurring themes from the data (24 coherent responses), as shown in Table 2. Because of the number of possible codes, percent agreement was calculated for two independent judges rather than Cohen’s Kappa, and the judges achieved sufficient agreement of 80% on the full data set.
Table 2. List of themes and sample responses for the post-survey question “How did the checklist impact the way you approached the design problems and questions in the second round?”
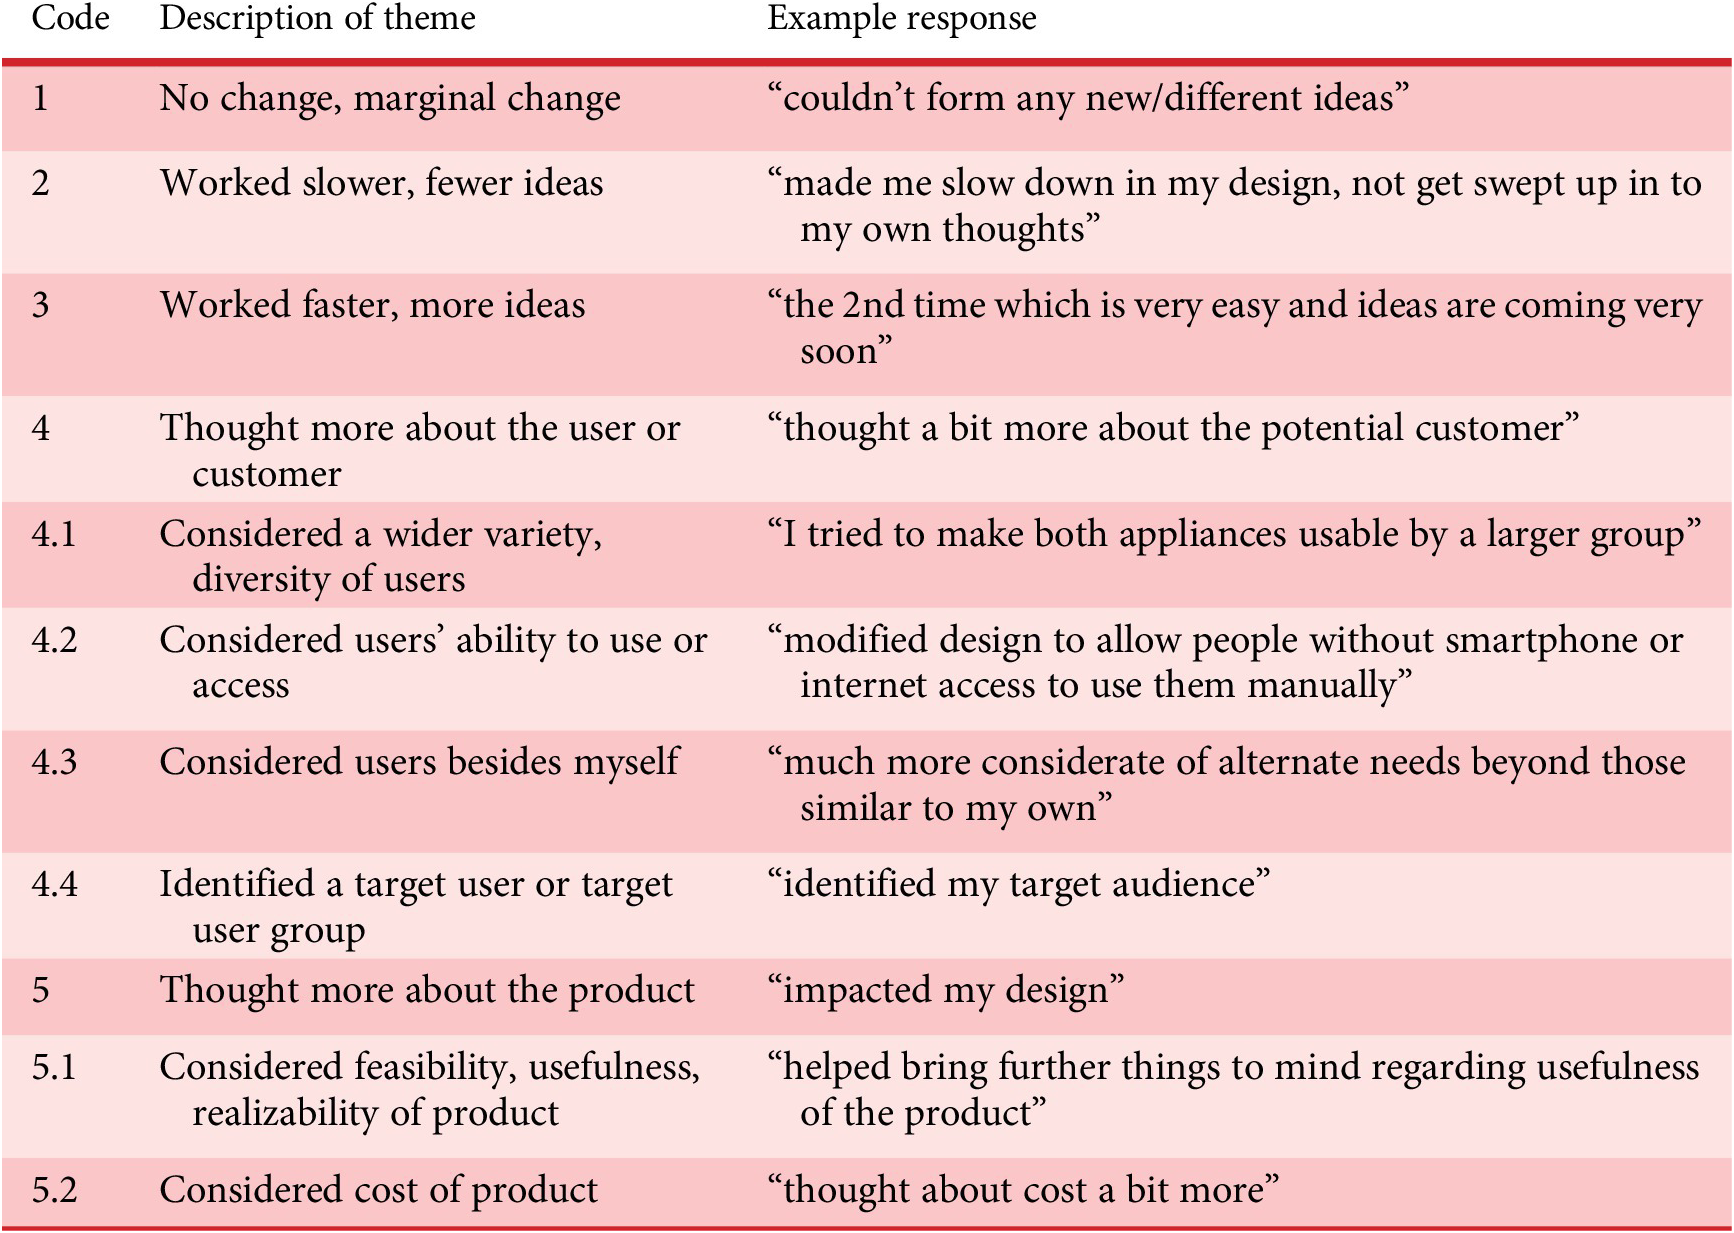
In addition to some responses pertaining to output during the brainstorming and sketching sessions (some participants mentioned that they felt they did not change their designs much, or that they brainstormed fewer ideas than they did pre-intervention), two main overarching themes emerged: participants mostly felt that the Design Considerations Checklist led them to either consider the potential user or customer more (13 responses), or led them to consider the actual product they had designed more (6 responses). This breakdown lends additional support to earlier speculation that the Design Considerations Checklist was more effective in helping participants to consider their perception of the user rather than their perception of the design problem or the value they placed on the subject of the design problem.
Figure 15 shows a breakdown of the number of occurrences of each theme across the responses. While a plurality of participants stated that the way they approached the design problem changed very little, if at all, many responses referenced making considerations for a wider variety of users or recognized that they were targeting a particular group. Interestingly, four responses specifically referenced making considerations for users other than themselves – in other words, participants who had previously applied availability bias to their work by primarily considering their own needs or preferences made a conscious effort to think of what other users would want. For example, one participant stated that “I tried to determine what other users may want rather than what I would want” in the second round of designing, showing that the intervention successfully led participants to reflect on their availability bias and take steps to avoid it.
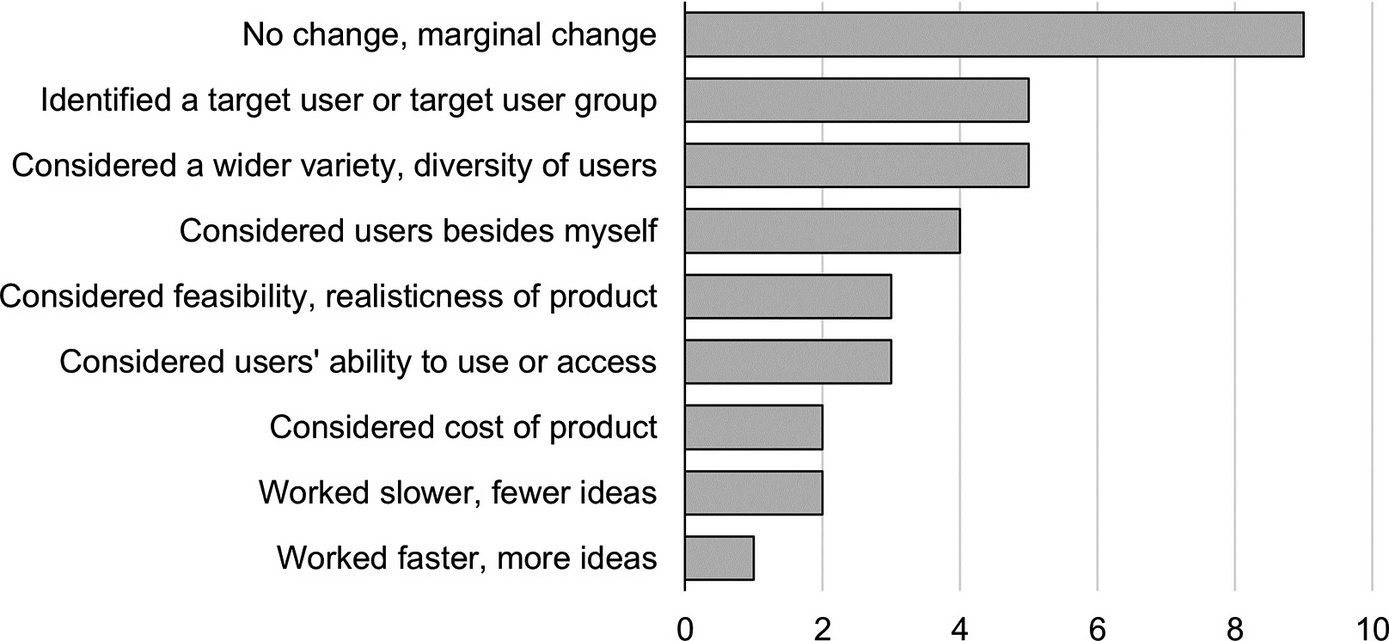
Figure 15. Number of occurrences of qualitative themes across 24 written responses to “How did the checklist impact the way you approached the design problems and questions in the second round?”
5. Conclusions
5.1. Limitations and future work
One disadvantage of a within-subjects experimental design is that participants may grow tired of the data collection activities on the second time through the procedure, as evidenced by the shortening of written responses and some participants’ refusal to participate in a second round of brainstorming or sketching. Although 30 participants provided a satisfactory sample size, especially considering that the participants were professional engineers and designers, this sample size limited the study design to within-subjects. A larger-scale between-subjects study would mitigate the collection of low-effort data from participants and would also enable the comparison of multiple types of bias mitigation interventions, such as checklists, user personas in various formats and simulations. Given additional time with the participants, future work should also include greater emphasis and analysis of the participants’ interactions with the bias mitigation tools. For example, requiring participants to provide a written response to each checklist item, or audio-recording verbal responses, would allow the researchers to analyze common themes in responses and connect participants’ reflections to design features in their sketches. These detailed data obtained from highly engaged participants have the potential to provide greater insights and findings that are more closely aligned with expectations from existing literature.
In a larger study such as the proposed between-subjects study, the efficacy of various interventions could be assessed in addition to the cognitive load imposed by each, which is a relevant concern in ensuring user comfort during decision-making tasks (Sibbald et al. Reference Sibbald, de Bruin and Merrienboer2013). Another limitation of the study design was that due to time and scheduling constraints, researchers’ interactions with the participants were limited to a single session. A longitudinal study format with continuous access to participants would allow researchers to study the longer-term efficacy of the bias mitigation intervention to understand the effects of temporal distance from the intervention.
When recruiting participants for future work, there are several additional considerations to be made. First, participants in this study, despite being employed as engineers or designers, came from a variety of educational backgrounds, as detailed in Section 3.2. As a result, some participants had little to no formal training on human-centered design principles, while others had spent several years obtaining a degree in closely related fields. While these diverse backgrounds can be representative of the makeup of engineering teams in industry, results of this study would hold more validity if these confounding factors were controlled by recruiting participants from more similar backgrounds. Comparing these results to a similar study conducted with novice engineers or designers would afford additional insight into the role of education on bias mitigation in design. In addition, the majority of participants were men, and all participants were employed at a kitchen appliance company who had chosen to participate in a half-day design cognition workshop. As a result of the lack of gender diversity, it was not possible to draw conclusions related to availability bias that may have been a result of gender-stereotyped household chores. Participants were also limited to those who had an existing interest in design cognition, as participation in the workshop was voluntary and occurred during working hours, meaning that results are not necessarily representative of the general engineering design workforce. Although participants likely had varying levels of prior familiarity with cognitive bias, all participants were given the same background information on different types of bias (excluding availability bias) in design contexts directly before the design activity.
Variations in the way participants interpreted Likert-scale statements throughout the market survey, given a lack of definition or context, may have led to confusion among participants. For example, the response to statements such as: “The smart [grill/laundry machine] is likely to be commercially successful” or “The smart [grill/laundry machine] can be used by anyone” may vary between participants depending on their interpretation of the words “initiative” or “anyone.” Framing bias may have also played a role in the way participants responded to questions, as identified previously. To mitigate this, care was taken to include both positively and negatively framed statements. Similarly, one main finding from the qualitative analysis of the market survey was that participants moved toward creating designs that were for “everyone” or “anyone.” While this may be a positive indication that participants applied principles of universal design in their work, Makhlouf et al. (Reference Makhlouf2023) view this as a negative finding indicating that participants were designing for a non-existent “average” user. More in-depth data collection methods, such as focus groups or short interviews, would build a deeper understanding of designers’ intentions and thought processes when developing a design “for everyone.” Future directions for research may involve developing and validating guided reflection tools for encouraging designers to consider the full range of diverse users’ needs, rather than a general user.
5.2. Contributions
The two main contributions of this work are (1) a mixed-methods comparison of how availability bias manifests in a design concept development activity with professional engineers and designers and (2) a novel application of a checklist-based bias mitigation intervention targeted at reducing availability bias and building empathy for users. Based on the analysis discussed above, this paper explored the following research questions, filling established gaps in literature:
RQ1: How do indicators of availability bias manifest through design outcomes in a brainstorming and sketching design activity?
The number of brainstormed concepts was examined to understand how availability bias may have manifested in the flow of brainstormed ideas. In contradiction to Hypothesis H1-A, it was found that neither the intervention nor the design problem (p = 0.629) had a statistically significant impact on the number of concepts generated. The sketches were also examined to identify whether participants had included a representation of a user in their sketches, due to correlations between visual inclusion of a user and higher consideration for user needs and contexts (Makhlouf et al. Reference Makhlouf2023). Although 3 out of 26 grill sketches and 3 out of 22 laundry machine sketches at the pre-intervention stage, and 4 out of 22 grill sketches and 6 out of 24 laundry machine sketches at the post-intervention stage featured a depiction of a user, these differences were not statistically significant, contradicting Hypothesis H1-B.
RQ2: How do indicators of availability bias manifest through designers’ perceptions of the market for a product and the value of a product?
After brainstorming and sketching, participants filled out a market survey in which they estimated a price that their smart grill and smart laundry concepts would be sold for, then responded to a series of statements regarding the potential market for each concept. Contradicting Hypothesis H2-A, there were no significant differences between the average prices assigned to the smart grill and smart laundry machine. Participants were also more likely to agree with negatively framed statements about the smart grill and positively framed statements about the smart laundry machine, which was unexpected and contradicted Hypothesis H2-A. Similarly, participants displayed a preference toward the smart laundry machine in a series of four head-to-head comparison questions, contradicting Hypothesis H2-C. Although many of the participants were not the primary users of their household’s laundry machine, it is probable that these results are indicative of their recognition that the laundry chore is essential to their household. Finally, checking for correlations between responses to survey questions, such as “I am part of the market for the smart [grill/laundry machine]” and “The market for the smart [grill/laundry machine] is large,” revealed that a positive correlation was present for the statements pertaining to the smart laundry machine, but not the smart grill. This indicated that participants exhibited availability bias toward the smart laundry machine problem but not toward the smart grill problem, partially supporting Hypothesis H2-B.
RQ3: How does a checklist-style bias mitigation intervention impact manifestations of availability bias and considerations made for a diverse collection of users?
Participants found the bias intervention especially helpful in reflecting on designs they developed during the first brainstorming and sketching phase; however, Hypothesis H3-A was not supported by the finding that the number of brainstormed concepts did not significantly change from pre-intervention to post-intervention. Similarly, although the number of sketches containing a visual representation of a user increased from 12.5% to 21.7%, this difference was not significantly significant, failing to support Hypothesis H3-B. The intervention did not impact the scores of the head-to-head comparison of the product markets, and also did not impact the correlations discussed in RQ2, as significant positive correlations persisted post-intervention. These findings contradict Hypothesis H3-C; however, the intervention was successful in eliminating a positive correlation between participants’ enjoyment of doing laundry machines and their response to “The smart laundry machine is likely to be commercially successful,” which is indicative that availability bias was present and then mitigated. Qualitative analysis of participants’ reflections indicated that the intervention primarily assisted designers in making additional considerations for users, such as increasing accessibility and building awareness of excluded user groups.
Financial support
This material is based upon the work supported by the National Science Foundation Graduate Research Fellowship under grant number DGE-2039655. Any opinion, findings and conclusions or recommendations expressed in this material are those of the authors and do not necessarily reflect the views of the National Science Foundation.
Competing interests
The authors declare none.
Appendix
Design Considerations Checklist:
-
□ Are your design decisions being influenced by the degree to which you are interested in the topic?
-
□ How does your design offer room or account for user error?
-
□ How was your design influenced by your judgment of who the user is? Did you apply stereotypical associations to your perception of the user?
-
□ Are there any people who are unlikely to benefit from this design? Are there any people or groups of people who this design would not work for?
-
□ Did you consider alternate use cases for this category of product?
-
□ What assumptions did you make while creating this design?
-
□ Are there cultural differences in the way people might use this product?
-
□ Are there any events or occurrences in your life that influenced any parts of your design?
-
□ What additional information would you want while tackling this design problem?
-
□ Did you make any considerations while creating your design to make it accessible to a wide range of people?


 Open access