1. Introduction
Among dwarf stars in the spectral type range from mid-F to K, there is a correspondence between far-ultraviolet (FUV) brightness and the level of both chromospheric and coronal activity (e.g., Smith & Redenbaugh Reference Smith and Redenbaugh2010; Findeisen, Hillenbrand, & Soderblom Reference Findeisen, Hillenbrand and Soderblom2011; Murgas et al. Reference Murgas, Jenkins, Rojo, Jones and Pinfield2013; Shkolnik et al. Reference Shkolnik, Rolph, Peacock and Barman2014; Smith, Hargrave, & Eckholm Reference Smith, Hargrave and Eckholm2017), as traced by indicators such as Ca II H and K emission, Mg ii h and k emission, and soft X-ray luminosity. A similar correspondence among M dwarfs has been detailed by Shkolnik et al. (Reference Shkolnik, Rolph, Peacock and Barman2014) and Shkolnik & Barman (Reference Shkolnik and Barman2014). The aim of this paper is to extend the evidence for a chromospheric-activity–FUV relation to red giant stars. The basis for this study is FUV photometry obtained from the GALEX satellite (Morrissey et al. Reference Morrissey2005, Reference Morrissey2007), combined with a data set of homogeneous measurements of the strength of the chromospheric emission in the cores of the Mg ii h and k lines from Pérez Martínez, Schröder, & Cuntz (Reference Pérez Martínez, Schröder and Cuntz2011; PM11).
2. Data compilation
The work of Pérez Martínez et al. (Reference Pérez Martínez, Schröder and Cuntz2011) has provided a valuable compendium of chromospheric λ2800 Mg ii emission line strengths for a sample of evolved giant stars, all measured from high-resolution IUE spectra in a homogeneous manner. The parameter derived by PM11 is the combined flux at the stellar surface in the Mg ii h + k emission lines, which will be denoted herein as F mgii. PM11 give their measured surface fluxes in units of mW m−2. Two values of the stellar surface flux were derived by PM11 by combining the flux measured at Earth from the IUE spectra with two different values of stellar effective temperature based on the B–V and V–K colours, and bolometric corrections applied to V and K magnitudes. In this paper a straight average of the two F mgii values from PM11 has been adopted for each star. Additionally, a ratio of the Mg ii h + k surface flux to the bolometric surface flux has been calculated for each star, using the formula
The value of the effective temperature used here is the mean of the values from PM11 that are based separately on B–V and V–K colours.
Trigonometric parallaxes were obtained from the SIMBAD Astronomical Database (Wenger et al. Reference Wenger2000) for all giants in the PM11 sample, these in turn typically coming from the Gaia Data Release 2 (Gaia Collaboration et al. 2018; Lindegren et al. Reference Lindegren2018). In some cases the parallaxes are from the Hipparcos (van Leeuwen Reference van Leeuwen2007) or Tycho-Gaia Astrometric Solution (Gaia Collaboration et al. 2016) data sets. Spectral types and luminosity classes (LCs) given in SIMBAD were also compiled, along with various ancillary notes about each star, such as whether it is a member of a double system or a spectroscopic binary, and whether it is a known variable. A number of the stars in the PM11 sample are long period variables (LPVs).
In regard to photometry the B–V colours given by PM11 were adopted here, while V magnitudes were acquired from the General Catalogue of Photometric Data (Mermilliod, Mermilliod, & Hauck Reference Mermilliod, Mermilliod and Hauck1997; GCPD). One photometric system that provides useful data on the evolutionary state of a red giant is the David Dunlap Observatory (DDO) system (McClure & van den Bergh Reference McClure and van den Bergh1968). Such photometry is available for a large fraction of the stars in the PM11 sample. Values of the two main colours within this system, C(45−48) and C(42−45), were obtained from McClure & Forrester (Reference McClure and Forrester1981) where available, and in other instances were gleaned from the GCPD.
Apparent FUV magnitudes m FUV for PM11 giants were found by searching the GALEX GR6/7 Data ReleaseFootnote a. This was done using the GALEX Catalog Search toolFootnote b for a search radius of 0.2 arcmin around the sky position of each star. There are 26 stars for which two values of m FUV were returned by the position search, and for these stars the average range between the two values was 0.17 mag, with a standard deviation in the range of 0.27 mag. Seven of these 26 stars (27%) are spectroscopic binaries, although six of them do not show unduly large ranges in m FUV. One of the seven SBs with two measurements showed a difference of more than 1 mag in m FUV, a range that might be related to binary-induced variability. Omitting this star from a consideration of error estimates, the average range in m FUV decreased from 0.17 to 0.13, with a standard deviation in the range of 0.13. Thus a typical 1σ observational error in m FUV for the PM11 sample would seem to be ∼0.11–0.15 mag, although errors as great as ∼0.4 mag may be encountered. By comparison, the photometric repeatability in m FUV is quoted by Morrissey et al. (Reference Morrissey2007) as 0.05 mag. The GALEX apparent FUV magnitude was used to form a colour (m FUV − B), following the approach of Smith & Redenbaugh (Reference Smith, Hargrave and Eckholm2010) for dwarf stars.
The basic data compiled for this paper are listed in Table 1, wherein is given the HD number of each red giant, the absolute magnitude MV, (B−V) and (m FUV−B) colours, effective temperature and Mg ii h and k flux from PM11, and a ν sin i projected rotation velocity obtained as described in Section 5. In summary, the sample of red giants compiled in Table 1 comprises 177 stars, of which 38 are of an LC brighter than III. There are 42 spectroscopic binaries and 19 LPVs in the sample, identified by footnote marks in Table 1.
Table 1. Red giant Mg ii h and k fluxes and photometric data

a Spectroscopic binary.
b Long-period variable.
c Parallax from Hipparcos.
3. Properties of red giants in the PM11 sample
The Mg ii flux parameters log F mgii and log (F mgii/F bol) are shown versus B−V in Figures 1 and 2, respectively. Both exhibit a trend towards decreasing flux levels along the red giant sequence towards redder B−V, although the trend is stronger in the unscaled surface flux F mgii. Eye-estimates of baselines to the Mg ii flux relationships with respect to B−V are shown as solid lines in Figures 1 and 2, and have the equations
and
One of the main objectives of Pérez Martínez et al. (Reference Pérez Martínez, Schröder and Cuntz2011) was to more precisely define the behaviour of this base flux level as a function of effective temperature among evolved stars (see also Judge & Stencel Reference Judge and Stencel1991). Spectroscopic binaries are shown as crosses in Figures 1 and 2, while LPVs are plotted as open circles. There is typically a range of ∼1 dex (or more) in log F mgii throughout the colour range 0.8 ≤ (B−V) < 1.6 (Figure 1). Some of the highest Mg ii surface fluxes at a given B−V are found among spectroscopic binaries. The LPVs have B−V > 1.4 and among these there is again a range of ∼1 dex in Mg ii surface flux. The behaviour of log (F mgii/F bol) is rather similar, although the baseline variation with B−V is less steep.
Both log F mgii and log (F mgii/F bol) could be used as a measure of the level of chromospheric activity at the surface of a red giant. In fact, the work of Pérez Martínez et al. (Reference Pérez Martínez, Schröder and Cuntz2011) just reported the unscaled flux log F mgii. Figure 3 shows that the two parameters correlate well among the sample of PM11 giants.
Two versions of the colour–magnitude diagram (CMD) of the PM11 sample are shown in Figure 4. In the top panel the points are encoded according to the LC given in SIMBAD for each star. Filled circles correspond to stars listed as having an LC of III or III–IV, whereas open circles correspond to LC III–II, II, or I. In the bottom panel the symbols are used to highlight stars that are LPVs or members of spectroscopic binary systems. As would be expected, most of the LC III giants have absolute magnitudes of MV > −2.0. However, there are perhaps five stars in Figure 4 for which SIMBAD gives an LC of III but for which the absolute magnitude is more consistent with a bright giant of class II. Model evolutionary tracks for stars in the first-ascent red giant branch (RGB) phase from the Dartmouth Stellar Evolution Programme (Dotter et al. Reference Dotter, Chaboyer, Jevremović, Kostov, Baron and Ferguson2008) are shown in the top panel of Figure 4 for solar metallicity stars of 1 M⊙ (solid line), 2 M⊙ (dotted line), and 3 M⊙ (dashed line). The tracks encompass many of the PM11 stars of LC III, indicating that a significant fraction of these stars are in the hydrogen-shell-burning RGB phase of evolution. There is also a sequence of helium-core-burning stars discernible in the region of the CMD corresponding to 0.4 ≤ MV ≤ 1.1 and 0.85 ≤ (B−V) ≤ 1.20. Spectroscopic binaries are spread throughout the entire distribution of points in Figure 4. Long-period variables in the PM11 sample typically have B−V ≥ 1.45, and most are spread in absolute magnitude throughout the range −4.5 ≤ MV ≤ −0.5.
The DDO photometry collected here is used to plot the C(45−48) versus C(42−45) two-colour diagram in Figure 5. As with the upper panel of Figure 4 the symbols denote the LC as given by the SIMBAD database. It has been well documented that the C(42−45) colour is sensitive to effective temperature, whereas the C(45−48) colour is influenced by surface gravity (McClure Reference McClure, Fehrenbach and Westerlund1971, Reference McClure1976, Reference McClure1979; Tripicco & Bell Reference Tripicco and Bell1991). For example, Janes (Reference Janes1975) and McClure & Forrester (Reference McClure and Forrester1981) have shown that LC III, II, and Ib stars follow off-set sequences in Figure 5, and the PM11 sample clearly shows the brighter LC (III–II, II, and I) stars falling at higher values of C(45−48) than their LC III counterparts. As such, the two-colour diagram in Figure 5 can serve as a proxy for a Hertzsprung–Russell diagram or CMD, and can be compared with the upper panel of Figure 4. As with the previous figure, there appear to be five giants in the PM11 sample for which the DDO photometry is suggestive of a brighter LC than the III quoted in SIMBAD.Footnote c In both Figures 5 and the upper panel of Figure 4 there is one PM11 star that is depicted with a cross; SIMBAD did not quote an LC for this star (HD 210745), while both the DDO colours and position in the CMD are consistent with a giant that is brighter than LC III.
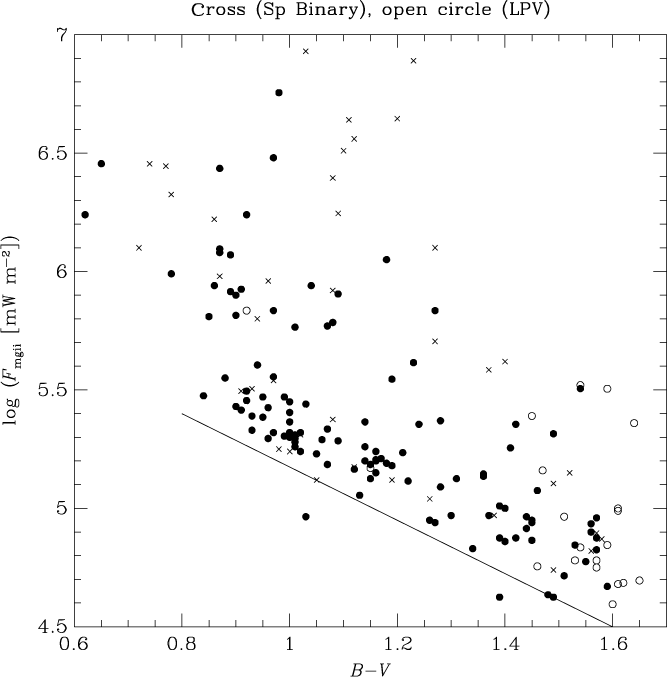
Figure 1. The surface flux of Mg ii h and k emission versus B−V colour for giant stars in the PM11 sample. There is a notable decrease in the mean flux with increasing B−V, with the solid line being an eye-estimate of the lower limit to this trend. Crosses and open circles denote spectroscopic binary and LPV stars, respectively.
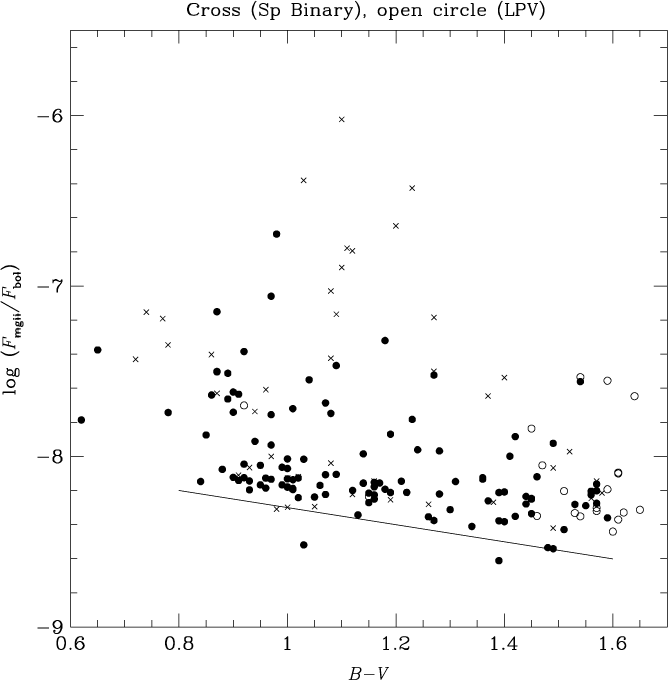
Figure 2. The normalised flux ratio log (F mgii/F bol) versus B−V colour for giant stars in the PM11 sample. There is a decrease in the mean flux ratio with increasing B−V, the solid line depicting an eye-estimate of the lower limit to this trend. Crosses and open circles denote spectroscopic binary and LPV stars, respectively.

Figure 3. The normalised flux ratio log (F mgii/F bol) versus the surface flux of Mg ii h and k emission for giant stars in the PM11 sample.
In summary, Figure 4 and 5 reveal that the PM11 sample consists of giants that are in a variety of evolutionary stages, with LCs of III and II being well represented, and a few giants attaining to class I. Many of the LC III stars are likely to be hydrogen-shell-burning first-ascent RGB stars with masses between 1 and 3 M⊙. Stars in a more evolved core-helium-burning phase with mass less than 2.5 M⊙ also seem to be present among the LC III sample. Figure 4 indicates that the LC II and I stars in the PM11 sample with absolute MV magnitudes between −2 and −6 will have masses greater than 3 M⊙. Long-period variables are candidates to be in an asymptotic giant branch phase of evolution.

Figure 4. The CMD of giant stars in the PM11 sample. Top panel: symbols are chosen to denote LC (the one cross in this panel denotes a star for which SIMBAD did not quote an LC). A Dartmouth evolutionary track for a solar metallicity 1 M⊙ model star is shown in the upper panel by a solid line. Tracks for 2 M⊙ and 3 M⊙ solar metallicity models are depicted with dotted and dashed lines, respectively. Bottom panel: LPVs and members of spectroscopic binary systems are represented with distinctive symbols.
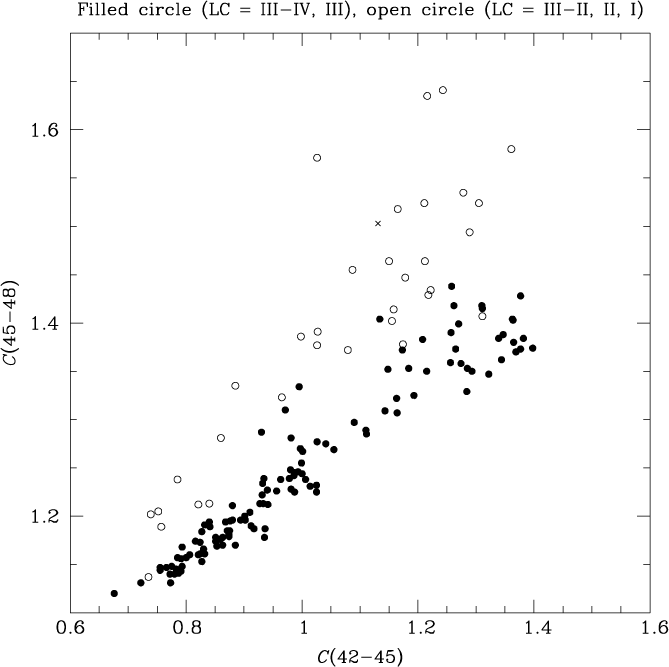
Figure 5. The DDO two-colour diagram of giant stars in the PM11 sample. Within the DDO photometric system C(45−48) is sensitive to surface gravity, while C(42−45) is an effective temperature indicator. Symbols are chosen to denote LC, with filled symbols corresponding to LC III giants or fainter class III–IV. The cross is a star for which SIMBAD did not specify an LC, while the position in this diagram is consistent with an LC of II or brighter.
4. The correlation between Mg ii emission and FUV brightness
A plot of (m FUV−B) versus (B−V) for the PM11 stars is given in Figure 6. There is a considerable range in the FUV-to-B colour for giants of all spectral types and photospheric temperatures covered by Figure 6, that is much larger than the expected observational uncertainties. Synthetic spectrum calculations based on photosphere-only model atmospheres by Findeisen et al. (Reference Findeisen, Hillenbrand and Soderblom2011) indicate that throughout the effective temperature range covered by the giants in the PM11 sample the FUV flux should be dominated by chromospheric and transition region emission. As such, the scatter in Figure 6 at a given (B−V) is expected to trace the range in stellar activity levels among the PM11 red giants.
In addition to the pronounced scatter, there seems to be an upper envelope to the locations of the data points in Figure 6. Among giants at each (B−V) colour there is an empirical red limit to (m FUV−B), the value of which varies with photospheric colour. The locus of this red envelope in Figure 6, which is denoted (m FUV−B)e, is defined by those giants within the PM11 sample that have the lowest FUV-to-B flux ratio for their spectral type. An eye-estimate of the upper envelope has been added to Figure 6, where it is shown by the pair of intersecting straight lines. Dwarf stars show an analogous upper-envelope phenomenon in the (m FUV−B, B−V) diagram (Smith & Redenbaugh Reference Smith and Redenbaugh2010). In reference to the red giants of the PM11 sample, the two segments of the upper-envelope locus adopted in Figure 6 correspond to
for red giants with B−V < 1.2, and
for the coolest PM11 giants with (B−V) > 1.2. By and large, it is LC III giants that define the upper envelope in Figure 6. An upper fiducial comprised of two segments seems consistent with the data, although our use of two straight lines might be a simplification of a more complicated function. The break at a colour of (B−V) = 1.2 ensures that all core-helium-burning stars are referenced to Equation (4), while no core-helium-burning stars should be found in the colour range covered by Equation (5).
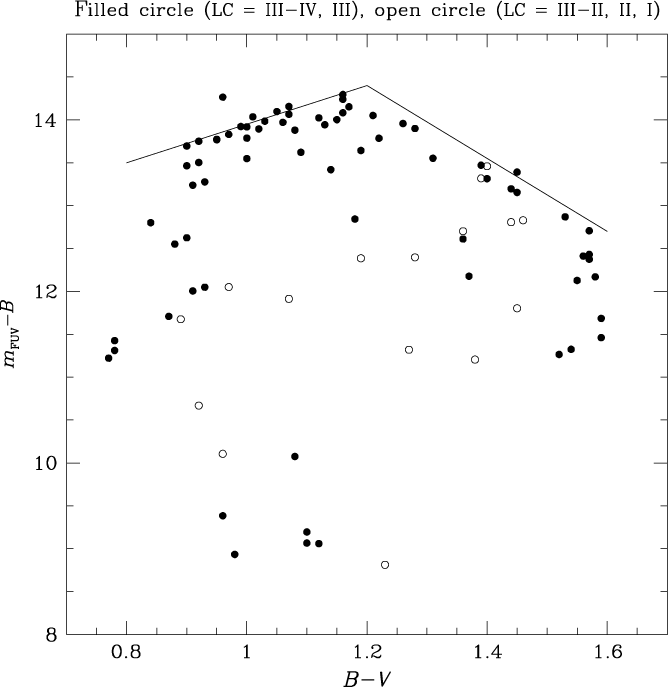
Figure 6. The FUV/blue two-colour diagram of giant stars in the PM11 sample. LC III stars (or fainter) are represented by filled circles, while giants of brighter classes are shown with open circles. The solid locus is an eye-estimate to the upper envelope of the data points and is given by Equations (4) and (5) in the text.
Comparing the FUV-based colour (m FUV−B) directly with the Mg ii h and k surface flux, both in units of mW m−2 and scaled to the bolometric surface flux, gives the plots shown in the upper and lower panels, respectively, of Figure 7. While trends are evident in both panels there is broad scatter. One factor contributing to the scatter is the phenomenon that red giants of different (B−V) colours are associated with different upper limits to the (m FUV−B) colour. A first-order way of taking this effect into account was experimented with by referencing the (m FUV−B) colour of each star to the upper-envelope value (m FUV−B)e given by either Equation (4) or (5) for the appropriate (B−V). The difference, denoted here as Q(m FUV−B) = (m FUV−B) − (m FUV−B)e, can serve as an FUV-excess parameter. It is defined in such a way that as the flux in the FUV band increases relative to the B-band flux the value of Q(m FUV−B) becomes more negative.
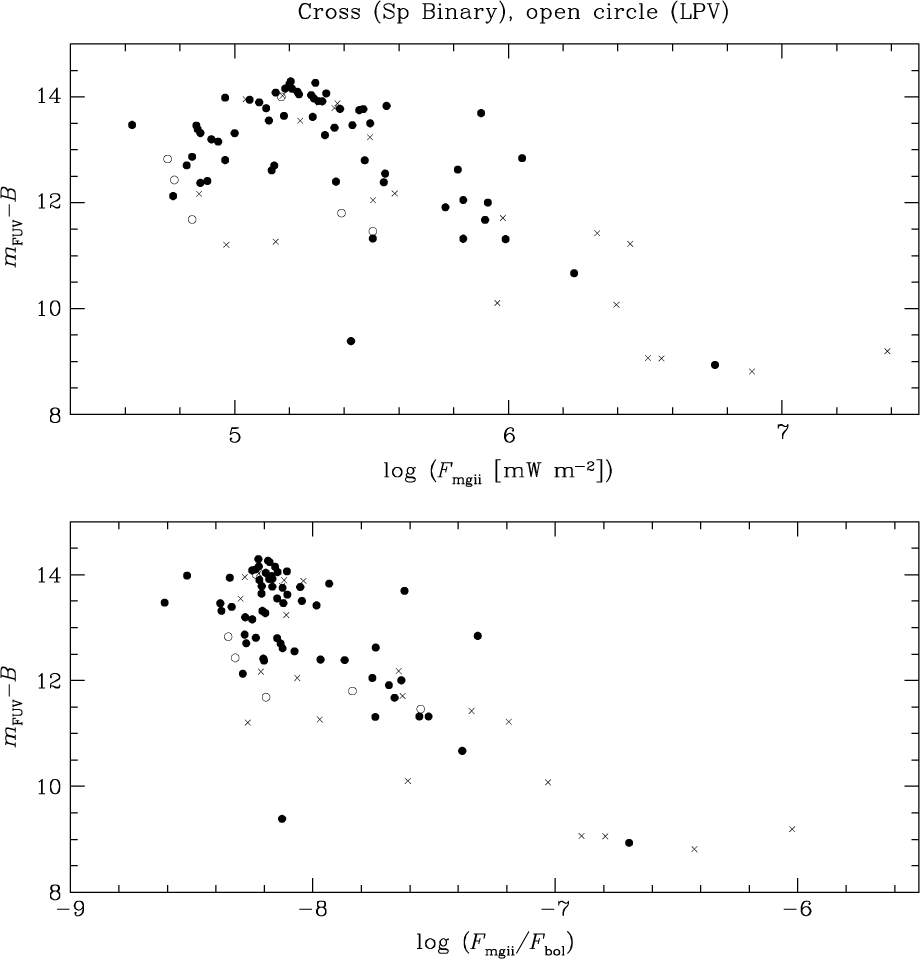
Figure 7. The (m FUV−B) colour of giant stars in the PM11 sample versus two measures of the surface flux of the Mg ii h + k emission lines. In the top panel the surface flux in units of mW m−2 from the PM11 survey is plotted, whereas in the bottom panel the emission line flux has been scaled to the bolometric surface flux. Spectroscopic binaries and LPVs are depicted with crosses and open circles, respectively; all other stars are shown as filled circles.
In Figure 8 the FUV-excess Q(m FUV−B) is plotted versus the Mg ii flux parameter log (F mgii/F bol) for PM11 giants in the colour range 0.70 < (B−V) < 1.20. The crosses and open circles in this figure denote spectroscopic binary and LPV stars, respectively. Although some of the giants with the greatest FUV excess and strongest Mg ii h + k emission are in spectroscopic binary systems, such binaries nonetheless fall close to the sequence defined by the other stars. A correlation is evident for which the value of the Spearman rank correlation coefficient is −0.71. However, even without the envelope correction incorporated into the Q-parameter, with just a (B−V) colour restriction to the 0.7–1.20 range alone, (m FUV−B) evinces a well-defined correlation against log (F mgii/F bol). In fact the Spearman rank correlation coefficient for this case is −0.81, higher than for the Q(m FUV−B) parameter. This would seem to confirm that the FUV flux of these giant stars is indeed dominated by emission originating from the chromosphere and transition region.
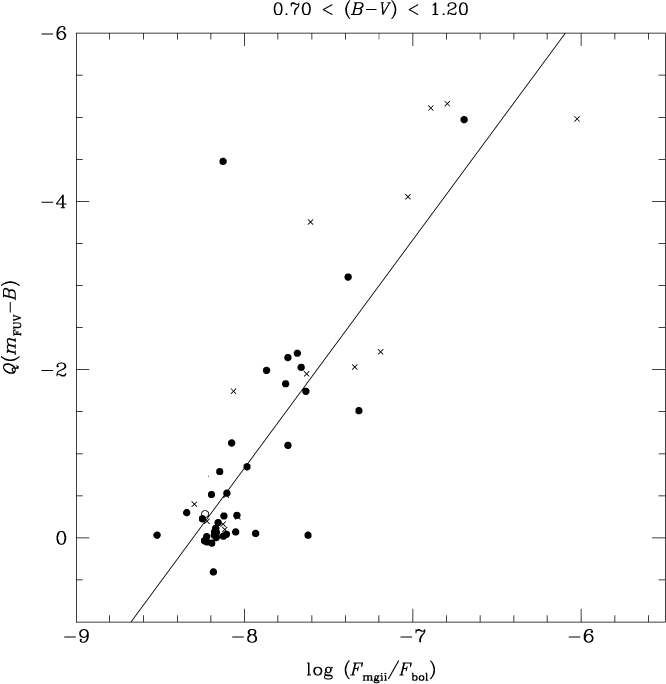
Figure 8. The FUV-excess parameter Q(m FUV−B) versus the normalised Mg ii h + k flux, that is, log (F mgii/F bol), for giant stars in PM11 with colour in the range 0.70 < (B−V) < 1.20. Crosses and open circles denote spectroscopic binary and LPV stars, respectively. The solid line is a linear least-squares fit.
Correlations were also sought between FUV-excess and the surface flux log F mgii within the colour range 0.70 < (B−V) < 1.20. Once again the correlation with (m FUV−B) was slightly tighter (Spearman rank correlation coefficient of −0.87) than with Q(m FUV−B) (Spearman coefficient of −0.72). In the former case a linear least-squares fit is given by the equation
This has the highest correlation coefficient of any of the four fits experimented with for PM11 stars in the colour range 0.70 < (B−V) < 1.20. The corresponding data and the least-squares fit are shown in Figure 9.
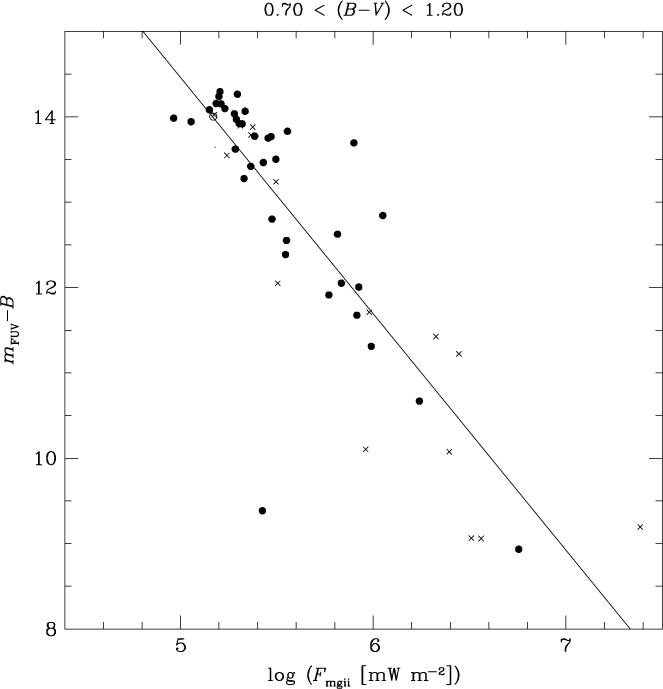
Figure 9. The FUV/blue colour (m FUV−B) versus Mg ii h + k surface flux log F mgii for giant stars from PM11 with a colour of 0.70 < (B−V) < 1.20. Crosses and open circles denote spectroscopic binary and LPV stars, respectively. The linear least-squares fit corresponding to Equation (6) from the text is shown as a solid line.
Within the colour range 1.25 < (B−V) ≤ 1.65 the situation is slightly different. In this case correlations between Mg ii flux (both surface and normalised flux) and Q(m FUV−B) are tighter than obtained when using (m FUV−B) directly. The strongest correlation has a Spearman coefficient of −0.74 and corresponds to the linear fit
 \begin{align} Q({m_{{\rm{FUV}}}} - B) = &- 17.21( \pm 2.94)\\\quad {\kern 1pt} &- 2.02( \pm 0.36)\log ({F_{{\rm{mgii}}}}/{F_{{\rm{bol}}}}).\end{align}
Both the data points and the fit given by Equation (7) are shown in Figure 10.
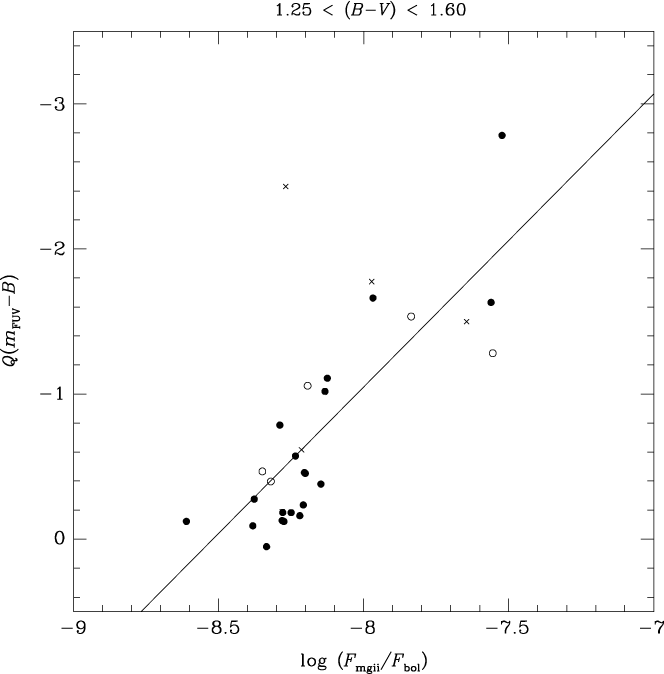
Figure 10. The FUV-excess parameter Q(m FUV−B) versus normalised Mg ii h + k flux, that is, log (F mgii/F bol), for PM11 giants with colour in the range 1.25 < (B−V) < 1.60. Crosses and open circles denote spectroscopic binary and LPV stars, respectively. The linear least-squares fit corresponding to Equation (7) from the text is shown as a solid line.
Differences in interstellar reddening could contribute to scatter in Figures 8–10. In addition, there is the possibility that chromospheric activity among red giants is intrinsically variable, either due to rotation or pulsation (e.g., Choi et al. Reference Choi, Soon, Donahue, Baliunas and Henry1995; Henry et al. Reference Henry, Fekel, Henry and Hall2000; Brown, Gray, & Baliunas Reference Brown, Gray and Baliunas2008).
In order to investigate whether there might be a systematic difference in FUV-excess among stars of different LCs, Figure 11 shows a plot of absolute magnitude MV versus the parameter Q(m FUV−B). Since this parameter was chosen to have two different upper-envelope fiducials according to the B−V colour, Figure 11 is divided into two panels based on whether the upper envelope is given by Equation (4) or (5). Among the coolest giants with (B−V) > 1.20 there is no systematic difference in FUV-excess exhibited by stars of LC III and those of brighter luminosities. Among the warmer giants with (B−V) < 1.2 those of LCs II–III or brighter have Q(m FUV−B) < −1.5, and as such exhibit greater FUV-excesses than many of the LC III stars. This can also be seen in Figure 6, although it is a result that is based on a small number of the highest-luminosity stars, and as such should be considered a tentative distinction.
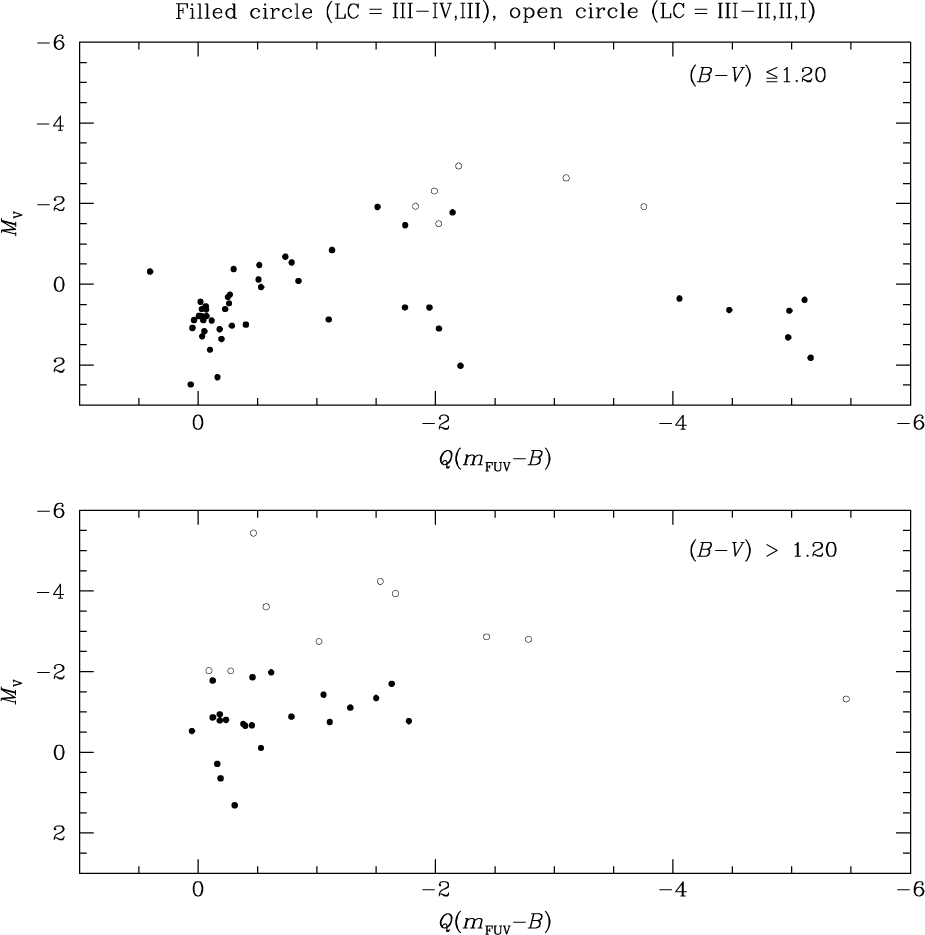
Figure 11. Absolute magnitude versus the FUV-excess parameter Q(m FUV−B) for the PM11 giant stars. The upper and lower panels correspond to the B−V colour ranges for which the upper reference envelope used in the Q(m FUV−B) parameter is given by Equations (4) and (5), respectively. LC III stars (or fainter) are shown as filled circles, while open circles depict brighter LCs (as given in the SIMBAD database).
5. Stellar rotation velocity and the Mg ii emission
Rotation–activity relations for giant stars have been presented in the literature by a number of authors. For example, Gondoin (Reference Gondoin2005, Reference Gondoin2007, Reference Gondoin, Petit, Jardine and Spruit2014) and de Medeiros & Mayor (Reference de Medeiros and Mayor1995) documented correlations between X-ray surface flux and either rotation period or projected rotation speed for G and K giants. Studies of the relationships between Ca II H and K emission and rotation period or projected rotation speed among evolved stars have been carried out by Middelkoop (Reference Middelkoop1982), Rutten (Reference Rutten1987), Young, Ajir, & Thurman (Reference Young, Ajir and Thurman1989), Strassmeier et al. (Reference Strassmeier, Handler, Paunzen and Rauth1994), and do Nascimento et al. (Reference do Nascimento, Canto Martins, Melo, Porto de Mello and De Medeiros2003). Strassmeier et al. (Reference Strassmeier, Weber, Granzer and Järvinen2012) found a correlation between Hα-core flux and rotation period for rapidly rotating active giants in binary systems. Projected rotational velocities ν sin i have been measured for many of the giants in the PM11 compendium, allowing addition of the PM11 sample to these preceding studies.
Attention to the source material for ν sin i rotational speeds is restricted herein to a small number of relatively extensive catalogues or observational programmes that have appeared since 2004. Glebocki & Gnacinski (Reference Glebocki and Gnacinski2005) compiled an extensive compendium of stellar rotation velocities, and values for many of the red giants in PM11 were gleaned from this source via the VizieR Information System (Ochsenbein, Bauer & Marcout Reference Ochsenbein, Bauer and Marcout2000), made available online by the CDS (Centre de Données Astronomiques de Strasbourg). Data from this source were supplemented with more recent results from the observational programmes of Torres et al. (Reference Torres, Quast, da Silva, de La Reza, Melo and Sterzik2006), Schroeder, Reiners, & Schmitt (Reference Schroeder, Reiners and Schmitt2009), Jones et al. (Reference Jones, Jenkins, Rojo and Melo2011), and particularly Massarotti et al. (Reference Massarotti, Latham, Stefanik and Frogel2008) and Jofré et al. (Reference Jofré, Petrucci, Saffe, Saker, de la Villarmois, Chavero, Gómez and Mauas2015). Where values of ν sin i were available from one or more of these programmes plus the Catalogue of Glebocki & Gnacinski (Reference Glebocki and Gnacinski2005) a straight unweighted average has been adopted. All ν sin i values used were based on measured detections and not upper limits. Of the giants in Table 1 for which values of ν sin i are listed there are 45 stars for which these values are based on measurements from two sources. The average range between the ν sin i measurements in these cases is 1.9 km s−1. Furthermore, there are 16 stars for which the tabulated values of ν sin i are based on three measurements from the literature. In these cases, the average range in measured velocities is 2.3 km s−1. Taken together, a standard deviation of 1.3–1.7 km s−1 seems indicated for the uncertainty in the rotation velocity measurements from the adopted literature sources.
Projected rotational speeds for the PM11 giants are shown in Figures 12 and 13 in which the surface flux log F mgii (mW m−2) and the normalised flux log (F mgii/F bol) are plotted, respectively, against ν sin i (in units of km s−1). Symbols are used to distinguish between giants of different colours, such that open circles denote 0.80 ≤ (B−V) ≤ 0.99, filled circles 1.00 ≤ (B−V) ≤ 1.19, and open triangles 1.20 ≤ (B−V) ≤ 1.39. There is a broad tendency for the highest Mg ii fluxes to be associated with giants having log (ν sin i) > 0.8, but for any value of projected speed less than this a substantial range in Mg ii flux is observed. Perhaps part of this scatter might be attributable to differences in the inclination angle i among the PM11 giants, and some to observational uncertainties in the ν sin i measurements. Intrinsic variability in chromospheric activity may also contribute. Another factor is that for the most slowly rotating giants of largest radii a substantial difference in rotation period (and hence any rotation-induced component of chromospheric activity) may translate to only a small, and difficult to detect, difference in ν sin i.
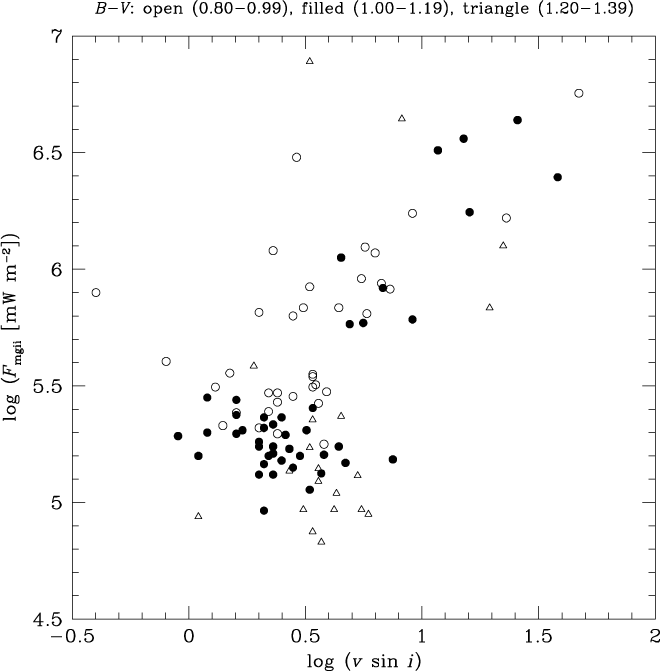
Figure 12. Surface Mg ii h + k flux log F mgii (mW m−2) versus projected rotation speed (km s−1) for giant stars from PM11 with colour in the range 0.80 ≤ (B−V) ≤ 1.39. Different symbols are used to denote different subintervals within this broader colour range: (open circles) 0.80 ≤ (B−V) ≤ 0.99; (filled circles) 1.00 ≤ (B−V) ≤ 1.19; (open triangles) 1.20 ≤ (B−V) ≤ 1.39.
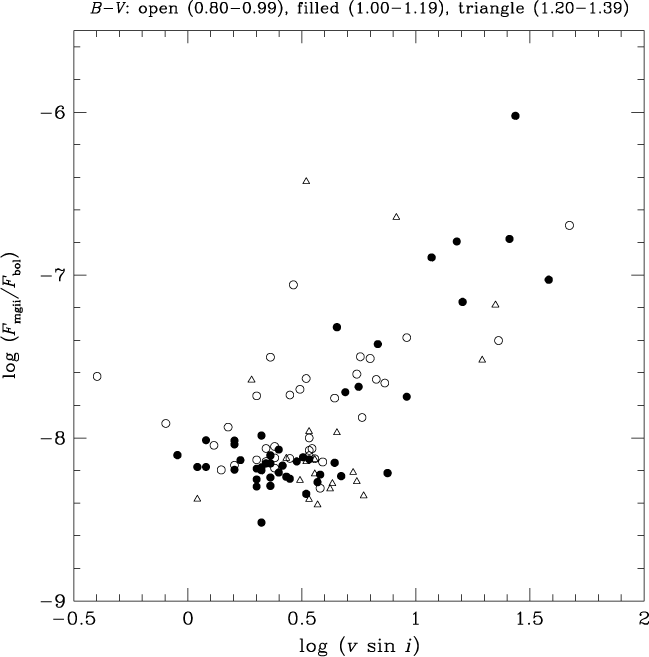
Figure 13. Normalised Mg ii h + k flux, that is, log (F mgii/F bol), versus projected rotation speed (km s−1) for giant stars from PM11 with 0.80 ≤ (B−V) ≤ 1.39. Symbols denote different colour subranges: (open circles) 0.80 ≤ (B−V) ≤ 0.99; (filled circles) 1.00 ≤ (B−V) ≤ 1.19; (open triangles) 1.20 ≤ (B−V) ≤ 1.39.
At the lowest Mg ii fluxes where log F mgii (mW m−2) < 5.6 some separation of giants according to (B−V) colour is apparent in Figure 12, such that as (B−V) becomes redder the lowest surface flux attained by giant stars decreases. This trend is in accord with the baseline indicated in the corresponding plot of surface Mg ii flux versus (B−V) in Figure 1. Within Figure 12 the reddest giants with (B−V) = 1.2 − 1.4 appear to follow a sequence that is offset from the warmest giants with (B−V) = 0.8 –1.0. The correlation between log F mgii and rotation speed appears to vary with the effective temperature of evolved giants. This is consistent with previous findings by Rutten (Reference Rutten1987) and Strassmeier et al. (Reference Strassmeier, Handler, Paunzen and Rauth1994), who found a colour dependence in the relation between Ca II H and K emission and both the rotation period and the projected rotation speed.
When the normalised flux ratio is considered in Figure 13, giants of different colours intermingle more than in Figure 12. In particular, the minimum flux ratio of log (F mgii/F bol) ≈ −8.2 ± 0.1 shows little variation with (B−V) colour. Nonetheless, there is still some offset between the average positions of the warmest and coolest giants at the lowest Mg ii flux levels.
A correlation is found between the projected rotation speed and FUV-excess for red giants with (B−V) < 1.20, as shown in the upper panel of Figure 14. There is scatter nonetheless, and the correlation is largely driven by those giants with an FUV-excess of more than 0.5 magnitudes. Among the coolest giants in the PM11 sample, as shown in the lower panel of Figure 14, there is little evidence of a rotation versus FUV-excess correlation, although the number of stars in the lower panel of Figure 14 with a Q-excess greater than 0.5 mag is relatively small.
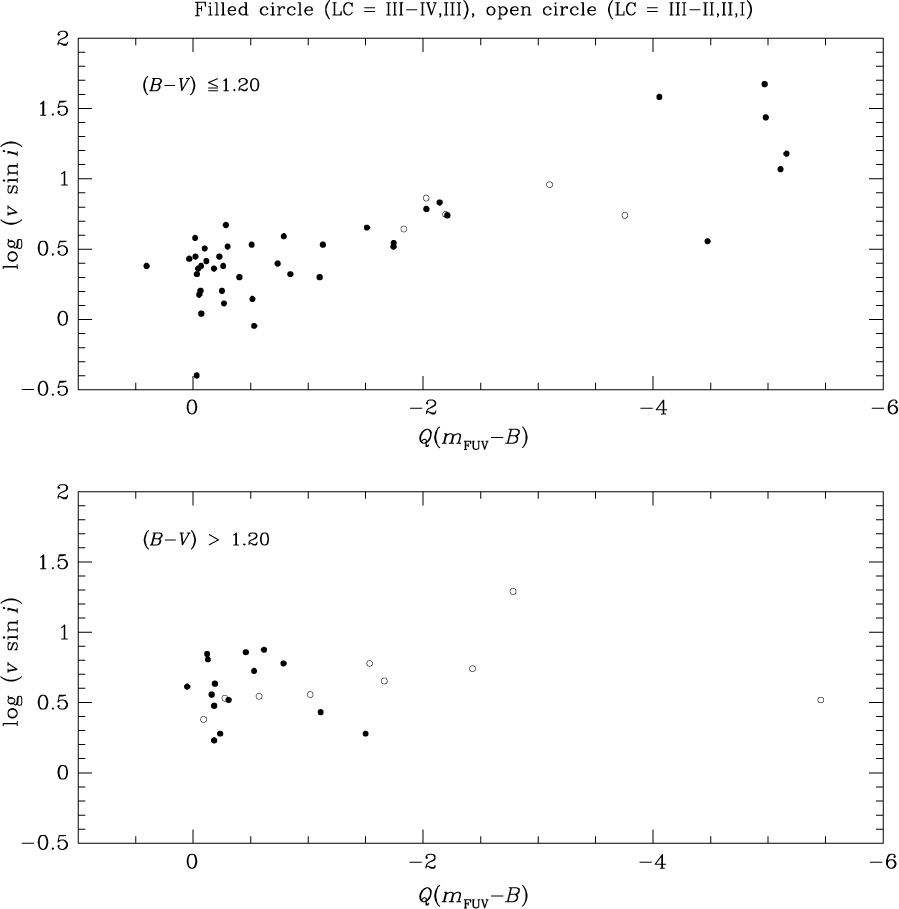
Figure 14. Projected rotation speed (km s−1) versus the FUV-excess parameter Q(m FUV−B) for the PM11 giant stars. Upper and lower panels correspond to the range in B−V for which the upper fiducial used in the Q(m FUV−B) parameter is given by Equations (4) and (5), respectively. LC III stars (or fainter) are shown as filled circles, while open circles depict brighter LCs (as given in the SIMBAD database).
6. Summary
As is the case with dwarf stars, (m FUV−B) is shown to correlate with the degree of chromospheric activity among late-type evolved stars having B−V colour within the range 0.8 ≤ (B−V) ≤ 1.2, and even among cooler giants. In the present paper the FUV-excess has been correlated against flux in the λ2800 Mg ii h + k emission lines for evolved stars with LCs typically ranging from III to II. By comparison, in the work of Smith & Redenbaugh (Reference Smith and Redenbaugh2010) and Findeisen et al. (Reference Findeisen, Hillenbrand and Soderblom2011) on dwarf stars, the FUV-excess was shown to correlate with flux in the Ca II H and K emission lines. Among giants of a comparable B−V a spread of up to ∼5 mag has been found in (m FUV−B), although the majority of giants in the PM11 sample fall within a range of 3 mag in the FUV-excess parameter Q(m FUV−B). This is comparable to the range seen among dwarfs within the colour interval 0.8 ≤ (B−V) ≤ 1.0 by Smith & Redenbaugh (Reference Smith and Redenbaugh2010).
Within the literature homogeneous measurements of chromospheric emission line strengths tend to be more numerous for dwarf stars than giants. This is particularly true of the Ca II H2 and K2 lines, where high-resolution spectroscopic searches for exoplanets via radial velocity techniques have greatly expanded measurements of Ca II emission among dwarf stars (e.g., da Silva et al. Reference da Silva, Santos, Bonfils, Delfosse, Forveille and Udry2011; Butler et al. Reference Butler2017). Given the correlations shown in the present paper, the possibility is suggested that GALEX FUV magnitudes could be applied to a systematic study of stellar activity among cool giant stars. Such a project could utilise broadband GALEX activity data for thousands of giants to complement spectroscopic studies of individual chromospheric lines, such as those of Simon & Drake (Reference Simon and Drake1989) and Pérez Martínez et al. (Reference Pérez Martínez, Schröder and Cuntz2011), that have comprised ∼200 or fewer giants.
Acknowledgements
The author gratefully acknowledges the support of award AST-1517791 from the National Science Foundation of the United States. This research has made use of the SIMBAD database, operated at CDS, Strasbourg, France. In addition, this research made use of the VizieR catalogue access tool, CDS, Strasbourg, France. The original description of the VizieR service was published by Ochsenbein et al. (Reference Ochsenbein, Bauer and Marcout2000). We thank the referee for a helpful report on the original version of this paper.


