


1. Introduction
Emotions are powerful drivers of political behavior (Marcus et al., Reference Marcus, Russell Neuman and MacKuen2000; Bakker et al., Reference Bakker, Schumacher and Rooduijn2021; Webster and Albertson, Reference Webster and Albertson2022; Gadarian and Brader, Reference Gadarian, Brader, Huddy, Sears, Levy and Jerit2023). Extensive studies have shown that various discrete emotions can have different implications for how voters behave. For example, anger can increase political participation (Valentino et al., Reference Valentino, Brader, Groenendyk, Gregorowicz and Hutchings2011, Reference Valentino, Wayne and Oceno2018; cf. Phillips and Plutzer, Reference Phillips and Plutzer2023), lower trust in government (Webster, Reference Webster2020), and encourage people to discard information inconsistent with their prior beliefs (Weeks, Reference Weeks2015; Suhay and Erisen, Reference Suhay and Erisen2018). Fear and anxiety can increase information seeking and make voters more open to persuasion (Brader, Reference Brader2005; Clifford and Jerit, Reference Clifford and Jerit2018), although this process may be biased (Albertson and Gadarian, Reference Albertson and Kushner Gadarian2015). Enthusiasm, in turn, can spur various forms of political involvement (Marcus and MacKuen, Reference Marcus and MacKuen1993; Heiss, Reference Heiss2021), while too much enthusiasm can pose a danger to democracy by making voters reluctant to listen to alternative viewpoints (Poe, Reference Poe2022; Gadarian and Brader, Reference Gadarian, Brader, Huddy, Sears, Levy and Jerit2023).Footnote 1
If emotions play such an important role in determining voter behavior, discovering how political forces—including salient political events, like elections—trigger more or less intense emotions becomes a critical task (Vasilopoulos et al., Reference Vasilopoulos, Marcus, Valentino and Foucault2019; Wayne, Reference Wayne2023). However, despite the emerging consensus that emotions matter in politics, there is little comparative research on how voters respond emotionally to political events beyond rare and dramatic incidents like terrorist attacks (Vasilopoulos et al., Reference Vasilopoulos, Marcus, Valentino and Foucault2019). Elections, in particular, loom large as a potential source of emotions, since they occur regularly and are the central focus of political activity in most democracies. As we discuss below, previous research has also documented a winner-loser gap in voter reactions to election outcomes (Anderson and Tverdova, Reference Anderson and Tverdova2001; Anderson and Mendes, Reference Anderson and Mendes2006), which some scholars have posited may be related to emotional responses to election victories or losses (cf. Pierce et al., Reference Pierce, Rogers and Snyder2016; Kinari et al., Reference Kinari, Ohtake, Kimball, Morimoto and Tsutsui2019). Yet, there is limited empirical evidence on how voters emotionally respond to election outcomes. Only a handful of case studies directly address this question, and there are virtually no cross-national studies because it is difficult to trace the dynamics of party supporters’ emotions during election periods (Gidron et al., Reference Gidron, Adams and Horne2020; Heiss, Reference Heiss2021).
In this article, we overcome this limitation by utilizing emotional “reactions” expressed on parties’ social media pages and examine cross-nationally how election results predict voter emotions. We then explore why some elections are associated with stronger emotional responses than others. We theorize that two factors may systematically moderate election-induced changes in emotions: populism and ideological polarization. Populism is an emotionally charged rhetorical feature of political discourse that contrasts the pure people with corrupt elites (Mudde, Reference Mudde2009; Inglehart and Norris, Reference Inglehart and Norris2016) and can trigger great emotional responses among message receivers (Wirz, Reference Wirz2018; Jost et al., Reference Jost, Maurer and Hassler2020; Marx, Reference Marx2020). Ideological polarization, by contrast, refers to the process in which elites from different parties become more ideologically distinct from one another (Druckman et al., Reference Druckman, Peterson and Slothuus2013). This can raise the stakes of winning elections and influence the extent to which voters dislike out-partisans (Ward and Tavits, Reference Ward and Tavits2019)—a phenomenon known as affective polarization (Iyengar et al., Reference Iyengar, Sood and Lelkes2012; Gidron et al., Reference Gidron, Adams and Horne2020). Although ample evidence suggests that both populism and polarization are tied to strong emotions, how these two factors condition voters’ emotional responses to election outcomes remains unresolved.
To test our argument, we adopt a comparative approach and explore voters’ emotional responses to 29 presidential elections in 26 countries. We employ a big-data analysis of emotional reactions on social media, which is increasingly used to measure aggregate emotional responses to political events (Eberl et al., Reference Eberl, Tolochko, Jost, Heidenreich and Boomgaarden2020; Muraoka et al., Reference Muraoka, Montgomery, Lucas and Tavits2021; Rathje et al., Reference Rathje, Van Bavel and van der Linden2021). Analyzing two reaction features—Love and Angry—on the Facebook pages of parties of the presidential candidates, we begin by empirically describing how positive and negative emotional responses to an election differ: while the proportion of Love reactions significantly changes after an election for both the winning and losing candidate, there is no significant change in the proportion of Angry reactions. However, when interacting elections with measures of populism and ideological polarization, we find much cleaner patterns. Specifically, high polarization is associated with strong and systematic changes in the proportions of Love and Angry reactions. In contrast, we find no clear evidence of an association between the presence of a populist party and post-election emotions.
This study makes several novel contributions. To begin, we offer the first large-scale cross-national test of whether and how supporters of winner and loser parties react emotionally to the results of presidential elections. Second, we contribute to the study of populism and polarization—arguably the two most prominent features of contemporary politics (Iyengar et al., Reference Iyengar, Sood and Lelkes2012; Inglehart and Norris, Reference Inglehart and Norris2016). While both phenomena are associated with strong emotions, our results show that in the context of presidential elections around the world, ideological polarization may be more consequential than populism in shaping voters’ emotional responses to election outcomes. Last, our study provides additional evidence that user reactions on social media can provide insight into aggregate public responses to key political events.
2. Post-election emotions, populism, and polarization
Elections can be emotionally charged events, especially for active supporters of winning and losing parties. One well-studied example of this phenomenon is the 2016 US presidential election. Several psychological and clinical studies reported major emotional changes among American voters after the election (Oc et al., Reference Burak, Moore and Bashshur2018) and suggested that Trump’s victory resulted in “post-election stress disorder” among those who voted for the Democratic party (McCarthy and Saks, Reference McCarthy and Saks2019), documenting upsurges in distress symptoms (e.g., anxiety, depression, etc.) (Hoyt et al., Reference Hoyt, Zeiders, Chaku, Toomey and Nair2018). These reactions are important as they may have downstream effects on attitudes toward politics and political institutions. For instance, the literature on the winner-loser gap in voter attitudes demonstrates how supporters of winning and losing parties display different attitudes and behaviors post-election, including institutional trust, satisfaction with democracy, and willingness to participate in politics (Anderson and Mendes, Reference Anderson and Mendes2006; Blais and Gélineau, Reference Blais and Gélineau2007; Esaiasson, Reference Esaiasson2011; Singh et al., Reference Singh, Karakoç and Blais2012).
Yet, the period after an election is not always emotionally charged. In fact, the 2016 US presidential election is often seen as exceptional in that regard (e.g., Sances, Reference Sances2019). Hence, many elections may engender a more muted emotional response. What then predicts the magnitude of emotional reactions to election results? Why is the post-election period more emotionally charged in some cases than others?
The literature suggests that two factors may be particularly important in moderating voters’ reactions to election outcomes. One is the involvement of a populist party or candidate, and the other is the ideological polarization of the competitors.Footnote 2 Arguably, a common theoretical ground that unifies these two factors is that both populism and polarization create a division between “us” and “them” and eventually influence how voters react to election outcomes. But they do this through different mechanisms: populism through the rhetorical portrait of the people vs. the elite while polarization through policy divide and affective partisan identity (Uscinski et al., Reference Uscinski, Enders, Seelig, Klofstad, Funchion, Everett, Wuchty, Premaratne and Murthi2021).
Starting with populism, one important characteristic of populist communication is that it rhetorically creates a division between the people and the elite and, by so doing, stirs up people’s emotions (Wirz, Reference Wirz2018; Jost et al., Reference Jost, Maurer and Hassler2020). In this way, it is inherently more emotional than mainstream party rhetoric (Nai, Reference Nai2021; Widmann, Reference Widmann2021) and may trigger intense emotional reactions among receivers. Indeed, several experimental studies (Wirz, Reference Wirz2018; Marx, Reference Marx2020) find that populist appeals demonstrating politicians’ engagement with the people can effectively elicit positive emotions, such as hope and pride. Conversely, populist appeals portraying the elite in a negative light may elicit negative emotions, like anger and fear. One notable study supporting this view is Jost et al. Reference Jost, Maurer and Hassler(2020), which analyzes the populist rhetoric of German political parties on Facebook and finds that posts referring to the ordinary people tend to receive a large number of Love reactions, while posts referencing the elite receive a large number of Angry reactions.
We expect that the division between the people and the elite that populists agitate during the election campaign prepares the ground for voters’ intense emotional reactions after elections. This can occur because political conflict that populists emphasize raises the stakes of winning and losing. Specifically, the supporters of populist parties may respond to the defeat of the ruling elite with great enthusiasm, while to the maintenance of the establishment with great anger. By contrast, the supporters of mainstream parties that populists attack may feel relieved with the failure of populists while emotionally threatened and disturbed by the success of populist opponents. Moreover, these emotional patterns would be further reinforced by different ways in which party elites react to early vote-counting results in elections with and without populist involvement. In short, our expectation is:
H1: Election outcomes are associated with greater emotional responses when at least one party adopts populist rhetoric.
Similarly, ideological polarization may also induce significant post-election emotional responses. Highly polarized elite environments make partisans more likely to believe that opposing parties represent various forms of threats. These are often conceived of as threats to the core of their social identities, something that jeopardizes the positive standing of their in-group (Mason, Reference Mason2015; Huddy et al., Reference Huddy, Bankert and Davies2018). However, they can also encompass more broad policy-based threats because large ideological differences between parties mean that they pursue vastly different policy agendas (Banda and Cluverius, Reference Banda and Cluverius2018; Ward and Tavits, Reference Ward and Tavits2019).
Succinctly, greater elite polarization may be associated with a more intense emotional response to information that threatens voters’ partisan identities and issue stances. Since winning or losing an election provides the most direct signal of status loss and the identity/policy threats posed by out-parties (Ward and Tavits, Reference Ward and Tavits2019), it is reasonable to expect that elections under highly polarized environments are more likely to induce greater emotional reactions than those without. To the extent that party elites should also perceive the same threats, the rhetoric they employ immediately following polarized elections would further magnify party supporters’ emotional reactions. In sum, our second expectation is:
H2: Election outcomes are associated with greater emotional responses when the ideological polarization of competing parties is high relative to when it is low.
3. Research design
In order to provide a systematic comparison between elections in multiple contexts, we pool data across a large set of presidential races around the world.Footnote 3 This allows us to leverage variation in the involvement of populist parties as well as the ideological polarization of competing parties. To assess emotional reactions to elections in these disparate contexts, we adopt a big-data approach and analyze more than 15 million reactions to 6,000+ Facebook posts of political parties before and after elections. This allows us to trace the emotional changes of party supporters over the course of presidential elections and their aftermaths, which is difficult to accomplish using other approaches. For example, the most widely used measure of voters’ feelings toward parties—thermometer scales from survey research—only gives a snapshot of voter emotions at the level of country-year (Gidron et al., Reference Gidron, Adams and Horne2020). Likewise, the costs of running original surveys often limit researchers to conduct only a two-wave survey on emotions in pre- and post-election periods in a small number of countries (Heiss, Reference Heiss2021).
3.1. Facebook reactions and emotions
We rely on the Comparative Party Social Media Dataset (Muraoka et al., Reference Muraoka, Montgomery, Lucas and Tavits2021), which provides post-level data on the public Facebook pages of parties and electoral coalitions in 79 democracies, collected through Facebook’s CrowdTangle API (CrowdTangle Team, 2020). Since Facebook’s reaction feature was introduced at the end of February 2016, we analyze all presidential elections that happened between March 2016 and January 2021. We limit our analysis to the Facebook pages of the winning party and the most competitive losing party (the party that received the second highest share of the vote). This is because winning or losing is often not a direct stake for the rest of the parties/candidates in presidential elections,Footnote 4 and there is reason to believe that supporters of these parties may react differently to election outcomes (Rosenstone et al., Reference Rosenstone, Behr and Lazarus1996).
We initially collected data on all of the direct presidential elections that happened between March 2016 and January 2021. However, our final dataset is restricted to 52 parties in 29 presidential races across 26 countries, including two races in the US and three elections in Bosnia and Herzegovina (for the Bosniak, Croat, and Serb presidents). This reduction occurred because (1) some presidential candidates were independent, (2) some parties did not have a Facebook account, or (3) some parties’ ideology or populist scores are not available in the Global Party Survey (GPS) (Norris, Reference Norris2019).Footnote 5
Facebook currently includes seven reactions (Like, Love, Angry, Haha, Wow, Sad, and Care), and in this study we are interested in two of them: Love and Angry. Next to Like, these are the most widely used reactions, conveying a clear emotional undertone about Facebook users’ responses to specific contents (Muraoka et al., Reference Muraoka, Montgomery, Lucas and Tavits2021).Footnote 6 Our outcomes are the relative shares of Love and Angry reactions over the sum of all reactions to the post.Footnote 7 We rescale these variables to range from 0 to 100.Footnote 8
In order to measure users’ emotional reactions to a party’s Facebook posts, we utilize the proportions of Love and Angry, which convey users’ reactions to the text and the underlying electoral dynamics at work.Footnote 9 First, as several studies have shown (Eberl et al., Reference Eberl, Tolochko, Jost, Heidenreich and Boomgaarden2020; Muraoka et al., Reference Muraoka, Montgomery, Lucas and Tavits2021; Rathje et al., Reference Rathje, Van Bavel and van der Linden2021), the intensity of Love and Angry reactions is partly correlated with the messages and sentiment of the post, such as attacking the opponent and claiming electoral fraud. Furthermore, the two reactions capture both users’ sentiment toward the content of a post and their sentiment toward a party at that time. For instance, simple announcements of campaign rallies and posts without explicit sentiments can sometimes garner significant proportions of emotional reactions, some of which may be interpreted as displays of enthusiasm and emotional support for the party.Footnote 10 Even when party posts contain positive emotional appeals, users can leave Angry reactions to express their anger against the posting party at a certain moment. In these instances, emotions expressed on the post could diverge from emotional reactions that parties intend to induce through their rhetoric. Overall, using the proportions of Love and Angry may capture part of the broader emotional status of supporters in the election’s aftermath.
To validate our measurement strategy, we ran an original survey with a sample of 2,014 American adults recruited via Respondi.Footnote 11 The survey reminded subjects of the 2016 presidential election outcome and asked them to report their emotions with the Positive Negative Affect Schedule - Short Form (PANAS-SF) (Watson et al., Reference Watson, Anna Clark and Tellegen1988; Thompson, Reference Thompson2007), a widely used and well-validated measure of emotions (Crawford and Henry, Reference Crawford and Henry2004). The scale lists five positive emotions and five negative emotions and asks respondents to rate how strongly they feel each emotion on a 1–5 scale, one being the weakest. The ratings are summed and used to create separate scores for positive and negative emotions, each ranging from a minimum of 5 to a maximum of 25. After reporting their emotions, the subjects were asked to choose one of seven Facebook reactions (Like, Love, Care, Haha, Wow, Sad, Angry) that best describes their feelings.
Figure 1 displays the mean PANAS scores for positive and negative emotions, separated by the subject’s choice of reaction. It is clear that Love and Angry stand out as indicators of positive and negative emotions, respectively. On average, subjects who chose Love report feeling more positive (µ = 21.03) than those who chose different reactions. On the other hand, subjects who chose Angry report feeling more negative (µ = 16.74) than others. Furthermore, the average difference between positive and negative emotions is largest for people who chose Love and Angry, meaning that among the seven reactions, Love and Angry are the least ambiguous indicators of strong emotional reactions.Footnote 12
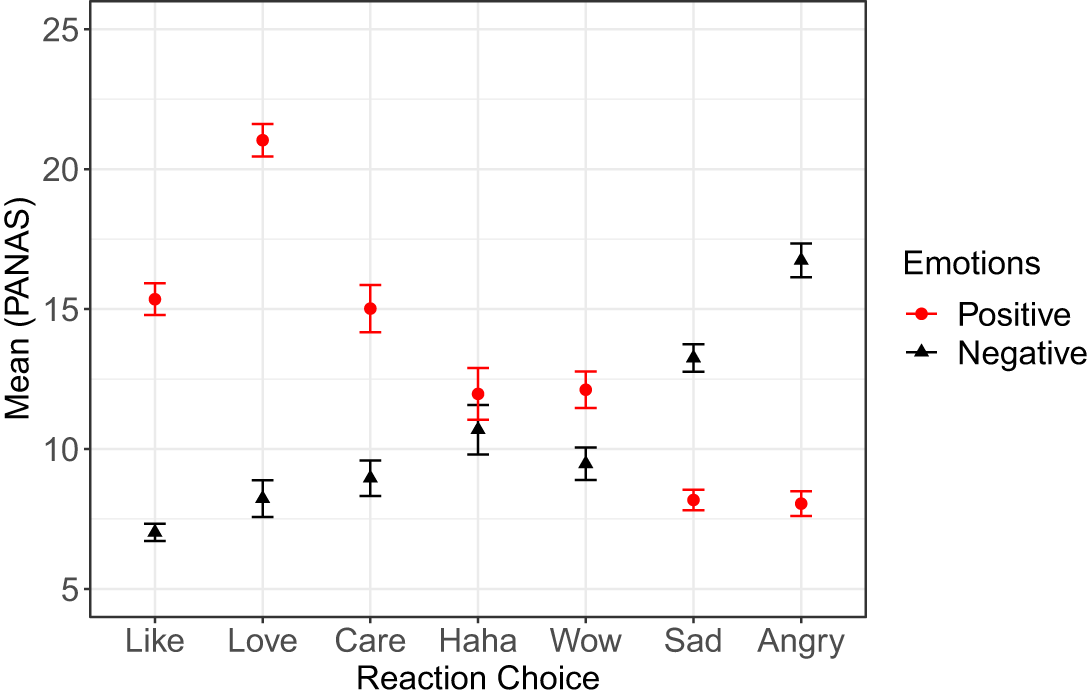
Figure 1. The association between positive and negative emotions and subsequent reaction choices.
To further demonstrate the validity of this approach, we trace the emotional shifts of American voters around the 2016 election on the Facebook pages of the two parties. In Figure 2, the x-axis indicates ±100 days of the election, and the y-axis is the relative share of the Love or Angry reactions over all other reactions on the Facebook post. Solid lines show overtime changes in the proportions of the Love and Angry reactions estimated with separate Loess regressions for the pre- and post-election periods.
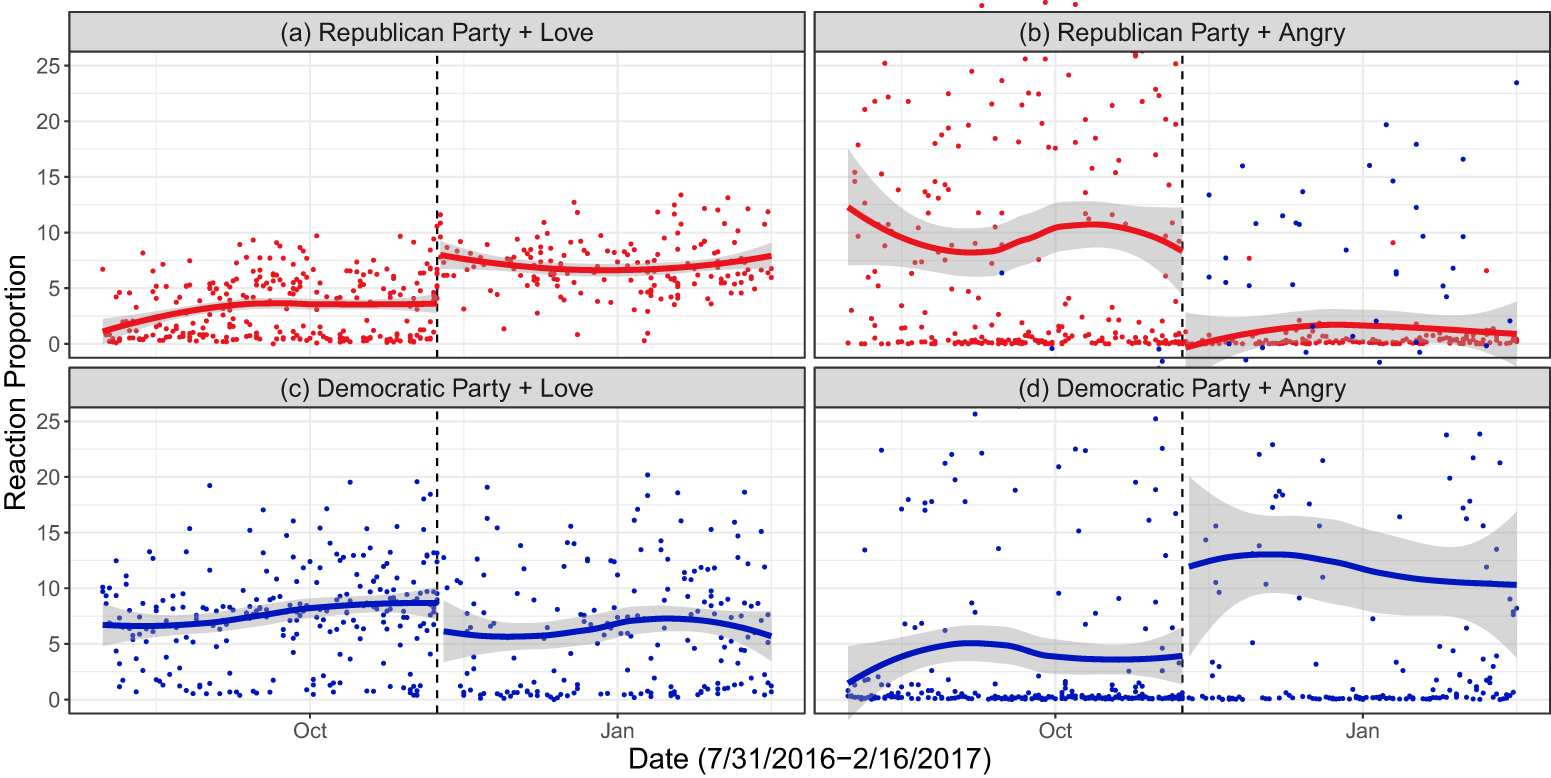
Figure 2. Emotional reactions on the Facebook pages of the Republican Party and the Democratic Party around the 2016 US presidential election.
Figure 2 reveals a clear contrast in how emotional reactions on the two parties’ Facebook pages evolved during the election. The top two panels show that there was a significant increase (decrease) in the proportion of the Love (Angry) reactions on the Republican Party’s Facebook page right after the election. By contrast, the bottom panels show that the opposite was the case for the Democratic Party’s page. In particular, there was a decrease in the proportion of the Love reactions, which was accompanied by an acute increase in the proportion of the Angry reactions.
Extending this to our full dataset, Figure 3 compares overtime changes in the proportions of Love and Angry reactions on the Facebook pages of winner and loser parties 15 days before and after the election.Footnote 13 Black lines show the daily averages of Love and Angry proportions pooled across all winner parties, while gray lines indicate those among loser parties. We see that emotional reactions on winners’ and losers’ Facebook pages are more different (but perhaps not dramatically so) from one another in the post-election period than in the pre-election period. Indeed, in line with what we observed in the 2016 US presidential election in Figure 2, there are contrasting patterns in how elections shape emotional responses to winners and losers. The left panel shows that there is an increase (decrease) in the proportion of Love among winner (loser) parties immediately after the election. By contrast, the right panel shows that the proportion of Angry on losers’ pages tends to deviate from that of winners’ pages after the election. Overall, both figures give face validity to the empirical approach we employ.Footnote 14
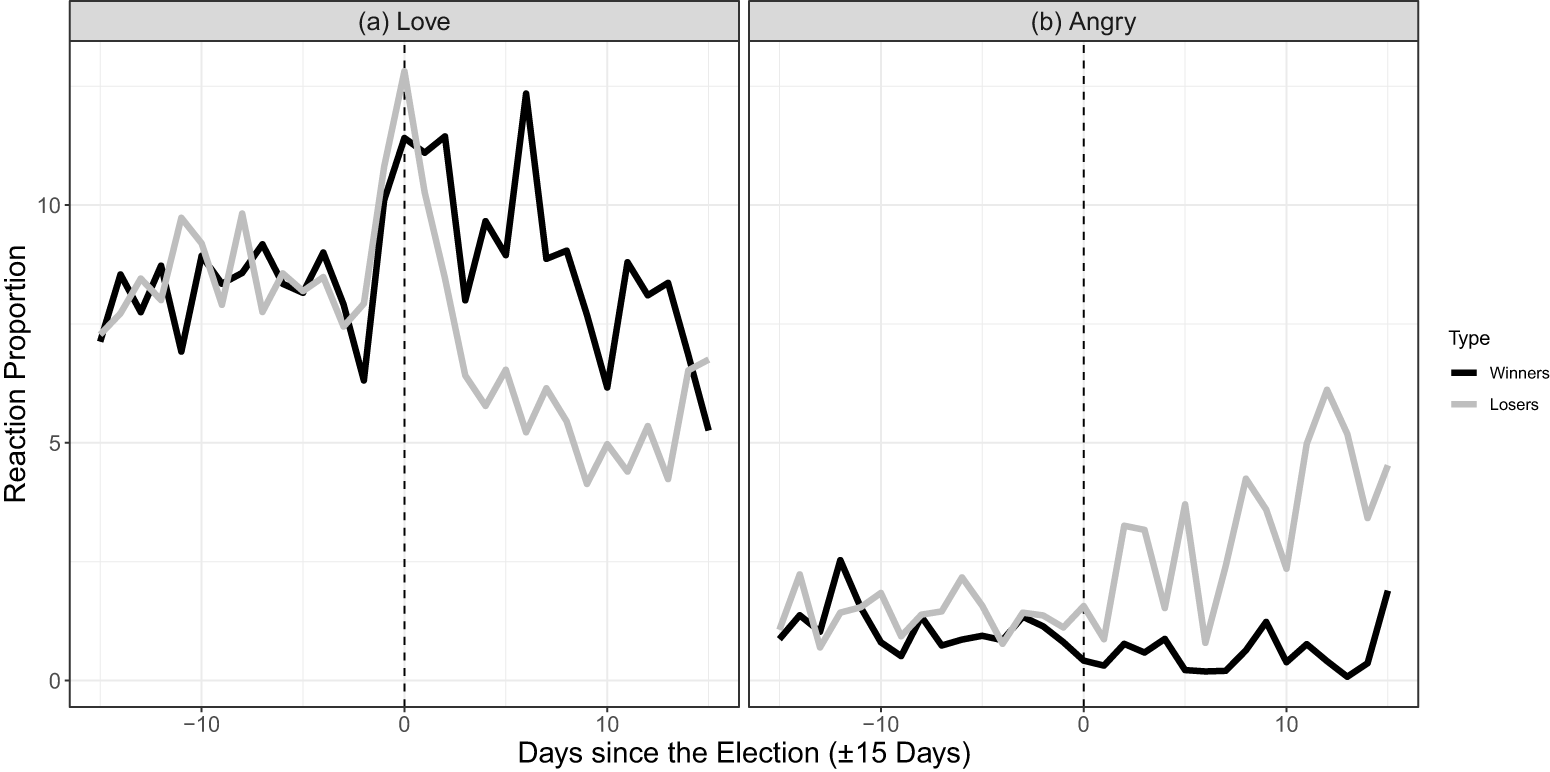
Figure 3. The daily averages of emotional reactions on parties’ Facebook pages 15 days before and after the presidential election.
3.2. Populism and polarization
We hypothesized that the within-winner and within-loser variations in post-election emotional reactions can be explained by two factors: whether a populist party is involved in the presidential race or not and the ideological polarization of two competing parties. To measure the former, we rely on the GPS (Norris, Reference Norris2019), which is an expert survey that covers 1,034 political parties in 163 countries and defines populist rhetoric as “a form of discourse or rhetoric making two core claims, namely that: (i) the only legitimate democratic authority flows directly from the people, and (ii) establishment elites are corrupt, out of touch, and self-serving, betraying the public trust and thwarting the popular will.” We treat the party as populist if it scores at least 7.5 on a 0–10 continuous scale of populist discourse (Norris, Reference Norris2019).Footnote 15 We create an election-level measure of  $Populist \ Involvement$, which takes the value of 1 if either of the two parties is populist and 0 otherwise. Of the 52 parties in our data, 29 parties are coded as populist. At the election level, 21 out of the 29 races involved at least one populist party.
To measure the ideological polarization of two competing parties, we rely on two ideological measures in the GPS. One is the economic positions of parties, which take values between 0 (Extreme Left/Pro-State) and 10 (Extreme Right/Pro-Market), and the other is the parties’ social/cultural positions, which range from 0 (Liberal) to 10 (Conservative). We calculate the Euclidean distance between the two parties on these two ideological dimensions and use it as the measure of ideological polarization. The empirical range of this variable is between 0.75 and 10.45 with a mean of 5.54. Presidential elections with the highest degrees of ideological polarization include Brazil 2018 (10.45), Costa Rica 2018 (8.32), and Uruguay 2019 (8.02), whereas elections with the lowest level of polarization include Paraguay 2018 (0.75), Bosnia and Herzegovina (Serb) 2018 (0.80), and the Philippines 2016 (0.96) (see Appendix H).Footnote 16
3.3. Modeling emotional change
First, we explore the (unconditional) difference in emotional reactions before and after an election by estimating the following regression:
 \begin{align}
y_{ip} = \alpha_{p} + \beta E_{ip} + \gamma_{p} T_{E = 0,ip} + \delta_{p} T_{E = 1,ip} + \eta \textbf{X}'_{ip} + \epsilon_{ip}
\end{align}
\begin{align}
y_{ip} = \alpha_{p} + \beta E_{ip} + \gamma_{p} T_{E = 0,ip} + \delta_{p} T_{E = 1,ip} + \eta \textbf{X}'_{ip} + \epsilon_{ip}
\end{align} where yip is the proportion of Love or Angry on party p’s post i, E is a dummy variable indicating the pre-election (coded 0) or post-election period (coded 1), and  $T_{E = 0}$ and $T_{E = 1}$ denote the day elapsed since the election. In the main analysis, we focus on 15 days before and after the election, hence the range of $T_{E = 0}$ is between −15 and 0, whereas the range of $T_{E = 1}$ is between 1 and 15.Footnote 17 Since parties’ Facebook pages have different baselines and time trends for emotional reactions, we estimate random intercepts (αp) and pre- and post-linear time trends (γp and δp) by party.
Our quantity of interest is the estimate of β, which captures the extent to which emotional reactions on Facebook posts “jump” on the day after the election, independent of election/party differences and pre-/post-election linear trends. Our theoretical argument above anticipates that these jumps will be jointly explained by changes in supporters’ reactions to the election and to any significant shift in the content of the posts themselves. We are not treating elections as exogenous events because voters know when an election would take place and can adjust their emotions accordingly. Furthermore, the content of the posts by parties is also endogenous to election outcomes, which in turn could affect how people respond to them. Consequently, we cannot assume that elections trigger truly exogenous shocks to voters’ emotions, unlike other unforeseeable events, such as natural disasters and terrorist attacks. For instance, if voters’ anticipation of election outcomes lessens the intensity of their emotional reactions post-election, our estimates would be biased downward and more conservative. Overall, the estimates of β reported in this paper do not necessarily capture the causal effects of elections but should be interpreted as descriptive evidence consistent with our theoretical predictions.
Equation (1) includes several party- and election-level controls, denoted by X. First, we include a dummy for the party of the incumbent president as the supporters of incumbent and challenger parties may have different reactions during elections. Second, we control for whether the presidential election occurred concurrently with the parliamentary election. Emotional reactions may vary depending on whether or not the presidential seat is the only position at stake. We also include a dummy indicator for whether the race was a runoff, which may change various aspects of election competitions, including the length of the race and the positions of competing candidates. Then, we add a dummy for semi-presidential systems as an important distinction made in the presidentialism literature (Tavits, Reference Tavits2008).Footnote 18 Finally, we control for the effective number of candidates to account for the possibility that elections with two clear front-runners are different from other elections in which three or more candidates gain substantive vote shares.Footnote 19
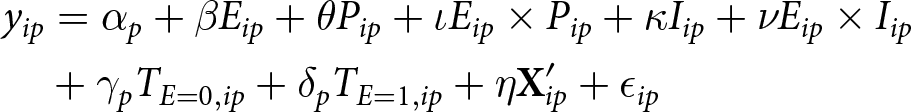
After establishing the unconditional differences, we move to testing how populist involvement and ideological polarization condition post-election changes in emotional responses (H1 and H2). To do so, we add to the original model the variables for populist involvement and ideological polarization as well as their respective interaction terms with post-election:
 \begin{align*}
\begin{split}
y_{ip} & = \alpha_{p} + \beta E_{ip} + \theta P_{ip} + \iota E_{ip} \times P_{ip} + \kappa I_{ip} + \nu E_{ip} \times I_{ip} \\
&+ \gamma_{p} T_{E = 0,ip} + \delta_{p} T_{E = 1,ip} + \eta \textbf{X}'_{ip} + \epsilon_{ip}
\end{split}
\end{align*}
\begin{align*}
\begin{split}
y_{ip} & = \alpha_{p} + \beta E_{ip} + \theta P_{ip} + \iota E_{ip} \times P_{ip} + \kappa I_{ip} + \nu E_{ip} \times I_{ip} \\
&+ \gamma_{p} T_{E = 0,ip} + \delta_{p} T_{E = 1,ip} + \eta \textbf{X}'_{ip} + \epsilon_{ip}
\end{split}
\end{align*}where P is a dummy indicator of whether either of the top two parties is a populist, and I indicates the ideological distance between the two parties. The direction and statistical significance of the interaction terms (ι and ν) tell us whether and how the two factors moderate the relationship between election outcomes and voter emotions.
We estimate separate models for winner and loser parties within a Bayesian inferential framework. We implement the estimation process in Stan (Bürkner, Reference Bürkner2017), using three chains and setting relatively uninformative priors on all parameters.Footnote 20 Summaries of the posterior distribution are based on 2,000 iterations from each chain after discarding the first 1,000 as burn-in. Gelman–Rubin  $\widehat{R}$ statistics indicate that the models achieve apparent convergence.
4. Results
Do reactions change after elections? In Figure 4, models 1 and 2 focus on the proportions of Love and Angry on winner parties’ Facebook pages, whereas models 3 and 4 analyze the same reactions on losers’ pages (full specifications are in Appendix M, Table M.1). According to model 1 (top row), the posterior estimate of  $Post \ Election$ is 1.58 and statistically reliable with a 95% credible interval of [0.80, 2.38]. This means that Love reactions on winner parties’ Facebook posts tend to increase by 1.58 percentage points immediately after the election. Given that the average pre-election proportion of Love among winners is 8.52, this difference corresponds to a 19% increase in positive emotions from the pre-election baseline.Footnote 21 By contrast, in model 2 (second row), we see that the posterior mean of $Post \ Election$ is −0.39 with a 95% credible interval of [−0.90, 0.13]. This means that winners’ Facebook pages tend to experience a 0.39 percentage point decrease in the proportion of Angry reactions following the election, although the credible interval includes zero.
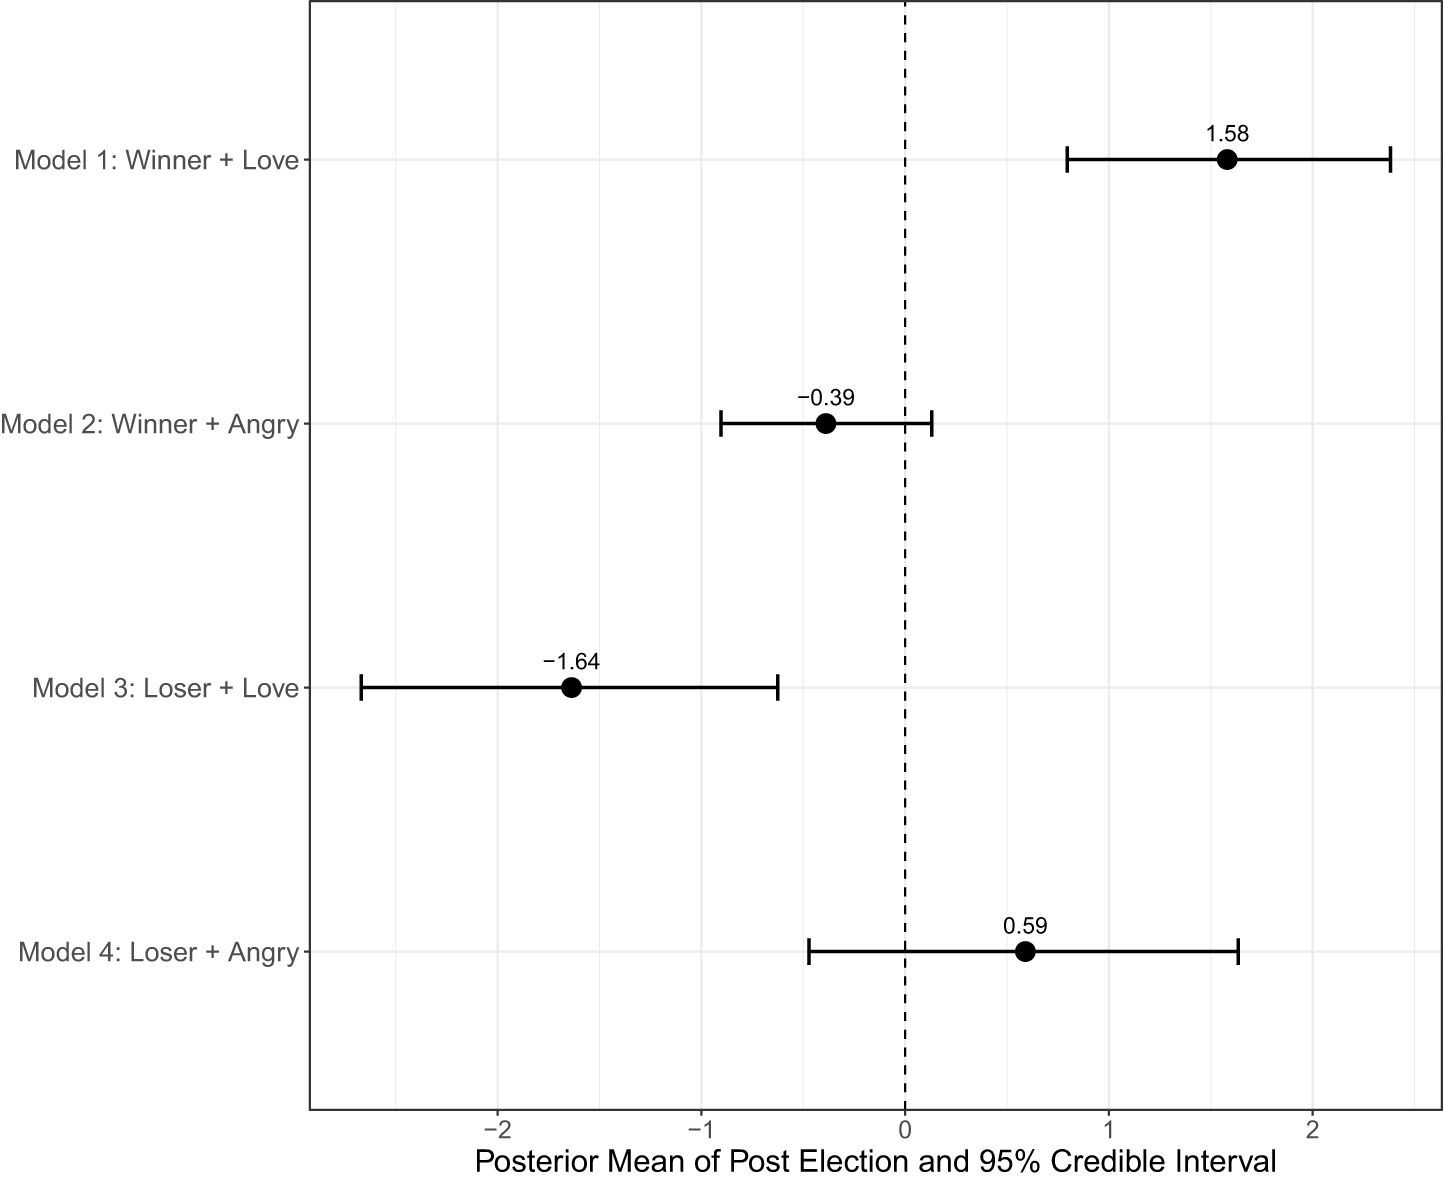
Figure 4. Post-election emotional changes on the Facebook pages of election winners and losers.
Turning to the analysis of loser parties, model 3 (third row) shows that the posterior estimate of  $Post \ Election$ is negative and statistically reliable with a 95% credible interval of [−2.67, −0.63]. The estimated posterior mean is −1.64, meaning that Love reactions on losers’ posts tend to decrease by 1.64 percentage points right after the election. Then, in model 4 (fourth row), we find that the posterior estimate of $Post \ Election$ is not statistically reliable with a 95% credible interval of [−0.47, 1.64], although the posterior mean points to the expected positive sign. In terms of effect size, post-election shifts in emotional reactions are similar in magnitude between winners and losers, both for Love and Angry reactions.
Overall, the results of Figure 4 provide mixed pictures about the average change in voter emotion before and after an election. On the one hand, we observe clear shifts in positive emotions between the pre- and post-election periods among both the supporters of winning and losing parties. On the other hand, we fail to find statistically reliable changes in negative emotions, although the estimated change in Angry reactions points to the correct directions. These findings imply that only looking at the average change in reactions before and after an election glosses over important heterogeneity in how voters respond to different types of elections. We, therefore, turn to investigating the potential conditional effects.
Do populism and polarization condition the differences in voter emotions before and after an election? We present the results of the full interaction models in Appendix M, Table M.2. For easier interpretation, we here summarize the posterior estimates of the two interaction terms in Figure 5. In panel (a), we find that the posterior means of  $Post \ Election \times Populist \ Involvement$ are not statistically reliable across all the models. This implies that the involvement of a populist party is unlikely to have a systematic influence on how voters respond to election outcomes, for both winning and losing parties, offering no support for H1.Footnote 22
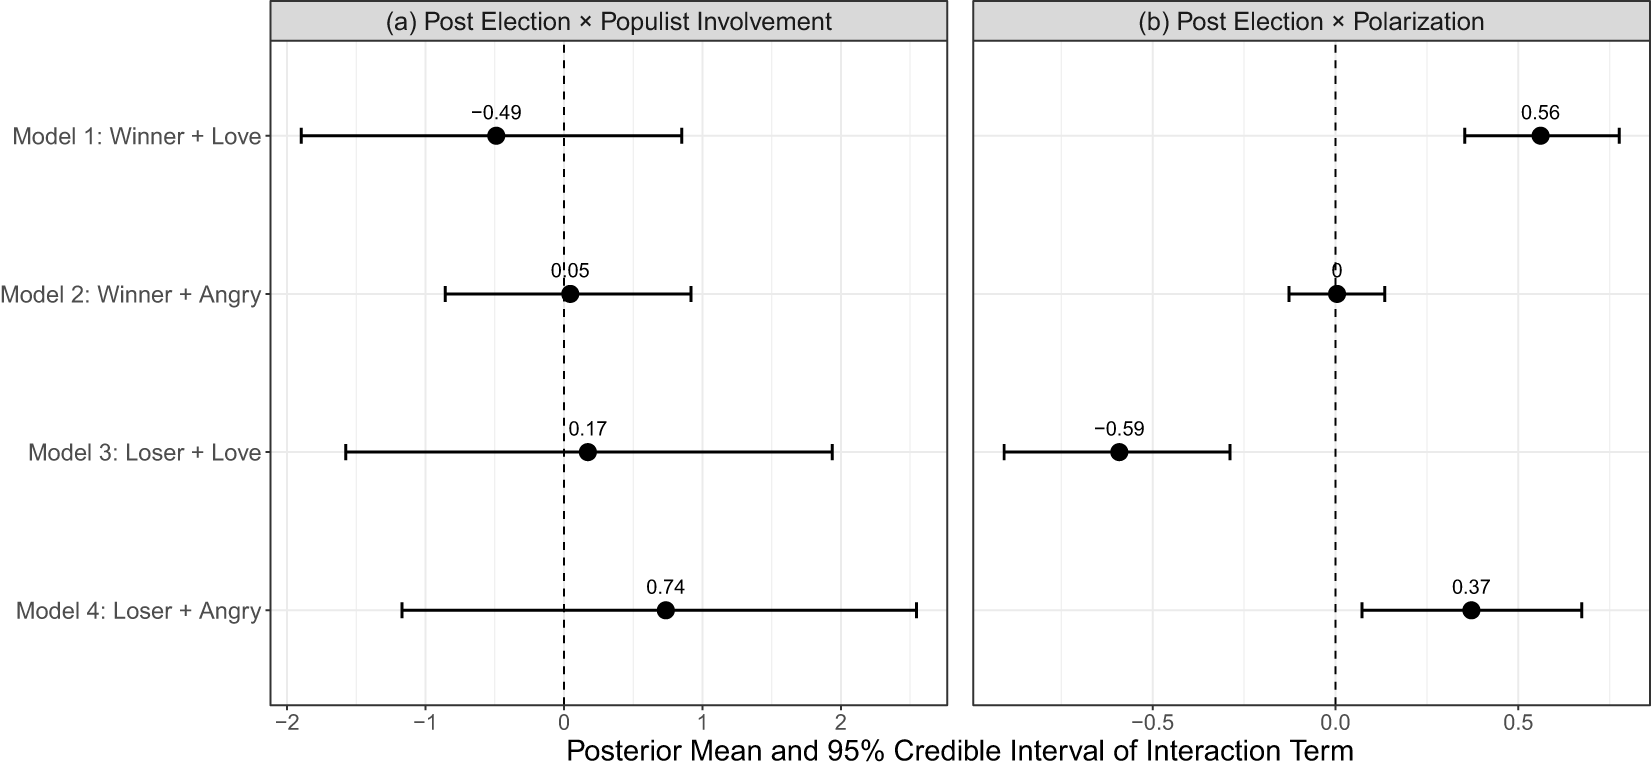
Figure 5. The posterior estimates of post election × populist involvement and post election × polarization.
Turning to panel (b) of Figure 5, we summarize the posterior estimates of  $Post \ Election \times Polarization$. The directions of these estimates are largely consistent with our expectations in H2, and three of these estimates are statistically reliable. Specifically, according to the first and third rows, greater ideological polarization is associated with a greater increase (decrease) in the proportion of Love (Angry) on winner (loser) parties’ Facebook pages after the election. Further, the last row shows that a greater ideological polarization is correlated with a greater increase in Angry reactions among the supporters of losing parties right after the election. In short, ideological polarization seems to systematically condition the ways in which voters respond to election outcomes, which lends empirical support for H2.Footnote 23
Crucially, ideological polarization does not only show more systematic moderating effects than populist involvement but also its substantive effect size is much greater than that of populism. Indeed, according to the three models that return statistically reliable interaction effects between Post Election and Polarization, one standard deviation increase in ideological polarization (around 2.6–2.8) is sufficient to trigger much greater shifts in post-election emotions than switching from an election without a populist party to an election with one.
To take a closer look at the moderating roles of ideological polarization, Figure 6 plots the marginal effectsFootnote 24 of  $Post \ Election$ on emotional reactions conditional on ideological polarization.Footnote 25 First, panel (a) shows that the marginal effect of elections on the proportion of Love among winner parties is not statistically discernible from 0 when the ideological polarization of the competing parties is 0. Only when polarization becomes greater than 3 do the supporters of winning parties react to election results with increases in Love reactions in a statically discernible manner. Next, panel (b) shows that the marginal effect of elections on Angry reactions on winners’ Facebook pages is not statistically reliable for the entire range of polarization.
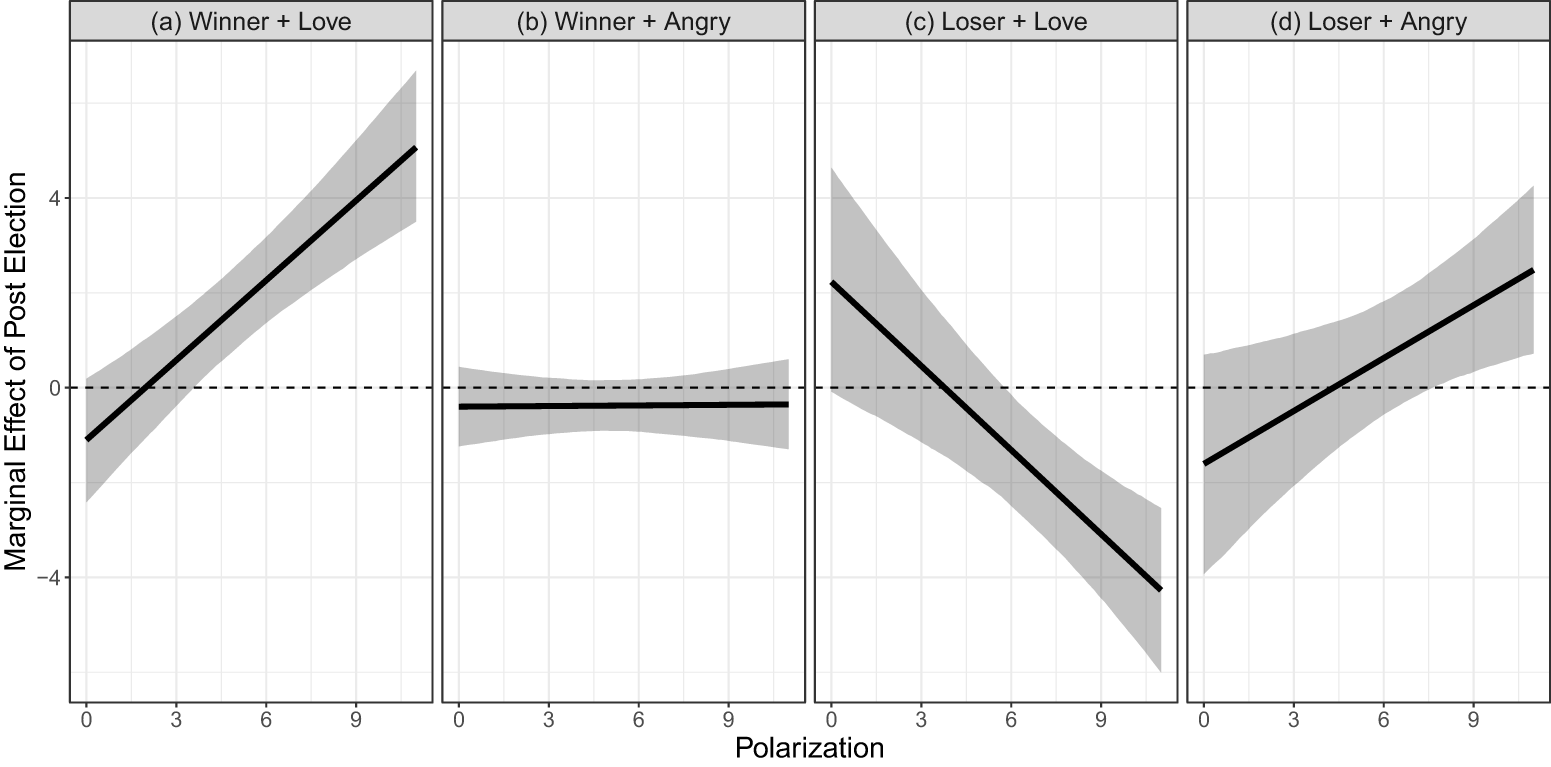
Figure 6. The marginal effects of post-election conditional on polarization.
In panel (c) of Figure 6, we see that when ideological polarization is low, elections are not discernibly related to the proportion of Love reactions on losers’ Facebook pages. But as ideological polarization increases, the marginal effect of elections becomes negative and statistically reliable, and its effect size grows in magnitude. Finally, panel (d) shows that when polarization is low, elections do not seem to have any statistically reliable effect on the ways in which the supporters of losing parties respond to election outcomes with Angry reactions. It is only when ideological polarization is greater than around 8 that election outcomes have a substantive effect on the Angry reactions on loser parties’ posts.
Note that comparing the four panels of Figure 6, the moderating effects of polarization tend to be stronger for Love than for Angry. One might argue that this result makes post-election emotions less concerning, because wide-spread negative emotions are generally believed to have more serious consequences on political climate and democratic stability than positive emotions. However, this might not be the case. In fact, as prior work on enthusiasm suggests (Poe, Reference Poe2022), great differences in the positive emotions between the winners and losers can make it more difficult for everyone to listen to the other side and consider alternative perspectives. This would result in further intensifying the already polarized political environment, making the operation of government more difficult, and eventually lowering people’s satisfaction with democracy.Footnote 26
5. Conclusion
This study explores voters’ emotional reactions to election outcomes in a comparative context. We first demonstrate that election outcomes are associated with predictable changes in positive emotions (Love) expressed on the Facebook pages of both winning and losing parties. By contrast, there is more limited evidence on post-election changes in negative emotions (Angry) even though they still point to expected directions. Interestingly, we observe that the magnitude of post-election emotional shifts is similar between winners and losers. We further find that ideological polarization systematically explains variation in emotional reactions among the supporters of winners and losers, while populism fails to do the same reliably. The conditional effects of polarization are much greater for the positive emotions than the negative ones.
The theoretical contributions of this study are straightforward. Our findings suggest that while both populism and ideological polarization facilitate political conflict between “us” and “them,” in the cross-national context, the latter is more strongly associated with strong emotional reactions to election results. This may occur because polarization leads to great policy differences and identity threats, while populism only rhetorically emphasizes the division between the people and the elite. As a result, polarization may magnify the perceived consequences of elections (Ward and Tavits, Reference Ward and Tavits2019), and therefore emotional responses, more than populism.
This illuminates an important limit of how far populism can influence voters’ emotions and political attitudes. While studies show that populist messages can change people’s emotions (Wirz, Reference Wirz2018; Marx, Reference Marx2020), what our results suggest is that populist rhetoric itself may not be sufficient to determine voters’ reactions to the broader electoral dynamics, including winning and losing. By extension, this implies that populism may not have clear downstream impacts on voters’ institutional trust and satisfaction with democracy after elections.Footnote 27 If so, one can be more optimistic about the concern that the involvement of populists in elections deteriorates the quality of democracy. By contrast, our results for ideological polarization corroborate prior studies that warn about the negative consequences of polarization on various democratic attitudes (McCarty et al., Reference McCarty, Poole and Rosenthal2006; Ezrow and Xezonakis, Reference Ezrow and Xezonakis2011).
Our study comes with some empirical limitations. First, although we model emotional changes on the next day of the election, election results might not have been called by that day, at least in some cases. Second, since individuals can add reactions to posts anytime after they are posted, it could be the case that some people leave their reactions on pre-election posts after they learn election outcomes. To the extent this kind of behavior occurs, pre-election emotional reactions may be contaminated by election results. These two problems are most likely to lead to the underestimation of post-election changes in emotional reactions. Also, it is important to reiterate that our measures capture part of the broader emotional status and cannot fully identify the substantive direction of the emotional reactions (e.g., whether they are directed to the content of the posts or the posting party.)
Next, some studies point out that the demographic profiles of Facebook users are different from those of the average voter (Moretto et al., Reference Moretto, Ortellado, Kessler, Vommaro, Carlos Rodriguez-Raga, Pablo Luna, Heinen, Fernanda Cely and Toro2022). Although we lack direct evidence to suggest that the same problem applies to party supporters, we acknowledge the possibility that those who leave reactions on parties’ Facebook pages may be different from typical party supporters. This means that there could be a trade-off between our ability to trace party supporters’ emotions over the course of the election and the extent to which their emotions are representative of all party supporters.
Moreover, the meta-data associated with Facebook posts do not allow us to make definitive statements about mechanisms. For example, we do not test how much of our findings are explained by voters’ direct responses to election results or by changes in elite rhetoric on social media, which indirectly influence party supporters’ reactions (Nai and Maier, Reference Nai and Maier2024; Silva et al., Reference Silva, Schürmann and Proksch2024).Footnote 28 That said, we attempt to address this concern by performing the preliminary analysis of post sentiments during the 2016 and 2020 US presidential elections in Appendix R. We find rather weak correlations between post sentiments and voters’ reactions and interpret this to mean that changes in elite discourse before and after the election alone cannot explain our empirical findings.
The results of this study also open up various avenues for future research. First, strictly speaking, the conclusions we draw from this study only extend to presidential and semi-presidential democracies. Although this already amounts to a considerable contribution given the vibrant interest in electoral politics of presidential systems among comparativists (Mainwaring and Shugart, Reference Mainwaring and Soberg Shugart1997; Tavits, Reference Tavits2008; Samuels and Shugart, Reference Samuels and Shugart2010), future studies should extend the analysis to legislative elections and parliamentary democracies.Footnote 29 A key challenge here is to come up with ways to measure winners and losers in parliamentary elections. Second, future research should help substantiate the causal nature of the empirical patterns we find using experimental evidence from multiple contexts. Finally, one important question that we did not address in this study is the role of elite discourse in shaping voter emotions after elections. It is possible that elites respond differently to election results depending on the degrees of ideological polarization, which in turn shapes voters’ reactions in the aftermath of elections. This argument is reasonable because various studies show that elites strategically tailor their messages to mobilize certain emotions among voters (Jung, Reference Jung2020; Stapleton and Dawkins, Reference Stapleton and Dawkins2022), although our analysis in Appendix R indicates that if there is a strong reaction, it is not easily measurable. Fortunately, social media data already provide rich information that allows us to examine how elites respond to election outcomes and how it mediates voter reactions. The challenge we face is how to analyze unstructured texts on social media that are written in more than a dozen languages.
In sum, this study advances the understanding of the origins of emotional responses to politics by presenting the first comprehensive cross-national analysis of how supporters of winning and losing parties respond to presidential election outcomes. These results also speak to the moderating role of populism and polarization, suggesting that, in the context of presidential elections worldwide, ideological polarization has a more significant impact on voters’ emotional reactions than populism. Finally, this research provides additional evidence that social media user reactions can offer insights into public sentiment and collective responses to major political events, opening new avenues of future research in multiple domains.
Supplementary material
The supplementary material for this article can be found at https://doi.org/10.1017/psrm.2025.22. To obtain replication material for this article, https://doi.org/10.7910/DVN/BWXDLT.
Acknowledgements
We thank Jim Adams, Randy Stevenson, and Nina Wiesehomeier for their helpful comments. Previous versions of this paper were presented at the 2021 APSA and 2022 MPSA meetings. Funding for this project was provided by the National Science Foundation (2215008), the Carnegie Corporation of New York (G-23-60440), and the Weidenbaum Center on the Economy, Government, and Public Policy.


 Open access