


Introduction
Smooth scouringrush is the only Equisetum species endemic to North America (Hauke Reference Hauke1960). The aerial stems of smooth scouringrush die back in fall and reemerge in spring. All Equisetum species, also known as horsetails, are herbaceous perennials with an extensive underground rhizome system that provides plants the ability to survive environmental disturbances such as plowing, burial, fire, and drought (Husby Reference Husby2013). Equisetum species are commonly found growing in wetlands, ditches, moist woods, and along roadsides with sufficient soil water availability. With the widespread adoption of no-till in the Pacific Northwest (PNW) (Huggins and Reganold Reference Huggins and Reganold2008), smooth scouringrush has invaded crop production fields across the region.
Bernards et al. (Reference Bernards, Sandell and Frasure2010) evaluated 24 herbicide active ingredients for their efficacy against scouringrush (Equisetum hyemale L.). Chlorsulfuron and dichlobenil were the only two that provided commercially acceptable control of scouringrush. Of these two, only chlorsulfuron is labeled for use in wheat production systems. Kerbs et al. (Reference Kerbs, Hulting and Lyon2019) found chlorsulfuron + MCPA-ester to be a commercially acceptable treatment for smooth and intermediate (Equisetum × ferrissii Clute) scouringrush control in a cropping system of fallow and winter wheat (Triticum aestivum L.) in the PNW.
Unfortunately, chlorsulfuron has a half-life in soil that ranges from 88.5 d at pH 6.2 to 144 d at pH 8.1 at 20 C (Thirunarayanan et al. Reference Thirunarayanan, Zimdahl and Smika1985). This relatively long half-life limits crop rotation flexibility. Unlike chlorsulfuron, glyphosate is rapidly inactivated in soil by adsorption to clay particles and organic matter (Sprankle et al. Reference Sprankle, Meggitt and Penner1975). Glyphosate’s systemic activity provides excellent control of many perennial weeds (Baylis Reference Baylis2000). However, glyphosate has been reported to provide limited control of Equisetum species (Bernards et al. Reference Bernards, Sandell and Frasure2010; Coupland and Peabody Reference Coupland and Peabody1981; Kerbs et al. Reference Kerbs, Hulting and Lyon2019) at rates up to 2.1 kg ae ha−1. Kerbs et al. (Reference Kerbs, Hulting and Lyon2019) did not achieve commercially acceptable control of smooth scouringrush with glyphosate, glyphosate + saflufenacil, or glyphosate + glufosinate when using a maximum glyphosate rate of 1.26 kg ha−1.
Lyon and Thorne (Reference Lyon and Thorne2022) found that high rates of glyphosate (3.78 kg ae ha−1) applied alone or with an organosilicone surfactant provided effective control of smooth scouringrush 1 yr after application compared with a nontreated check. The addition of an organosilicone surfactant improved glyphosate efficacy 1 and 2 yr after treatment compared to glyphosate applied alone. Savic et al. (Reference Savic, Thorne and Lyon2023) suggested that stomatal flooding was a likely mechanism for enhanced glyphosate efficacy with the addition of an organosilicone surfactant.
We and other researchers wondered whether there were any benefits to mixing glyphosate with chlorsulfuron + metsulfuron (chlorsulfuron alone is not labeled for use in fallow); for example, is short- or long-term efficacy increased with the tank-mix relative to either herbicide applied alone, or can the glyphosate rate be reduced when tank mixing with chlorsulfuron + metsulfuron? Therefore, the objectives of this field study were 1) to evaluate the efficacy of glyphosate alone or in combination with chlorsulfuron + metsulfuron on smooth scouringrush plant densities; and 2) determine whether increasing glyphosate rates improves the efficacy of these treatments.
Materials and Methods
Field trials were initiated near Dayton and Steptoe, Washington, on July 6, 2020, and near Reardan, Washington, on July 9, 2021 (Table 1). Soil texture at each location was a silt loam with pH values ranging from 4.9 at Reardan to 5.8 at Steptoe (Table 2). Both Reardan and Dayton trial locations were on north- or northwest-facing slopes and did not have any visible water drainage issues. The Steptoe trial location was on a flat alluvial fan as part of a drainageway from nearby hilly terrain and was occasionally flooded in late winter and early spring.
Table 1. Timeline of field operations at three experimental locations from 2020 through 2024, including initial smooth scouringrush densities at each site. a
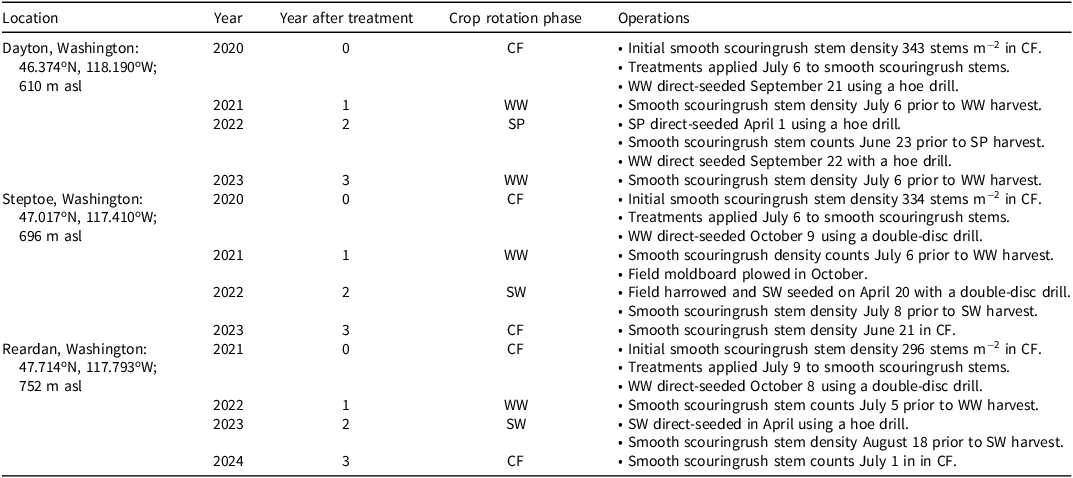
a Abbreviations: asl, above sea level; CF, chemical fallow; SP, spring dry pea; SW, spring wheat; WW, winter wheat.

The fields at each location were managed using multiyear, flex-rotation systems that included a year of chemical fallow. Winter wheat was the primary crop at each location with spring wheat, spring dry pea (Pisum sativum L.), or canola (Brassica napus L.) added to the rotations as each grower determined appropriate. Both the Dayton and Reardan fields were farmed completely no-till, while the Steptoe field was moldboard-plowed following winter wheat to manage crop residue and then fertilized with a shank-type applicator prior to seeding subsequent crops. The cooperating growers at each location indicated they had applied glyphosate at rates between 866 and 945 g ha−1 in March or April to control winter annual weeds and volunteer wheat prior to planting spring crops or for chemical fallow weed control; however, the glyphosate was applied before smooth scouringrush stems emerged, which generally occurred in mid- to late May, and would not have had any effect on smooth scouringrush density in the spring crops or the chemical fallow. Furthermore, herbicides applied for in-crop weed control were also applied prior to smooth scouringrush emergence (grower conversations) and would not likely have had any effect on smooth scouringrush density in the crop.
The experimental design at each location was a randomized, complete block with four replications per treatment. Plots measured 3.0 m by 9.1 m. Herbicides were applied during a chemical fallow year to smooth scouringrush stems that appeared green and healthy with a CO2-pressurized backpack sprayer and a 3.0-m hand-held, six-nozzle spray boom with 51-cm nozzle spacing at 1.3 m s−1 groundspeed. The spray volume applied was 140 L ha−1 at all locations. At the Dayton and Steptoe locations, XR11002 nozzles (TeeJet Technologies, Glendale Heights, IL) were used at 172 kPa pressure. At Reardan, TeeJet AIXR110015 nozzles were used to obtain better drift control with an application pressure of 276 kPa.
The treatment protocol included glyphosate (RT 3®; Bayer AG, Leverkusen, Germany) applied at 0, 1,260, 2,520, and 3,780 g ha−1 with and without chlorsulfuron + metsulfuron (Finesse® Cereal and Fallow Herbicide; FMC Corporation, Philadelphia, PA) at 26.3 g ha−1 (21.9 g ai ha−1 chlorsulfuron + 4.4 g ai ha−1 metsulfuron), and a nontreated check. All treatments included an organosilicone surfactant (Silwet L-77®; Helena Chemical Co., Collierville, TN) at 5 mL L−1. Stem densities were counted in each plot in two 1-m2 quadrats per plot at the time treatments were applied to measure initial infestation, and each year after treatment for 3 yr to assess long-term control. Stems were counted in late June or early July when stems had fully emerged but prior to crop harvest.
Statistical Analysis
Data were analyzed using general linear mixed models (the GLIMMIX procedure) with SAS/STAT software (v.9.4; SAS Institute Inc., Cary, NC). Fixed effects were year after treatment (YAT), herbicide (HERB), glyphosate rate (RATE), and location (LOC), whereas the dependent effects were stem density counts. The HERB effect coincided with the a priori question of whether the addition of glyphosate to chlorsulfuron + metsulfuron would enhance long-term control and consisted of two factors: treatments with glyphosate only at rates 0, 1,260, 2,520, and 3,780; or treatments that contained chlorsulfuron + metsulfuron. The LOC effect was considered a fixed effect because of the interest in responses from the different geographic conditions. Random effects were REP*LOC. Stem density counts were square-root transformed and analyzed using the GLIMMIX procedure as normal distributions using the LaPlace method for maximum-likelihood estimation, and back-transformed for presentation. Comparisons between least squares means were determined using pair-wise comparisons with the GLIMMIX procedure (P ≤ 0.05).
The overall full model analysis of YAT*HERB*RATE*LOC was significant (P ≤ 0.001) with random statements of Random Intercept/Subject = REP(LOC) and Random YAT/Subject = REP(HERB*RATE) Type=CS (Davis Reference Davis2023). Within the overall full model analysis, the three-way effect of HERB*RATE*LOC was the next significant factor (P ≤ 0.001). The data were then analyzed with the three-way model of HERB*RATE*LOC for each YAT, separately, with Random Intercept/Subject=REP(LOC) as the random effect. This did not produce significant interactions at 1 YAT (P = 0.466) or 2 YAT (P = 0.097) but was significant for 3 YAT (P ≤ 0.001). Although the three-way interaction for 1 YAT and 2 YAT was not significant, HERB and RATE data were analyzed separately by LOC for each YAT because of the magnitude of stem density counts between Steptoe and the other two locations, and because the initial interest included how these two factors would affect stem density over time. Therefore, stem density counts were analyzed by HERB and RATE for each LOC and YAT with Random Intercept/Subject=REP as the random effect. Stem density counts were also compared between HERB factors for each RATE factor in single pairwise comparison (α = 0.05). Figures were prepared using SigmaPlot software (v. 15; Grafiti LLC, Palo Alto, CA).
Results and Discussion
Dayton
At 1 YAT at the Dayton location, no smooth scouringrush stem emerged after any treatment containing chlorsulfuron + metsulfuron (Figure 1A). For treatments containing only glyphosate, smooth scouringrush stem density was reduced at all rates compared with the nontreated check. Stem densities were lowest at the two highest glyphosate rates (2,520 and 3,780 g ha−1). At each rate of glyphosate, stem density was greatly reduced when chlorsulfuron + metsulfuron was included in the tank mix.
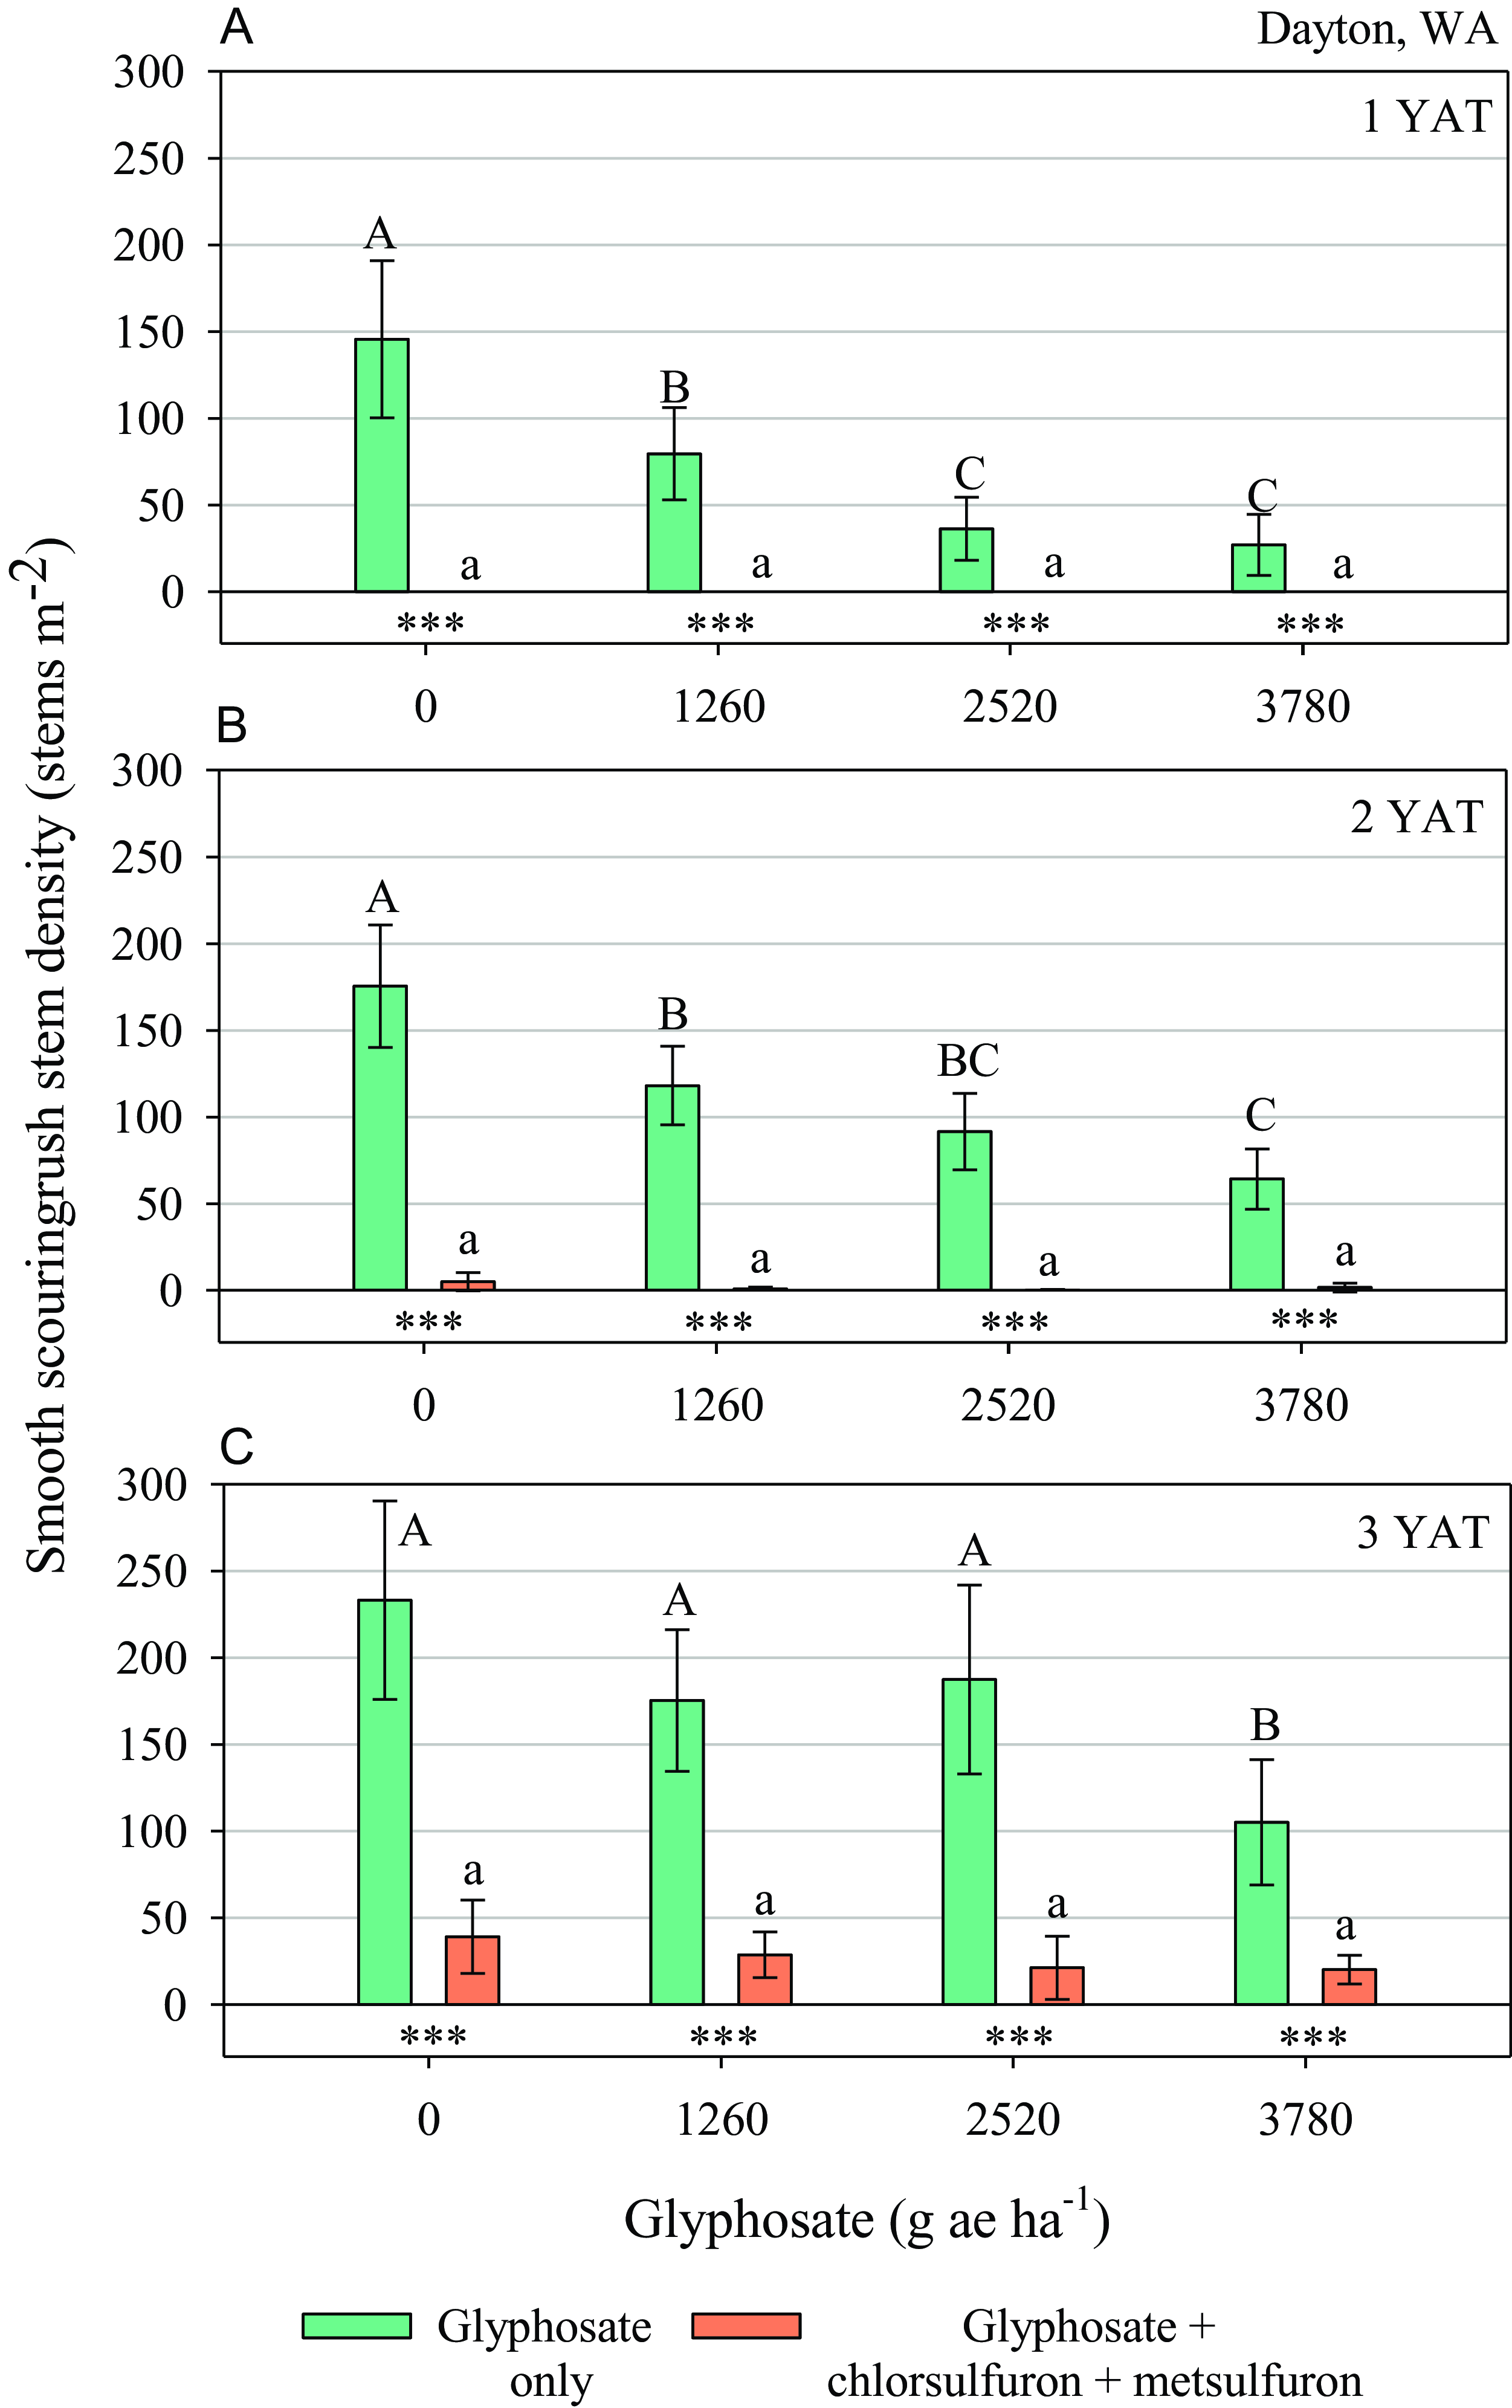
Figure 1. Smooth scouringrush stem density at the Dayton, Washington, location following application of glyphosate at 0, 1,260, 2,520, and 3,280 g ae ha−1 alone (green bars), and tank-mixed with chlorsulfuron + metsulfuron at 21.9 + 4.4 ga ai ha−1 (orange bars) each year after treatment (YAT) for 3 yr (A, B, and C). Bars on each graph represent least squares means (LSMEANS) of stem density counts per square meter. Bars with the same letter in each herbicide group (glyphosate alone or chlorsulfuron + metsulfuron) are not different (α = 0.05). Differences between bars paired at each glyphosate rate comparing glyphosate only with the same glyphosate rate plus chlorsulfuron + metsulfuron are shown with asterisks below the bars as follows: ***P ≤ 0.001, **P ≤ 0.01, *P ≤ 0.05, ns=P > 0.05. Differences between treatments were determined using pair-wise comparisons of LSMEANS with the GLIMMIX procedure with SAS software. Error bars associated with each bar are standard deviations calculated with the GLIMMIX procedure.
At 2 YAT, fewer than 5 stems m−2 were observed after any treatment that contained chlorsulfuron + metsulfuron (Figure 1B). Smooth scouringrush stem density was reduced at all rates of glyphosate when it was used alone compared with the nontreated check. Stem densities were lowest in plots that received the two highest glyphosate rates. There was no difference in stem density between the 1,260 and 2,520 g ha−1 rates. At each rate of glyphosate, stem density was greatly reduced when chlorsulfuron + metsulfuron was included in the tank mix.
As in the previous 2 yr, in the third YAT, smooth scouringrush stem density was lower at each rate of glyphosate when chlorsulfuron + metsulfuron was added to the tank mix (Figure 1C). Fewer than 40 stems m−2 were observed after any treatment that contained chlorsulfuron + metsulfuron. Compared with the nontreated check, stem density was reduced only when the highest rate of glyphosate was applied alone.
Reardan
At 1 YAT, only one (or less) smooth scouringrush stem emerged per square meter after any treatment that contained chlorsulfuron + metsulfuron (Figure 2A). Smooth scouringrush stem density was lowest when glyphosate was applied alone at the two highest rates (2,520 and 3,780 g ha−1). At each rate, stem density was greatly reduced when chlorsulfuron + metsulfuron was included in the tank mix.
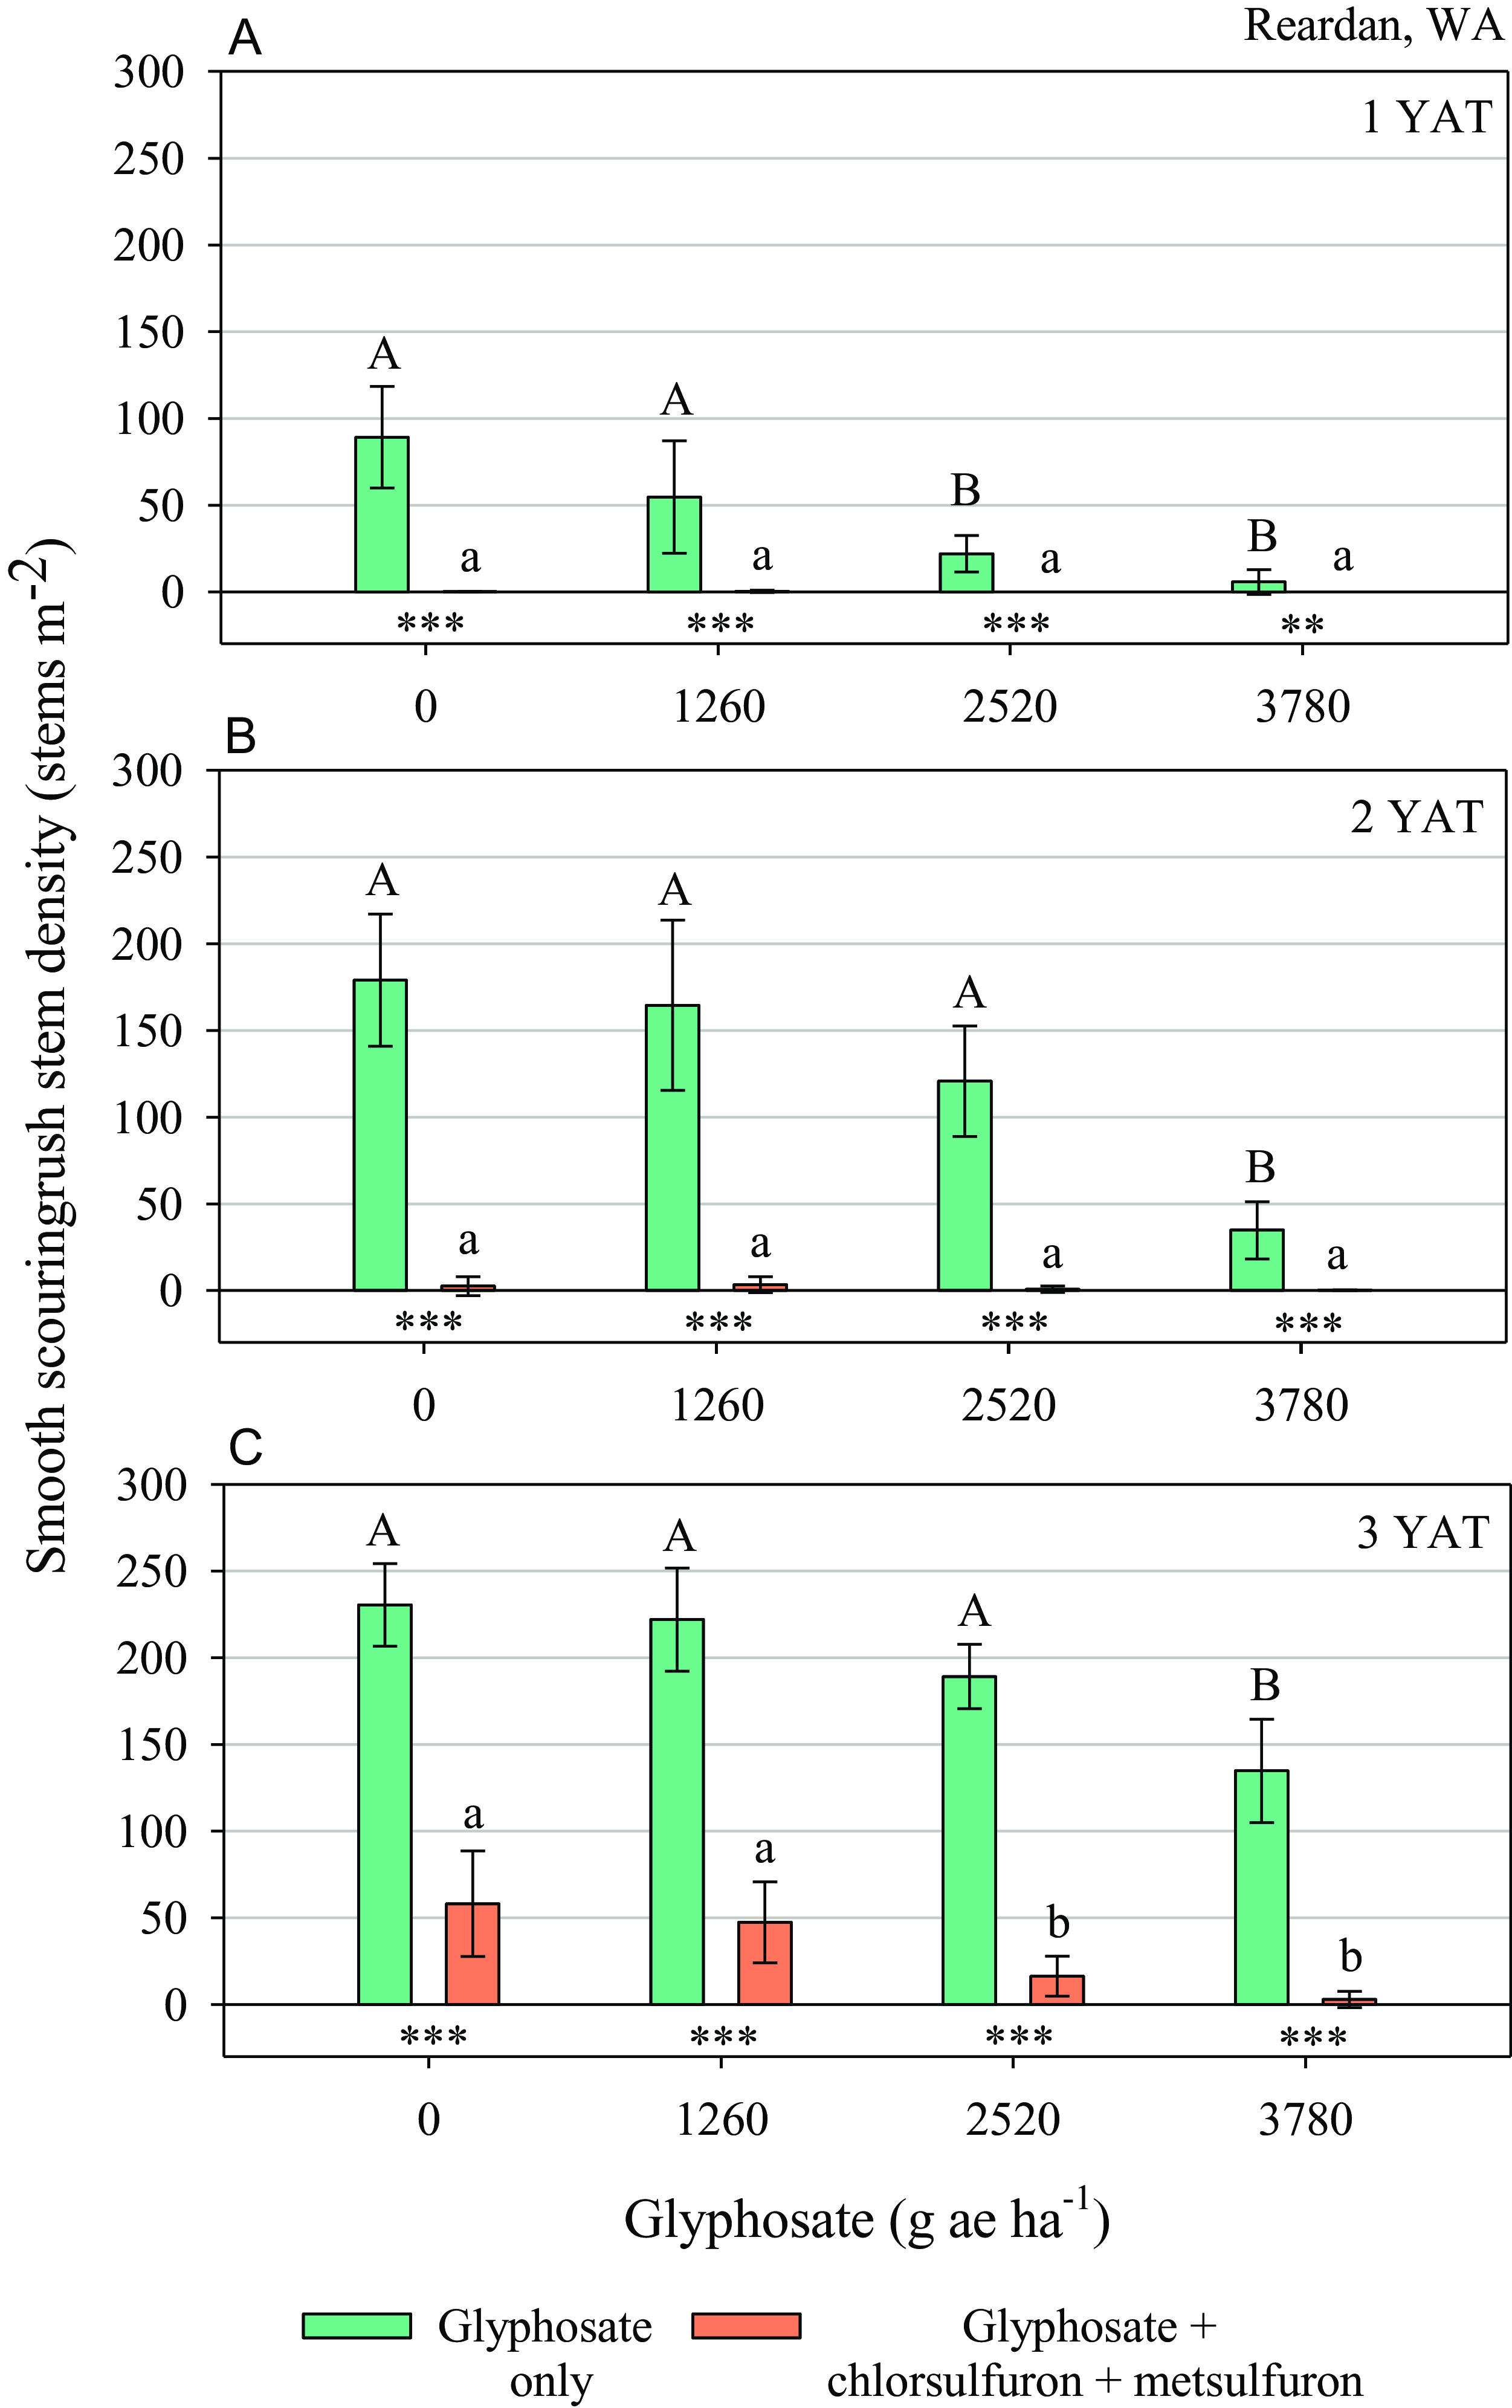
Figure 2. Smooth scouringrush stem density at the Reardan, Washington, location following application of glyphosate at 0, 1,260, 2,520, and 3,280 g ae ha−1, alone (green bars), and tank-mixed with chlorsulfuron + metsulfuron at 21.9 + 4.4 ga ai ha−1 (orange bars) each year after treatment (YAT) for 3 yr (A, B, and C). Bars on each graph represent least squares means (LSMEANS) of stem density counts per square meter. Bars with the same letter in each herbicide group (glyphosate alone or chlorsulfuron + metsulfuron) are not different (α = 0.05). Differences between bars paired at each glyphosate rate comparing glyphosate only with the same glyphosate rate plus chlorsulfuron + metsulfuron are shown with asterisks below the bars as follows: ***P ≤ 0.001, **P ≤ 0.01, *P ≤ 0.05, ns=P > 0.05. Differences between treatments were determined using pair-wise comparisons of LSMEANS with the GLIMMIX procedure with SAS software. Error bars associated with each bar are standard deviations calculated with the GLIMMIX procedure.
At 2 YAT, fewer than 4 stems m−2 were observed after any treatment that contained chlorsulfuron + metsulfuron (Figure 2B). For treatments that contained glyphosate only, smooth scouringrush stem density was reduced only at the highest rate compared with the nontreated check. Stem density was greatly reduced when chlorsulfuron + metsulfuron was included in the tank mix with each rate of glyphosate.
Unlike the previous 2 yr, however, differences between treatments containing chlorsulfuron + metsulfuron were observed at 3 YAT (Figure 2C). Adding glyphosate at 2,520 or 3,780 g ha−1 to chlorsulfuron + metsulfuron reduced smooth scouringrush density over chlorsulfuron + metsulfuron applied alone or with glyphosate at 1,260 g ha−1. When glyphosate was applied alone, smooth scouringrush stem density was reduced over the nontreated check only at the highest rate of glyphosate.
Steptoe
At 1 YAT, no stem emergence was observed after any treatment that contained chlorsulfuron + metsulfuron (Figure 3A). Similarly to what occurred in Dayton and Reardan, compared with the nontreated check, smooth scouringrush stem density was reduced when glyphosate was applied alone at all rates and densities were lowest at the two highest rates. However, at glyphosate rates of 2,520 and 3,780 g ha−1, no difference in stem density was observed between treatments with or without chlorsulfuron + metsulfuron (Figure 3A). At glyphosate rates of 0 and 1,260 g ha−1, stem densities were lower when chlorsulfuron + metsulfuron was included in the tank mix.
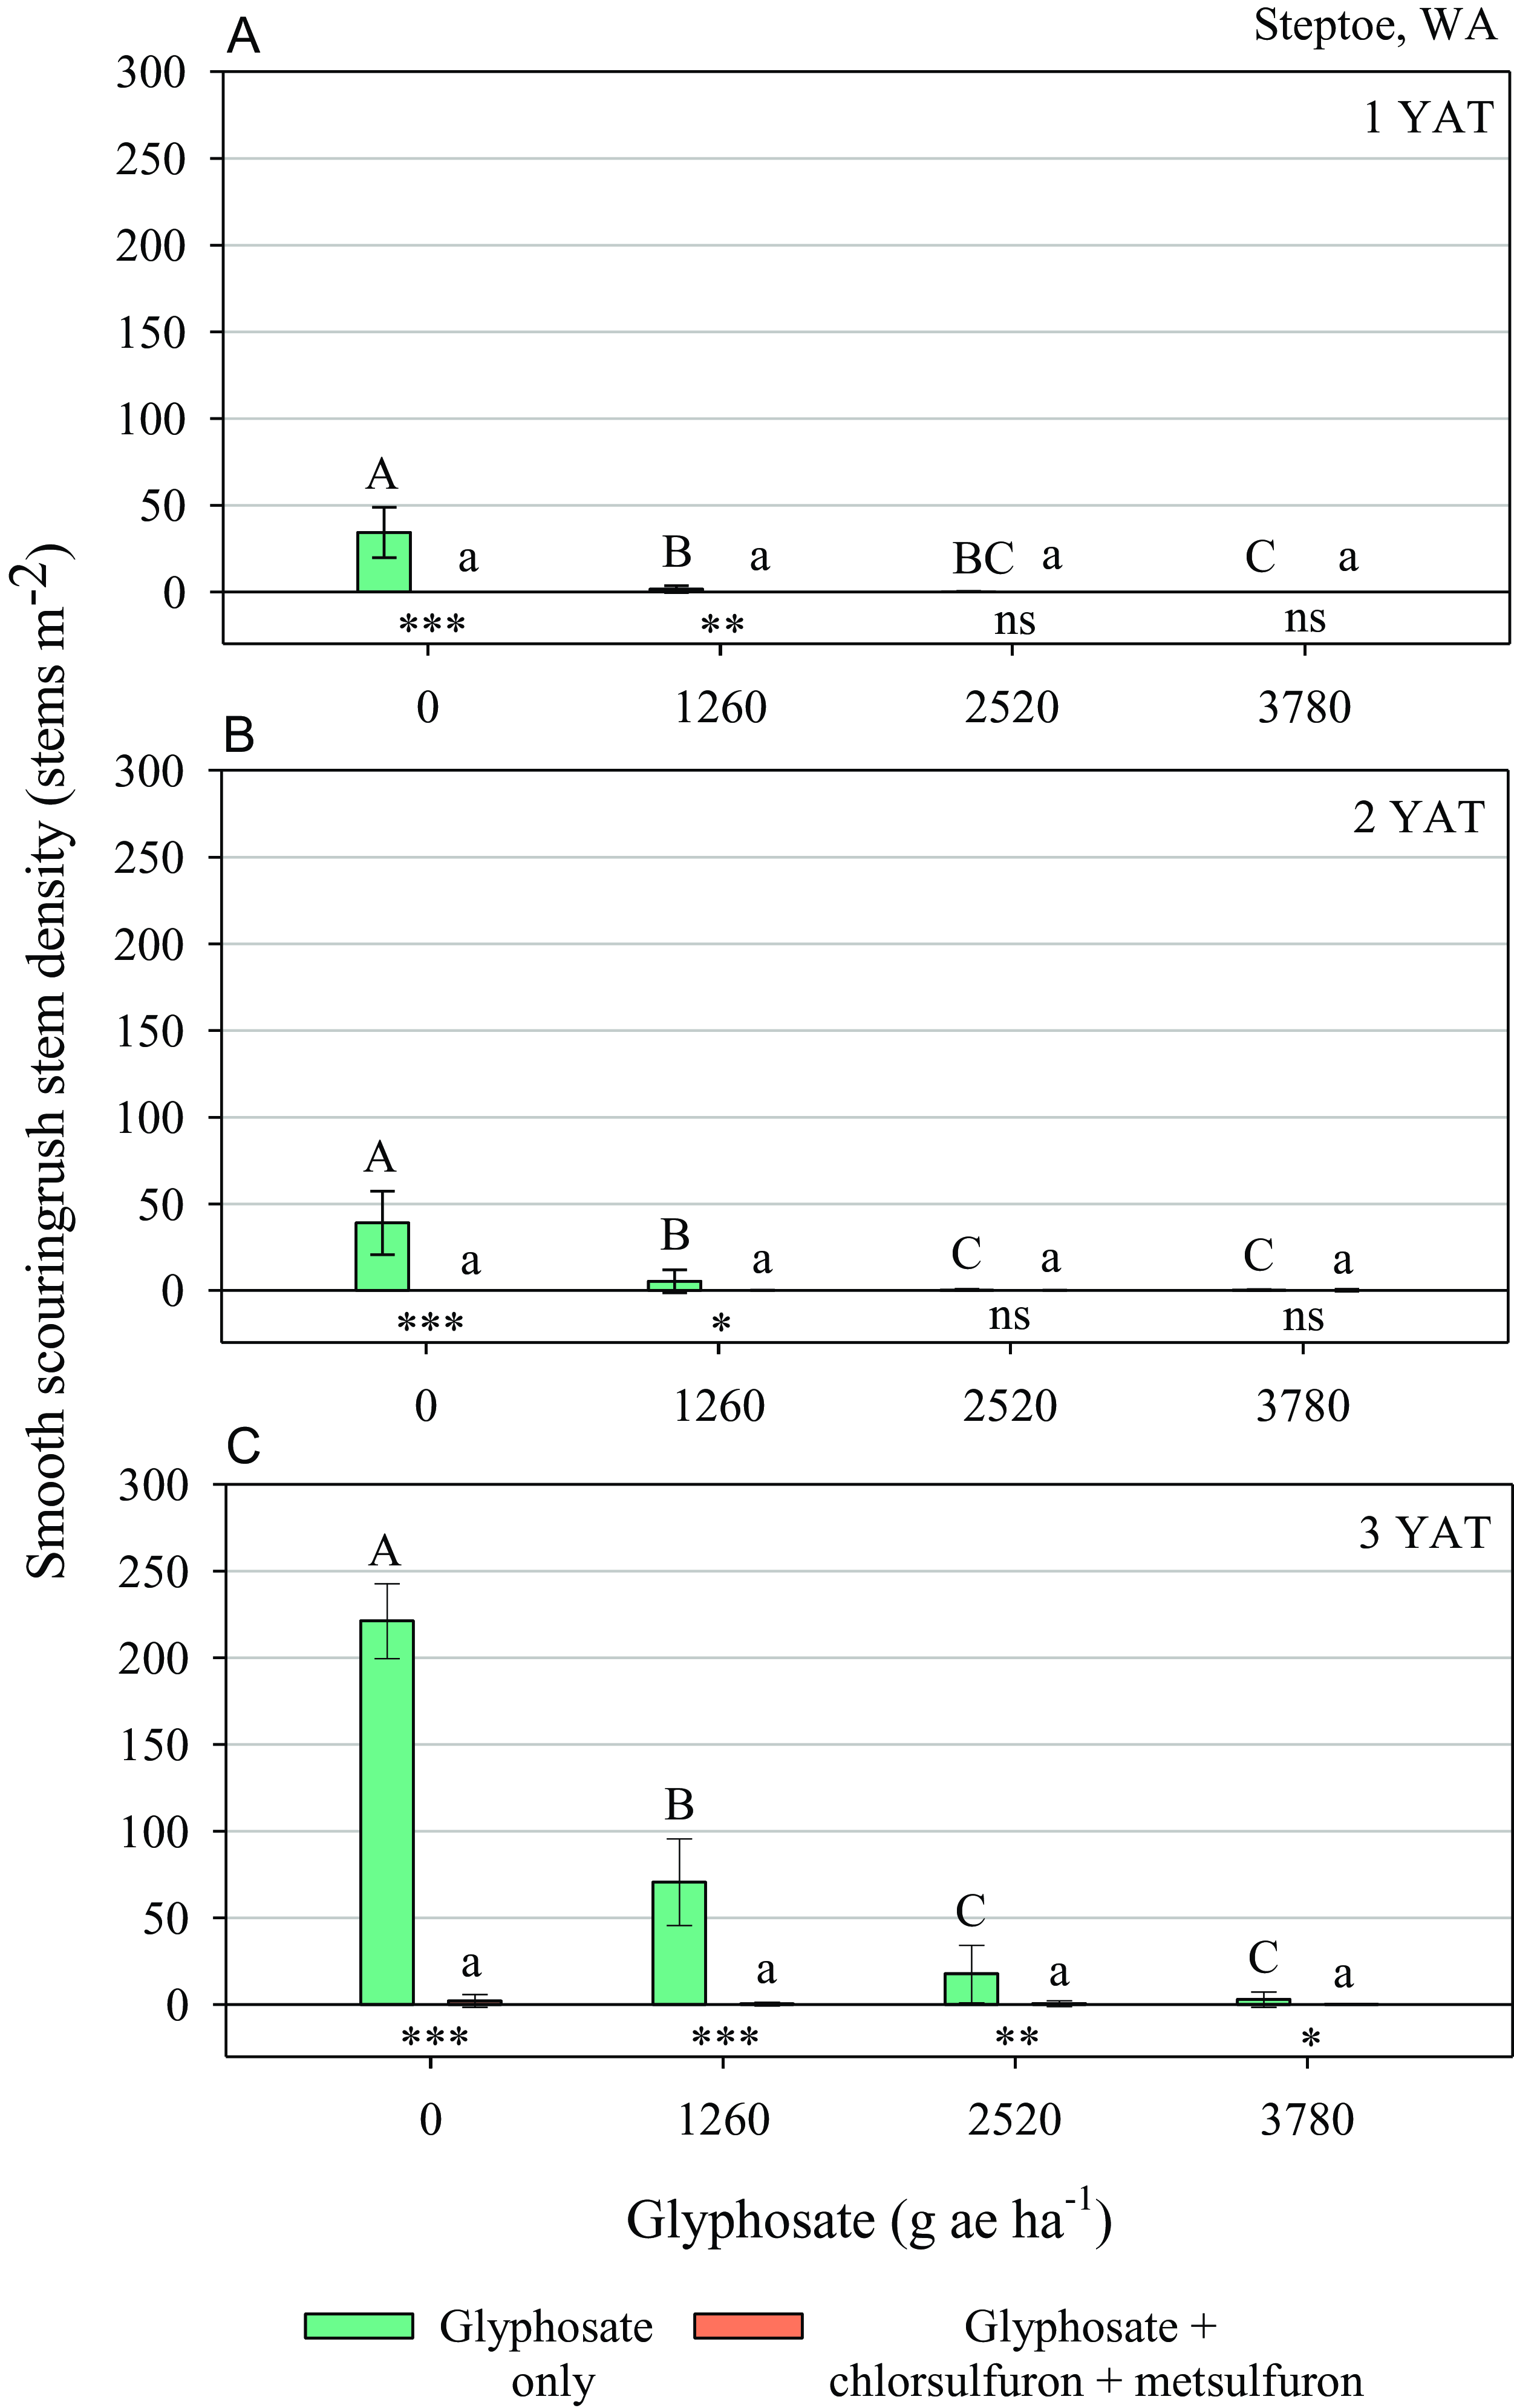
Figure 3. Smooth scouringrush stem density at the Steptoe, Washington, location following application of glyphosate at 0, 1,260, 2,520, and 3,280 g ae ha−1, alone (green bars), and tank-mixed with chlorsulfuron + metsulfuron at 21.9 + 4.4 ga ai ha−1 (orange bars) each year after treatment (YAT) for 3 yr (A, B, and C). Bars on each graph represent least squares means (LSMEANS) of stem density counts per square meter. Bars with the same letter in each herbicide group (glyphosate alone or chlorsulfuron + metsulfuron) are not different (α = 0.05). Differences between bars paired at each glyphosate rate comparing glyphosate only with the same glyphosate rate plus chlorsulfuron + metsulfuron are shown with asterisks below the bars as follows: ***P ≤ 0.001, **P ≤ 0.01, *P ≤ 0.05, ns=P > 0.05. Differences between treatments were determined using pair-wise comparisons of LSMEANS with the GLIMMIX procedure with SAS software. Error bars associated with each bar are standard deviations calculated with the GLIMMIX procedure.
At 2 YAT, smooth scouringrush stem emergence was still absent after all treatments that contained chlorsulfuron + metsulfuron (Figure 3B). Stem densities were reduced at all application rates of glyphosate compared with the nontreated check and density was lowest at the two highest rates. At glyphosate rates of 2,520 and 3,780 g ha−1, no stems emerged and no difference in stem density was observed between treatments with or without chlorsulfuron + metsulfuron. At glyphosate rates of 0 and 1,260 g ha−1, stem densities were lower when chlorsulfuron + metsulfuron was included in the tank mix.
At 3 YAT, fewer than three smooth scouringrush stems per square meter were counted after all treatments that contained chlorsulfuron + metsulfuron (Figure 3C). As in the two previous years, there was no difference in stem density between any of the treatments that contained chlorsulfuron + metsulfuron. Stem density was lower after all glyphosate-only treatments compared with the nontreated check, with the lowest stem density occurring after treatments with the two highest rates. Unlike the previous 2 yr, smooth scouringrush stem density was lower when chlorsulfuron + metsulfuron was included in the tank mix, regardless of glyphosate rate.
The high efficacy of chlorsulfuron + metsulfuron observed in this study is similar to the efficacy of chlorsulfuron reported by Kerbs et al. (Reference Kerbs, Hulting and Lyon2019). In that study, chlorsulfuron at 19.5 g ai ha−1 was applied at a site near Reardan, Washington, and 32 g ha−1 at a site near The Dalles, Oregon, with MCPA-ester included at both sites at a rate of 1,120 g ae ha−1. At both sites, that treatment was the only one of 10 herbicide treatments that effectively reduced smooth scouringrush stem density compared with a nontreated check at 1 YAT. Other treatments that contained MCPA-ester did not result in a stem density reduction at 1 YAT, suggesting that chlorsulfuron was the herbicide component that provided the control.
Kerbs et al. (Reference Kerbs, Hulting and Lyon2019) also applied glyphosate alone at 1,260 g ha−1, but they observed no reduction in stem density compared to a nontreated check when observed 1 YAT. This was similar to what we observed at the Reardan location, where there was no reduction in stem density at 1, 2, or 3 YAT compared with the nontreated checks when glyphosate was applied alone at 1,260 g ha−1 (Figure 2, A–C). At the Dayton site, a reduction in stem density compared to the nontreated check was observed at 1 and 2 YAT when glyphosate was applied at 1,260 g ha−1 but the reduction was not observed at 3 YAT (Figure 1, A–C). At the Steptoe site, stem density was reduced at the 1,260 g ha−1 rate of glyphosate compared to the nontreated check in all three years (Figure 3, A–C). Kerbs et al. used a nonionic surfactant with their glyphosate treatment, whereas we used an organosilicone surfactant in all herbicide treatments in this study. We previously reported (Lyon and Thorne Reference Lyon and Thorne2022) an increased control of smooth scouringrush at 2 YAT at three sites in eastern Washington when glyphosate was applied at 2,520 g ha−1 when an organosilicone surfactant was added compared to the same rate of glyphosate without a surfactant.
Savic et al. (Reference Savic, Thorne and Lyon2023) evaluated the efficacy of glyphosate applied at 3,780 g ha−1 on smooth scouringrush stem density 1 YAT with an organosilicone surfactant, an organosilicone surfactant plus a nonionic surfactant blend, or an alcohol-based surfactant applied during the day or at night. Across three study sites, five of the six effective treatments included an organosilicone surfactant or an organosilicone + nonionic surfactant blend. At two of the sites, when a difference in efficacy was observed between application times, daytime applications were more effective than nighttime applications, which supported (but not confirm) their hypothesis that organosilicone surfactants improve glyphosate efficacy by means of stomatal flooding.
Unlike previous studies, this study evaluated chlorsulfuron + metsulfuron and glyphosate efficacy on smooth scouringrush for 3 YAT. It is in the third year following treatment that some of the most interesting observations occurred. At the Dayton and Reardan sites, compared with the nontreated checks, when glyphosate was applied alone, a reduction in stem density was observed only when the highest rate of glyphosate (3,780 g ha−1) was applied (Figures 1C and 2C). Although adding chlorsulfuron + metsulfuron to all the glyphosate treatments reduced smooth scouringrush stem density compared to the same glyphosate rate without chlorsulfuron + metsulfuron, efficacy of the latter combination declined in the third YAT compared to 1 or 2 YAT. At the Reardan site, this reduction in efficacy from chlorsulfuron + metsulfuron resulted in an observed difference in efficacy between glyphosate rates applied with chlorsulfuron + metsulfuron. Stem density at the Reardan site at 3 YAT was reduced compared to chlorsulfuron + metsulfuron applied alone and when chlorsulfuron + metsulfuron was tank-mixed with glyphosate at 2,520 or 3,780 g ha−1 (Figure 2C).
At the Steptoe site at 3 YAT, all treatments that contained chlorsulfuron + metsulfuron still provided excellent control of smooth scouringrush, with <3 stems m−2 (Figure 3C). Because stem density was low, the rate of glyphosate tank-mixed with chlorsulfuron + metsulfuron did not affect efficacy. Unlike Dayton and Reardan, all treatments that contained only glyphosate resulted in reduced stem density compared with the nontreated check (Figure 3C). The lowest stem density was observed at the two highest application rates.
The Steptoe site was in a low-lying flat area that was frequently flooded in early spring and likely benefitted from natural subsurface irrigation from the surrounding hills, whereas the Dayton and Reardan sites were located on drier, sloping areas. Stomatal closure is an initial reaction of most plants to drought stress (Pirasteh-Anosheh et al. Reference Pirasteh-Anosheh, Saed-Moucheshi, Pakniyat and Pessaraki2016). Soil water content is more closely related to stomatal closure than leaf water status. Soil water at the Steptoe site was likely greater than at the other two sites, the result of spring flooding and subirrigation at the time of herbicide application, which may have allowed greater uptake and translocation of the herbicides at Steptoe than at the other two sites. If stomatal flooding plays a role in herbicide uptake when herbicides are tank-mixed with an organosilicone surfactant as Savic et al. (Reference Savic, Thorne and Lyon2023) hypothesized, this may partially explain the greater efficacy and duration of efficacy at the Steptoe site relative to the other two sites in the study.
Chlorsulfuron + metsulfuron provides highly effective management of smooth scouringrush for at least 2 YAT. Glyphosate rates of 2,520 or 3,780 g ha−1 provide effective control of smooth scouringrush for 1 or 2 YAT, but effective control 3 YAT may require applying the highest glyphosate rate of 3,780 g ha−1. Although the addition of glyphosate to chlorsulfuron + metsulfuron did not improve control of smooth scouringrush during the first 2 YAT, which was likely the result of the high efficacy of chlorsulfuron + metsulfuron for the first 2 YAT, there was an increase in smooth scouringrush control 3 YAT with the addition of 2,520 or 3,780 g ha−1 of glyphosate at Reardan. This increased duration of efficacy is most likely to be achieved in drier locations where chlorsulfuron + metsulfuron may be less durable than at a low-lying site with potentially greater soil water content at the time of herbicide application. Growers who prioritize longevity of control should use chlorsulfuron + metsulfuron for smooth scouringrush control and may consider adding glyphosate at 2,520 or 3,780 g ha−1 to increase control beyond 2 YAT. Growers who may be concerned about the limited crop replant options following the use of chlorsulfuron + metsulfuron can use glyphosate alone but should consider using 3,789 g ha−1 to achieve the greatest duration of control.
Practical Implications
Chlorsulfuron + metsulfuron applied during summer fallow provides highly effective control of smooth scouringrush for at least 2 yr after application. Its efficacy may begin to decline in the third YAT at some locations. The addition of glyphosate at 2,520 or 3,780 g ha−1 to chlorsulfuron + metsulfuron may extend the duration of effective smooth scouringrush control through at least 3 yr after treatment. Although there may be no discernable benefit of adding glyphosate to chlorsulfuron + metuslfuron for the first 2 yr after application because of the high efficacy of chlorsulfuron + metsulfuron, the benefit of adding glyphosate to the herbicide mix may be apparent as the efficacy of chlorsulfuron + metusulfuron wanes. When applied alone, glyphosate seldom provides control of smooth scouringrush comparable to that of chlorsulfuron + metsulfuron, particularly by the third year after application. When glyphosate is applied alone, the efficacy and duration of control increases with an increasing glyphosate rate.
Acknowledgments
Field studies near Dayton, Rearden, and Steptoe, WA were conducted on land graciously made available to the authors by Brett Lambert, Kurt Carstens, and Mark Hall, respectively.
Funding
This research was partially funded by an endowment from the Washington Grain Commission and by the U.S. Department of Agriculture–National Institute of Food and Agriculture, Hatch project 7003737.
Competing Interests
The authors declare they have no competing interests.


 Open access