People with psychopathic personality disorder pose an elevated risk of violence, respond less well to treatment and disrupt the treatment of others (Reference Hare, Cooke, Hart and MillonHare et al, 1999). In the UK the diagnosis of psychopathy is relied on heavily when making release decisions in prison and forensic psychiatric settings. However, the most commonly used diagnostic procedure, the Psychopathy Checklist – Revised (PCL–R; Reference HareHare, 1991), was developed and has been used primarily in North America. This is a potential concern as the manifestations of personality disorders are likely to vary across cultures (Reference Cooke and MichieCooke & Michie, 1999; Reference Lopez and GaurnacciaLopez & Gaurnaccia, 2000). Because of the serious nature of the forensic decisions in which it is applied, the PCL–R has great potential for causing harm if used improperly. There are ethical dangers in using an instrument clinically without first re-standardising it: for example, no psychologist would make important decisions using an IQ test developed in another culture without evidence of cross-cultural generalisability. Before mental health professionals can use the PCL–R confidently and ethically in the UK, it must be demonstrated that this test has cross-cultural generalisability (cf. Reference HeilbrunHeilbrun, 2001).
In this paper we examine the generalisability of the PCL–R from Canada and the USA (North America) to the UK. We consider two primary issues: first, is the syndromal structure of psychopathy, as measured by the PCL–R, the same in the UK and North America? Second, are PCL–R scores obtained in the UK and North America equivalent? Only if both questions are answered in the affirmative can test scores be considered cross-culturally equivalent.
METHOD
Procedure
The PCL–R (Hare, Reference Hare1991, Reference Hare2003) is a 20-item symptom rating scale of psychopathic personality disorder intended for use in forensic settings. The test manual provides a definition of each item, and evaluators rate the lifetime presence of each symptom on a three-point scale (0 absent, 1 possibly or partially present, 2 definitely present) on the basis of an interview with the participant and a review of case history information. Items are summed to yield total scores that range from 0 to 40; scores of 30 and higher are considered diagnostic of psychopathy.
Participants
United Kingdom
The UK sample comprised a total of 1316 adult male offenders. The largest subsample comprised 608 adult male offenders from seven prisons in Her Majesty's Prison Service (HMPS) in England and Wales, selected to be representative of the HMPS population. Additional sub-samples included 104 prisoners from a therapeutic prison in England (see Reference Hobson and ShineHobson & Shine, 1998); a representative sample of 246 offenders from the Scottish Prison Service (Reference Cooke and MichieCooke & Michie, 1999); a stratified random sample of 250 offenders from Scotland's largest prison (see Reference Michie and CookeMichie & Cooke, 2005); and a sample of 105 incarcerated Scottish offenders who volunteered to participate in a study of early childhood experiences (Reference Marshall and CookeMarshall & Cooke, 1998).
North America
The North American sample comprised 2067 adult male offenders and forensic psychiatric patients from ten different convenience samples in Canada and the USA. These samples are described in detail elsewhere (Cooke & Michie, Reference Cooke and Michie1997, Reference Cooke and Michie1999).
Data analyses
Measurement of psychological characteristics is indirect: an individual's level of a characteristic (for example IQ, depression or psychopathy) is inferred from observable behaviour, such as response to test items or verbal accounts of symptoms. In the language of test theory, a person's standing on the unobservable latent trait is inferred from manifest variables, such as scores on tests of abstract reasoning (Reference Waller, Thompson and WenkWaller et al, 2000). In cross-cultural research interest is focused on the latent variable because test scores generally are biased (Reference Waller, Thompson and WenkWaller et al, 2000). Cross-cultural equivalence requires, first, that the same symptoms or items cluster together to form a syndrome, and second, that the scale or metric device used to measure the latent traits (not the manifest variables) is invariant across cultures. Metric variance occurs when the test scores do not bear the same relationship with the underlying construct being measured in two different groups; thus, for example, in the absence of metric invariance a PCL–R score of 30 would not represent the same level of psychopathy in the two groups. (This can be illustrated by considering the analogy of temperatures measured in degrees Fahrenheit in one setting and degrees Celsius in another; although the same construct is being measured, comparisons would be meaningless because of differences in zero points and in scale increments.) These two issues were addressed by the data analyses. First, the comparability of factor structure across cultures was addressed through the application of confirmatory factor analysis methods (Reference Bentler and WuBentler & Wu, 1995). Second, the comparability of the measures across cultures was addressed through the application of item response theory methods (Reference Santor and RamsaySantor & Ramsay, 1999).
Confirmatory factor analysis
Factor analysis evaluates the pattern of associations among symptoms. It can be used to determine whether symptoms cluster together to form a coherent syndrome (Reference EysenckEysenck, 1970). Confirmatory factor analysis permits quantification of a factor structure's fit in a particular sample, or across samples. Different aspects of fit were evaluated, including absolute fit (χ2), fit adjusted for model parsimony (non-normed fit index, or NNFI), fit relative to a null model (comparative fit index, or CFI) and root mean square error of approximation (RMSEA). The criteria for adequate fit were comparative fit index and non-normed fit index values of more than 0.90 and an RMSEA less than 0.08 (Reference KlineKline, 1998). Confirmatory factor analysis of the item covariance matrix using maximum likelihood estimation was performed using EQS (Reference Bentler and WuBentler & Wu, 1995). Cases with missing data were deleted listwise.
Item response theory
Item response theory models estimate the association between item or test scores and a latent trait (θ) that underlies item or test scores. Item characteristic curves (ICCs) index the association between the probability of an item score or symptom and θ; test characteristic curves (TCCs) index the association between the probability of total scores and θ. The slopes of ICCs or TCCs reflect discriminating power: that is, the extent to which item or test scores reflect the latent construct. The inflexion point of ICCs and TCCs reflect the extremity or difficulty of item or test scores; some symptoms may become obvious in mild forms of a disorder and others when the disorder is profound. Item response methods also can be used to detect differential item functioning or differential test functioning across groups: the former occurs when a symptom is more discriminating, or is evident at different levels of extremity, in one group; the latter occurs when total scores on a test are more discriminating or more extreme in one group, for individuals with same level of the underlying trait.
The item response theory model used to analyse data was Samejima's graded model, following Cooke & Michie (Reference Cooke and Michie1997). The probability of the response options for a PCL–R item can be expressed by probability curves (Fig. 1). As the level of the underlying trait increases, the probability of a 2 response increases and the probability of a 0 response diminishes. The curves for 0 and 2 ratings are symmetric logistic functions; the curve for the 1 response is found by subtraction. The sum of probabilities for all three ratings at any level of the latent trait is unity. The shape and position of the curves can be described by the values of three parameters: a, b 1 and b 2 (Reference ThissenThissen, 1991). The a parameter is an index of slope; larger a parameters indicate that the symptom provides a better indicator of the disorder. The b i parameters are indexes of difficulty or extremity: the bigger the value, the more intense the disorder has to be before the symptom becomes evident. Item response theory analyses were performed using Multilog VI (Reference ThissenThissen, 1991).
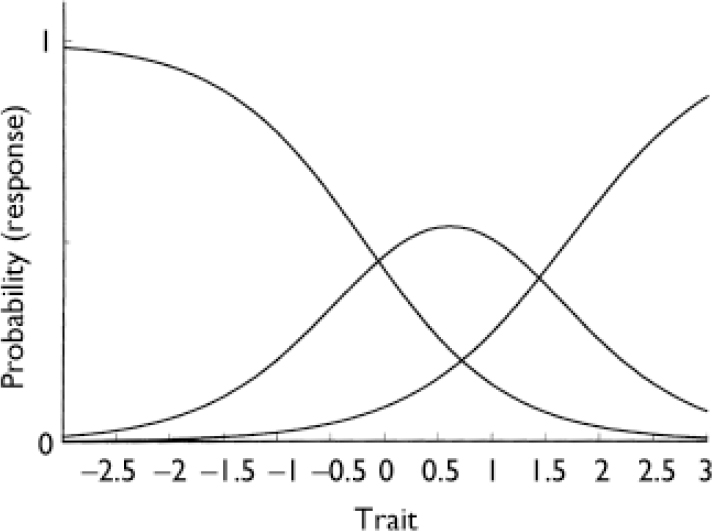
Fig. 1 Example of item characteristic curves (Psychopathy Checklist item 2).
RESULTS
Syndromal structure invariance
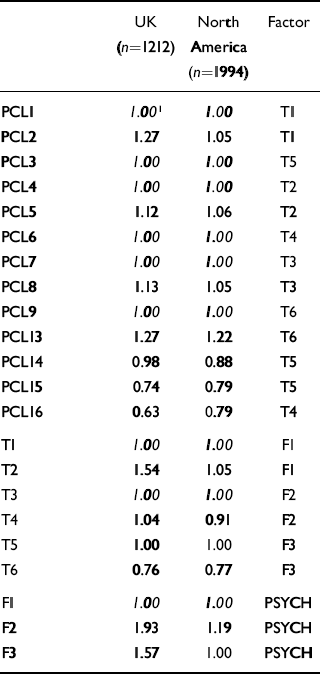
First, we evaluated the extent to which the three-factor hierarchical model fitted ratings from the UK. Previous research has demonstrated that 13 of the 20 PCL–R items form a hierarchical structure in which the superordinate trait, psychopathy, over-arched three highly correlated symptom facets: arrogant and deceptive interpersonal style, deficient affective experience, and impulsive and irresponsible behavioural style (Reference Cooke and MichieCooke & Michie, 2001). The fit for this model for the UK sample was good: χ2(56, n=1212)=313.2, P<0.001; NNFI=0.92, CFI=0.94, RMSEA=0.06. Loadings are displayed in Table 1. (It is perhaps noteworthy that the traditional two-factor solution for the PCL–R did not fit these data: χ2(117, n=1038)=1096.6, P<0.001; NNFI=0.77, CFI=0.80, RMSEA=0.09.)
Table 1 Unstandardised loadings for hierarchical model for North America and UK (read as equation, e.g. PCL2=1.05T1 for North America, 1.27T1 for UK)
| UK (n=1212) | North America (n=1994) | Factor | |
|---|---|---|---|
| PCL1 | 1.00 1 | 1.00 | T1 |
| PCL2 | 1.27 | 1.05 | T1 |
| PCL3 | 1.00 | 1.00 | T5 |
| PCL4 | 1.00 | 1.00 | T2 |
| PCL5 | 1.12 | 1.06 | T2 |
| PCL6 | 1.00 | 1.00 | T4 |
| PCL7 | 1.00 | 1.00 | T3 |
| PCL8 | 1.13 | 1.05 | T3 |
| PCL9 | 1.00 | 1.00 | T6 |
| PCL13 | 1.27 | 1.22 | T6 |
| PCL14 | 0.98 | 0.88 | T5 |
| PCL15 | 0.74 | 0.79 | T5 |
| PCL16 | 0.63 | 0.79 | T4 |
| T1 | 1.00 | 1.00 | F1 |
| T2 | 1.54 | 1.05 | F1 |
| T3 | 1.00 | 1.00 | F2 |
| T4 | 1.04 | 0.91 | F2 |
| T5 | 1.00 | 1.00 | F3 |
| T6 | 0.76 | 0.77 | F3 |
| F1 | 1.00 | 1.00 | PSYCH |
| F2 | 1.93 | 1.19 | PSYCH |
| F3 | 1.57 | 1.00 | PSYCH |
Second, as a more rigorous test of cross-sample factorial invariance, we fitted the three-factor hierarchical model simultaneously to data from the UK v. North America. The fit of the baseline (i.e. unconstrained) model was good: χ2(112, n=3206)=670.6, P<0.001, NNFI=0.94, CFI=0.96, RMSEA=0.04. The fit obtained when the loadings were constrained to be equal across cultures was also good (χ2(125, n=3206)=728.4, P<0.001, NNFI=0.94, CFI=0.95, RMSEA=0.04), although significantly worse than the fit of the unconstrained model (Δχ2(13, n=3206)=57.8, P<0.001). Lagrange multiplier tests indicated that several of the constraints would have to be released in the model to achieve a level of fit equivalent to the baseline model; however, examination of the standard errors suggests that the cross-cultural differences in loadings were small in absolute terms (further information available from the author upon request). Overall, the results of this second analysis indicated that the disorder is defined by the same symptoms across cultures: the PCL–R items had zero and non-zero loadings on the same factors in both cultures.
Third, we compared the unidimensionality of the PCL–R across cultures. Unidimensionality indicates whether all the symptoms cluster together sufficiently that the disorder defined by the symptoms can be regarded as a coherent syndrome: this is an important step in the validation of a construct. The unidimensionality or coherence of a superordinate construct in a hierarchical model can be estimated from the total test variance accounted for by the superordinate factor. General factor saturation is defined as the ratio of total test variance accounted for by the superordinate factor to the observed variance of the total score (Reference Zinbarg, Barlow and BrownZinbarg et al, 1997); values over 0.50 indicate that a measure is coherent. The general factor saturation for the UK was 0.75, a value identical to that for North America; this suggests a high degree of coherency or unidimensionality in both cultures.
Metric invariance: differential item functioning
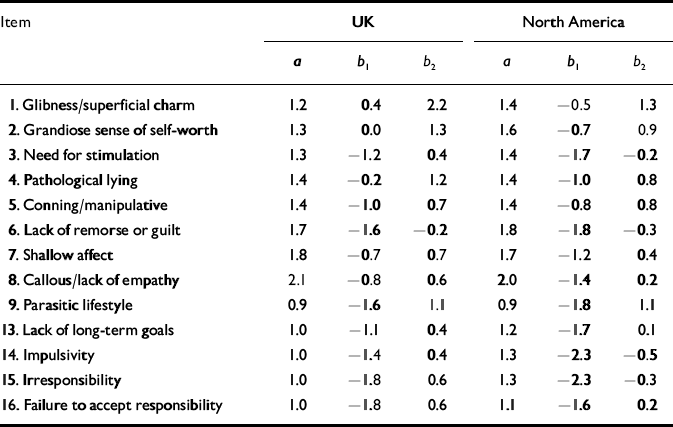
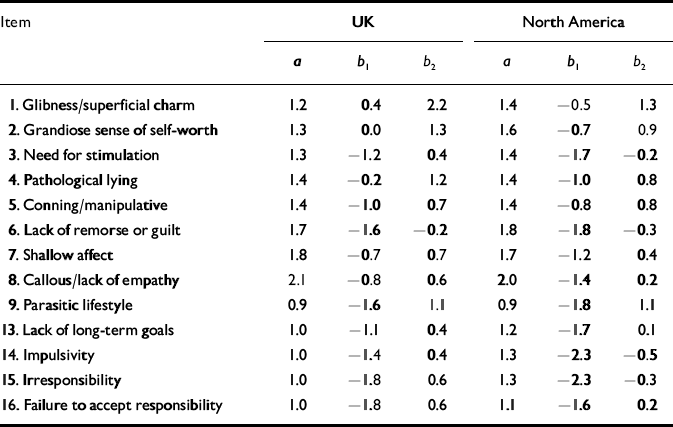
We next conducted item response theory analyses of the 13 PCL–R items incorporated in the three-factor hierarchical model. Initially, an unconstrained baseline was generated in which the mean level of the latent trait and all item parameters were allowed to vary across the two groups. Constraining the a parameters (slopes) to be equal resulted in a slightly significant increase in ω2 (Δχ2(13, n=3383)=23.7, P<0.05), indicating that the discriminating power of items varied only slightly across cultures. For 8 of 13 items the slopes were higher (i.e. the items were more discriminating) in North America than in the UK. Examination of the individual slope parameters revealed that the cross-cultural differences were too small to be of practical importance; however, the existence of differential item functioning necessitated additional steps before we could directly compare PCL–R ratings across cultures.
In both North America and the UK, the PCL–R items that loaded on the deficient affective experience factor were generally more discriminating (i.e. had higher a parameters) than those that loaded on the arrogant and deceptive interpersonal style factor and the impulsive and irresponsible behavioural style factor. Also, the interpersonal symptoms only become apparent at high levels of the disorder (i.e. had higher b parameters than other types of symptoms).
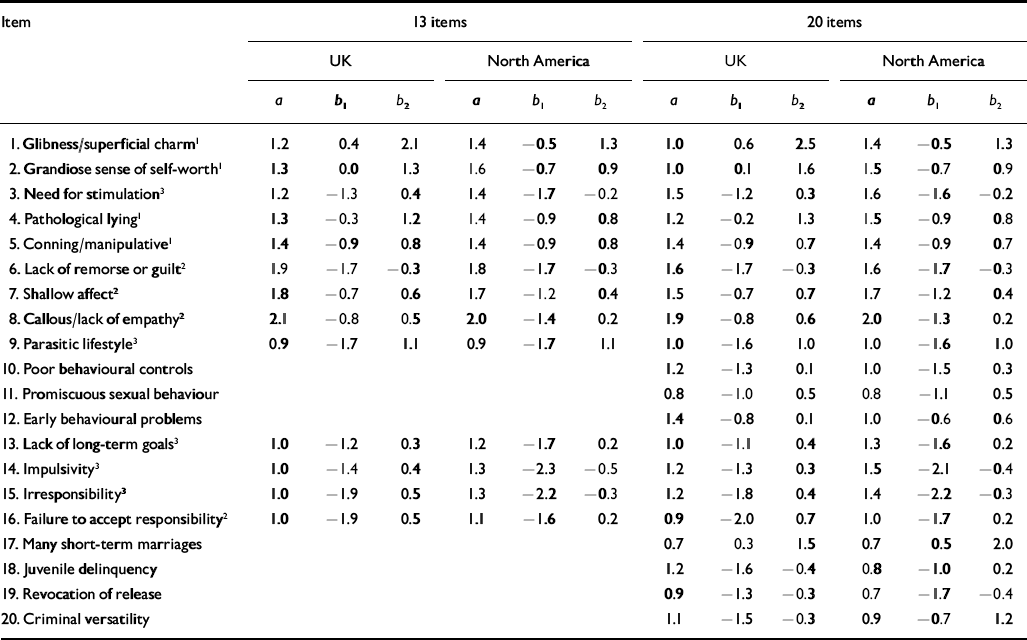
Next, we identified items with similar parameters across cultures to serve as ‘anchors’ for the estimation of a common measure (see Reference Cooke and MichieCooke & Michie, 1999; Reference Embretson and ReiseEmbretson & Reise, 2000). For each of the three subordinate factors in the three-factor hierarchical model, we selected the item with the smallest cross-cultural differences in b i parameters. The three anchors selected were items 5 (conning/manipulative), 6 (lack of remorse or guilt) and 9 (parasitic lifestyle). Constraining these three items to be equal across groups resulted in a slightly significant change in χ2 (Δχ2(9, n=3383)=23.4, P<0.01); however, these differences were small. Overall, the model fitted the data well, with predicted responses for each item falling within 1 of the observed values. The item response theory parameters for the base model and for the constrained model are shown in Tables 2 and 3. Examination of Table 3 reveals that, given equivalent standing on the latent trait, participants from the UK had lower ratings on most of the 13 PCL–R items than did participants from North America.
Table 2 Item response theory parameters for UK v. North America: 13-item unconstrained model
| Item | UK | North America | ||||
|---|---|---|---|---|---|---|
| a | b 1 | b 2 | a | b 1 | b 2 | |
| 1. Glibness/superficial charm | 1.2 | 0.4 | 2.2 | 1.4 | -0.5 | 1.3 |
| 2. Grandiose sense of self-worth | 1.3 | 0.0 | 1.3 | 1.6 | -0.7 | 0.9 |
| 3. Need for stimulation | 1.3 | -1.2 | 0.4 | 1.4 | -1.7 | -0.2 |
| 4. Pathological lying | 1.4 | -0.2 | 1.2 | 1.4 | -1.0 | 0.8 |
| 5. Conning/manipulative | 1.4 | -1.0 | 0.7 | 1.4 | -0.8 | 0.8 |
| 6. Lack of remorse or guilt | 1.7 | -1.6 | -0.2 | 1.8 | -1.8 | -0.3 |
| 7. Shallow affect | 1.8 | -0.7 | 0.7 | 1.7 | -1.2 | 0.4 |
| 8. Callous/lack of empathy | 2.1 | -0.8 | 0.6 | 2.0 | -1.4 | 0.2 |
| 9. Parasitic lifestyle | 0.9 | -1.6 | 1.1 | 0.9 | -1.8 | 1.1 |
| 13. Lack of long-term goals | 1.0 | -1.1 | 0.4 | 1.2 | -1.7 | 0.1 |
| 14. Impulsivity | 1.0 | -1.4 | 0.4 | 1.3 | -2.3 | -0.5 |
| 15. Irresponsibility | 1.0 | -1.8 | 0.6 | 1.3 | -2.3 | -0.3 |
| 16. Failure to accept responsibility | 1.0 | -1.8 | 0.6 | 1.1 | -1.6 | 0.2 |
Table 3 Item response theory parameters for UK v. North America: 13-item and 20-item models after anchoring
| Item | 13 items | 20 items | ||||||||||
|---|---|---|---|---|---|---|---|---|---|---|---|---|
| UK | North America | UK | North America | |||||||||
| a | b 1 | b 2 | a | b 1 | b 2 | a | b 1 | b 2 | a | b 1 | b 2 | |
| 1. Glibness/superficial charm1 | 1.2 | 0.4 | 2.1 | 1.4 | -0.5 | 1.3 | 1.0 | 0.6 | 2.5 | 1.4 | -0.5 | 1.3 |
| 2. Grandiose sense of self-worth1 | 1.3 | 0.0 | 1.3 | 1.6 | -0.7 | 0.9 | 1.0 | 0.1 | 1.6 | 1.5 | -0.7 | 0.9 |
| 3. Need for stimulation3 | 1.2 | -1.3 | 0.4 | 1.4 | -1.7 | -0.2 | 1.5 | -1.2 | 0.3 | 1.6 | -1.6 | -0.2 |
| 4. Pathological lying1 | 1.3 | -0.3 | 1.2 | 1.4 | -0.9 | 0.8 | 1.2 | -0.2 | 1.3 | 1.5 | -0.9 | 0.8 |
| 5. Conning/manipulative1 | 1.4 | -0.9 | 0.8 | 1.4 | -0.9 | 0.8 | 1.4 | -0.9 | 0.7 | 1.4 | -0.9 | 0.7 |
| 6. Lack of remorse or guilt2 | 1.9 | -1.7 | -0.3 | 1.8 | -1.7 | -0.3 | 1.6 | -1.7 | -0.3 | 1.6 | -1.7 | -0.3 |
| 7. Shallow affect2 | 1.8 | -0.7 | 0.6 | 1.7 | -1.2 | 0.4 | 1.5 | -0.7 | 0.7 | 1.7 | -1.2 | 0.4 |
| 8. Callous/lack of empathy2 | 2.1 | -0.8 | 0.5 | 2.0 | -1.4 | 0.2 | 1.9 | -0.8 | 0.6 | 2.0 | -1.3 | 0.2 |
| 9. Parasitic lifestyle3 | 0.9 | -1.7 | 1.1 | 0.9 | -1.7 | 1.1 | 1.0 | -1.6 | 1.0 | 1.0 | -1.6 | 1.0 |
| 10. Poor behavioural controls | 1.2 | -1.3 | 0.1 | 1.0 | -1.5 | 0.3 | ||||||
| 11. Promiscuous sexual behaviour | 0.8 | -1.0 | 0.5 | 0.8 | -1.1 | 0.5 | ||||||
| 12. Early behavioural problems | 1.4 | -0.8 | 0.1 | 1.0 | -0.6 | 0.6 | ||||||
| 13. Lack of long-term goals3 | 1.0 | -1.2 | 0.3 | 1.2 | -1.7 | 0.2 | 1.0 | -1.1 | 0.4 | 1.3 | -1.6 | 0.2 |
| 14. Impulsivity3 | 1.0 | -1.4 | 0.4 | 1.3 | -2.3 | -0.5 | 1.2 | -1.3 | 0.3 | 1.5 | -2.1 | -0.4 |
| 15. Irresponsibility3 | 1.0 | -1.9 | 0.5 | 1.3 | -2.2 | -0.3 | 1.2 | -1.8 | 0.4 | 1.4 | -2.2 | -0.3 |
| 16. Failure to accept responsibility2 | 1.0 | -1.9 | 0.5 | 1.1 | -1.6 | 0.2 | 0.9 | -2.0 | 0.7 | 1.0 | -1.7 | 0.2 |
| 17. Many short-term marriages | 0.7 | 0.3 | 1.5 | 0.7 | 0.5 | 2.0 | ||||||
| 18. Juvenile delinquency | 1.2 | -1.6 | -0.4 | 0.8 | -1.0 | 0.2 | ||||||
| 19. Revocation of release | 0.9 | -1.3 | -0.3 | 0.7 | -1.7 | -0.4 | ||||||
| 20. Criminal versatility | 1.1 | -1.5 | -0.3 | 0.9 | -0.7 | 1.2 | ||||||
Finally, we replicated the previous analysis for all 20 PCL–R items across cultures using the same three anchors, i.e. items 5, 6 and 9. The results were unchanged: the corresponding parameters for items in both the 13-item and the 20-item solutions were essentially the same, with participants from the UK having lower ratings on most of the 20 PCL–R items than participants from North America, given equivalent standing on the latent trait (Table 3).
Metric invariance: invariance: differential test functioning
Bias at the item level (differential item functioning) does not necessarily result in bias at the level of total scores (differential test functioning), as summing items may cancel out or amplify their bias (Reference Cooke, Kosson and MichieCooke et al, 2001). To examine differential test functioning, we plotted test characteristic curves for ratings from the UK v. those from North America (Fig. 2). The TCCs indicated that the association between the latent trait and PCL–R scores varied across cultures. Participants from the UK obtained lower PCL–R total scores than did those from North America, given the same level of θ.
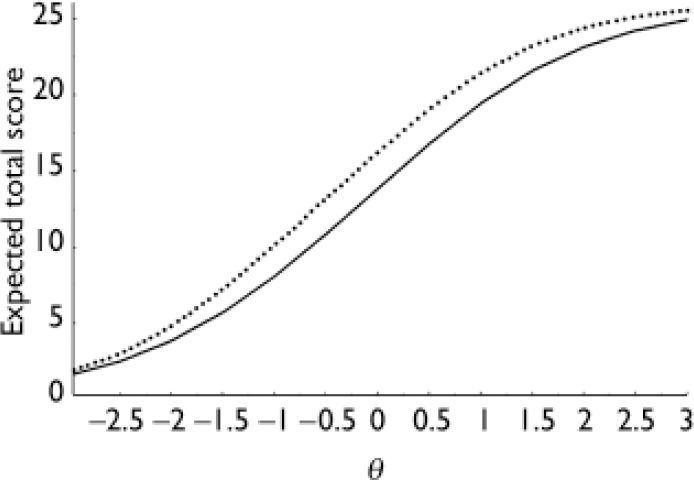
Fig. 2 Characteristics curves for 13-item Psychopathy Checklist – Revised total scores: UK (solid line) v. North American (dotted line).
To quantify differential test functioning, we calculated the root differential test function (rDTF; Reference Raju, Van der Linden and FleerRaju et al, 1995), which indexes the average difference between TCCs in raw score units. For the 13 items included in the three-factor hierarchical model, rDTF was 2.0 points (P<0.001) out of a maximum possible score of 26 and mean score of 9.9 (s.d.=5.5) for the UK; for the 20-item PCL–R total scores, rDTF was 1.8 points (P<0.001) with a mean score of 16.1 (s.d.=8.3) for the UK.
Is the cultural stability of symptoms similar?
To answer this question we examined the TCCs of the three lower-order factors of the hierarchical model for the UK and North American samples. The TCCs for factors 1, 2 and 3 are presented in Fig. 3. The TCC for factor 2 (deficient affective experience) indicated that it was more discriminating than the other factors, with a steeper slope at the point of inflexion; also, it discriminated over a wide range of scores around average values of the latent trait. In contrast, factor 1 (arrogant and deceptive interpersonal style) discriminated well at high levels of the latent trait, but not at low levels; it also failed to reach its maximum score even at high levels of the trait (θ=3.0). This suggests that the interpersonal features of the disorder might be especially useful for measuring psychopathy in people with very high scores on the PCL–R. Factor 3 (impulsive and irresponsible behavioural style) discriminated best at low levels of the trait.
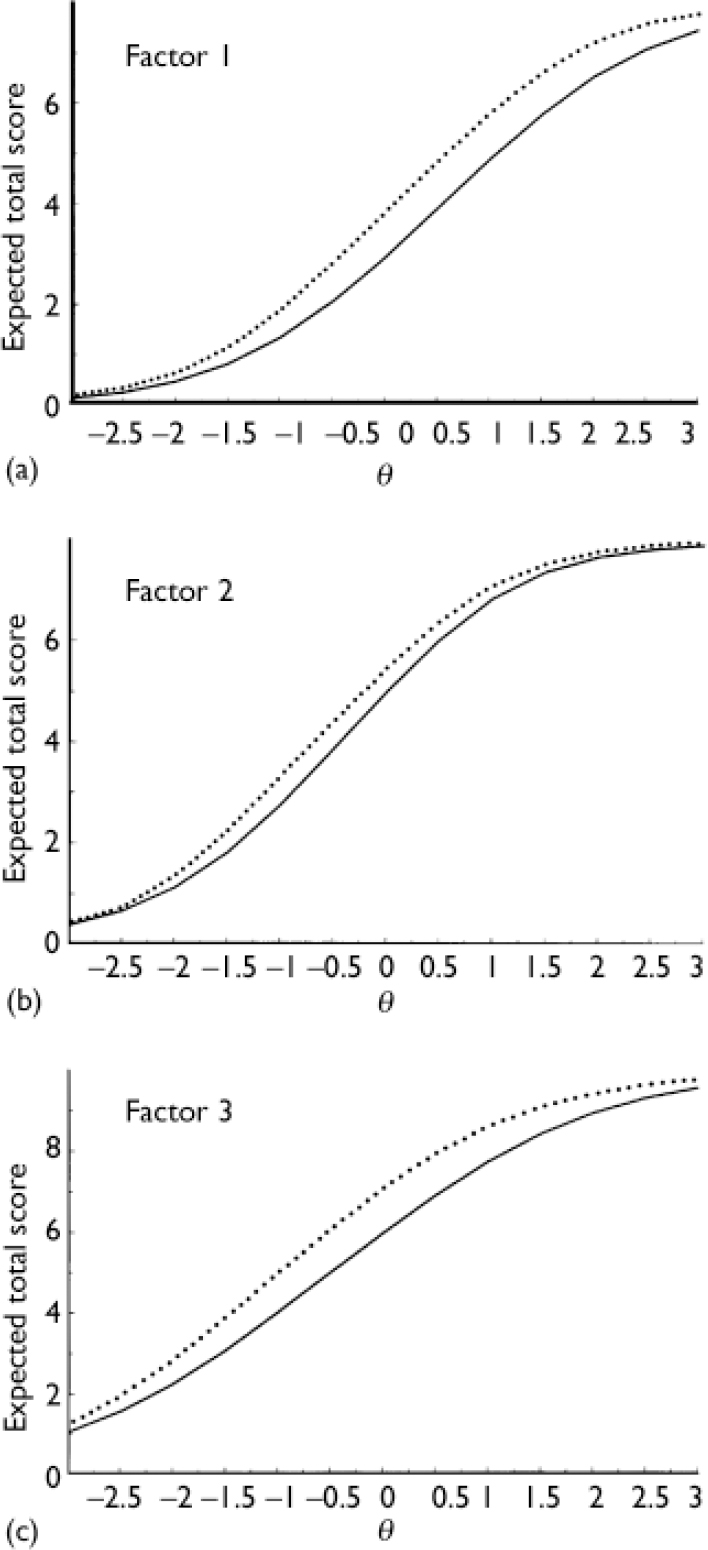
Fig. 3 Test characteristic curves: UK (solid lines) v. North America (dotted lines). (a) Factor 1 scores; (b) factor 2 scores; (c) factor 3 scores.
Next, we equated factor scores across the samples using one anchor per factor as above. We then calculated rDTF. For factor 1, rDTF was 0.7 out of a possible 8 points (P<0.001), with a UK mean score of 2.0 (s.d.=2.0). For factor 2, rDTF was 0.5 out of a possible 8 points (P<0.001), with a UK mean score of 3.4 (s.d.=2.3). For factor 3, rDTF was 0.9 out of a possible 10 points (P<0.001), with a UK mean score of 4.5 (s.d.=2.7). These figures, and inspection of Fig. 3, indicated that the cross-cultural differences were lowest for the affective aspects of the disorder and most marked for the interpersonal features. This pattern is particularly apparent in the range of scores around the recommended diagnostic cut-off point.
Which factor specifies the disorder most accurately?
We estimated factor information functions to provide an estimate of the precision of measurement (Fig. 4). Factor 2 provided the most information across most of the latent trait; only at high trait levels (θ=1.0) did factor 1 provide more information. Factor 3 did not provide the most information at any point of the trait, despite the fact that it comprises more items than the other factors (five rather than four).
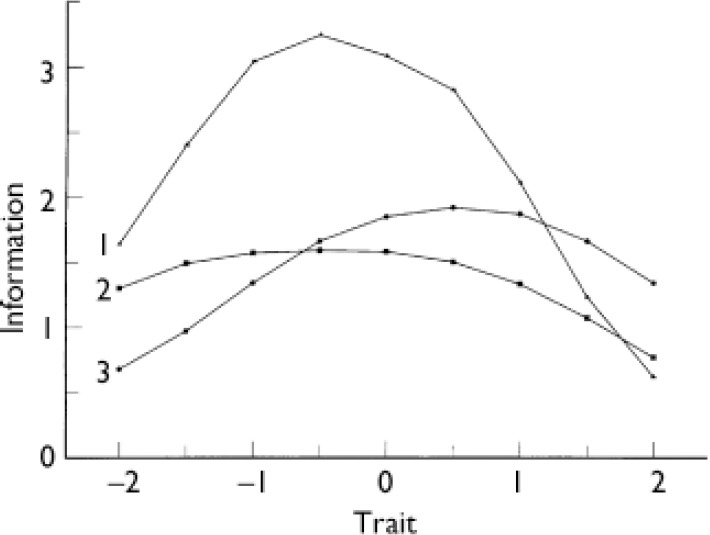
Fig. 4 Information functions for factors 1, 2 and 3, UK v. North America.
DISCUSSION
Syndromal stability across cultures
We found good evidence of syndromal equivalence in North America and the UK. The confirmatory factor analyses demonstrated that the three-factor hierarchical model previously developed on samples from North America provided a good fit to the UK sample. Specifically, the same items loaded on the same factors, indicating that the same characteristics defined psychopathy in these two settings. Some differences in the magnitude of certain loadings were observed, but these differences were small. Thus, the symptoms of psychopathy can be regarded as having configural stability across the cultures sampled. The estimates of general factor saturation indicated that it was reasonable to consider psychopathy in both the UK and North America as being a coherent syndrome comprising three distinct but highly correlated symptom facets. The fit of the three-factor hierarchical model across cultures provides further support for the generalisability of the model proposed by Cooke & Michie (Reference Cooke and Michie2001) and thereby enhances its plausibility. The comparability of factor structures indicates that the same construct, or latent trait, is being assessed in the two contexts.
Differences in the meaning of PCL–R scores across cultures
Unfortunately, we also found evidence that PCL–R scores obtained in North America and the UK are not directly comparable. Item response analyses revealed that there was some evidence of cross-cultural metric differences in the ratings of psychopathic symptoms and that this was statistically significant and clinically meaningful. Specifically, the slopes of the ICCs and TCCs, an index of the discriminating power of item and test scores respectively, were either identical or very similar across cultures. This provides further confirmation that psychopathy was defined by the same symptoms in North American and UK samples. However, the intercepts of the ICCs and TCCs, an index of the difficulty or extremity of item and test scores, were significantly different across cultures. In general, PCL–R total, factor and item scores were lower in the UK than in the North American sample, given equivalent standing on the latent trait of psychopathy. The cultural bias observed was similar to that reported in previous research (Reference Cooke and MichieCooke & Michie, 1999), although somewhat smaller. Relative to raw total scores, differential test functioning was particularly large for total scores based on the 13 items included in the three-factor hierarchical model; it was largest for factors 1 and 3 of the hierarchical three-factor model, suggesting that symptoms reflecting deficient affective experience might be more stable across cultures.
Equating PCL–R scores by adjusting for the rDTF of 2 points may, at first glance, appear to be a slight adjustment. However, the mean total 20-item PCL–R score for the UK sample was 16.1 (s.d.=8.3) and the mean total 13-item PCL–R score for this sample was 9.9 (s.d.=5.5). Thus, 2 points is a sizeable proportion of these mean scores. Even this apparently slight adjustment can have an important effect. At the individual level of the offender, it can make the difference between indefinite detention or not. From the perspective of a victim, it may make the difference between failure to appropriately detain an offender or not. At the aggregate level, because of its impact on the tail of the distribution, even a small adjustment virtually doubles the number of individuals diagnosed as psychopathic in UK prisons, from 4% to 7%. This could have significant implications in terms of the services that have to be provided. It should be emphasised that this is an average difference, and the degree of variation is affected both by the nature of the symptoms considered and the location of the offender on the trait.
Where are differences in the disorder located?
Examination of individual b i (difficulty) parameters indicated that the differences were greatest for the interpersonal symptoms and least for affective symptoms. When items reflecting these symptoms are combined into the three factors and the TCCs are considered, it is clear that the affective symptoms show the least variation across settings. Examination of the TCC for the arrogant and deceptive interpersonal style factor suggests that there are substantial differences, particularly at the high end of the trait.
Which symptoms are most diagnostic of psychopathy?
Examination of the slope parameter of ICCs and TCCs indicates the symptoms that are most discriminating and therefore provide most diagnostic information at any particular level of the disorder. Generally speaking there is a clear order in both the UK and North American samples, with the symptoms of deficient affective experience being most discriminating, the symptoms of deceptive interpersonal style being the next most discriminating and the symptoms of the impulsive and irresponsible behavioural style being the least discriminating.
The item response analyses revealed other findings of clinical relevance, such as the ordering of the symptoms. Not all symptoms are equal; there is an ordering of symptoms from those that might be evident at low levels of psychopathy through to those that tend to emerge only at high levels of the disorder. From a clinical perspective the affective symptoms are generally most diagnostic and the clinician may wish to focus on these when framing a diagnosis; however, at extreme levels of the disorder the interpersonal symptoms may provide more diagnostic information, particularly in the UK.
The origin of the cross-cultural differences observed in this study is unclear. The cultural facilitation model suggests that complex social processes such as socialisation and enculturation can suppress the development of certain aspects of personality disorders and facilitate the development of others (Reference Weisz and McCartyWeisz & McCarty, 1999). Personality disorders may have a less robust pan-cultural core than major mental disorders as they are generally an exaggeration of prevalent patterns of adaptation within a society.
Strengths and limitations of the study
The individual samples were reasonably large, and the combined samples were very large, thus yielding stable parameter estimates and providing good power for hypothesis tests. Also, the ratings were made by a large number of raters as part of research conducted by various investigators in diverse settings, thus making it very unlikely that there was systematic bias due to the characteristics of raters or participants. However, the study has several limitations. First, the study used only one diagnostic procedure, the PCL–R, and there is thus a danger of mono-method bias. Second, the samples were restricted to adult men. Third, this study only considered the structural and metric properties of the test across cultures; no consideration was given to predictive validity. Given that a primary justification for the use of the PCL–R is its predictive power, empirical investigation of this issue is sorely needed.
Clinical Implications and Limitations
CLINICAL IMPLICATIONS
-
▪ The same symptoms define psychopathic personality disorder in the UK and in North America.
-
▪ The symptoms of deficient affective experience are generally the most diagnostic of the disorder.
-
▪ The North American diagnostic cut-off point of 30 on the Psychopathy Checklist – Revised (PCL–R) does not represent the same intensity of the disorder in the UK.
LIMITATIONS
-
▪ The study was based on only one measure of psychopathy, the PCL–R, and there is thus a danger of mono-method bias.
-
▪ The samples were restricted to adult men.
-
▪ The study did not consider variations in the predictive usefulness of the PCL–R across settings.
Acknowledgements
D.J.C. received support from the Research and Development Directorate of. the Greater Glasgow Primary Care National Health Service Trust to prepare this. manuscript. C.M. received support from the Economic and Social Research. Council (grant L133222704) while carrying out these analyses. We thank all our. colleagues who generously gave us access to their data for the purpose of. these analyses. We also thank Lorraine Johnstone and Caroline Logan for. comments on an earlier draft, and Brian Rae for his continued support.




eLetters
No eLetters have been published for this article.