


A key public health priority is to improve children’s dietary intakes across the socio-economic spectrum. According to the UK National Diet and Nutrition Survey (NDNS), children are consuming too much free sugars, saturated fat and not enough fibre or fruits and vegetables(1). School food contributes to 30 % of a child’s dietary intake, and therefore, school is an important setting for improving diet(Reference Nelson, Lowes and Hwang2). In the United Kingdom, approximately 57 % of secondary pupils consume a school meal at least 4 days per week. This compares to 16 % having a home-packed lunch and 28 % having a mixture of the two. Therefore, 85 % of pupils are purchasing a school lunch on at least one school day per week(3).
In the United Kingdom, food-based standards apply to school lunch provision and foods available across the whole school day, to encourage a healthy balance of nutritional intake and restrict the availability of foods high in fat, salt and sugar(4). However, there is currently no monitoring to check adherence to standards. A recent study found on average 64 % of standards were complied with in a sample of thirty-six secondary schools. No schools achieved 100 % compliance(Reference Pallan, Murphy and Morrison5). Urgent action is needed to improve school food for secondary pupils’, as evidence shows intakes of fruits and vegetables and protein-rich foods decrease from primary to secondary, and the proportion of sweet and savoury snacks increases(Reference Haney, Parnham and Chang6). It is vital that appropriate methods are available to assess the impact of policies, such as those to improve diet, in large-scale evaluations.
Self-reported methods, such as dietary recalls and food diaries, are often used to obtain information on pupils’ food and drink intakes in school. These methods are feasible to use in the school setting; however, they are costly to run and methodological challenges exist(Reference Tugault-Lafleur, Black and Barr7,8) . The subjective nature of these methods can lead to reporting errors due to memory, social desirability and motivation to complete; these issues are well documented and are a particular concern in the adolescent age group(Reference Livingstone, Robson and Wallace9–Reference Subar, Freedman and Tooze11). Advances in technology have led to the development of online tools that are more engaging for adolescents and have streamlined the process of dietary data collection(Reference Livingstone10,Reference Simpson, Bradley and Poliakov12) . However, reporting errors continue to be a challenge. In addition to methodological issues, gaining access into schools to conduct research can be difficult. Existing pressures on school staff mean research opportunities, although considered a benefit to schools, are often declined(Reference Oates and Riaz13).
An alternative approach to obtaining school food intake data may be the use of school food purchase data (SFPD). Individual-level SFPD provides information on the date and time of purchase, details of the food/drink item purchased, item cost and free school meal (FSM) status of the pupil purchasing the item. Utilising SFPD to explore pupils’ dietary intakes and patterns at school provides an alternative approach, where traditional methods are unfeasible, and simplifies the data collection procedure for both the researcher and the school. SFPD can be obtained without disruption to teaching and without the need for researchers to be present in school; therefore, reducing the burden on schools and pupils. Using SFPD to assess pupils’ dietary intakes will allow larger sample sizes of schools and pupils, covering the whole school day (including break), and across all levels of deprivation, whilst maintaining consistency of methods, fundamental for effective evaluation of policies.
Over the last decade, there has been a rapid increase in the use of commercial food purchase data, such as supermarket sales data, in public health nutrition research(Reference Bandy, Adhikari and Jebb14). These data enable researchers to explore the dietary patterns of a large population. The information is objective, can have wide geographical coverage and is a useful indicator of dietary choices(Reference Bandy, Adhikari and Jebb14). Food purchase data have been used to evaluate the impact of dietary interventions and national policies, such as sugar taxes and food assistance programs(Reference Jenneson, Pontin and Greenwood15,Reference Spence, Matthews and McSweeney16) . A recent systematic review concluded that supermarket sales data was useful for longitudinal dietary surveillance and can be used to better understand food purchase behaviours in high- and middle-income populations(Reference Jenneson, Pontin and Greenwood15). Jenneson et al. (2021) compared dietary intake estimates from supermarket transaction data with an FFQ and found the strongest agreement for single-person households and loyal customers(Reference Jenneson, Greenwood and Clarke17). It could therefore be hypothesised that dietary estimates derived from SFPD may provide good agreement with self-reported dietary intakes as items are usually purchased and consumed by the same individual. However, the level of detail available in SFPD and the ability to link to nutrient data warrants exploration. There is little published research exploring the use of SFPD as a method of estimating dietary intakes. The current study explored the procedures to obtain these data and the potential opportunities and limitations of using these data to estimate food and nutrient intakes in a sample of secondary schools in northeast England.
Aims and objectives
The key aims were (i) to explore the use of secondary school pupils’ food purchase data as a potential method to estimate pupils’ food and drink intakes across the school day and (ii) explore the potential to link purchased items to food groups and food composition data. The objectives were:
-
To ascertain the detail and variation in item descriptions (i.e. the description of the item purchased, e.g. ‘jacket potato’ or ‘toast’) contained in the data from the different schools and create overall item categories
-
To determine the proportion of purchased food and drink items that could be linked to an Intake24 food group
-
To determine the proportion of purchased food and drink items that could be linked to a food code from the UK NDNS Nutrient Databank (NDB)
Methods
Study setting and data collection
Existing links with a school trust facilitated purchase data capture (n 7 schools). Information about the study was shared with the school heads and the directors of IT and communications for the schools, and an opportunity to ask questions was given. It was emphasised that as SFPD are anonymised, no pupils would be identifiable. A 4-week data collection period (7th November 2022 to 2nd December 2022) was selected to take account of the 4-week school menu cycle and avoid school holiday periods and bank holidays. A token of thanks was given to the schools for their time.
In order to support the ethics application, a data management plan and a data protection impact assessment were created. The data protection impact assessment highlighted the requirement of a data sharing agreement (to be provided by the schools) and a privacy notice provided by the research team; the latter was necessary as the data was being used in a way that was not its original intended purpose.
An MS Excel spreadsheet (encrypted with a password) containing all school food purchase transactions across the whole school day for the 4-week period was sent to the research team via the school’s IT manager. The data included pupil purchase card number, date of purchase, time of purchase, item description (i.e. the food or drink purchased), quantity purchased, cost (£) of the item and whether the pupil received free school meals or not.
Due to access issues within the schools at the time of data download, data could not be captured for two of the schools; this was an internal IT issue and beyond the researchers’ control. However, the five schools included in the data represented a range of geographical locations.
Data formatting
Data were formatted using MS Excel and Stata v18. Data from each school were merged into one dataset. Staff purchases and purchases made by pupils in years 12 and 13 were removed from the data as they are able to buy food and drink off-premises. Meal type (breakfast, break or lunch) was assigned to each food and drink item in the dataset according to the time it was purchased. Before 9 am was assigned ‘breakfast’, between 9 and 12 pm was assigned ‘break’ and 12 pm onwards was assigned ‘lunch’. These times were in accordance with the school timetable issued on the school websites.
Food and drink item descriptions in the dataset were derived from the labels on the till buttons operated by school canteen staff at the point of purchase. Due to variations in item descriptions across the schools, items were grouped into categories to combine similar items (see online supplementary material, Supplementary Material 1). These were created by the first researcher and agreed/reviewed by the second researcher.
Linking purchased items with food composition data and food groups
To explore the potential to link purchased items to food groups and food composition data and consider the level of analysis that could be performed, food and drink item descriptions in the data were coded at two levels (Fig. 1). Firstly, purchased food and drink items were linked to an Intake24 food group. These food groups are contained within the Intake24 system which is the dietary assessment tool used in the UK NDNS(18). The proportion that could be assigned to a food group was calculated (see Fig. 1).
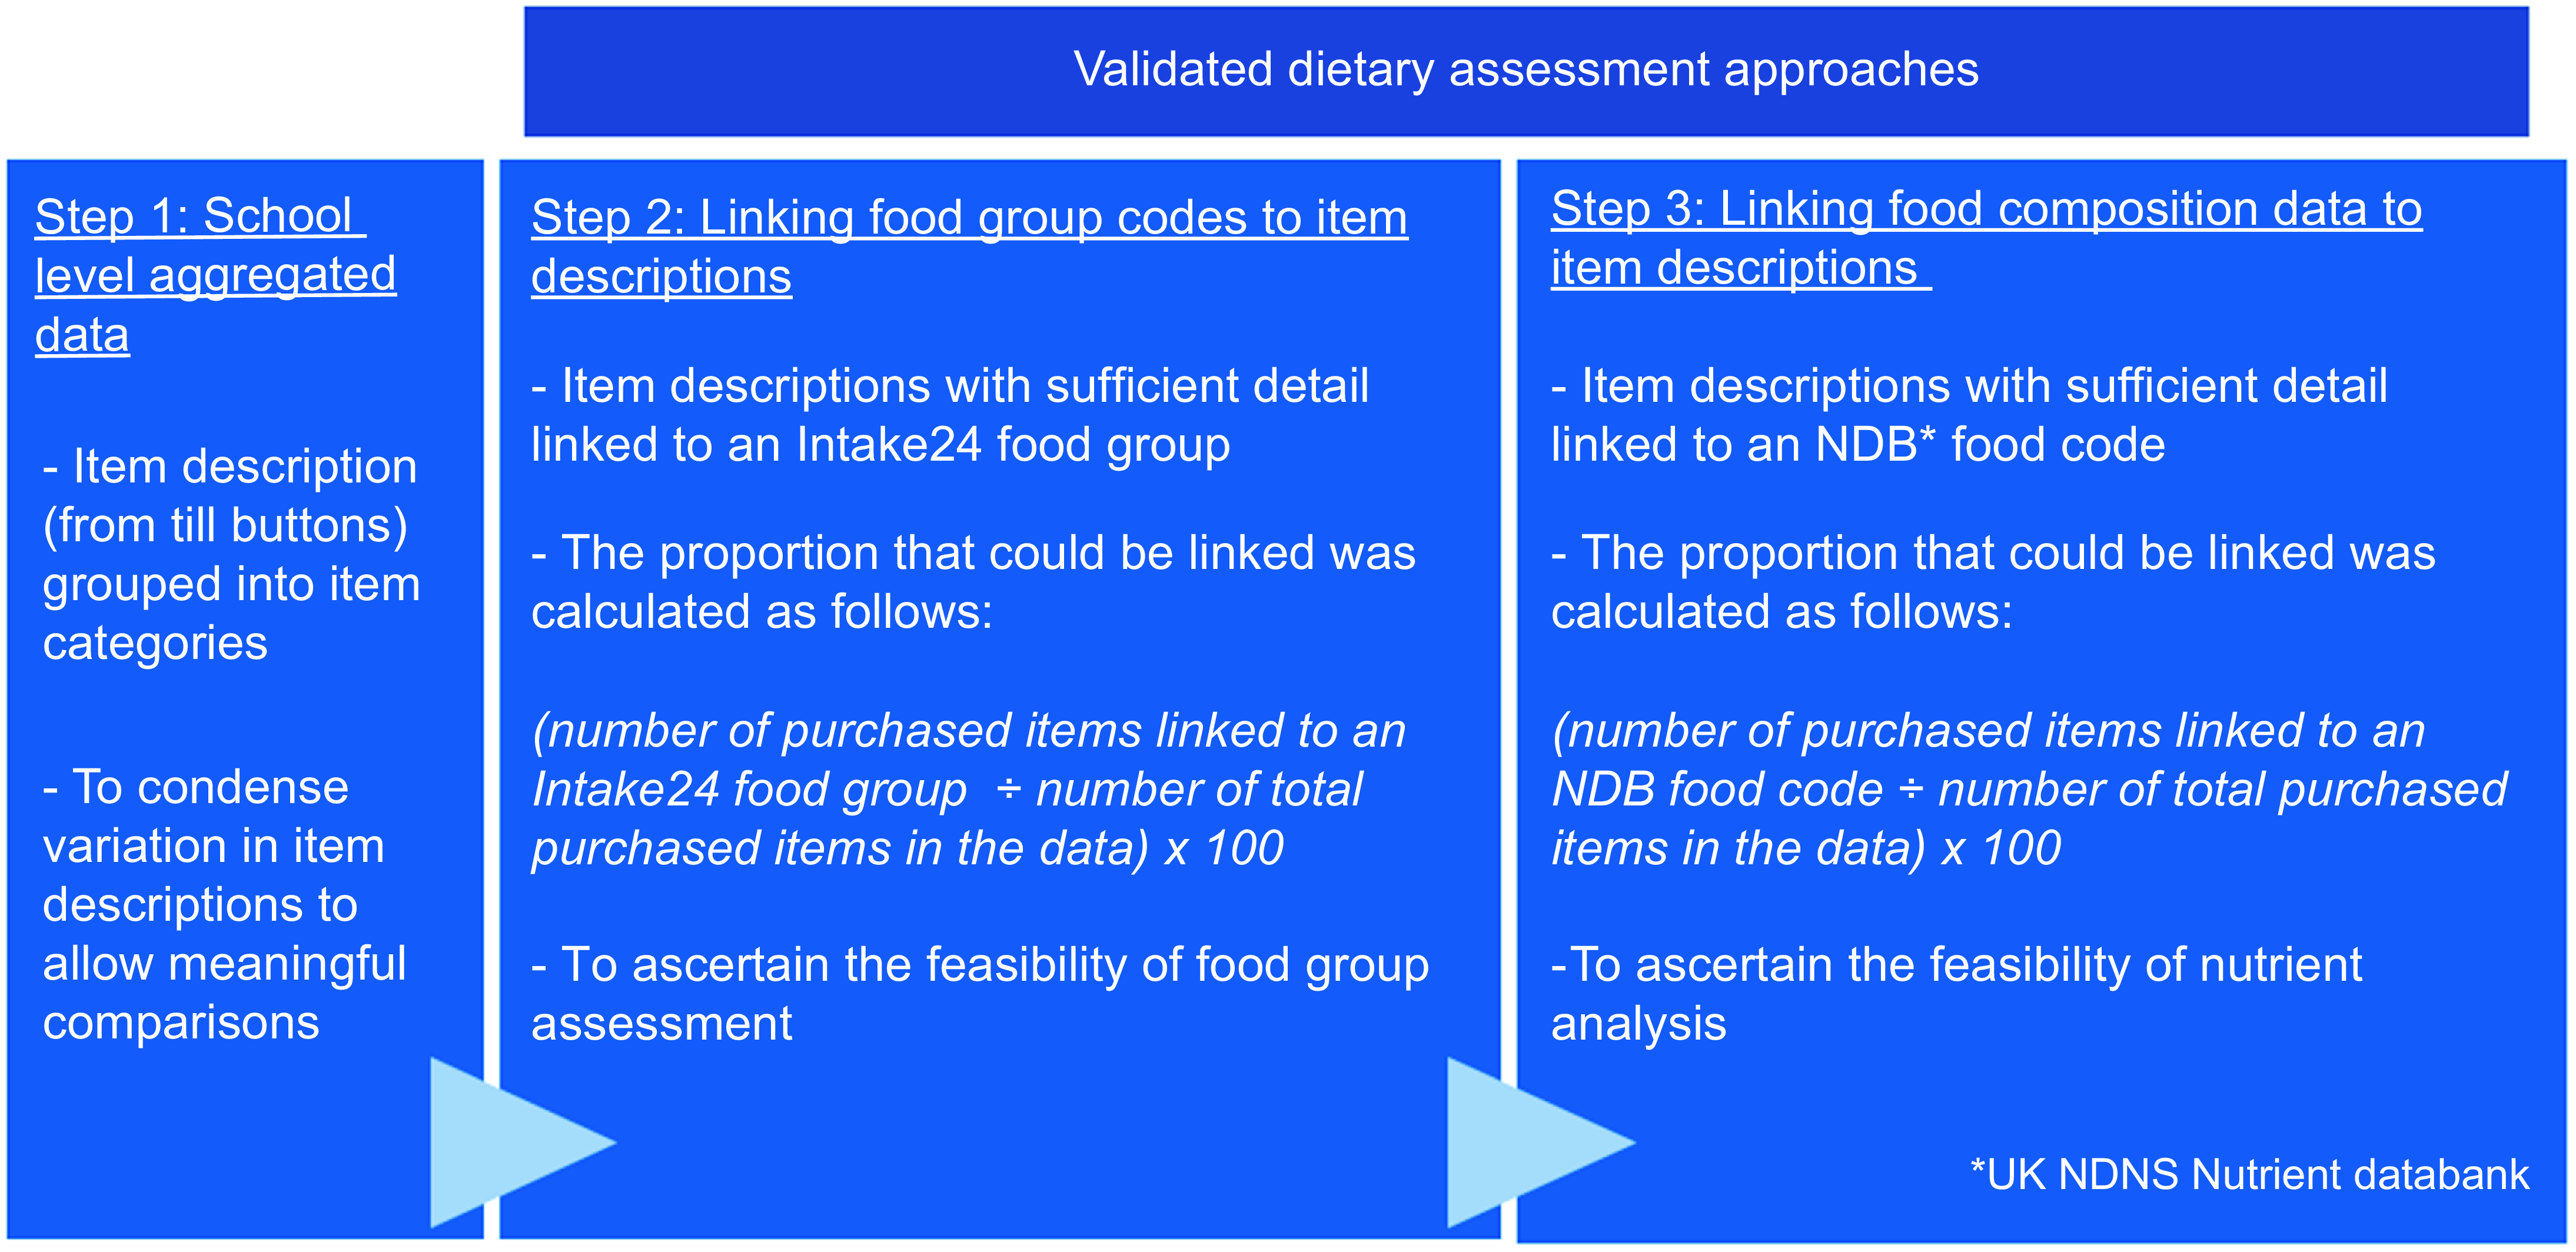
Figure 1. The process of data formatting and coding to ascertain the potential level of dietary assessment.
Secondly, purchased food and drink items were linked to a nutrient code from the UK NDNS NDB; the food composition database was developed for the UK NDNS(18). Nutrient analysis could not be conducted as there was no portion size consumption data available. However, food and drink item descriptions in the data were matched with NDB nutrient codes to ascertain the potential of nutrient analysis using purchase data. For some main dishes, menus available from the school websites were referred to for clarification on the type of meal. For example, ‘Chinese noodles’ was a vegetarian option on the menu and was therefore coded as ‘vegetable chow mein’ (the closest match in the NDB), rather than a code with meat. The item description ‘Italian chicken’ was a pasta dish of the day and was therefore coded as ‘pasta with meat in a tomato-based sauce’. School menus were also checked for information about how the food was served. For example ‘meatball melt’ was served in a sub roll, which resulted in two NDB codes being assigned: ‘meatballs in a tomato sauce’ and ‘rolls, white soft, not fortified’. The proportion of items that could be linked to an NDB nutrient code was calculated. To assess inter-coder reliability, a second coder independently assigned NDB codes and food groups to a subset of item descriptions (20 %). The most commonly purchased items were selected, removing duplicates. The percentage agreement was calculated.
Results
Pupil-level purchase data was obtained for five of the seven secondary schools. Refunded items (indicated by a negative cost value) were removed from the data; these only accounted for 0·3 % of total purchases. The data captured a total of 3466 pupils over a 4-week period in November 2022. Using figures available from local council websites, a total of 4330 pupils were enrolled across the five schools. Therefore, approximately 80 % of pupils purchased at least one food or drink item at school within the 4-week period.
Variations in item descriptions
A total of 119 125 purchases were made by pupils at the five schools. In total, there were 367 different food and drink item descriptions in the dataset. These were derived from the labels on the till buttons in the canteen and varied by school. Identical items had slightly different item descriptions, which could be grouped together into item categories to allow meaningful comparisons. For example ‘Fresh Fruit Pot’, ‘Fresh Fruit Salad’, ‘Fruit pot all’ and ‘Fruit Salad’ were grouped into the item category ‘Fruit pot’. Similarly, ‘Bacon & Sausage Bun’, ‘Bacon Bun’, ‘Bacon Sandwich Large’, ‘Bacon Small’, ‘Breakfast Bun’ and ‘Sausage bun’ were all grouped into the category ‘Bacon/sausage bun’. The variation in how food and drink items were described across the five schools and all the categories created can be seen in online supplementary material, Supplementary Material 1.
Linking with Intake24 food groups and Nutrient Databank food composition data
Ninety-two percent (n 336) of item descriptions were assigned an Intake24 food group (Fig. 2). These accounted for 82 % (n 97 821) of total purchases. Of these, n 258 item descriptions contained enough information for an NDB nutrient code to be assigned (Table 1). These accounted for 60 % of total purchases. Some items (n 32) were linked to two or more food codes, for example, ‘meatballs & spag’ required both ‘Meatballs in tomato sauce’ and ‘Pasta spaghetti boiled white’. Similarly, the item description ‘beef stir fry & rice’ required two codes; ‘Beef stir fry’ and ‘White rice basmati boiled’. The coding scheme is provided in see online supplementary material, Supplementary Material 2.
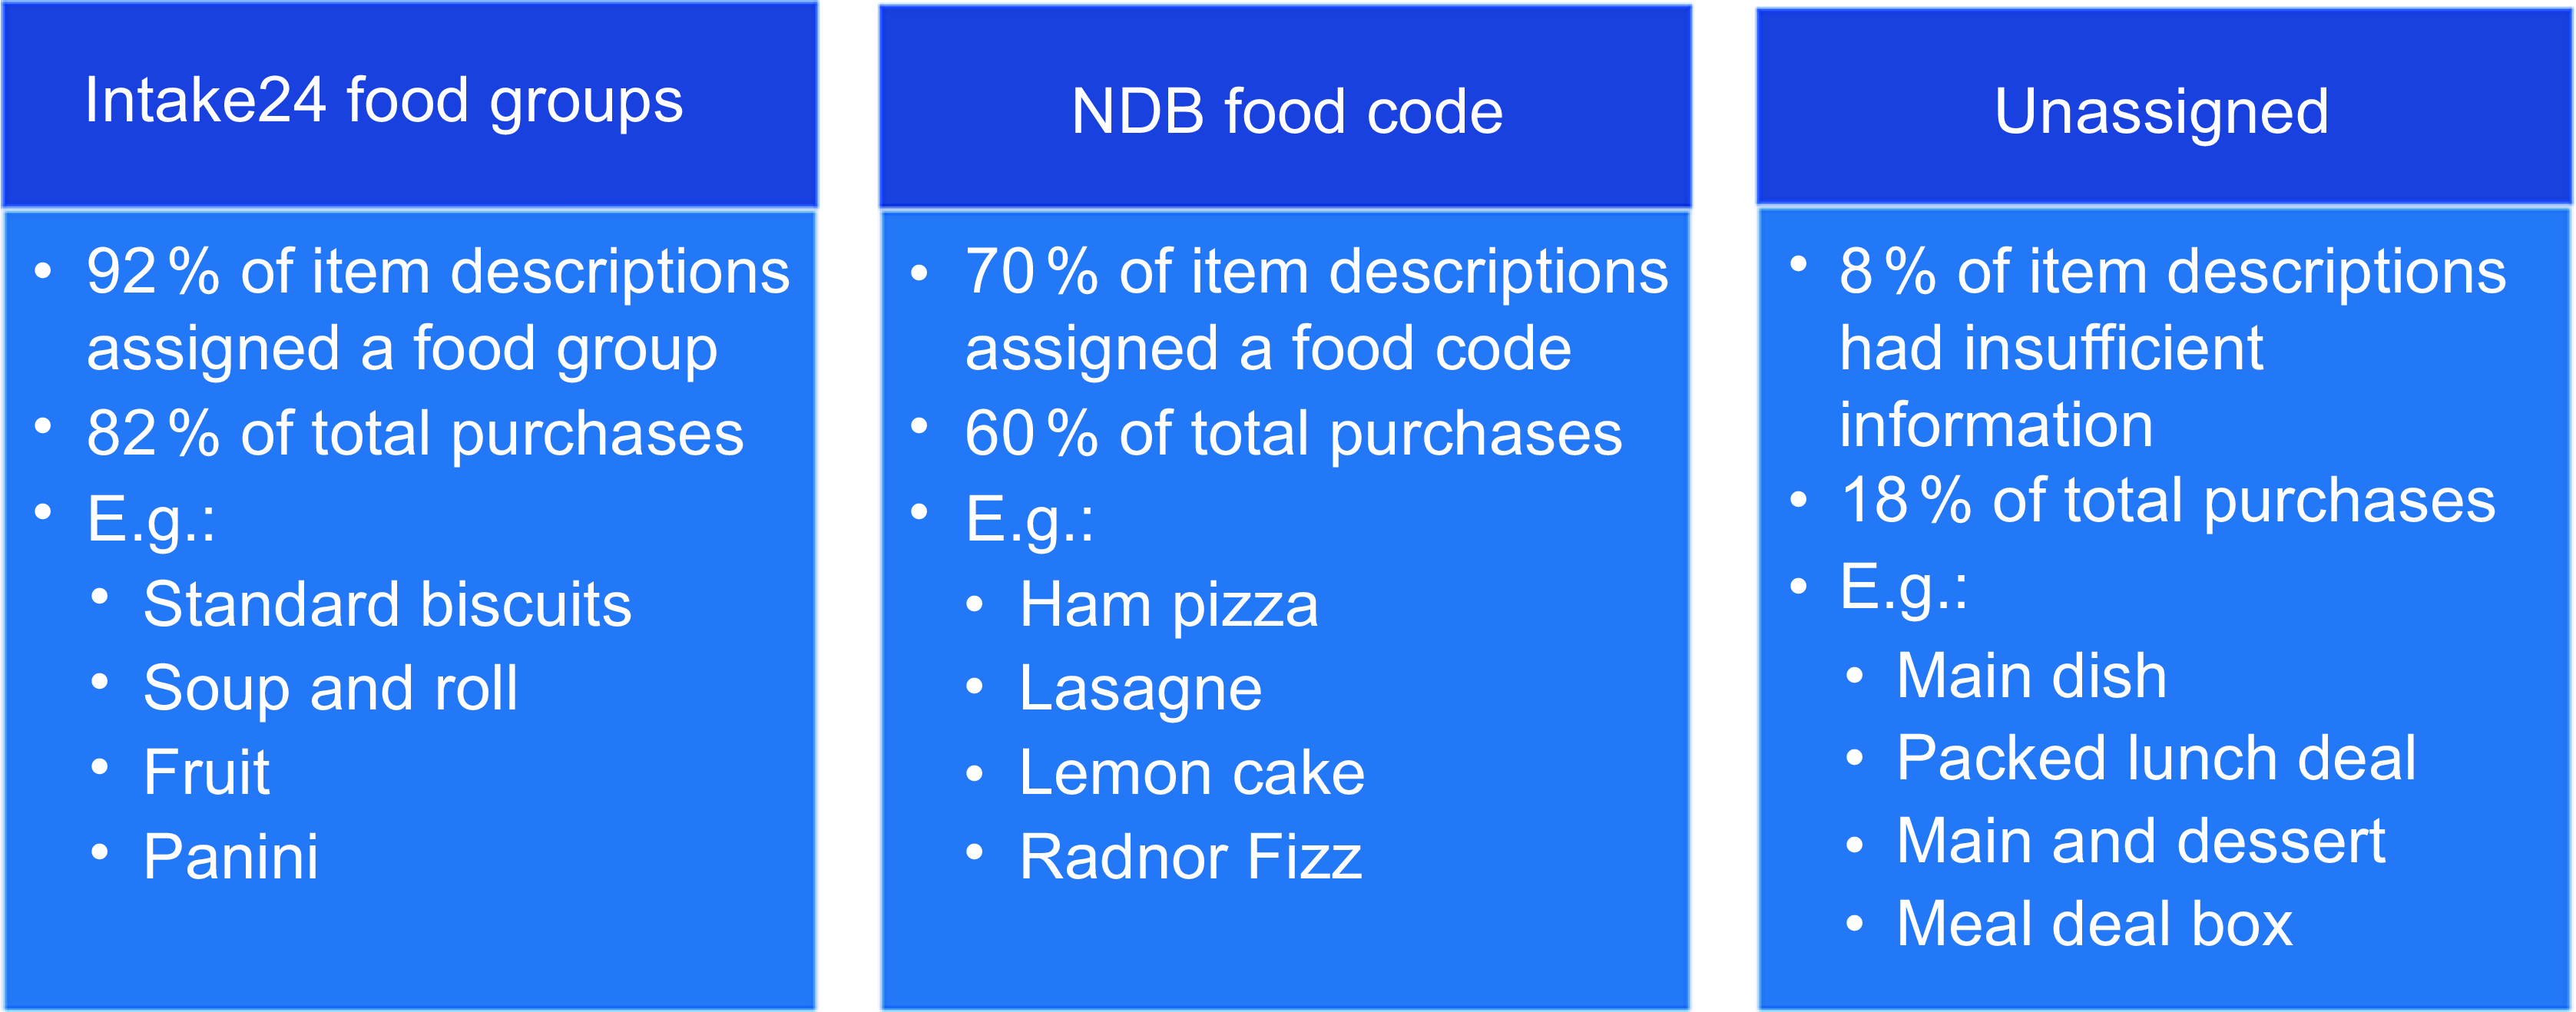
Figure 2. Proportion of food and drink item descriptions that were linked with Intake24 food groups, NDB food composition data and unassigned to either. NDB, Nutrient Databank.
Table 1. Item descriptions that were assigned both an Intake24 food group and a nutrient databank code, or a food group only, or neither
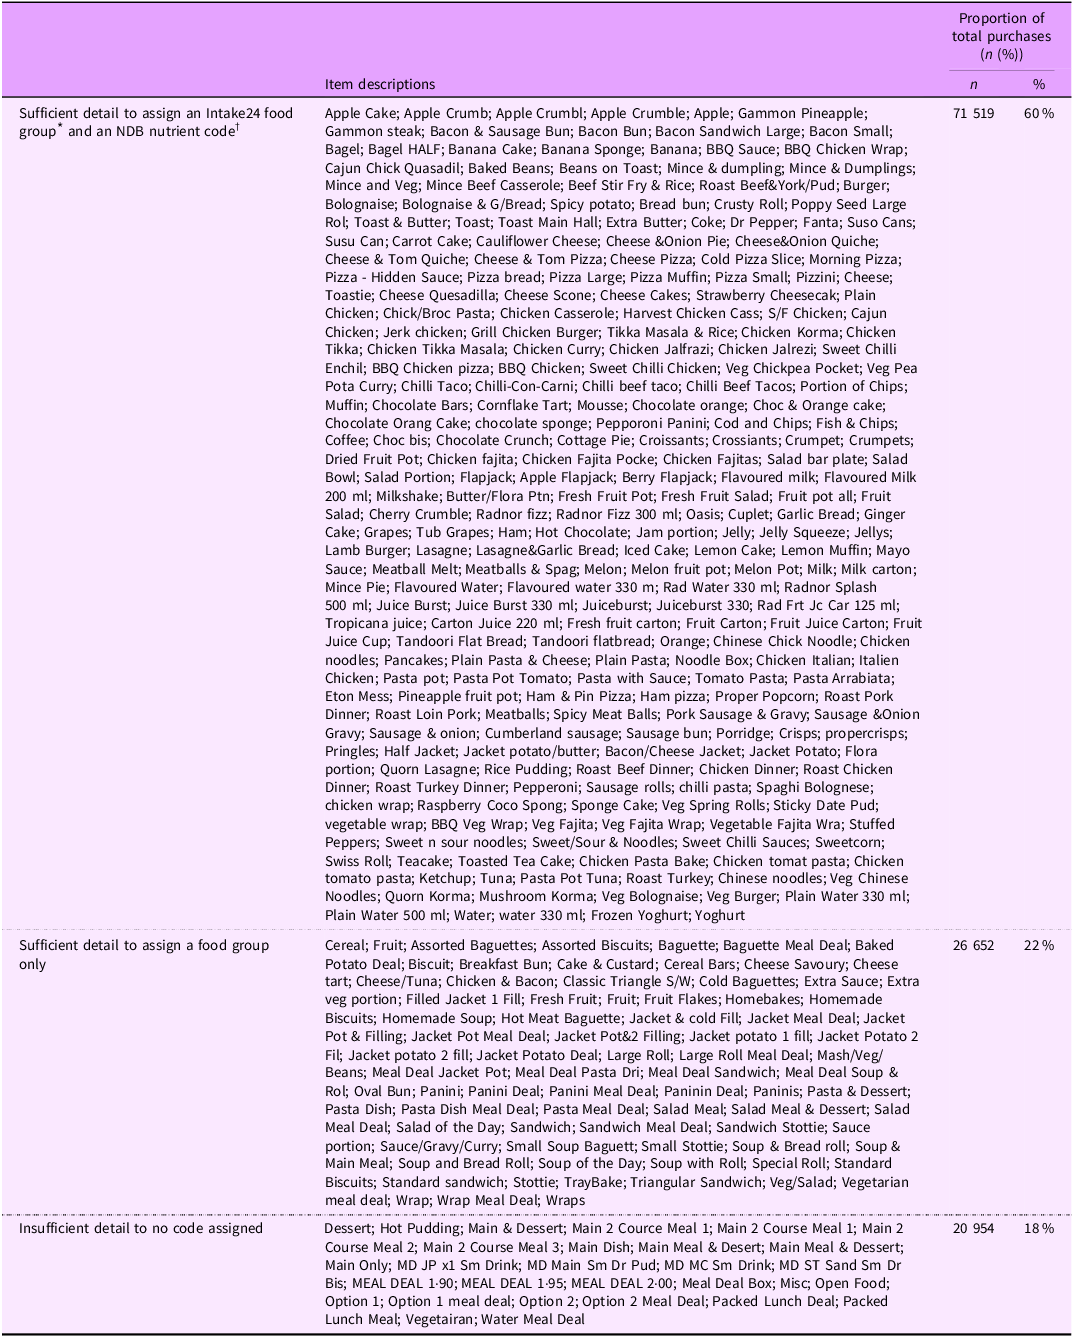
NDNS, National Diet and Nutrition Survey.
* Intake24 food groups.
† NDNS nutrient databank code.
Eight percent (n 29) of item descriptions could not have a food group or NDB code assigned due to lack of information. These included items such as ‘Main Dish’ code assigned due to lack of information. These included items such as ‘Main Dish’, Main Meal and Dessert and Packed Lunch Deal. These accounted for 18 % (n 20 954) of total purchases across the 4-week menu cycle (Fig. 2; Table 1). The proportion of purchases that were assigned an NDB code ranged from 49 % in school 2 to 71 % in school 3 (Table 2). The proportion of purchases that were assigned a food group ranged from 66 % in school 2 to 90 % in school 5.
Table 2. The proportion of total purchases that were assigned a nutrient databank code and an Intake24 food group, by school
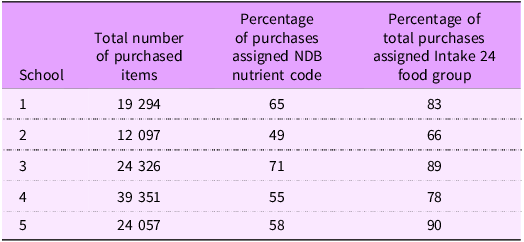
NDB, Nutrient Databank.
The percentage agreement between the two independent coders was 65 % for NDB nutrient codes and 90 % for food groups. Discrepancies in NDB codes occurred amongst fruit juice-based drinks. For example, ‘Fruit juice cup’ was assigned the NDB code ‘Mixed fruit juice pasteurised’ by the first coder and ‘Fruit flavour drink, no juice, ready to drink’ by the second coder. Although there was very good agreement for food groups, discrepancies were evident for some drinks, for example, ‘Flavoured water’ was assigned the food group ‘Water’ by the first coder and ‘Other carbonated drinks (not diet)’ by the second coder.
Discussion
The findings indicate that SFPD is a feasible approach for assessing dietary intakes in secondary school pupils, and the linkage to food groups and nutrient codes was possible for the majority of purchased items. Extensive data formatting was required to ensure consistency across the five datasets. There was variation in item descriptions due to different labels on individual school canteen till buttons; however, it was still possible to group the food and drink items into similar categories (see online supplementary material, Supplementary Material 1). The level of detail in the food and drink categories could be adapted depending on the information required and the purpose of the research question. In this study, hot meals were categorised into baguette, beef, burger, chicken, fish, ham/gammon/pork, sausage and vegetarian. These could be combined into an overall ‘hot meals’ category if the type of meal was not required.
Potential for food group analysis
Overall, 82 % of total purchases were assigned an Intake24 food group. These food groups were developed and modified by researchers at HNERC, Newcastle University. They have been used in numerous food studies and are part of the Intake24 dietary recall tool(19). Food group analysis allows intakes of similar foods to be quantified and dietary patterns explored. Food group analyses using SFPD would allow the combination of foods and drinks bought together to be explored, including differences in purchases by FSM and non-FSM pupils and across different year groups (years 7 to 11). These analyses would contribute to ongoing work exploring the factors influencing pupils’ food and drink choices and improving our understanding of the school environment, highlighting areas for potential intervention(Reference Woodside, Adamson and Spence20–Reference Devine, Gallagher and Briggs22).
In 2014, nutrient-based standards for UK school lunches were removed, leaving food-based standards only. These standards have been ‘designed to help children develop healthy eating habits, and ensure that they have the energy and nutrition they need to get the most from their whole school day’(4). They include
-
one or more portions of vegetables or salad as an accompaniment every day
-
one or more portions of fruit every day
-
a dessert containing at least 50 % fruit 2 or more times each week
-
at least three different fruits and three different vegetables each week
Food group analysis of school food purchases at lunchtime could allow comparisons between pupils’ lunchtime purchases and government standards to be explored. This will highlight the effectiveness of the standards in encouraging children to eat a healthy diet at school and inform intervention development and potential policy changes.
Potential for nutrient analysis
Seventy percent of food and drink item descriptions had enough detail to allow an NDB code to be allocated; this equated to 60 % of total purchases (Table 1). A crucial limitation is the lack of portion size information to allow nutrient content to be calculated and whether purchase equals consumption. There is scope for age-appropriate average portion sizes to be used, such as published average portion sizes(Reference Wrieden, Longbottom and Adamson23,24) . Lambert et al. (Reference Lambert, Plumb and Looise25) explored the validity of purchase data as a method of monitoring school food intakes, and variations in portion sizes were assessed. Actual portions of eighty foods on the school menu were weighed and an average was calculated. The authors reported that the average actual portion sizes compared favourably with published portion data, used widely in dietary assessment, and therefore, this approach may offer a solution to the lack of portion sizes in SFPD. Lambert et al. (Reference Lambert, Plumb and Looise25) also compared observed food and drink purchases in the school canteen with items recorded in the purchase data and found a 96 % accuracy rating. However, this study was conducted at an all-boys school and a considerable time ago; therefore, the generalisability of the findings should be considered, along with, potential changes to food and drinks on offer in secondary schools. Overall, the findings from the present study along with previous literature show promise and support further exploration of the use of purchase data as a potential method of dietary assessment.
Variation in the proportion of purchased items linked to a food group and an NDB nutrient code was evident between schools (Table 2). For school 5, although 90 % of purchases were assigned a food group, only 58 % were assigned an NDB code. This was due to a large number of item descriptions such as ‘tray bake’, ‘sandwich’ and ‘pasta dish’ for which the food groups ‘cakes’, ‘cereal based savouries’ and ‘pasta’ were assigned, respectively, but no NDB code could be assigned due to a lack of information on the exact item. The lowest proportions were seen in school 2, where 49 % and 66 % of purchases were assigned an NDB code and food group, respectively. This was due to a high number of purchases with generic descriptions, i.e. ‘main 2 course meal’ and ‘packed lunch deal’, for which neither an NDB code nor a food group could be assigned. In a previous study, the till buttons used by canteen staff were amended to describe the purchased item in more detail; this may be a potential solution for the future development of the method(Reference Spence, Matthews and McSweeney16).
Inter-coder reliability was very good for food groups (90 %). Agreement was lower for NDB coding (65 %), which was expected due to the vagueness of some item descriptions and the array of possible nutrient codes in the NDB. The best practice would be to agree as a team on the most suitable NDB code and food group and be consistent throughout the data. Further information could be obtained from schools for specific items, for instance, the types of drinks, to ensure the most appropriate NDB code and food group is assigned.
Strengths and limitations of using purchase data
The key advantage of using purchase data over dietary intake data is the quantity of data available. Our data captured a total of 3466 pupils, which was approximately 80 % of pupils attending the five schools. In addition, the data are objective and therefore less susceptible to the biases associated with self-reported intake data(Reference Appelhans, French and Tangney26). Data across the whole menu cycle can be obtained and information on the time of purchase allows purchasing patterns across the school day to be explored. FSM data enables comparisons between purchases made by pupils receiving FSM and those paying for lunches to be examined, potentially highlighting areas of inequalities among FSM pupils; a group that can often be underrepresented in research studies(Reference Bonevski, Randell and Paul27).
Although SFPD can be useful in exploring food choices in secondary school pupils, only items purchased on school premises can be explored; information regarding packed lunches brought from home and items purchased from shops on the way to school are not included. There are limitations in its use as a dietary assessment method. Firstly, these data lack crucial information on portion sizes (as mentioned previously), cooking methods and additions, which are required for accurate nutrient coding. An absence of detailed information meant assumptions were made when assigning the most appropriate NDB nutrient code. For instance, the toast was coded as ‘BREAD, 50 % WHITE AND 50 % WHOLEMEAL FLOURS TOASTED’ as the specific type of bread was unknown. Cod in batter was coded as ‘COD IN BATTER FROZEN BAKED’, but for some schools, the fish may have been fried. Additions, such as butter or jam on toast, are unknown; however, butter is likely to have been offered and this could be added as an assumption. Eighteen percent of purchases did not have a food group or an NDB code assigned due to a lack of information in the item description (Table 1). However data on ‘meal deals’, ‘pack lunch deals’ is still of interest in understanding pupils’ purchasing decisions at school. Although meal types were assigned to the data (breakfast, break, lunch), no analysis was conducted on this. Pre-ordered lunches go through the tills in the morning period, and it was difficult to separate pre-ordered items and items purchased by pupils. This finding will be explored in future work. The types of and variation in purchases across the school day are important for intervention development, as evidence indicates pupils may purchase their lunch during breaktime, at which the availability of fruit and vegetables, may be limited(28). As mentioned, the possibility of changing till buttons to provide more information in the data warrants consideration for future development.
Data could not be obtained for two of the schools due to technical issues at the time of download. This did not impact the project aims for this study; however, it is worth considering this as a potential challenge when designing a study using SFPD.
This explorative study has shown how purchase data can be used to provide an objective insight into pupils’ food and drink purchasing habits at school. The use of purchase data to assess food group intakes offers huge potential, both as a monitoring tool and as an evaluation method for school-based interventions aimed at improving food and drink choices(Reference Spence, Matthews and McSweeney16). The application is relevant beyond the UK, with cashless purchasing systems being used globally(29,30) . Future work comparing SFPD with self-reported food and drink intakes, such as dietary recalls, is needed to determine the level of agreement with an established dietary assessment method. However, there is scope for both methods to complement each other.
SFPD provides a novel, consistent approach to capturing school food intake data, from all secondary pupils, across the school day and across the socio-economic spectrum, enabling the development of large-scale interventions and policy evaluations, at both the local level and across regions. Furthermore, this work addresses key challenges of dietary assessment in adolescents and supports the need for novel dietary assessment methods(Reference Livingstone10,Reference Subar, Freedman and Tooze11,Reference Foster and Bradley31) .
Supplementary material
For supplementary material accompanying this paper visit https://doi.org/10.1017/S1368980025000527
Acknowledgements
We would like to acknowledge the schools and school managers for assisting us with the project and providing the anonymised food purchase data.
Authorship
Both J.B. and S.S. contributed to formulating the research question and designing the study. J.B. analysed the data and drafted the manuscript. J.B. and S.S. reviewed the manuscript.
Financial support
This work was funded by the Newcastle University QR Policy Support Fund. The funder had no role in the design, analysis or writing of this article.
Competing interests
There are no conflicts of interest.
Ethics of human subject participation
This study was conducted according to the guidelines laid down in the Declaration of Helsinki and all procedures involving research study participants were approved by the Faculty of Medical Sciences Ethics Committee, Newcastle University (ref: 2482/26614). All data was anonymised therefore participant consent was not obtained.


 Open access