


In considering the outcome of a national election, the usual first question, as far as domestic politics goes, is “How’s the economy doing?”
Michael S. Lewis-Beck and Mary Stegmaier (Reference Lewis-Beck and Stegmaier2019)
1. Introduction
There is a positive relationship between the economy and incumbent support (Kramer, Reference Kramer1971; Fair, Reference Fair1978; Fiorina, Reference Fiorina1978; Hibbs Reference Hibbs and Douglas2000; Lewis-Beck and Lobo, Reference Lewis-Beck and Costa Lobo2017; Lewis-Beck and Martini, Reference Lewis-Beck and Martini2020). And the evidence is robust,Footnote 1 initially documented by linking objective measures of economic health with realized incumbent support (a century ago, Barnhart Reference Barnhart(1925) correlated drought in areas of Nebraska with support for the Populist PartyFootnote 2), and more recently by turning to individual-level survey data in which self-reported assessments of the economy are powerful predictors of approval of the current government or self-reported vote and voting intentions.Footnote 3 It is the latter body of evidence that is the focus of this paper, in which we provide a cautionary brake on how to interpret the patterns found in individual survey data by highlighting the potential for reverse causality, and describing two previously neglected scope conditions: the phrasing of how economic evaluations are elicited, and the placement of these questions within the broader survey.
The positive association between evaluations of the economy and of the current leadership has been used to defend a theory of retrospective voting, in which voters evaluate how the economy has been doing recently and then either support or punish the incumbent accordingly. Such an interpretation must assume that the self-reported assessment of the economy is exogenous to subsequent evaluations of the current government. Put differently, scholars must assume that the objective state of the economy influences an individuals perception of it, and this perception then conditions their approval/vote intentions. However, we show that economic evaluations are themselves endogenous to co-partisanship with the presidentFootnote 4 and identify two dimensions by which the magnitude of this reversed relationship is stronger: the extent to which the question about the economy is phrased sociotropically and the extent to which the rest of the survey includes political questions. We argue that both of these dimensions prompt respondents to behave more like cheerleading partisans who condition their self-reported assessment of the economy on whether a co-partisan president sits in the White House.
In the following sections, we first define the concepts of socio- and egotropism and link them with a Zallerian model of considerations (Zaller, Reference Zaller1992), which forms the foundation of our intuition. This theoretical intuition generates two hypotheses that we take to the data, both of which lead us to expect that survey design can, unintentionally, elicit stronger or weaker partisan responses to questions that are nominally apolitical (such as the state of the economy). We employ a wide range of methods to evaluate our daily Gallup survey data, including variable importance tests, regression discontinuity design, and Bayesian changepoint analysis. Our results confirm both hypotheses, highlighting the vulnerability of nominally apolitical questions to partisan bias due to two dimensions of survey design: question wording and survey composition.
By providing descriptive evidence of (1) the possibility of reverse causality between economic evaluations and political approval and (2) the extent to which minor differences in question wording and survey design can inflate these associations, we sound a note of concern about the validity of vote choice functions which test retrospective voting using subjective economic evaluations. However, our contribution only speaks to the individual-level survey data that has constituted the majority of recent work on this topic. As such, we acknowledge the aggregate patterns that link objective economic conditions with voting behavior (e.g. Wlezien, Reference Wlezien2015). Furthermore, our contribution doesn’t mean that some of the causally identified experimental work on this topic is similarly vulnerable to reverse causality concerns (Simonovits, Reference Simonovits2015). Nevertheless, we provide an additional dimension on which survey design can inflate or depress associations in observational data that are the bedrock on which theoretical consensus is drawn and connects with the rich literature on survey design (Gideon, Reference Gideon2012; Vannette and Krosnick, Reference Vannette and Krosnick2017; Malka and Adelman, Reference Malka and Adelman2023).
2. Related literature
Scholars have long understood the sensitivity of survey self-reports to question wording and survey design. Wording effects such as whether to “allow” or “forbid” a certain behavior can produce dramatically divergent conclusions about public sentiment (Schuman and Presser, Reference Schuman and Presser1981). Multi-year debates over the sensitivity of conclusions to survey-based evaluations of the economy versus other predictors of electoral outcomes have played out in the pages of the discipline’s flagship journals (Hibbs Reference Hibbs and Douglas1979; Kramer, Reference Kramer1983; Conover et al., Reference Conover, Feldman and Knight1987; MacKuen et al., Reference MacKuen, Erikson and Stimson1992). But even if subjective evaluations of the economy matter (Lewis-Beck, Reference Lewis-Beck1988; Erikson and Wlezien, Reference Erikson and Wlezien2012), the arrangement and sequencing of questions within a survey has well-documented downstream effects on subsequent questions (Hyman and Sheatsley, Reference Hyman, Sheatsley and Payne1950; McFarland, Reference McFarland1981; Schuman and Presser, Reference Schuman and Presser1981; Strack, Reference Strack1992; Foddy, Reference Foddy1993; Tourangeau et al., Reference Roger, Rips and Rasinski2000).
In tandem with the growing appreciation of these sources of fragility in empirical political science is the recognition that Democrats and Republicans have substantially different views of reality (Bartels, Reference Bartels2002). Since Bartels’ observation in 2002, myriad papers have been written about how Democrats and Republicans see the world in fundamentally different ways, ranging from whether Iraq had weapons of mass destruction prior to the U.S. invasion in 2003 (Kull et al., Reference Kull, Ramsay and Lewis2003); responsibility of Republicans or Democrats for allowing 9/11 (Healy et al., Reference Andrew, Kuo and Malhotra2014); the health risks associated with COVID-19 (Gadarian et al., Reference Gadarian, Wallace Goodman and Pepinsky2021); or the magnitude of and threat posed by climate change (although, fittingly for the current context, the magnitude of the partisan gap does hinge on whether respondents are asked about “global warming” or “climate change”; Schuldt et al., Reference Schuldt, Roh and Schwarz2015).Footnote 5
Implicit in these findings is a shared expectation that surveys are measuring genuine views of the people who respond. But as Bullock and Lenz Reference Bullock and Lenz(2019) summarize in their comprehensive review of the literature, it is not clear how much of these differences are attributable to expressive responding motives such as partisan cheerleading versus what they term “congenial inference.” The former suggests that evidence of partisan differences in perceptions of objective reality is driven primarily by dishonest responses on surveys. The latter provides an explanation for why these partisan gaps in perception might be genuine and carries much graver implications for democratic deliberation (see also Malka and Adelman, Reference Malka and Adelman2023). These review articles highlight a swath of recent research that manipulates the incentives for accurate answers via monetary incentives, interpreting the evidence in light of this distinction, and calling for additional research on the topic (Bullock et al., Reference Bullock, Gerber, Hill and Huber2015; Prior et al., Reference Prior, Sood and Khanna2015; Khanna and Sood, Reference Khanna and Sood2018).
One of the favored outcomes used in these studies are questions about economic conditions, which have been shown to be partisan in nature, despite ostensibly concerning an objective state of the world. This is also the outcome we focus on in this paper and demonstrate how variation in the way in which these evaluations are elicited, and the design of the surveys in which they are asked, can augment or suppress the strength of the partisan bias in the responses. In so doing, we rely exclusively on observational data and are, therefore, unable to disentangle cheerleading from congenial inference. As we discuss below, it might be that more sociotropic questions prime respondents to consider their co-partisan status with the president, and then express their support for (or disdain of) the president by inflating (or reducing) their evaluations of the economy. Conversely, more sociotropic questions are inherently more vague in the sense they are about conditions that individual respondents might be less aware of (Sanders Reference Sanders(2000) and Bullock et al. Reference Bullock, Gerber, Hill and Huber(2015)), prompting them to rely on heuristics like co-partisanship with the president in a boundedly rational manner. In the extreme, if there is at least some expressive utility in cheerleading, and if a respondent has no knowledge about a given topic, then perhaps the only rational thing to do is cheerlead.
3. Theoretical intuition
Before describing the intuition by which question wording might elicit more politicized responses, we review the concepts of socio- and egotropism, which are terms that can help us distinguish between two types of considerations voters may have when making decisions, and the concept of a “consideration” itself, which we summarize from Zaller (Reference Zaller1992).
A “consideration” is an attribute or aspect of a political topic that influences an individual’s summary judgment on that issue by combining cognition and affect. As in Zaller’s original description, a relevant consideration to the political topic of defense spending is that the Pentagon spends too much money—a consideration that combines a cognitive piece (e.g. thinking about Pentagon spending) with the affect of believing this amount is excessive. In our setting, a relevant consideration to the topic of the economy is the responsibility attributed to one party or another for overseeing the economy: a consideration that combines the cognitive step (thinking about how much control the president or partisans in Congress might actually have), with the affect of whether the respondent views a given political party in a positive or a negative light. The consideration of partisan responsibility is thus the core explanation for the degree to which a survey response exhibits some type of partisan bias, either due to cheerleading or bounded rational expectations.Footnote 6
Turning to the terms “egotropism” and “sociotropism,” both adjectives incorporate the root word “tropic,” derived from the Greek tropos meaning a turning or an orientation. In a broader scientific context, tropic tends to describe an orientation toward a particular stimulus or objective. In biology, for instance, plants exhibit “phototropic” behavior when they orient themselves and grow toward a light source. Within social sciences, an orientation or inclination in decision-making can also be conceptualized in such tropic terms: thus, sociotropic denotes an orientation toward societal concerns, egotropic indicates an orientation toward personal concerns, and a middle ground has been labeled “communotropic” (Rogers and Tyszler, Reference Rogers and Tyszler2018) or also “mecro-economic voting” (Ansolabehere et al., Reference Ansolabehere, Meredith and Snowberg2014). (And the relationships between outcomes at small, medium, and large geographic resolutions and economic evaluations have also recently been examined in Bisbee and Zilinsky Reference Bisbee and Zilinsky(2023).)
Combining these perspectives, our core claim is that the consideration of partisan responsibility is more likely to be activated when a survey question is worded in a more sociotropic way or is surrounded by many other sociotropic questions. For example, asking about the “state of the national economy” is often used as proxy for how the public perceives economic conditions, but it may also activate the consideration of partisan responsibility due to its sociotropic framing, which then injects partisan bias into responses.Footnote 7 Conversely, asking about an individual’s satisfaction with their finances is an alternative measure of the public’s perception of economic conditions, which is less likely to activate the partisan responsibility consideration. Similarly, asking a question about personal finances directly after a battery of questions about one’s health and health-related behaviors is likely to be more insulatedFootnote 8 from a prior question about presidential approval compared to the same question asked shortly after the same presidential approval question.
The preceding argument motivates the following empirical expectations:
H1: Sociotropically phrased questions should exhibit greater partisan bias than ecotropically phrased questions.
H2: Removing egotropically phrased questions from a survey will increase the overall partisan bias found in subsequent questions.
We evaluate these two hypotheses in the following sections. Importantly, we do not claim to provide a set of guidelines about how best to phrase survey questions, nor how to design a survey that minimizes partisan-biased responses. Rather, we highlight a previously neglected dimension of survey design. This dimension can contribute to the types of biased responses which might inflate theoretically relevant associations between self-reported economic evaluations and political attitudes (approval for the current leadership) or behaviors (vote intention). Our hope is that applied researchers might consider these dimensions when designing and piloting their surveys. Subsequent work that experimentally manipulates both dimensions would help put more precision on our results, although we are skeptical that a comprehensive list of question wordings and survey designs is possible, given the myriad purposes for which applied researchers ask these questions.
4. Data and methods
4.1. Data
We describe empirical patterns that are consistent with our framework using daily Gallup survey data from 2008 to 2018. These data ask a variety of questions that, we argue, provide variation in the spectrum of interest: egotropism on the one hand and sociotropism on the other. This variation manifests in two ways. The first dimension of variation is across questions pertaining to economic and financial conditions, which vary in the degree to which they present egotropic versus sociotropic frames. The list of questions we examine is presented below, ranging from the most egotropic to the most sociotropic, along with reference questions which we would expect to be highly politicized. We bold parts of each question which pertain to the dimension of tropism.Footnote 9
• Economic situation (personal and national):
– “Are you satisfied or dissatisfied with your standard of living, all the things you can buy and do?”
– “[Agree/Dis] Compared to the people you spend time with, you are satisfied with your standard of living.”
– “Have there been times in the past twelve months when you did not have enough money: To buy food that you or your family needed?”
– “Would you be able right now to make a major purchase, such as a car, appliance, or furniture, or pay for a significant home repair if you needed to?”
– “At this time, are you cutting back on how much money you spend each week, or not?”
– “Did you worry yesterday that you spent too much money, or not?”
– “[Agree/Dis] In the last seven days, you have worried about money.”
– “[Agree/Dis] You have more than enough money to do what you want to do.”
– “[Agree/Dis] You are watching your spending very closely.”
– “Do you have enough money to buy the things you need, or not?”
– “Are you feeling better about your financial situation these days, or not?”
– “Are you feeling pretty good these days about the amount of money you have to spend, or not?”
– “How would you rate economic conditions in this country today—as excellent, good, only fair, or poor?”
– “Right now, do you think that economic conditions in this country, as a whole, are getting better or getting worse?”
• Life ladder:
– “Please imagine a ladder with steps numbered from zero at the bottom to ten at the top. The top of the ladder represents the best possible life for you and the bottom of the ladder represents the worst possible life for you. On which step of the ladder would you say you personally feel you stand at this time?”
– “Please imagine a ladder with steps numbered from zero at the bottom to ten at the top. The top of the ladder represents the best possible life for you and the bottom of the ladder represents the worst possible life for you. On which step of the ladder would you say you will stand about five years from now?”
– “You are proud of your community or the area where you live.”
• Pure politics:
– “Do you approve or disapprove of the way Donald Trump is handling his job as president?”
– “Do you have a favorable or unfavorable opinion of Hillary Clinton, or haven’t you heard of them?”
– “Do you approve or disapprove of the way Barack Obama is handling his job as president?”
The second dimension of variation is found within survey questions due to a design change Gallup implemented on January 1, 2013. Prior to this date, Gallup included the above-listed questions of interest along with a battery of questions about the respondents’ physical and emotional health, all of which were asked to a daily sample of 1000 respondents. After January 1, 2013, Gallup divided its daily sample of 1000 respondents into two groups of 500, one of which was given only the strictly egotropic questions about their mental and emotional well-being, while the other answered only the battery of economic and financial questions. This decision meant that respondents who had previously been asked about their financial situation as part of a broader survey asking about their weight, stress levels, and other health issues began answering the same question in a smaller survey that only asked about a range of economic and financial questions, along with explicitly political questions regarding presidential approval, trust in government and policy preferences. We argue that this shift in the design made even the most egotropically phrased questions about economic variables more sociotropic by association, thereby prompting more partisan considerations and, by extension, more partisan responses.
The individual-level responses from Gallup are geocoded, allowing us to merge in an extensive set of contextual variables with each respondent. This additional information will allow us to account for the state of the community where respondents live. This is important because, if we observe that Democrats and Republicans systematically report, for instance, diverging economic expectations, we need to account for the possibility that one of these groups may reside in areas which are economically declining/improving at a particular point in time, and differentially from the other group(s).
4.2. Methods
To characterize the degree to which these questions evoke partisan bias in responses, we employ two complementary approaches. Our first approach measures how important different variables are for predicting the outcomes of interest. To do so, we combine a random forest model with permutation analysis. The random forest algorithm relieves us from having to either assume that every predictor enters linearly or to determine the functional form a priori. Furthermore, random forests rely on searching across random selections of the covariate space for break points that best divide observations by the outcome of interest. The randomization and ensemble structure make random forests relatively robust to multicollinearity. While we could instead use a linear model and evaluate each predictor’s coefficient, such an approach would have required us to assume that (1) the functional form we have chosen is correct and (2) that the particular specification does not suffer from multicollinearity which might produce biased coefficient estimates in unpredictable directions and magnitudes. Using this nonparametric machine learning algorithm to predict variation in attitudes, we then apply permutation methods wherein we randomly reshuffle predictors one at a time and compare the model’s predictive accuracy under the permuted setting to that obtained with the original data (Nicodemus et al., Reference Nicodemus, Malley, Strobl and Ziegler2010).Footnote 10 Predictors whose permutations produce more substantial declines in the random forest algorithm’s predictive accuracy are interpreted to be more important to characterizing an outcome.Footnote 11
Our second approach is more descriptive in nature and simply documents the rapid pivots in evaluations of the national economy that correspond to changes in the office of the president. Specifically we focus on two changes in the partisanship of the president: the transition from George W. Bush to Barack Obama in January of 2009 and the transition from Barack Obama to Donald Trump in January of 2017. We examine the degree to which co-partisans of the preceding president shifted their responses to a variety of nominally nonpartisan survey questions. We interpret questions which exhibit dramatic shifts in opinions associated with the change in the presidency as more susceptible to partisan motivated responding. Furthermore, we argue that the speed of these shifts is unlikely to reflect rational updating about future conditions and is instead more plausibly connected to expressive responding.Footnote 12
Finally, we combine these strategies to document the over-time trends in the variable importance measure for partisanship. If the explanatory power of partisanship spikes prior to presidential elections—especially for the more sociotropically framed questions—such behaviors of survey respondents would be consistent with our theoretical framework. In addition, we compare the predictive power of partisanship just before, and just following, the change in Gallup’s survey design on January 1, 2013.
5. Results
We divide the presentation of our results according to the methods described above. First, we examine measures of variable importance across outcomes. We expect to find that the relative importance of partisanship in predicting outcomes varies as a function of how egotropic the questions are, with the most egotropic questions being least associated with partisanship and the most sociotropic questions exhibiting evidence consistent with partisan motivated responding. Second, we exploit the rich time-series cross-sectional nature of our data to test whether partisan motivated responding is stable over time. We expect that the importance of party affiliation (for sociotropic questions) will increase in the weeks and months prior to national elections, and that there should be evidence of a rapid flip among partisans following a change in the partisanship of the elected president.
5.1. Variable importance
We begin with estimating a measure of variable importance which calculates the reduction in a model’s predictive accuracy when one of the variables is randomly reshuffled (permuted)—so that the signal about the value of the outcome is removed—while holding all other variables at their observed value. Here, the baseline performance is the fully specified model with all variables unpermuted. Importantly, this comparison captures the relative decline in model performance when all other predictors are included.
Specifically, we estimate a set of random forests predicting responses to 17 survey questions, and the predictor of interest is partisanship. Other potential predictors include respondents’ income, gender, age, education, and objective data about the (local) economy (county labor force measures including the unemployment rate, the labor force participation rate, average wages, and employment by industry), crime (county arrests per capita by offense), demographic composition (county population by race, age, gender, and rural), and public health outcomes in the respondents’ communities (male and female death rates and life expectancies by age cohort). We find that when a question is either political or sociotropic in nature, these question characteristics are strongly associated with the degree to which partisanship—and by extension, partisan motivated responding—influences survey responses (Figure 1).Footnote 13 Consistent with our theoretical argument, partisanship is approximately twice as predictive in evaluating the national economy as it is in forecasting respondents’ (self-reported) feelings about their personal financial situation.
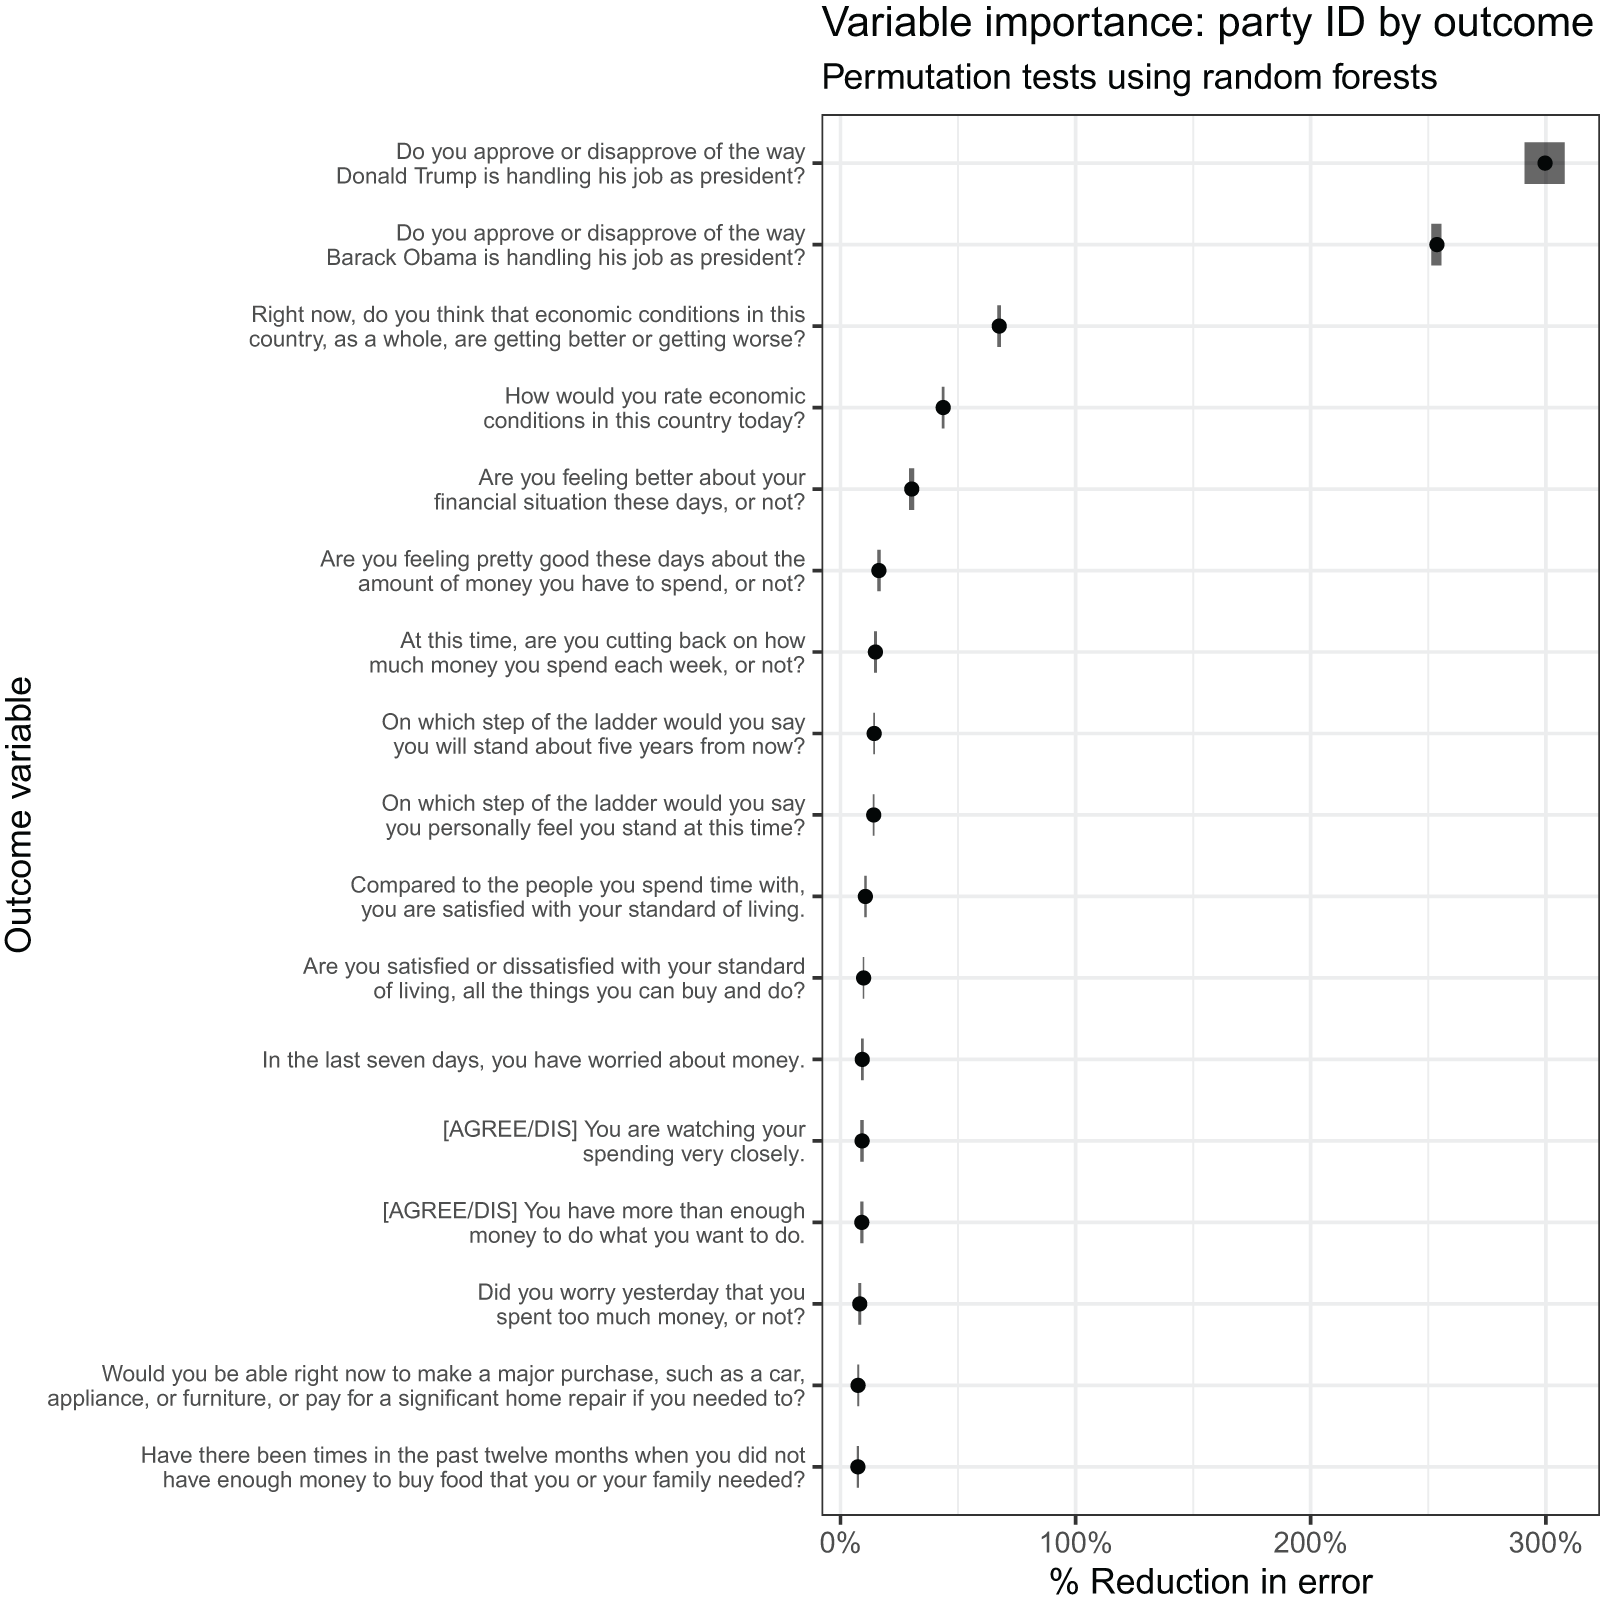
Figure 1. Percent reduction in model accuracy (x-axis) associated with permuting the respondent’s partisanship, relative to a random forest with an exhaustive set of individual and contextual predictors, across survey questions (y-axis). Upper and lower bounds based on 10-fold cross validation indicated with the widths of the boxes.
How influential is party ID relative to other predictors? Figure 2 compares the variable importance for a selection of individual and contextual-level measures across two outcome measures: whether the respondent has enough money (egotropic) and whether the respondent thinks that the national economy is improving (sociotropic). Consistent with expectations, nonpolitical predictors are substantially less prognostic of the more sociotropic question and substantially more prognostic of the more egotropic question. For example, respondents’ income and education are more strongly associated with their reports of having enough money (egotropic question) than with their evaluations of national economic conditions (sociotropic question). An important extension to our work that is beyond the scope of this paper would involve a systematic analysis of the contextual measures of local economic, health, and crime-related factors to understand the degree to which these presumably important phenomena are reflected in survey self-reports.Footnote 14
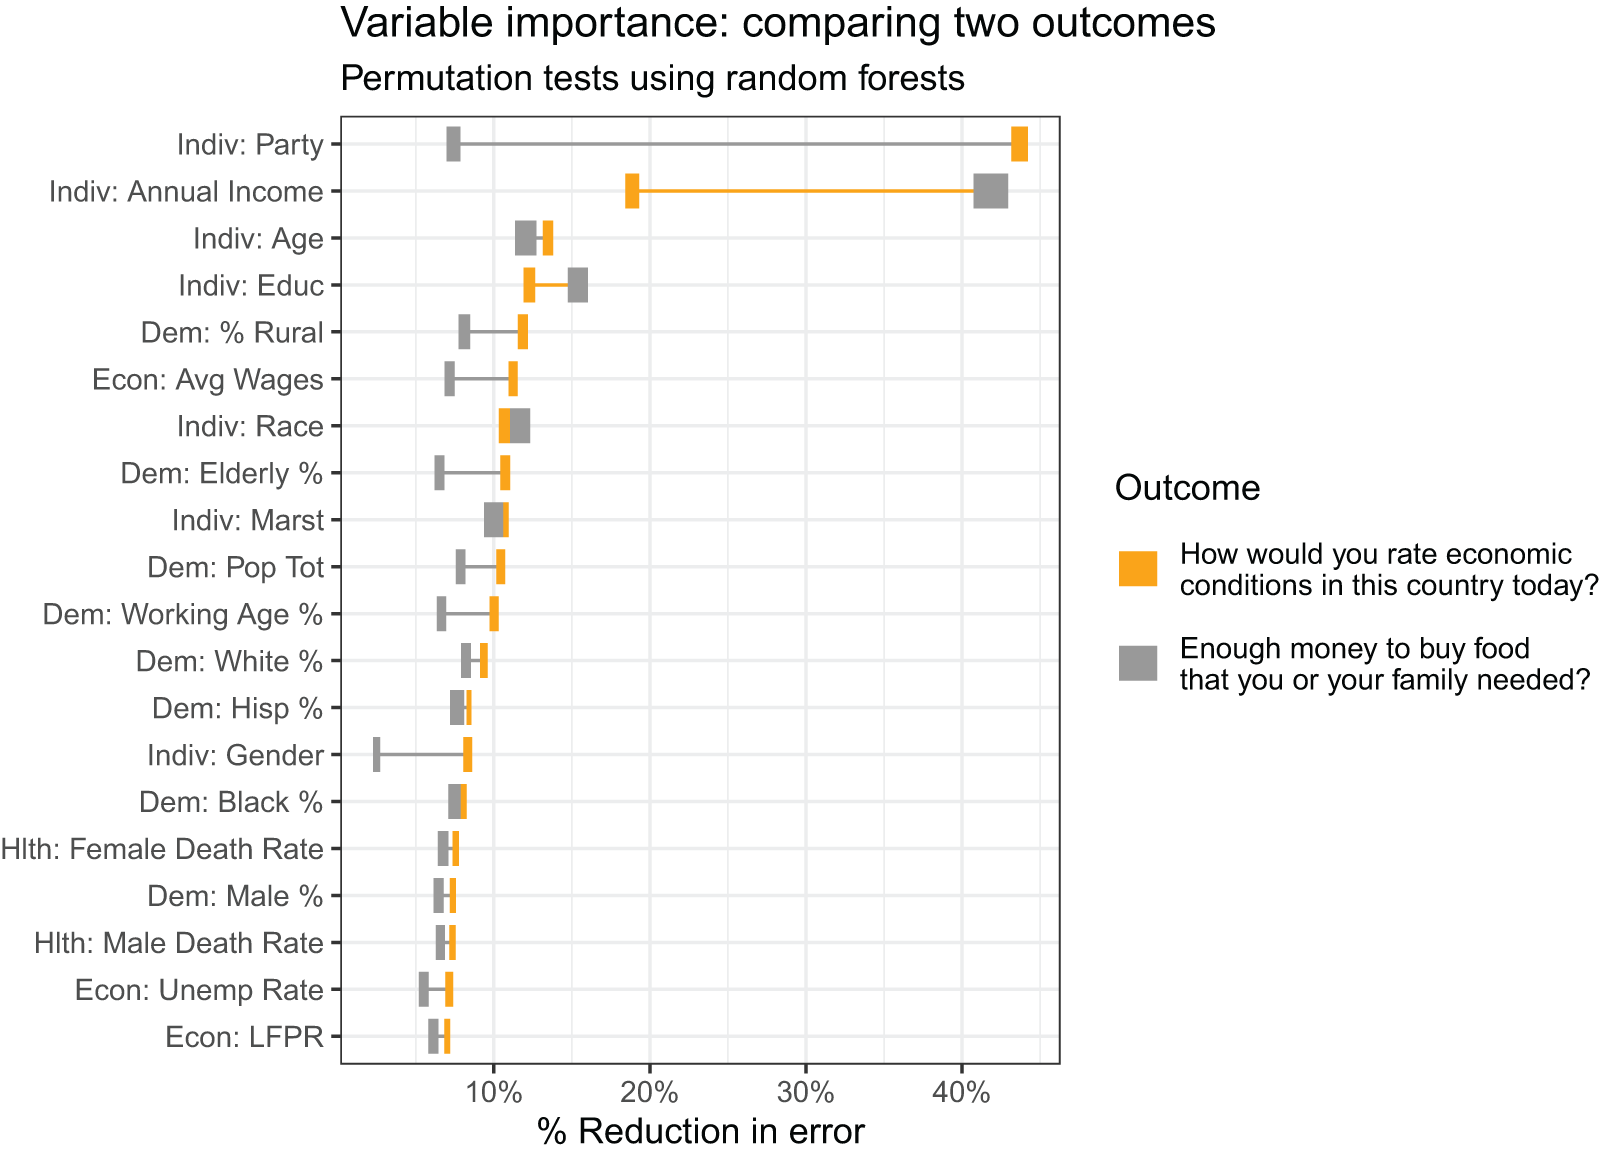
Figure 2. Percent reduction in model accuracy (x-axis) associated with permuting predictors (y-axis), relative to a random forest with an exhaustive set of individual and contextual predictors, comparing a sociotropic question on the national economy (in gray) to an egotropic question on whether the respondent has enough money (yellow color). Upper and lower bounds based on 10-fold cross validation indicated with the widths of the boxes. Each row indicates whether a variable was measured by Gallup and pertains to respondents (“Indiv.”) or whether it is a contextual variable which we merged with the observations in the individual-level Gallup data (“Dem.” = demographics; “Hlth” = local health outcomes; “Econ” = local economic conditions).
5.2. Flip-flopping with the president
To motivate the subsequent analysis, consider this purely descriptive plot of daily views of the economy, broken out by party ID (Figure 3). There is striking evidence that Democrats and Republicans effectively traded places in the weeks following the inauguration of new presidents (Obama in January of 2009, Trump in January of 2017). While this dataset is not a genuine panelFootnote 15—same individuals are not observed over time—it is based on nationally representative samples. This makes it highly improbable that the observed patterns could be attributed to entirely different types of partisans responding before and after each inauguration. Barring a rapid and genuine shift in beliefs among partisans, the data suggest motivated responding.
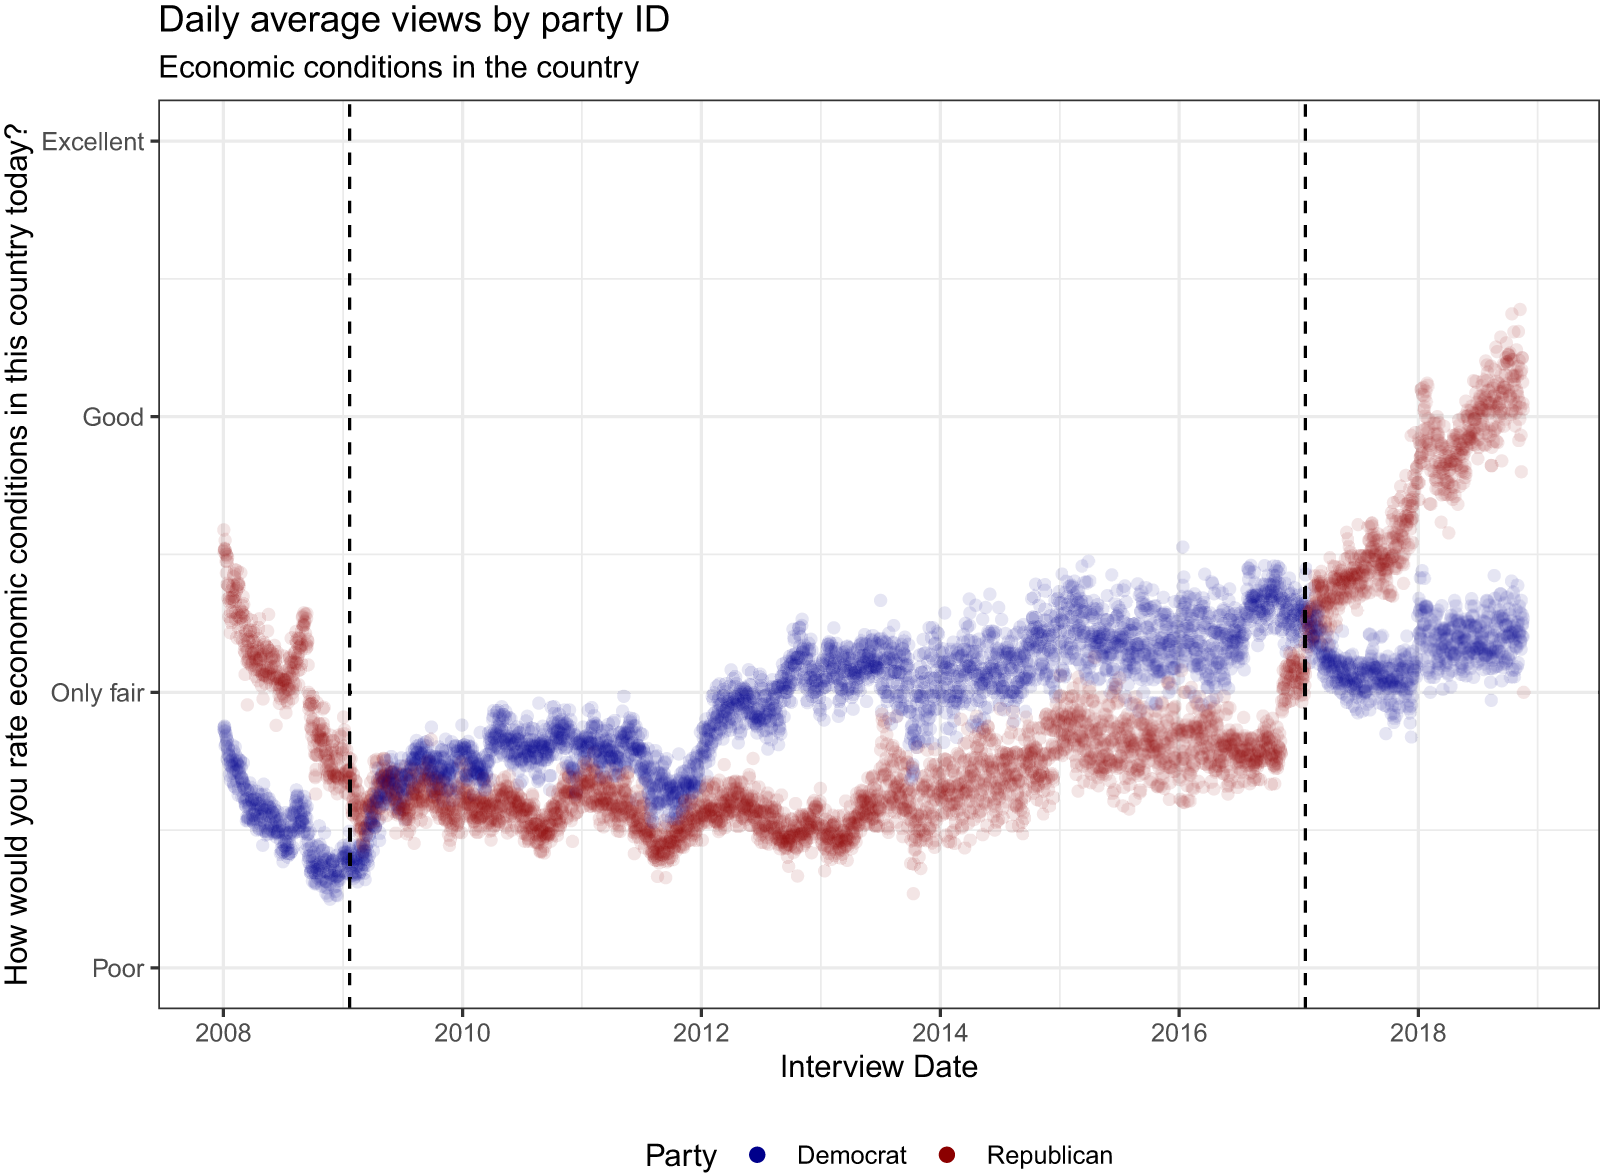
Figure 3. Daily average views of the economy on a 4-point scale by party ID of the respondent. Partisans include leaners (independents and nonresponders are dropped). Dashed vertical lines denote inauguration dates.
Nevertheless, there might be confounders which explain these transitions. For example, dissatisfaction with the 2008 election outcome might correspond to negative outcomes in Republican areas, producing bleaker views as a function of genuine beliefs about the economy instead of purely expressive responding. To account for similar possibilities, we run a flexible random forest model that predicts different outcomes as a function of all individual and contextual predictors for each month in the data, and then use these models to predict opinions over time by party ID. (Our Supporting Information, Section C, presents the results from an interrupted time-series analysis.Footnote 16) Figure 4 visualizes the results for a selection of outcomes, ranging from the most egotropic (whether a respondent experienced stress during the preceding day) on the top to the most sociotropic (whether the national economy is improving) in the bottom panel. As illustrated, the evidence of flips in responses among partisans around the inaugurations of Obama and Trump is striking for the most sociotropic measures, and less so as we move up the panels of the figure.
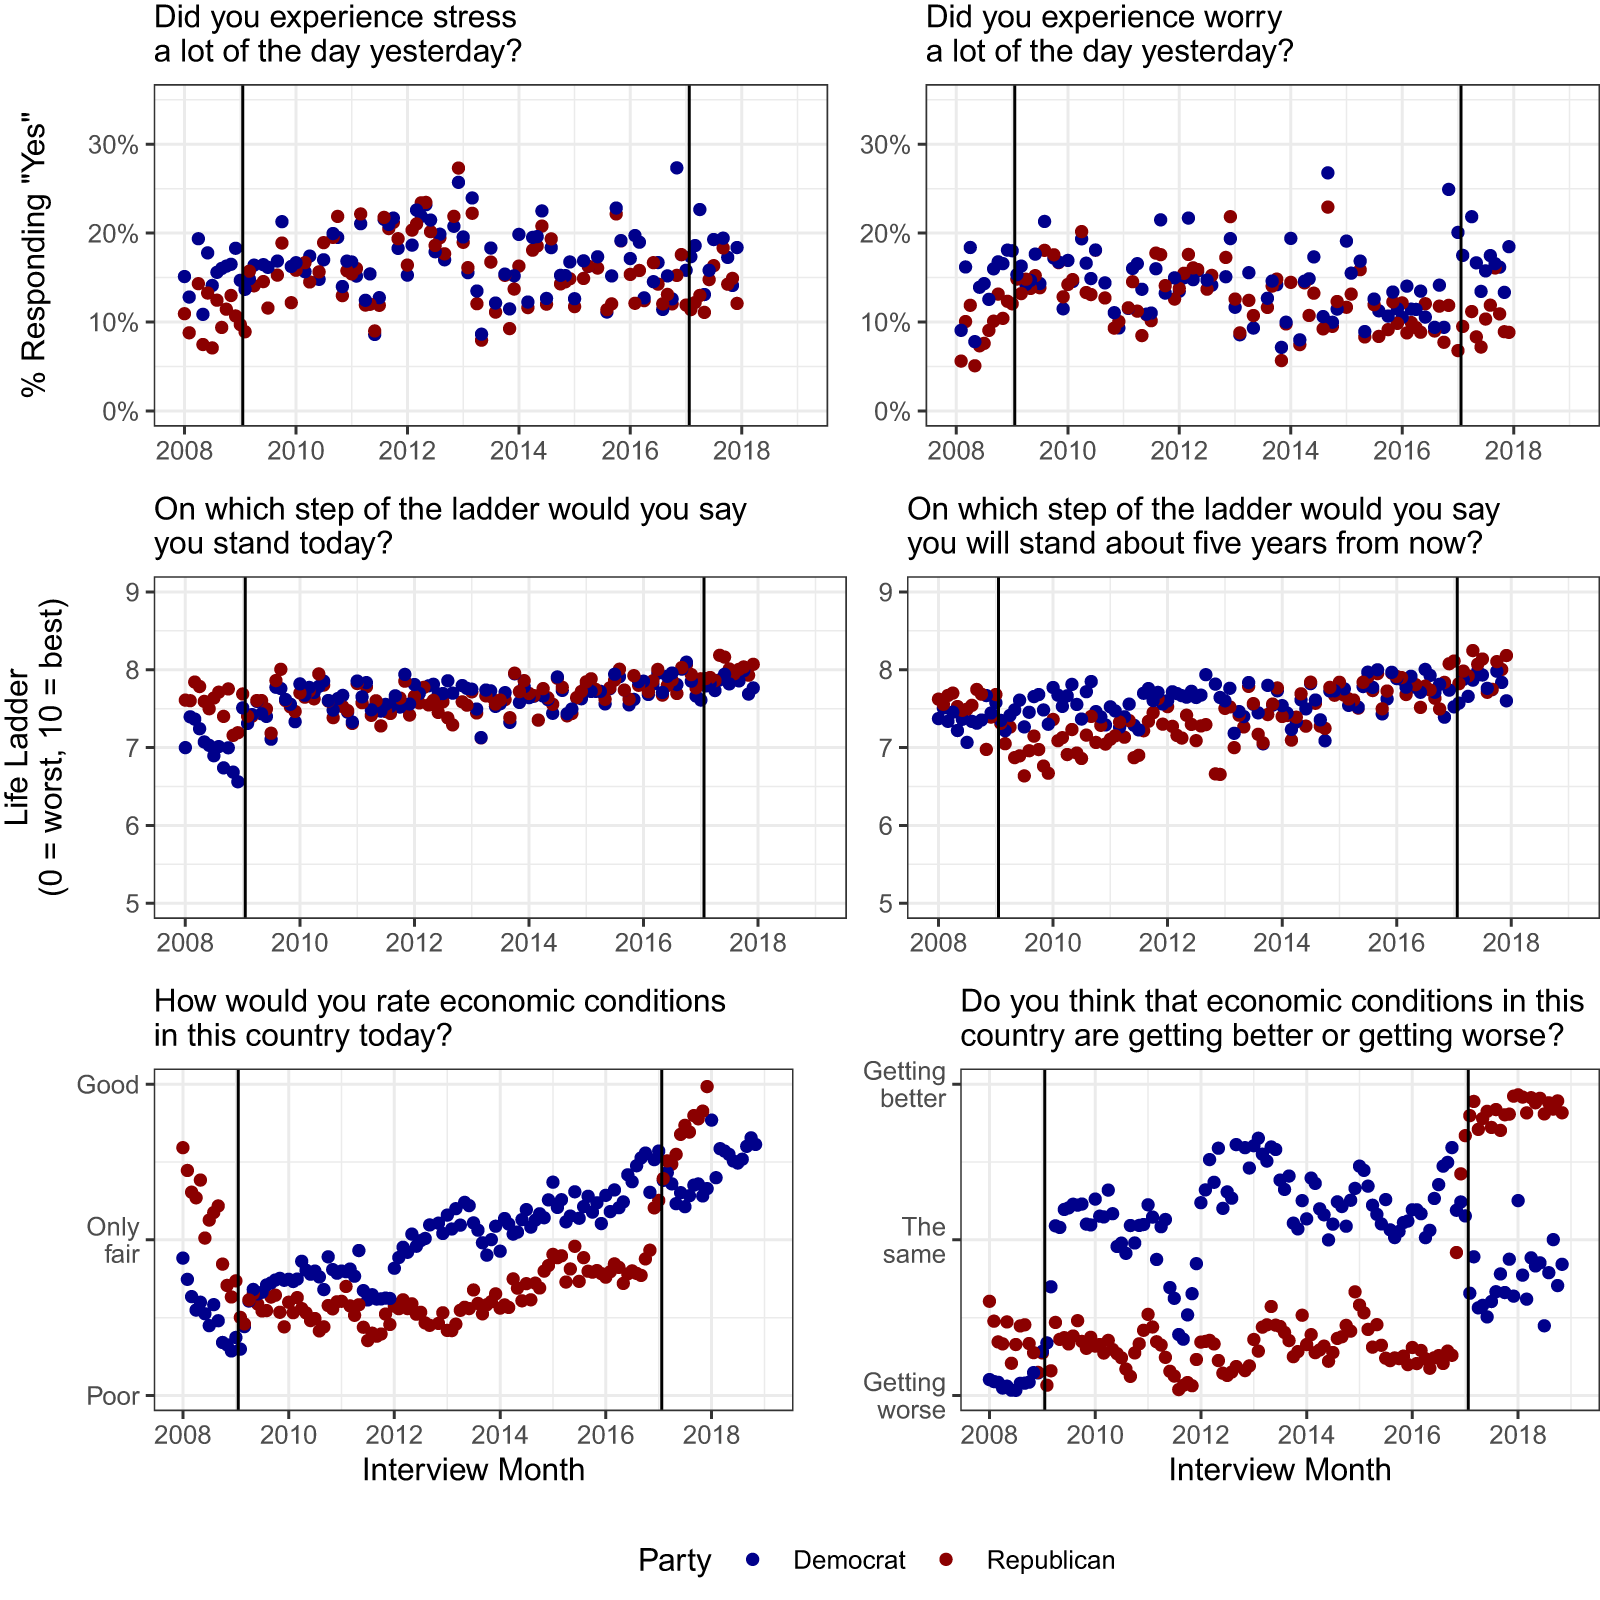
Figure 4. Predicted attitudes (flexible random forest models).
5.3. The dynamics of variable importance
In our next analysis, we combine the two preceding approaches and calculate variable importance as a function of time. Specifically, we show in Figure 5 that the predictive power of party ID for sociotropic measures tracks election cycles, with increasing relevance in the final months of a presidential campaign, and diminishing strikingly during the period between the election and the inauguration (indicated by gray rectangles in Figure 5). This over-time evidence is not found for the egotropic question about whether the respondent has enough money.
The monthly evidence reported in Figure 5 is consistent with campaign effects and with the conjecture that subjective reports of (national) economic conditions are less informative (or at least answered “less truthfully”) during intense electoral campaigns. Conversely, responses to a question about personal finances are less tainted by partisan motivated responding, and the (limited) influence of partisanship is stable over entire (4-year) electoral terms of U.S. presidents.
Interestingly, the only months in which the predictive power of partisanship for sociotropically phrased questions declines to its levels for egotropically phrased questions is in the few months immediately following a transition in the party of the president. In both the first few months of 2009 and in the first few months of 2017, we observe the variable importance of partisanship “bottoming out.” We argue that these findings further support our overarching interpretation: sociotropically phrased questions trigger more partisan responding. This effect is particularly evident during transition periods when the public must recalibrate its heuristics for linking partisanship with national economic performance as a referendum on presidential performance. For instance: Should positive assessments of the economy in early 2017 be attributed to Obama or Trump? Should the poor state of the economy in 2009 be blamed on Bush or Obama? The uncertainty over appropriate attribution during these transition periods can explain the dramatic declines in the predictive power of partisanship. Importantly, this interpretation offers insights that alternative explanations cannot provide. For example, the hypothesis that sociotropic questions are more vague and, therefore, more prone to expressive responding would fail to account for these clear dynamics in partisanship’s predictive power.
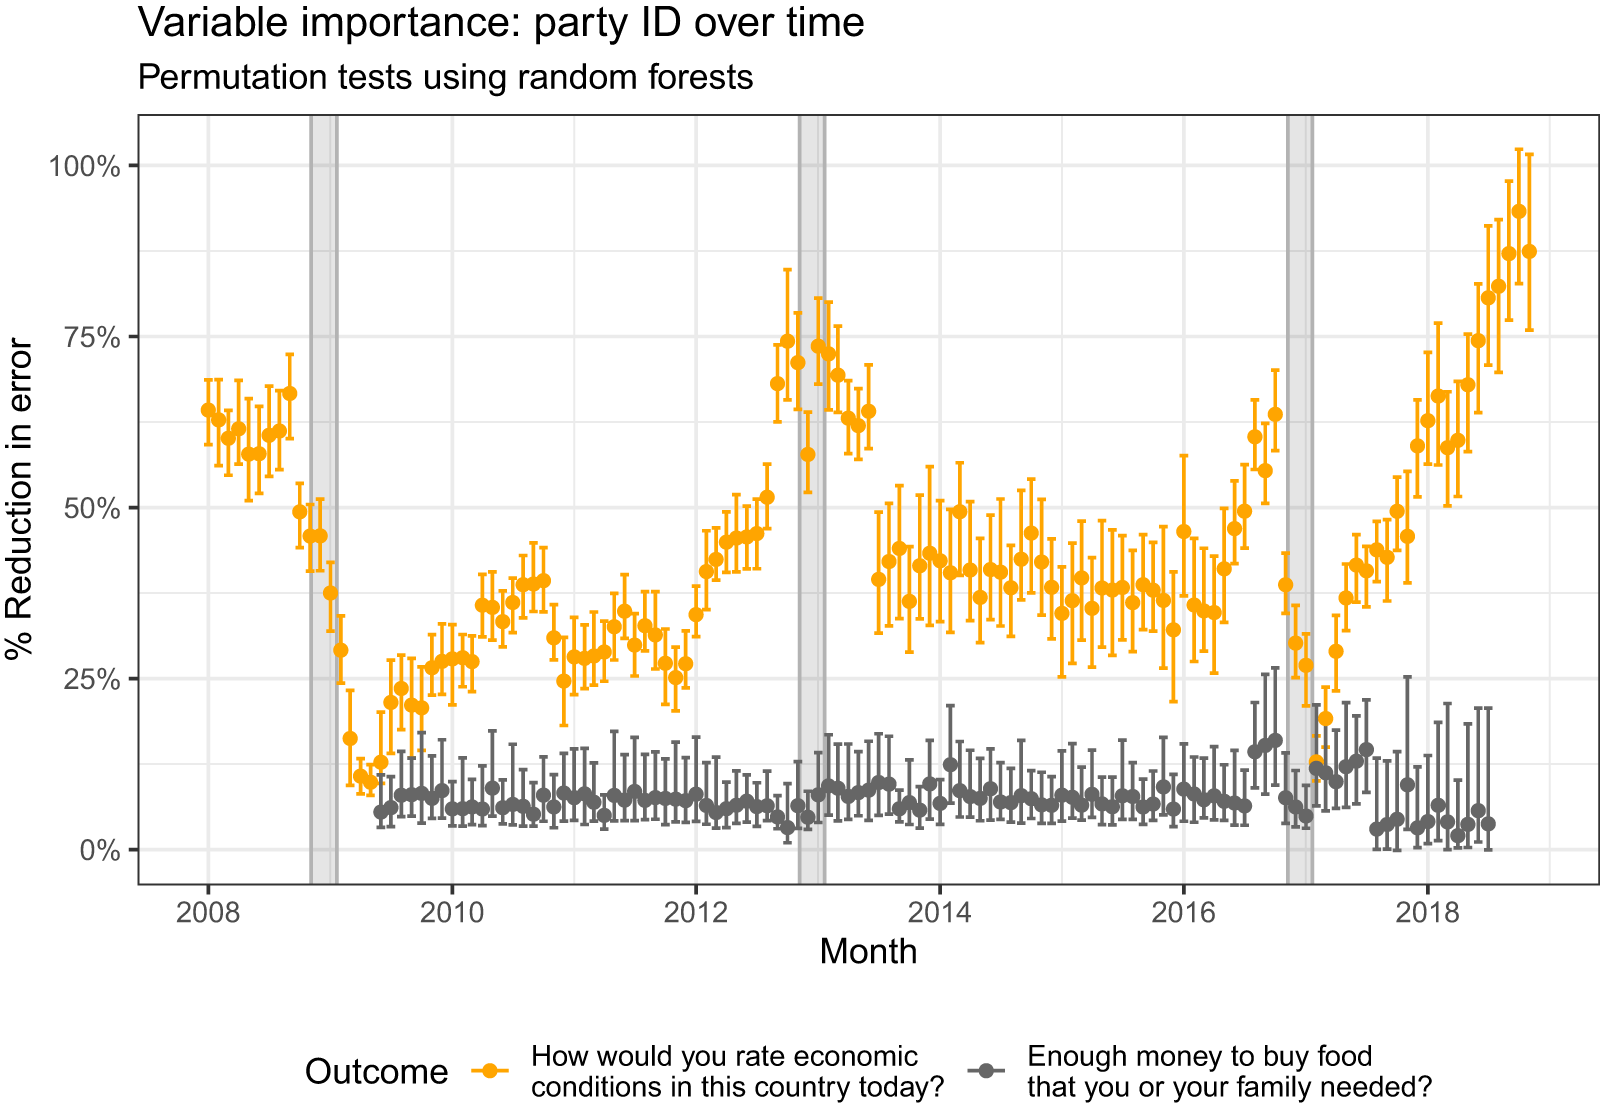
Figure 5. Variable importance of party affiliation (from models estimated on a monthly basis), for two outcomes: whether the national economy is improving (orange) and whether the respondent has enough money (gray).
5.4. Survey design
The preceding analyses all rest on our interpretation of some questions as more sociotropic than others, which we posit can elicit more partisan considerations and, thus, more expressive responding. While we feel comfortable in our claim that the phrasing of questions about the national economy is more sociotropic in nature than questions about whether the respondent has enough money, we recognize that these are subjective claims. To further support our argument that the sociotropic nature of survey design can elicit more expressive responding along partisan lines, we hold constant the survey questions and document how the predictive power of partisanship shifts along with the overarching design of the survey.
Specifically, we take advantage of a change in the design of the daily Gallup tracking polls that occurred on January 1, 2013. Prior to this date, all questions were asked of 1000 respondents daily, including both questions on politics and the economy, as well as questions on personal health. After January 1, 2013, Gallup divided these into two separate surveys, each fielded to 500 respondents. Both surveys started with a question about presidential approval, priming respondents to consider political responsibility for the economy. However, in the pre-2013 design, many of the more egotropic questions pertaining to the respondent’s economic situation were located after the battery of well-being questions that asked about deeply personal issues involving physical and mental health. But when these surveys were split apart, the same egotropic questions regarding the respondent’s economic situation no longer came after the broader set of strictly egotropic questions. Instead, the rest of the survey is much more explicitly political in nature, asking only questions about the respondent’s employment status and conditions at their job, before turning to the same egotropic questions asked prior to 2013. We visualize these differences in Figure 6.
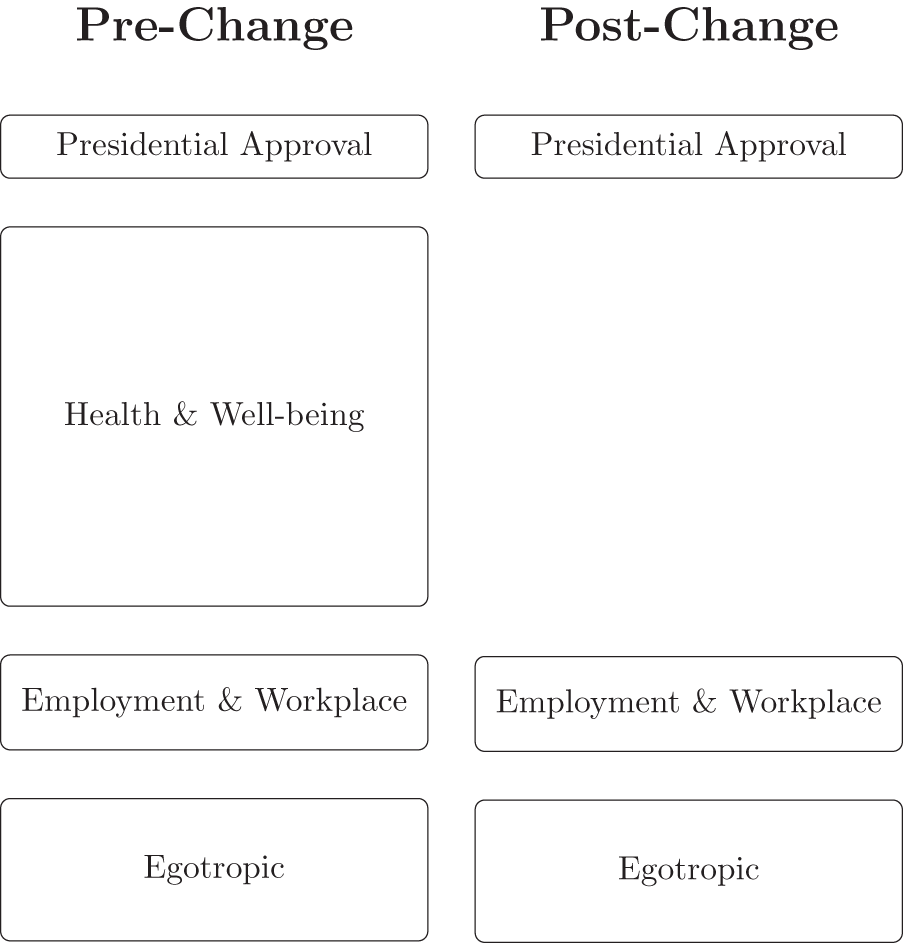
Figure 6. Design change between 2012 and 2013. Health and well-being battery of questions was long, specific to the respondent, and wholly unrelated to politics. Without this buffer, we expect that the political considerations primed by the initial question on presidential approval will influence the egotropic questions about individual economic conditions.
We argue that these changes in survey design removed a buffer between the explicitly political question about presidential approval and the egotropic questions of interest to our analysis. In particular, we believe that the questions about physical health and well-being are sufficiently nonpolitical to reduce whatever downstream influence the initial presidential approval question may have primed. But without them acting as a buffer, the political considerations elicited by the initial presidential approval question manifest more strongly, rendering even the egotropic questions about one’s individual economic conditions endogenous to their partisanship and that of the president. If the relevant considerations that prompt expressive responding are sensitive not just to a specific question but also to the broader organization of a survey, we would expect to find greater evidence of expressive responding on the same egotropic questions after January 1, 2013, when they are no longer associated with a broader battery of strictly personal questions about physical and mental health (in line with H2).
Indeed, this appears to be the case, as illustrated in Figure 7 which plots the variable importance of partisanship on a number of egotropic questions pertaining to the respondent’s economic situation. Vertical dashed lines indicate the January 1, 2013, date when the sample was divided, and participants responding to these egotropic questions were no longer doing so as part of a larger battery of questions about their mental and physical well-being. As illustrated, across all egotropic questions, there is clear evidence of a discontinuous increase in the predictive power of the respondent’s partisanship after January 1, 2013. Indeed, Bayesian Change Point tests confirm the visual intuition, identifying this date as when there is a structural break in the time-series measure of the importance of partisanship (see the Supporting Information, Section E).
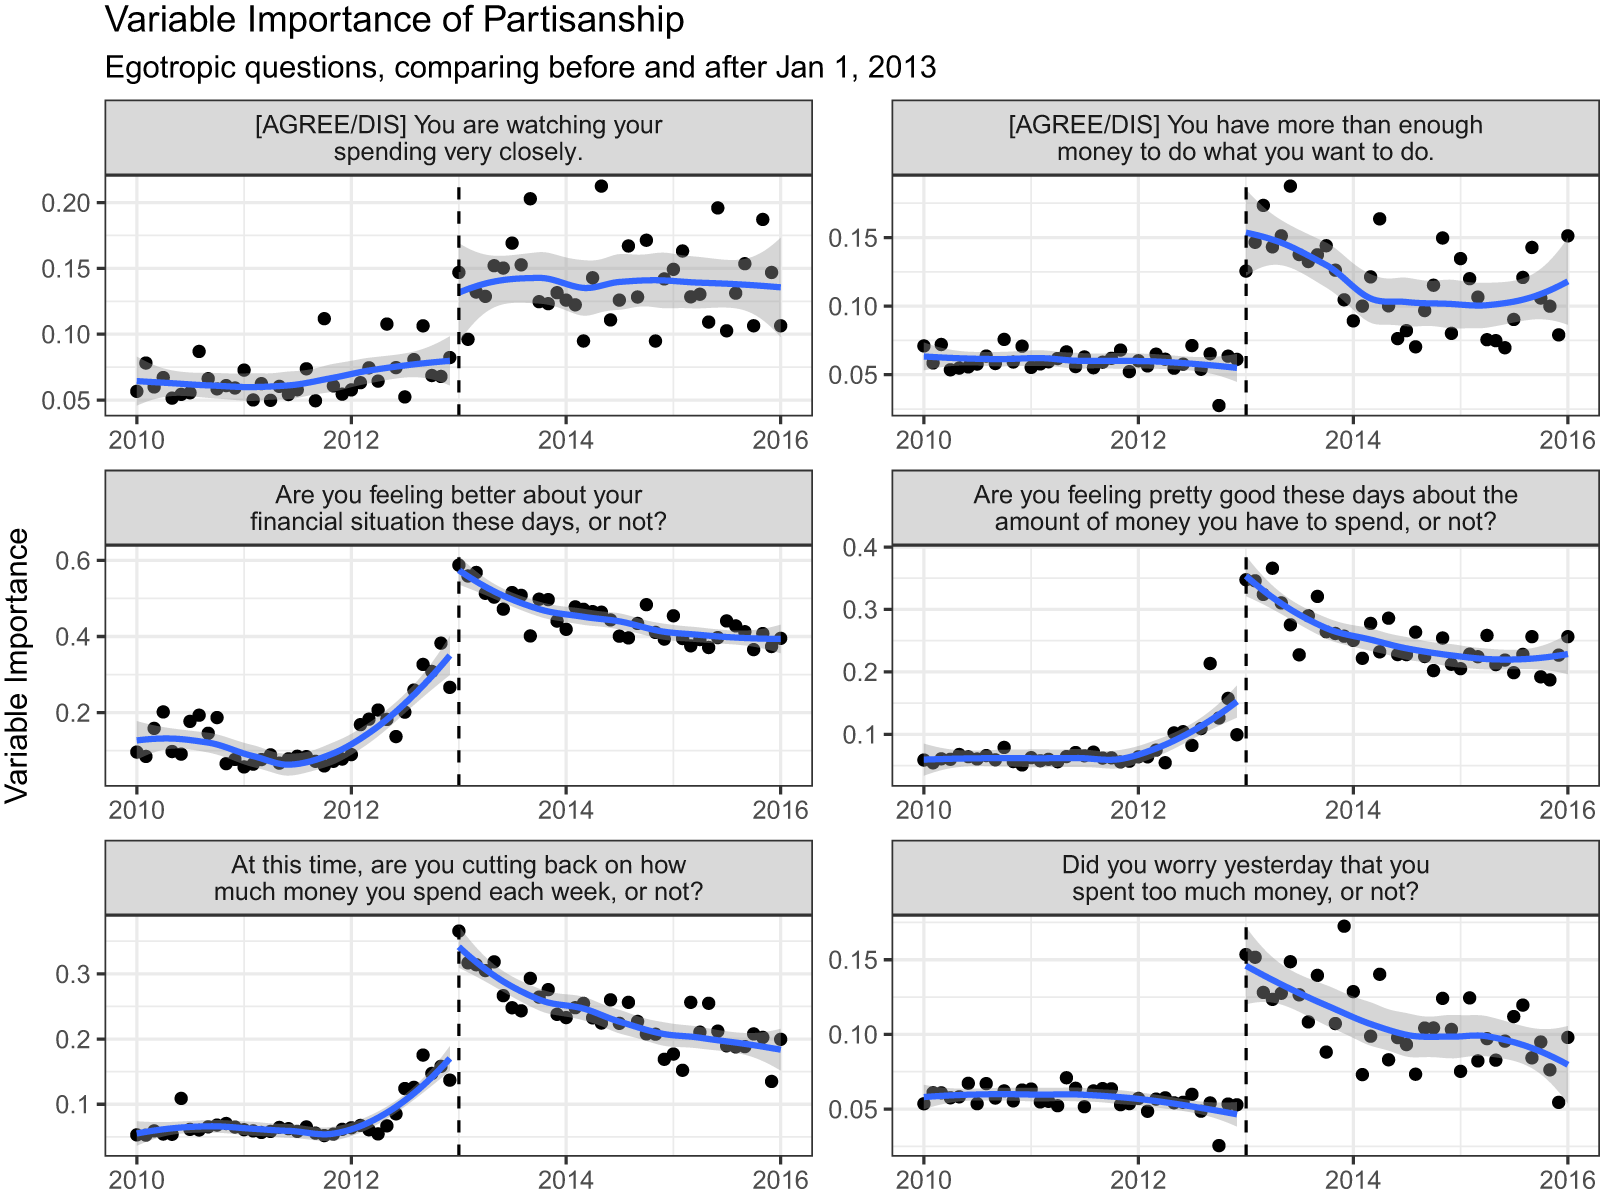
Figure 7. Variable importance of party affiliation (from models estimated on a monthly basis) on a battery of egotropically phrased questions about the respondent’s economic condition. Loess smoothers fit separately prior to, and following, January 1, 2013, when Gallup split the survey into two samples.
Note, however, that (for a subset of items) there is also evidence of “anticipation,” indicating that there might be more at play here than only the change in the survey design. One potential explanation might be the expiration of the Bush-era tax cuts which the Obama administration allowed to lapse at the beginning of 2013. Another might be the simpler argument that all public opinion becomes more partisan during presidential elections, such as the one that occurred in the fall of 2012. Indeed, descriptive evidence of the partisan gap suggests that the increase in variable importance is driven more by Republican respondents, who grow significantly less optimistic about their personal finances after January 1.
Nevertheless, we argue that the sharp discontinuity around this date is unlikely to solely reflect the expiration of the tax cuts, nor the increased salience of partisanship around the 2012 presidential election. While these events may have helped increase the predictive power of partisanship in the preceding months, across all facets the discontinuity between December and January is stark. We argue that these patterns are consistent with our theory about how the design of surveys, both in terms of the wording of specific questions as well as in the overall emphasis of a survey, can magnify partisan differences.
6. Conclusion
Implicit in the expansive body of empirical work that documents economic voting is that self-reported evaluations of the economy are causally prior to attitudes toward and support for the government. Yet in individual-level survey data, the sensitivity of self-reported evaluations to political considerations (Wilcox and Wlezien, Reference Wilcox and Wlezien1993), respondents’ temporary state of mind (Zaller and Feldman, Reference Zaller and Feldman1992), wording adjustments (Rasinski, Reference Rasinski1989), and question ordering (Schuman and Presser, Reference Schuman and Presser1981) are well known. In this paper, we proposed two previously neglected dimensions of survey design that, we argue, exacerbate politically biased responses to nominally apolitical questions.
First, we argue that the “macro” nature of the question can facilitate partisan behavior (e.g. cheerleading or, conversely, faultfinding on surveys) by making it easier for respondents to engage in response substitution (linking their answers to a question about the economy to considerations of co- or out-partisan leadership). This extends prior work on the sensitivity of survey responses to question ordering, among other factors (Palmer and Duch, Reference Palmer and Duch2001; Gal and Rucker, Reference Gal and Rucker2011).Footnote 17 Second, we argue that embedding economic evaluations in surveys with more sociotropic questions, or questions that ask respondents to think like a partisan, can also inflate the observed association between partisanship and their appraisal of economic variables.
By highlighting these two neglected considerations, we hope to help researchers design and field surveys that avoid introducing unwanted political bias. In light of important debates about the prevalence of insincere responding (Malka and Adelman, Reference Malka and Adelman2023) versus truly held, self-flattering, but flexible beliefs which may serve as self-justification mechanisms, we expect the academic community to remain interested in experimenting with survey features which increase the likelihood of sincere responding.Footnote 18 We hope applied researchers can use our findings to pilot surveys that test different question wordings and survey designs which fit their specific research goals.
Supplementary material
The supplementary material for this article can be found at https://doi.org/.10.1017/psrm.2025.32. To obtain replication material for this article, see the repository at https://doi.org/10.7910/DVN/9MDTGD.
Competing interests
The author(s) declare none.
Data availability statement
Replication data and code are available at https://doi.org/10.7910/DVN/9MDTGD.


 Open access