Introduction
Human disturbance of wildlife is particularly important where the amount of disturbance may be increasing and the species may be threatened. This is often the case with coastal species because increasing numbers of people now live in or visit coastal areas (Sorice et al., Reference Sorice, Shafer and Ditton2006). Behavioural changes in wildlife as a result of human disturbance are well documented (Cayford, Reference Cayford1993) but many studies fail to establish whether these behavioural changes affect fitness or populations (Gill et al., Reference Gill, Norris and Sutherland2001; Beale & Monaghan, Reference Beale and Monaghan2004b). To determine whether human disturbance is a conservation concern it is critical to examine the potential costs of any behavioural alteration and whether animals can adjust without incurring any costs to survival or reproduction. In this study we use a predation-risk theoretical framework (Frid & Dill, Reference Frid and Dill2002; Yasué, Reference Yasué2006) and measure ecological variables that affect wader behaviour to evaluate whether human disturbance affects the fitness of wintering shorebirds in the Gulf of Thailand. More research on the impacts of human disturbance on waders is important because the majority of wader populations are declining (International Wader Study Group, 2003) and increased human disturbance in non-breeding areas is thought to be a contributing factor (Senner & Howe, Reference Senner, Howe, Burger and Olla1984). In tropical wintering areas there has been little research on this subject and a paucity of basic information on ecological factors that could constrain behaviour and influence the impacts of human disturbance (Yasué & Dearden, Reference Yasué and Dearden2006).
During the winter, human disturbance could affect fitness by forcing waders to compromise predator avoidance or reduce foraging rates. In the presence of people, waders may select different habitats (Cayford, Reference Cayford1993; Frid & Dill, Reference Frid and Dill2002), lower feeding rates or avoid feeding during times when human densities are high (Burger & Gochfeld, Reference Burger and Gochfeld1991; Fitzpatrick & Bouchez, Reference Fitzpatrick and Bouchez1998). The impact of human disturbance on wader fitness depends on the availability of alternate low disturbance habitats or time periods that have sufficiently high prey availability and low predation risk (Gill et al., Reference Gill, Norris and Sutherland2001; dit Durell et al., 2008).
Khao Sam Roi Yod National Park has one of the highest wader densities within protected areas in Thailand, and there have been no studies of wader ecology or the impacts of the increasing levels of human disturbance from local villagers and weekend tourists (Parr et al., Reference Parr, Mahannop and Charoensiri1993; Choowaew, pers. comm., 2003). In and around the Park there are five intertidal habitats where waders can choose to roost or feed. Human disturbance levels vary across these sites and waders may avoid areas that have higher human disturbance.
The objective of this study was to evaluate whether human disturbance may affect shorebirds by reducing their ability to avoid predators or feed efficiently. We compared human, dog, wader and invertebrate prey densities as well as natural disturbance, human disturbance and foraging rates amongst five foraging sites. By evaluating the quality of all potential habitats based on characteristics relating to predation or energetic considerations, it may be possible to determine whether people cause waders to avoid otherwise suitable habitats consistently. We measured disturbance rates because areas with high natural disturbance rates may have greater predation risk from raptors and also because waders may incur energetic costs by repeatedly responding to false alarms (McGowan et al., Reference McGowan, Cresswell and Ruxton2002).
In addition to changing foraging location, waders may recoup the energetic costs of diurnal disturbance by feeding at night, or by extending their feeding times through the tidal cycle, if prey is available (Burger & Gochfeld, Reference Burger and Gochfeld1991). Consequently, at two sites we also assessed diel and tidal variability in prey abundance. Finally, we examined temporary changes in wader behaviour because of human presence by modelling whether human densities affected the density of feeding birds and feeding rates of Eurasian curlew Numenius arquata at the site with the highest human densities.
Methods
Our data were collected between 20 December 2003 and 13 March 2005 at five sites along a 7 km coastline in and around Khao Sam Roi Yod National Park in the Gulf of Thailand. These sites were, from north to south, Sam Praya Beach (SPB), Sam Praya Mudflat (SPMF), Kao Daeng Village Beach (KDVB), Kao Daeng Mudflat (KDMF) and Tung Noi Village Beach (TNVB). These five sites encompass nearly all the tidal habitat in and around the 98 km2 park and support > 30 species of feeding or roosting wading birds (Fig. 1).
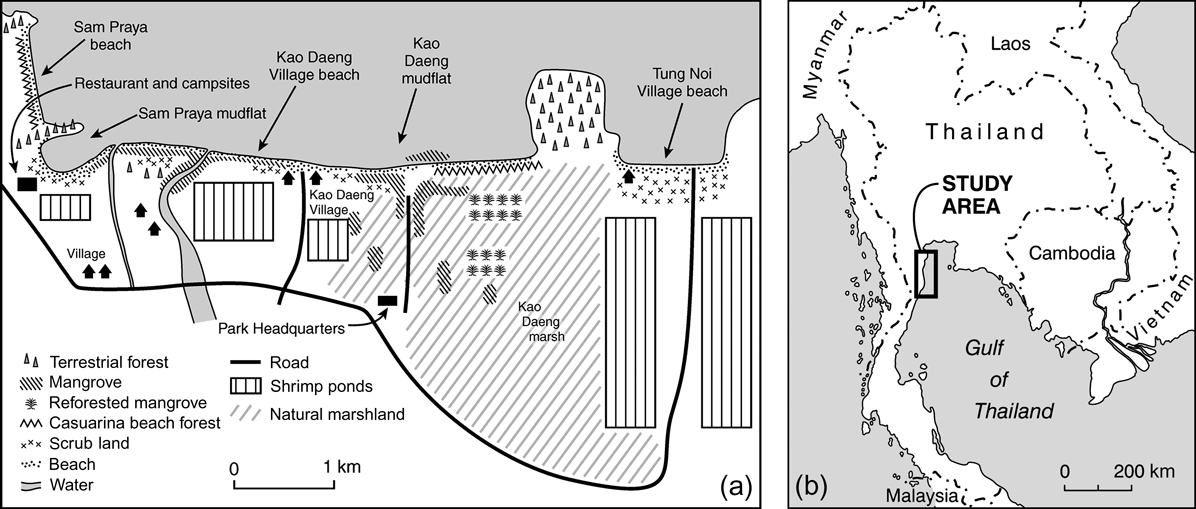
Fig. 1 (a) Map of the five study sites (SPB, Sam Praya beach; SPMF, Sam Praya mudflat; KDVB, Kao Daeng village beach; KDMF, Kao Daeng mudflat; TNVB, Tung Noi village beach) and adjacent coastal habitats. Tung Noi Village Beach is outside Khao Sam Roi Yod National Park. (b) Location of the study site in Thailand.
All data analyses were conducted using SPSS v. 11.0 (SPSS, Chicago, USA) or R v. 2.5 (R Development Core Team, 2007). Wherever possible parametric analyses were conducted but if data could not be transformed to resemble a normal distribution we used non-parametric analyses.
Shorebird, human and dog densities
Each site was censused using a 30x spotting telescope, 1–5 times per week at low tide (published tidal heights < 2.0 m). For each census we counted the total number of each species feeding or roosting. During these wader censuses we also counted the total number of people and dogs at a site. To increase the reliability of our wader counts, many of the sites were censused more than once on the same day. For all analyses, these replicates were pooled and mean values were used. In total 296 (67 different days) and 314 (138) low tide censuses were conducted in the winters of 2004 and 2005 at the five sites.
We also examined seasonal variation in bird density. For this analysis we included days since 20 December for both years in a generalized linear model with a log link function for Poisson distributed error that included year and location as factors. The same approach was used to detect seasonal variation in human and dog densities.
Comparison of habitat quality among sites
We measured the frequency of natural disturbances (false alarms, raptors) and human disturbances (people, livestock, dogs, loud speakers, vehicles) during 30–180 minute disturbance watches. The length of time of disturbance watches varied as birds sometimes permanently left the area because of tides or a persistent disturbance. We counted the total number of feeding and roosting birds of each species at the site at the start of the disturbance watch as well as periodically throughout the observation period if there were any significant changes to flock composition. When there was a disturbance we quickly scanned and counted the birds at 10–30 second intervals (depending on the size) and estimated the time taken for 90% of the flushed flock to resume feeding. We used a stop watch and measured the total time birds spent responding to natural or human disturbances. We did not conduct more than one disturbance watch at a site per day. Mortality risk from raptor predators decreases with increasing flock size (Elgar, Reference Elgar1988). Thus, for natural disturbance rates, we included both flock size weighted disturbance rates (as a measure of mortality risk) and unweighted disturbance rates (as a measure of energetic costs of responding to a disturbance).
To compare prey availability between the five sites we sampled benthic prey with cores, and crab burrow densities with quadrats, once per month at low tide (published tide heights < 1.8 m) during the 3-day period in the tidal cycle when there was the greatest amount of diurnal low tide between 07.00 and 18.00. At each of the five sites, 10 cm diameter, 5 cm deep cores were sampled at 10–25 and 30–90 m from the tide line; 5 cm was a reasonable sampling depth because all waders other than the Eurasian curlew captured prey that were < 5 cm deep in the benthos. Eurasian curlew occasionally fed on larger Uca crabs that were deeper in the benthos. Each core was examined in situ by passing the core through a 1.5 mm sieve. Prey were categorized into size classes: polychaete worms (length < 10, 10–50, > 50 mm) and molluscs (length < 5, 5–10, > 10 mm). We sampled 5–57 cores per site, and the number of cores we took depended on the length of diurnal low tide time available as well as the size of the mudflat area that we needed to sample. In total we sampled 210 and 559 cores during 2003/2004 and 2004/2005, respectively.
Crabs frequently scrambled out of benthic cores before they could be counted. Consequently, we counted the total number of crab burrows in 0.46 m2 quadrats along two transects (10–20 and 35–50 m from the tideline) parallel to the tideline. We did not place quadrats where there were small rivers or pools of water, rocks or large areas of mud with no crab burrows. Direct crab counts or pitfall traps may have yielded more accurate estimates of prey availability than burrow counts but this method was necessitated because of the large number of sites that needed to be sampled within a short period. Burrows were a good indicator of crab availability because crabs created burrows at every low tide to feed at the surface (Zwarts, Reference Zwarts1985). Crab burrows were categorized into five size groups (diameter < 2, 2–4.9, 5–9.9, 10–15, > 15 mm). We also captured 43 crabs outside their burrows and measured the burrow diameter and carapace size to ensure that these two values were closely related and then later converted these to energetic values using methods described below. Quadrats for crab burrows were at 50–150 m intervals, and 7–44 quadrats were sampled at each site. In total we sampled 484 and 348 quadrats during 2003/2004 and 2004/2005, respectively.
Crab availability at each site depends not only on crab density in areas where they are present but also on the width of the mudflat (perpendicular to the tideline) containing crab burrows. At each site we walked 4–8 transects that ran the width of the mudflat from the beach to the tideline and measured the total width of the mudflat where crab burrows were present. To express overall crab abundance, we multiplied crab density in the quadrats by the width of the mudflat area with crab burrows.
To quantify prey availability and foraging intake rates we converted size class categories of prey or crab burrows to energetic values (kJ). Prey availability was expressed in kJ per 100 cm3 for cores, or kJ m-1 for crab burrows, and foraging energy intake rates as kJ h-1.
To measure energetic values per prey type and size, we collected prey specimens of different species and size classes periodically throughout the study period and stored them in a 10% formalin solution. We dried the contents of these containers at 70oC, created uniform pellets containing only the same prey type and size, and used a Julius Peter bomb calorimeter with 20 pa oxygen to measure the caloric value (Zharikov & Skilleter, Reference Zharikov and Skilleter2003). This was used to convert invertebrate length measurements to energetic equivalents. However, we could not collect a sufficient number of very small crabs and polychaete worms for the bomb calorimeter because the calorimeter required pellets that weigh at least 1.0 g. Instead we used energetic values determined in previous studies of similar-sized prey items (Zwarts & Blomert, Reference Zwarts and Blomert1990; Turpie & Hockey, Reference Turpie and Hockey1993; Cresswell, Reference Cresswell1994; Masero et al., Reference Masero, Pérez-González, Basadre and Otero-Saavedra1999). We assumed assimilation efficiency to be 80% for worms, 75% for molluscs and 65% for crabs (Kersten & Piersma, Reference Kersten and Piersma1987; Zwarts & Blomert, Reference Zwarts and Blomert1990).
Eurasian curlew and lesser Charadrius mongolus or greater sand-plovers Charadrius leschenaultia fed on larger crabs than the other smaller plover species. Thus for crab burrow densities we calculated two energetic values, one measure including only the smaller four crab burrow categories, and the other including only the larger four crab burrow categories. The largest crab burrow size was only used by Uca spp., whereas the two smallest crab burrow sizes were only used by Scopimera spp..
We also recorded the number of times waders ingested prey during feeding observations using a 30x spotting telescope. Although 70% of the samples were only 2 minutes long, observations were occasionally extended up to 5 minutes if there was a particularly low feeding rate so that we would have more reliable estimates. Birds were selected randomly and we conducted observations on < 10% of the flock, feeding in different locations, to minimize the risk of resampling the same individual. For each observation we counted the total intake rate for different prey types and size classes. We conducted analyses on Eurasian curlew, lesser sand-plover, Kentish plover Charadrius alexandrinus and Malaysian plover Charadrius peronii because we could identify prey types for these species and obtain sufficient feeding samples at most of the habitats. Optimal light conditions, low wind and relatively large wader body size were required to assess swallow rates accurately. We estimated prey size by comparison to bill length (Yasué et al., Reference Yasué, Quinn and Cresswell2003). We were able to estimate relative sizes of bills and prey because we were capturing Malaysian plover during this field season and occasionally handling Kentish or lesser sand-plovers. We calculated the hourly energy intake rate of each species by multiplying swallow rates with the energetic value and assimilation efficiency for each prey type and size as discussed above.
Temporal variation in prey availability
At sites SPB and SPMF we used headlamps and sampled for prey at night (19.00–05.00) during low tide using the same methods as outlined above. In total we sampled 48 cores at night in December 2003 and February 2004 and 120 cores between January and March in 2005 over 10 matched sampling periods. We compared prey densities from diurnal and nocturnal sampling sessions that were within 5 days apart at the same month and tide level using a Wilcoxon's signed rank test of related samples.
To examine tidal variation in prey densities we repeatedly sampled benthic cores and crab burrows every hour at the falling tide in the same 200 m length of mudflat, between published tide heights of 0.8 and 2.0 m at sites KDMF and SPMF. We began at mid-level tides and then progressively took more samples as a greater area of the mudflat became exposed. In total we sampled 219 crab burrow quadrats and 471 benthic cores on 9 different days (4 at KDMF and 5 at SPMF). To analyse this non-independent, Poisson distributed data, we used a generalized linear mixed-effects model with Poisson distributed errors and included location and tide as fixed factors and sample date as a random factor (Venables & Ripley, Reference Venables and Ripley2002).
Temporary changes in behaviour
We assessed whether people caused temporary changes in the behaviour of waders at site SPB. First we related the total number of people and dogs to the presence or absence of waders. We examined temporary disturbance at SPB because this site had the highest human densities. In addition, human use at the beach was largely dominated by tourists (as opposed to local people) and so the number of people at the site varied more between days (weekend versus weekdays, for example). Eighty-six censuses were conducted on different days. We recoded wader counts into presence or absence data and used a binary logistic regression with the total number of people and dogs, tide height, and year included in the model.
At SPB we also conducted foraging observations on Eurasian curlew using the methods outlined above for energy intake rates. Although we also conducted feeding observations on other species, we were only able to obtain a sufficient number of intake rates at variable human densities at this site for Eurasian curlew. Mean energy intake rates (kJ h-1) were calculated for any replicate observations that we conducted on the same day and we used this value for analysis. In total 69 observations were conducted at low tide over 25 days. We used a linear regression on log-transformed data to test whether the total number of people and dogs (from census data) affected Eurasian curlew energy intake rates.
Results
Shorebird, human and dog densities
Wader densities differed amongst sites and year and were the highest at SPMF (Table 1, Fig. 2). Human densities appeared to be highest at SPB in March (Fig. 3). This is probably because of the number of domestic tourists who visited the site during the Thai summer holiday in this month. In contrast, people at the other four sites were generally local villagers and there was therefore much less temporal variability in the number of people present. Local people used these areas for mollusc digging, recreation, livestock grazing, shrimp trawling, logging and access to fishing boats. Although there was a slight increase in human use at SPMF in early February because of the abundance of cockles on the mudflats during this time, there were no other obvious temporal changes in human use at these five sites. Dog densities were the highest for the two sites near villages and did not change seasonally (Fig. 4).
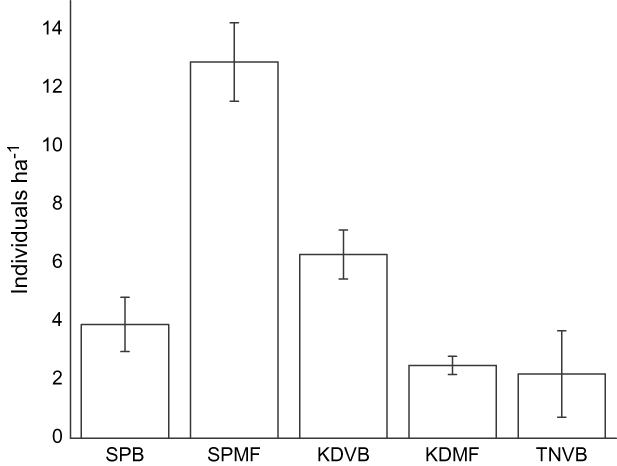
Fig. 2 Mean density of waders (with SE bars) in 2004 and 2005 at the five study sites (abbreviations as in Fig. 1).

Fig. 3 Variation in the monthly mean densities (with SE bars) of people at the five study sites (abbreviations as in Fig. 1).

Fig. 4 Mean dog densities (with SE bars) across the five study sites (abbreviations as in Fig. 1).
Table 1 Generalized linear models demonstrating factors affecting wader, human and dog densities. Factors were added sequentially to the null model with no factors.

Comparison of habitat quality among sites
Disturbance rates In total we conducted 115 disturbance watches at all sites. Natural disturbance rates were low. In over 120 hours of observations we only saw eight peregrine falcon Falco peregrinus attacks, one peregrine falcon kill and one attack by a Chinese sparrowhawk Accipiter soloensis. Natural disturbance rates did not vary between the five sites (Kruskal-Wallis weighted by flock size: χ24 = 4.96, P = 0.29, pooled mean 4.86 ± SE 1.9 seconds h-1 per individual; unweighted by flock size χ24 = 3.35, P = 0.50, 138.8 ± 30.1 sec h-1). The amount of time waders spent responding to human disturbances varied significantly among sites and was the highest at SPB (χ24 = 13.6, P = 0.008, n = 115, Fig. 5). The human disturbance rate at TNVB was low despite relatively high human and dog densities. This is probably because birds only formed flocks for a long enough period to conduct disturbance watches at TNVB when there were few people on the beach, and also because when birds were on TNVB they were clustered at the southern end of the beach furthest from the village.
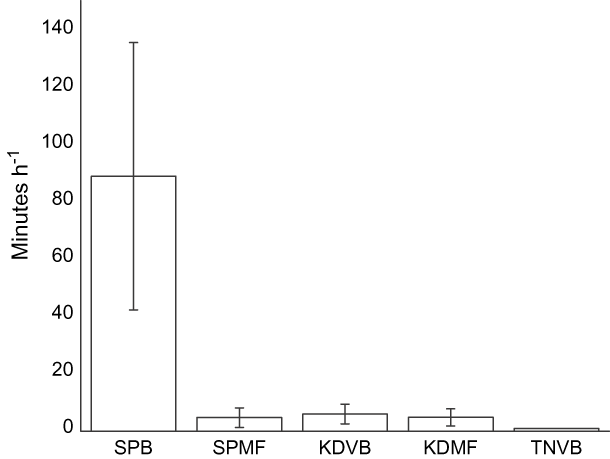
Fig. 5 Mean time (with SE bars) waders spent responding to anthropogenic sources of disturbance during 115 disturbance watches (abbreviations as in Fig. 1).
Prey availability Between the 2 years we sampled for benthic cores and crab burrows on 13, 12, 10, 14 and 12 different days at KDMF, KDVB, SPB, SPMF and TNVB, respectively. The majority of soft-bodied prey items found in benthic cores were polychaete worms (Families Nereidae and Nephtyidae, hereinafter worms) as well as molluscs (Family Tellinidae and Family Cardiidae). Species of crabs on the mudflat and beaches were ghost crabs (Family Ocypodidae: Ocypode spp., Macrophthalmus spp.), moon crabs (Family Matutidae), fiddler crabs (Family Ocypodidae, Uca vocan and Uca annul) and bubbler crabs (Family Ocypodidae, Scopimera spp.). Worm, mollusc and crab burrow abundance (in corresponding energetic values) were significantly different across sites (Kruskal-Wallis for worms: χ24 = 10.6, P = 0.031; molluscs χ24 = 22.4, P = 0.00017; crab burrow abundance for smaller crabs χ24 = 12.84, P = 0.012; larger crabs χ24 = 11.6, P = 0.020). The number of worms and molluscs and the total energetic value of invertebrate prey per core were highest at SPMF and SPB (Fig. 6a) whereas crab abundance was highest at KDVB and SPMF (Fig. 6b).

Fig. 6 Mean densities (with SE bars) of worms and molluscs in benthic cores (a) and small and large crab burrows (b) at the five study sites (abbreviations as in Fig. 1). These energetic values are based on bomb calorimetry or previously published values of caloric equivalents and assimilation efficiencies.
Foraging rates Polychaete worms were the main prey type for Pluvialis plovers, common redshank Tringa totanus, and stints (Calidris ruficollis and Calidris subminuta), whereas Eurasian curlew, Kentish and Malaysian plovers fed more frequently on fiddler or bubbler crabs. The lesser and greater sand-plover fed on both crabs and worms. For this analysis we only included sites and species where we had sample sizes > 5 observations at a site on a particular type of prey. Location had a significant effect on Eurasian curlew energy intake rate (Kruskal-Wallis χ23 = 19.1, P = 0.00027, n = 177) and Malaysian plover (χ23 = 14.2, P = 0.002, n = 116, Fig. 7) but not for lesser sand-plover (χ23 = 6.03, P = 0.197, n = 202) and Kentish plover (χ23 = 2.74, P = 0.601, n = 87). We were only able to obtain sufficient foraging samples for four out of the five habitats for Eurasian curlew and Malaysian plover to calculate energy intake rates.
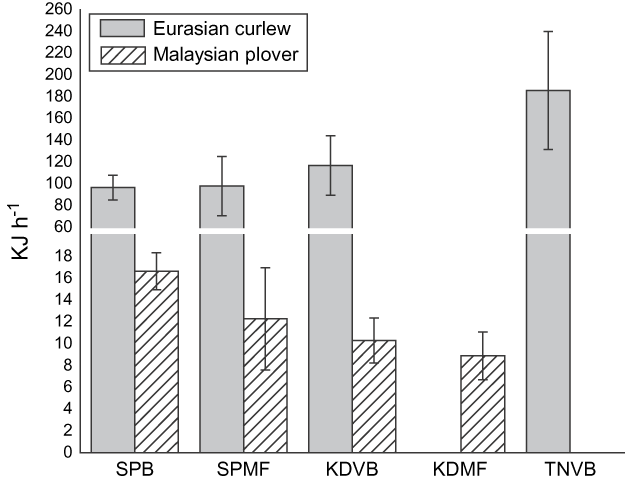
Fig. 7 Mean energy intake rates (with SE bars) for Eurasian curlew and Malaysian plover feeding at four of the study areas (abbreviations as in Fig. 1). We were not able to obtain foraging rates for Malaysian plover at TNVB or Eurasian curlew at KDMF.
Temporal variation in prey availability
Prey density in benthic cores did not differ significantly between night and day (Wilcoxon's signed rank test of related samples, n = 10 paired sample days for molluscs and worms: z = -1.01, P = 0.31, pooled mean 0.011 ± SE 0.006 kJ per 100 cm3, and z = -0.86, P = 0.38, 0.012 ± SE 0.039 kJ per 100 cm3, respectively). The density of small and large crab burrows differed significantly between night and day (Wilcoxon's signed rank test of related samples, n = 10 for small and large crabs: z = -2.29, P = 0.021 and z = -2.39, P = 0.016, respectively, Fig. 8). Crabs appeared to be more active and at the surface of the mudflat feeding during the day.
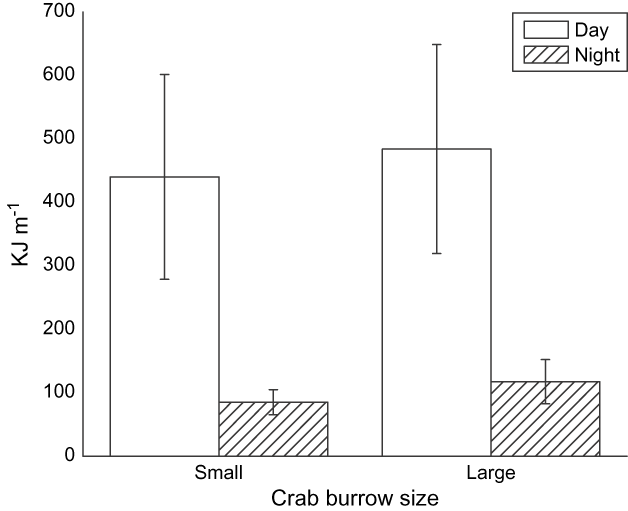
Fig. 8 Mean small and large crab burrow densities (with SE bars) observed during the day and night.
Tide heights had no significant effect on worm (generalized linear mixed-effects model t460 = -0.18, P = 0.861) and mollusc densities (t460 = 1.48, P = 0.141) in benthic cores when we controlled for site and sample date. Site did have a significant effect for both worm (t7 = 2.8, P = 0.25) and mollusc densities (t7 = 2.43, P = 0.045). Similarly tide height had no effect on small (t177 = -0.69, P = 0.491) and large crabs (t177 = -0.55, P = 0.58), although site did have an effect (small: t7 = 2.65, P = 0.0328; large: t7 = 2.9, P = 0.0228) .
Temporary changes in behaviour
The total number of people and dogs at SPB had no effect on whether there were high or low numbers of feeding birds (binary logistic regression: Wald = 0.471, df = 1, P = 0.493, n = 86). However, the total number of people and dogs significantly influenced Eurasian curlew foraging rates (Fig. 9).
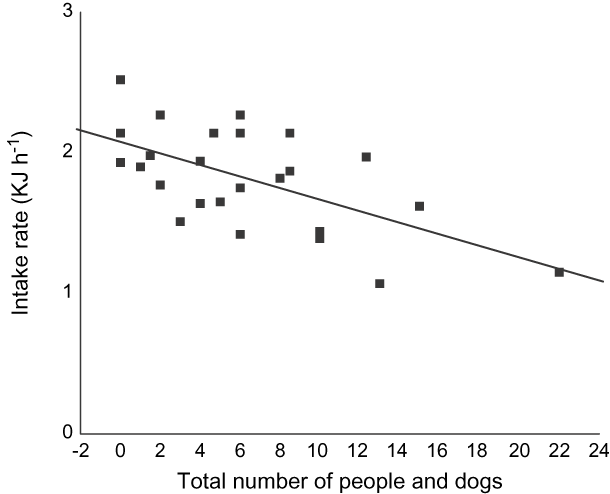
Fig. 9 The influence of the number of people and dogs on the beach on intake rates of Eurasian curlew (n = 25, adjusted r 2 = 0.18, P = 0.0213).
Discussion
In this study we compared habitat quality among five possible wader foraging areas, assessed the potential to change foraging time to avoid periods of higher human disturbance, and determined whether waders were displaced or experienced lower foraging rates at the site with the highest human disturbance. Our research demonstrates a theory-based approach to evaluate whether human disturbance could be a conservation concern for wintering waders.
Our research suggests that although there were differences in human disturbance levels, prey availability, and wader densities amongst sites, human disturbance may not have a significant impact on the birds because they may be able to extend foraging times for worms into the night and, for crabs and worms, across a wider range of tide heights. Moreover, even at the site with the highest densities of people, there was no indication that birds were temporarily displaced.
Although predation risk is probably an important determinant of wader habitat choice in other sites (Cresswell, Reference Cresswell1994), this may not be the case at Khao Sam Roi Yod National Park because there were few raptor attacks and the amount of time waders spent responding to false alarms did not vary significantly among sites.
Site SPB had substantially higher human densities and disturbance rates than the other sites, and relatively low wader densities. Birds may be under-using SPB because of human disturbance. SPB had higher levels of worm and mollusc densities than all habitats other than SPMF, and thus the costs of displacement are probably greater for wader species that feed on worms and molluscs rather than crabs (crab density was low at SPB). However, permanent displacement is unlikely to have a significant impact on fitness because SPMF is immediately adjacent to SPB, and SPMF has high prey densities and low disturbance rates. There was also no evidence of reduced seasonal prey availability at SPMF (M. Yasué, unpubl. data), or at any of the other sites and so it is unlikely that the displacement of birds from SPF to SPMF could have led to depletion of prey and reduced shorebird fitness. Although TNVB appeared to have relatively high human and dog densities, it is unlikely that the loss of this habitat has significant energetic costs to waders because of the relatively low availability of prey there.
It was unexpected that the energy intake rates of Malaysian plover and Eurasian curlew were not highest at the sites with the highest prey availability (CDVB and SPMF, for crabs, which were the main prey of these two species). However, energy intake rates are affected by a myriad of environmental factors such as prey availability and the energetic value of the prey, interference from other waders, perceived predation risk, human disturbance rates at a site, tidal state, as well as wader state variables, including hunger levels, and the health of the individuals (Triplet et al., Reference Triplet, Stillman and Goss-Custard1999). Consequently, a greater number of samples at each of the sites may be necessary to unravel the potential impacts of human disturbance on feeding rates.
In this study we conducted detailed measurements of a small number of study sites. However, future research could apply this energetic cost and predation risk framework to a greater number of sites, and develop a habitat selection model quantifying the effects of human disturbance relative to other important ecological factors (Yasué, Reference Yasué2006). Our study helps to identify the important variables and the methodology necessary to examine the potential costs of sub-optimal habitat use in a tropical system.
One limitation to our study is that almost all data were collected during the day. Although diel differences in prey availability were detected, nocturnal human and bird censuses or disturbance rate measurements would have yielded a more complete picture of the value of the different habitats. Moreover, as suggested above, a greater number of foraging observations on more species, such as the grey Pluvialis squatarola or golden plover P. apricaria, feeding on different prey types may improve the interpretability of the foraging rate data. With more foraging observations it may also be possible to detect seasonal changes in the response of Eurasian curlew to human disturbance. This could help detect habituation of birds to disturbances (Nisbet, Reference Nisbet2000), or declines in the response of birds to disturbances during periods when the cost of responding to the disturbance stimuli increases (Stillman & Goss-Custard, Reference Stillman and Goss-Custard2002; Beale & Monaghan, Reference Beale and Monaghan2004a; Yasué & Dearden, Reference Yasué and Dearden2006). In addition to energetic considerations, the predation environment could also change seasonally because of raptor migrations in February (DeCandido et al., Reference DeCandido, Nualsri, Allen and Bildstein2004).
Another limitation is that we did not have individually colour-banded birds to help detect whether birds switch feeding habitats based on disturbance levels. Individual marked birds would also help us understand territoriality and better interpret how different species may be more likely to be displaced from habitats than others.
We have outlined a range of ecological variables that could influence the fitness impacts of human disturbance on waders. To evaluate the impacts of human disturbance, managers should firstly conduct field observations to identify the key constraints that could influence fitness in their study area (e.g. time available to feed on polychaete worms influences fat deposition in redshank, which in turn can influence wintering survival or breeding success; dit Durell et al., 2008). Secondly, managers must evaluate how human disturbance influences these constraints (e.g. disturbance forces birds to spend 20% less time feeding on polychaete worms). Lastly, there is a need to evaluate whether birds are likely to incur costs from these behavioural changes (e.g. although birds can adjust by feeding more at night, there is lower prey availability and greater predation risk at this time).
This study also provides a framework for a zoning scheme that is based on an assessment of the value of each habitat, rather than just the number of birds, and may help to protect wildlife habitat whilst also allowing some human use. Such assessments are particularly important in areas such as Khao Sam Roi Yod National Park where there is no historic (i.e. pre-disturbance) data on habitat use patterns and where current shorebird spatial distributions may already reflect sub-optimal foraging decisions because of human disturbance. Information on habitat selection decisions of animals can be readily applied to conservation problems such as zoning or site selection in protected areas.
Although this study suggested that human disturbance may not be an important issue for wintering shorebirds in the Khao Sam Roi Yod National Park, the approach we used may be adapted to temperate environments or at stopover feeding sites where birds may have a harder time meeting energy budgets, or in regions with more avian predators where human disturbance could reduce fitness through direct predation. Moreover, even if human disturbance may not be an important conservation issue in some environments, it is still crucial to be able to discriminate between truly important and less important threats to biodiversity. This may help resource managers focus limited conservation funds on species or environments in which human disturbance may be an important conservation threat, or to other issues such as hunting or pollution that may also affect shorebird populations. Finally, promoting access to wildlife and ecotourism activities such as bird watching is a crucial part of the rationale for increasing the size of the protected area estate. However, to do so in the absence of science-based management guidelines that will ensure that acceptable disturbance levels are not exceeded is self-defeating for conservation purposes (Duffus & Dearden, Reference Duffus and Dearden1990). The approach outlined here illustrates a science-based approach to making such assessments.
Acknowledgements
Thanks to George Gale, Philip Round and Andrew Pierce in Bangkok, staff at Khao Sam Roi Yod National Park, and the villagers of Bonok for equipment and logistical support. MY was supported by a PGS-D NSERC Canada, and research was funded by PD's SSHRC Canada research grant. Jennifer Gill and an anonymous reviewer are thanked for comments that significantly improved the manuscript, and Ole Heggen for creating a map of the study area.
Biographical sketches
Mai Yasué is now carrying out research on sea lions and grey whales in marine protected areas in Baja California, Mexico, and on coral reefs at Bohol in the Philippines. Her research focuses on using ecological and socio-economic indicators to assess and improve the effectiveness of marine protected areas in data-poor regions. Philip Dearden has worked on topics that range from natural science (seagrass ecology, whale shark monitoring, coral reef assessments) to social science (economic impacts of diving, marine protected area governance, indigenous perspectives), and the relationships between them, in South-east Asia and British Columbia. A main focus in South-east Asia has been the development and assessment of incentive-based conservation activities that assist local communities in protecting biodiversity. Arwyne Moore was a biology cooperative education undergraduate student at the time of this study.


