


Statement of Research Significance
Research Questions:
-
This study aimed to investigate the validity, sensitivity, and specificity of the Brief Executive Language Screen – Sentence Completion (BELS-SC) subtest, as a standalone measure of executive functions in an acute to sub-acute stroke sample.
-
We investigated whether left and right hemisphere patients performed differently on the BELS-SC.
Main Findings:
-
The BELS-SC demonstrated construct, convergent, and divergent validity.
-
Sensitivity was good when differentiating stroke patients from controls, and executive function impaired versus intact groups, although specificity was poorer only when classifying stroke patients and controls.
-
Although left and right hemisphere groups performed worse than controls on the BELS-SC, the right hemisphere group were particularly impaired on Inhibition.
Study Contributions:
-
This study introduces a brief ( <5 minutes), executive function screen, which provides insight into multiple executive functions.
-
Its use in a stroke population will help inform rehabilitation needs and for more in-depth neuropsychological testing.
Introduction
Executive functions are vital for adaptive and goal-directed behaviors, and everyday activities like driving, behaving appropriately, working, and managing finances (Elliot, Reference Elliott2003; Rabbitt, Reference Rabbitt1997). Executive dysfunction is common post-stroke, and can predict long-term stroke outcomes, meaning assessment of executive functions in acute (1 – 7 days) and early sub-acute (7 days – 3 months) stages is vital for appropriate rehabilitation (Lesniak et al., Reference Lesniak, Bak, Czepiel, Seniow and Czlonkowska2008; Nys et al., Reference Nys, van Zandvoort, de Kort, van der Worp, Jansen, Algra, de Haan and Kappelle2005, Reference Nys, van Zandvoort, de Kort, Jansen, De Haan and Kappelle2007; Pohjasvaara et al., Reference Pohjasvaara, Leskelä, Vataja, Kalska, Ylikoski, Hietanen, Leppävuori, Kaste and Erkinjuntti2002; Veldsman et al., Reference Veldsman, Werden, Egorova, Khlif and Brodtmann2020; Wolf, Reference Wolf2011). However, executive functions are typically not comprehensively assessed in an acute stroke setting; thus, deficits can go undetected (Wolf, Reference Wolf2011). This study investigates a brief (< five minutes) novel bedside executive function screen based on sentence completion tests (e.g., Hayling Sentence Completion Test [HSCT]; Burgess & Shallice, Reference Burgess and Shallice1996) to assess key executive functions (initiation, selection, inhibition, and strategy use).
Initiation
Initiation is required for voluntary generation of verbal and nonverbal (action) responses (Horne et al., Reference Horne, Ceslis, Mosley, Adam and Robinson2023; Klaus et al., Reference Klaus, Alves da Silva and Costa2019; Martin et al., Reference Martin, Barker, Gibson and Robinson2021; Robert et al., Reference Robert, Lanctôt, Agüera-Ortiz, Aalten, Bremond, Defrancesco, Hanon, David, Dubois, Dujardin, Husain, König, Levy, Mantua, Meulien, Miller, Moebius, Rasmussen, Robert and Manera2018). In clinical settings, verbal (e.g., word fluency) and nonverbal (e.g., Delis–Kaplan Executive Function System Design Fluency Test; Delis, Reference Delis2001) fluency tasks are frequently used to measure initiation or voluntary response generation (Baldo et al., Reference Baldo, Shimamura, Delis, Kramer and Kaplan2001; Henry & Crawford, Reference Henry and Crawford2004; Houston et al., Reference Houston, Delis, Lansing, Jacobson, Cobell, Salmon and Bondi2005; LaDuke et al., Reference LaDuke, Barr, Brodale and Rabin2018; Pettit et al., Reference Pettit, McCarthy, Davenport and Abrahams2013; Zhao et al., Reference Zhao, Guo and Hong2013). Verbal initiation is also frequently captured via sentence completion tasks, which require the quick generation of one word to meaningfully complete a sentence (Bloom & Fischler, Reference Bloom and Fischler1980; Burgess & Shallice, Reference Burgess and Shallice1996). Impairment can present as reduced conversational or connected speech, even in patients without frank language disorders (i.e., aphasia: Barker et al., Reference Barker, Young and Robinson2017; Costello & Warrington, Reference de Lacy Costello and Warrington1989; Gold et al., Reference Gold, Nadeau, Jacobs, Adair, Rothi and Heilman1997; Law et al., Reference Law, Young, Pinsker and Robinson2015; Robinson et al., Reference Robinson, Blair and Cipolotti1998, Reference Robinson, Shallice and Cipolotti2005; Warren et al., Reference Warren, Warren, Fox and Warrington2003). Verbal initiation deficits and sustained initiation (energization) have been linked to the bilateral frontal regions (Burgess & Shallice, Reference Burgess and Shallice1996; Robinson et al., Reference Robinson, Shallice and Cipolotti2006, Reference Robinson, Spooner and Harrison2015a; Volle et al., Reference Volle, de Lacy Costello, Coates, McGuire, Towgood, Gilbert, Kinkingnehun, McNeil, Greenwood, Papps, van den Broeck and Burgess2012) and fronto-medial region, particularly the supplementary motor area (Ardila, Reference Ardila2020; Satoer et al., Reference Satoer, Vincent, Smits, Dirven and Visch-Brink2013; Stuss & Alexander, Reference Stuss and Alexander2007). The supplementary motor area has also been implicated in mutism, suggesting medial prefrontal involvement in initiation processes (Brust et al., Reference Brust, Plank, Burke, Guobadia and Healton1982; Geranmayeh et al., Reference Geranmayeh, Chau, Wise, Leech and Hampshire2017; Krainik et al., Reference Krainik, Lehéricy, Duffau, Capelle, Chainay, Cornu, Cohen, Boch, Mangin, Le Bihan and Marsault2003; Nagaratnam et al., Reference Nagaratnam, Nagaratnam, Ng and Diu2004).
Selection
Selection is an executive process that involves choosing one response when there are multiple competing ideas available, and is vital in task-setting and decision-making (Brass & von Cramon, Reference Brass and von Cramon2004; Shallice & Cipolotti, Reference Shallice and Cipolotti2018). Converging evidence from lesion (group and single case), neuroimaging and transcranial direct current stimulation studies point towards involvement of the left inferior frontal gyrus (LIFG) in selection processes (Benedek et al., Reference Benedek, Jauk, Fink, Koschutnig, Reishofer, Ebner and Neubauer2014; Costello & Warrington, Reference de Lacy Costello and Warrington1989; Fink et al., Reference Fink, Grabner, Benedek, Reishofer, Hauswirth, Fally, Neuper, Ebner and Neubauer2009; Madden et al., Reference Madden, Sale and Robinson2019; Moss et al., Reference Moss, Abdallah, Fletcher, Bright, Pilgrim, Acres and Tyler2005; Robinson, Reference Robinson2013; Robinson et al., Reference Robinson, Blair and Cipolotti1998, Reference Robinson, Shallice and Cipolotti2005, Reference Robinson, Shallice, Bozzali and Cipolotti2010, Reference Robinson, Walker, Biggs and Shallice2016; Schnur et al., Reference Schnur, Lee, Coslett, Schwartz and Thompson-Schill2005, Reference Schnur, Schwartz, Kimberg, Hirshorn, Coslett and Thompson-Schill2009; Thompson-Schill et al., Reference Thompson-Schill, D’Esposito, Aguirre and Farah1997; Zhang et al., Reference Zhang, Feng, Fox, Gao and Tan2004). Selection deficits have also been documented in a patient following a left basal ganglia stroke who did not present with aphasia (Crescentini et al., Reference Crescentini, Lunardelli, Mussoni, Zadini and Shallice2008). Together, findings suggest a crucial role of the left posterior frontal region in selection processes.
Inhibition
Inhibition is the ability to purposefully suppress an automatic, prepotent, or dominant response (Aron et al., Reference Aron, Robbins and Poldrack2004, Reference Aron, Robbins and Poldrack2014; Miyake et al., Reference Miyake, Friedman, Emerson, Witzki, Howerter and Wager2000; Robinson et al., Reference Robinson, Cipolotti, Walker, Biggs, Bozzali and Shallice2015b, Reference Robinson, Butterworth and Cipolotti2015c, Reference Robinson, Walker, Biggs and Shallice2016, Reference Robinson, Shi, Nott and Ceslis2021). Deficits can manifest as inappropriate behavior, and tangential or unintelligible speech due to an inability to stop the production of off-topic, inappropriate, or irrelevant ideas (e.g., Robinson et al., Reference Robinson, Butterworth and Cipolotti2015c). Concerns surrounding whether inhibition tasks truly capture inhibition have been raised, particularly as some tests do not require inhibition to perform well. For example, Aron and colleagues (2004, 2014) have argued that the Stroop Test (Stroop, Reference Stroop1935) captures error detection or interference control, rather than prepotent response inhibition. Further, performance on the Stroop Test can be enhanced by a visual strategy (naming the color of the last letter of each word), meaning the word itself is not processed, which negates the need for inhibition of the automatic response (i.e., to read the word rather than name the color; Aron et al., Reference Aron, Robbins and Poldrack2004, Reference Aron, Robbins and Poldrack2014; Stuss & Alexander, Reference Stuss and Alexander2007; Volle et al., Reference Volle, de Lacy Costello, Coates, McGuire, Towgood, Gilbert, Kinkingnehun, McNeil, Greenwood, Papps, van den Broeck and Burgess2012). While the HSCT theoretically requires the full meaning of the sentence to be processed, one strategy for providing an unconnected word is to generate an alternate word while ignoring the sentence (e.g., “The captain wanted to stay with the sinking”… “lamp”). True inhibition requires a produced response, before it can be overridden and suppressed (Aron et al., Reference Aron, Robbins and Poldrack2014; Friedman & Miyake, Reference Friedman and Miyake2004; Li et al., Reference Li, Chen, Zhang, Li and Li2021; Miyake et al., Reference Miyake, Friedman, Emerson, Witzki, Howerter and Wager2000). For the HSCT, this would require the same sentence to be given in both initiation and suppression conditions, which is not the case.
On verbal and nonverbal inhibition tasks, neuroimaging, lesion and behavioral studies have consistently implicated right posterior frontal regions (Aron et al., Reference Aron, Robbins and Poldrack2004, Reference Aron, Robbins and Poldrack2014; Cipolotti et al, Reference Cipolotti, Healy, Spanò, Lecce, Biondo, Robinson, Chan, Duncan, Shallice and Bozzali2016a, Reference Cipolotti, Spanò, Healy, Tudor-Sfetea, Chan, White, Biondo, Duncan, Shallice and Bozzali2016b; Kawashima et al., Reference Kawashima, Satoh, Itoh, Ono, Furumoto, Gotoh, Koyama, Yoshioka, Takahashi, Takahashi, Yanagisawa and Fukuda1996; Konishi et al., Reference Konishi, Nakajima, Uchida, Sekihara and Miyashita1998; Robinson et al., Reference Robinson, Cipolotti, Walker, Biggs, Bozzali and Shallice2015b; Volle et al., Reference Volle, de Lacy Costello, Coates, McGuire, Towgood, Gilbert, Kinkingnehun, McNeil, Greenwood, Papps, van den Broeck and Burgess2012; Wilson et al., Reference Wilson, Evans, Emslie, Alderman and Burgess1998). However, the Stroop and HSCT are behaviorally and anatomically dissociable, with HSCT suppression performance linked to the right lateral prefrontal cortex and left frontal regions, and Stroop performance linked to the left lateral superior, middle, and inferior frontal regions (Cipolotti et al., Reference Cipolotti, Healy, Spanò, Lecce, Biondo, Robinson, Chan, Duncan, Shallice and Bozzali2016a, Reference Cipolotti, Spanò, Healy, Tudor-Sfetea, Chan, White, Biondo, Duncan, Shallice and Bozzali2016b; George et al., Reference George, Ketter, Parekh, Rosinsky, Ring, Casey, Trimble, Horwitz, Herscovitch and Post1994; Moore et al., Reference Moore, Byrne, Gibson, Ford and Robinson2024; Robinson et al., Reference Robinson, Cipolotti, Walker, Biggs, Bozzali and Shallice2015b; Taylor et al., Reference Taylor, Kornblum, Lauber, Minoshima and Koeppe1997).
Strategy use
Strategy generation and implementation is an executive process that helps to complete tasks efficiently and effectively, which also involves planning and goal evaluation (Burgess & Shallice, Reference Burgess and Shallice1996; Levine et al., Reference Levine, Stuss, Milberg, Alexander, Schwartz and Macdonald1998; Robinson et al., Reference Robinson, Cipolotti, Walker, Biggs, Bozzali and Shallice2015b, Reference Robinson, Walker, Biggs and Shallice2016). Strategy is a critical aspect of neurorehabilitation (Swanton et al., Reference Swanton, Gustafsson, Froude, Hodson, McInerney, Cahill and Lannin2020) and thus requires further investigation as a distinct executive process in the context of acute stroke and cognitive assessment (e.g., use of meta-cognitive strategies; Cicerone et al., Reference Cicerone, Goldin, Ganci, Rosenbaum, Wethe, Langenbahn, Malec, Bergquist, Kingsley, Nagele, Trexler, Fraas, Bogdanova and Harley2019; McEwen et al., Reference McEwen, Donald, Jutzi, Allen, Avery, Dawson and Linkewich2019). Strategy is observed on the HSCT, whereby healthy adults typically generate and implement visual and semantic strategies (e.g., looking around the room, items from the same category) to enhance suppression (Burgess & Shallice, Reference Burgess and Shallice1996; Pluck et al., Reference Pluck, Villagomez-Pacheco, Karolys, Montaño-Córdova and Almeida-Meza2019; Robinson et al., Reference Robinson, Cipolotti, Walker, Biggs, Bozzali and Shallice2015b). To our knowledge, strategy use is not formally assessed or quantified in stroke and therefore under-researched, despite implications for cognitive and functional rehabilitation (Swanton et al., Reference Swanton, Gustafsson, Froude, Hodson, McInerney, Cahill and Lannin2020; Van den Broek, Reference Van den Broek2005). Frontal lesion patients show a reduction in strategy use on the HSCT relative to healthy controls and posterior lesion patients (Burgess & Shallice, Reference Burgess and Shallice1996). A right lateralization effect for strategy use on the HSCT has also been reported; the proportion of correct strategy-based responses was 11% for right frontal patients, compared to 26% for left, and 29% for healthy controls (Robinson et al., Reference Robinson, Cipolotti, Walker, Biggs, Bozzali and Shallice2015b). This was despite right frontal patients having longer response times (i.e., more time to think of a response/strategy). Findings from single case studies also suggest a distinction between strategy generation and implementation (Robinson et al., Reference Robinson, Spooner and Harrison2015a, Reference Robinson, Walker, Biggs and Shallice2016).
Assessment
Fatigue, time, and hospital constraints impact acute stroke cognitive assessment, which means lengthy neuropsychology batteries are not practical. Assessment must be brief and tap domains known to be impacted in stroke (i.e., executive functions). Current stroke screens assess core language, memory, attention, or neglect; however, incorporation of executive functions is either minimal (i.e., one executive process, e.g., switching: Oxford Cognitive Screen [OCS], Demeyere et al., Reference Demeyere, Riddoch, Slavkova, Bickerton and Humphreys2015) or absent from these tools (e.g., Quick Aphasia Battery [QAB], Wilson et al., Reference Wilson, Eriksson, Schneck and Lucanie2018, Reference Wilson, Entrup, Schneck, Onuscheck, Levy, Rahman and Kirshner2023). Executive functions measured in current stroke screens include switching, problem-solving and goal attainment (Trails and Rule Finding subtests – OCS-Plus; Demeyere et al., Reference Demeyere, Haupt, Webb, Strobel, Milosevich, Moore, Wright, Finke and Duta2021), and inhibition/flexibility (Luria Tapping subtest – Cognitive Assessment for Stroke Patients; CASP; Benaim et al., Reference Benaim, Wauquiez, Pérennou, Piscicelli, Lucas-Pineau, Bonnin-Koang, Vuadens, Binquet, Bourredjem and Devilliers2022). The BELS Test (Robinson et al., Reference Robinson, Shi, Nott and Ceslis2021) is a validated cognitive screening test, with high sensitivity (.87) and specificity (.89) for distinguishing stroke patients without aphasia from healthy age-matched controls (Phillips et al., Reference Phillips, Byrne, Gibson, Gilbert, Ford, Marsh and Robinson2024). Its Sentence Completion subtest (BELS-SC) is based on the HSCT (Burgess & Shallice, Reference Burgess and Shallice1997), and captures executive processes of initiation, selection, inhibition, and strategy. However, it has not yet been introduced or investigated as a standalone bedside executive function screen.
Like the HSCT, the BELS-SC has two parts: Initiation and Inhibition. However, the BELS-SC is novel and distinct from the HSCT in three ways to expand the executive functions measured. The key differences are: 1. Incorporation of a selection component in the Initiation section; 2. Increased inhibition demands in the Inhibition section; and 3. Introduction of a strategy score in the Inhibition section.
Aims
This study aimed to 1) determine construct validity and internal consistency of the BELS-SC via Principal Component Analysis (PCA) and Cronbach’s Alpha, 2) determine sensitivity and specificity of the BELS-SC as a standalone test of executive function, 3) establish convergent and divergent validity of the BELS-SC with the HSCT, 4) using known-groups methodology, examine how left and right hemisphere stroke patients performed on the BELS-SC initiation, selection, inhibition and strategy subtests, and other executive function measures (Stroop Interference and Trails). It was hypothesized that 1) PCA would show four components of the BELS-SC (initiation, selection, inhibition, and strategy), 2) the BELS-SC would have high sensitivity (true positives), and specificity (few false positives), 3) the BELS-SC would demonstrate convergent and divergent validity with the HSCT, and 4) overall, both LHS and RHS would perform worse than controls on the BELS-SC and standard executive tests; LHS and RHS would perform similarly on BELS-SC Initiation; LHS would be more impaired on BELS-SC Selection; and RHS would be more impaired on BELS-SC Inhibition and Strategy.
Method
Data was collected for an ongoing project (started in 2017) from stroke units (Princess Alexandra Hospital, Royal Brisbane and Women’s Hospital, Surgical Treatment and Rehabilitation Service) by supervised clinical neuropsychology registrars and doctoral candidates (publications to date: Horne et al., Reference Horne, Gibson, Byrne, Bender and Robinson2022; Moore et al., Reference Moore, Byrne, Gibson, Ford and Robinson2024; Phillips et al., Reference Phillips, Byrne, Gibson, Gilbert, Ford, Marsh and Robinson2024). Ethical approval was given by the Metro South and Metro North Queensland Health and the University of Queensland Human Research Ethics Committees (HREC/16/QPAH/793), and research was completed in accordance with the Helsinki Declaration. Informed written consent was obtained from all participants. Data is available on the Open Science Framework (https://osf.io/py6xb/). The data used in this study is part of a larger study and was previously analyzed as part of the global BELS score in a recent publication (Phillips et al., Reference Phillips, Byrne, Gibson, Gilbert, Ford, Marsh and Robinson2024). This is a secondary comprehensive analysis focused on one of 11 BELS subtests.
Participants
Stroke patients
Inclusion criteria for patients were first-time stroke (confirmed by brain imaging), aged 18 or older, and fluent English. Exclusion criteria were Transient Ischemic Attack, or diagnosis of another neurological disorder. Participants who did not complete the BELS-SC subtest were excluded. Reasons for non-completion included fatigue and hospital interruptions. One-hundred-and-nine patients were recruited, with a final sample of 88 stroke patients tested on average 17.39 days post-stroke (43% female; handedness: 90% right, 1% forced right, 9% left; M AGE = 62.88, SD AGE = 14.10; M EDUCATION = 12.03, SD EDUCATION = 2.71). There were 80 ischemic stroke patients, eight hemorrhagic patients, 57 RHS, 29 LHS, and two bilateral patients. See Table 1 for stroke patients’ demographic and stroke lesion information.
Table 1. Stroke patients’ demographic descriptive statistics
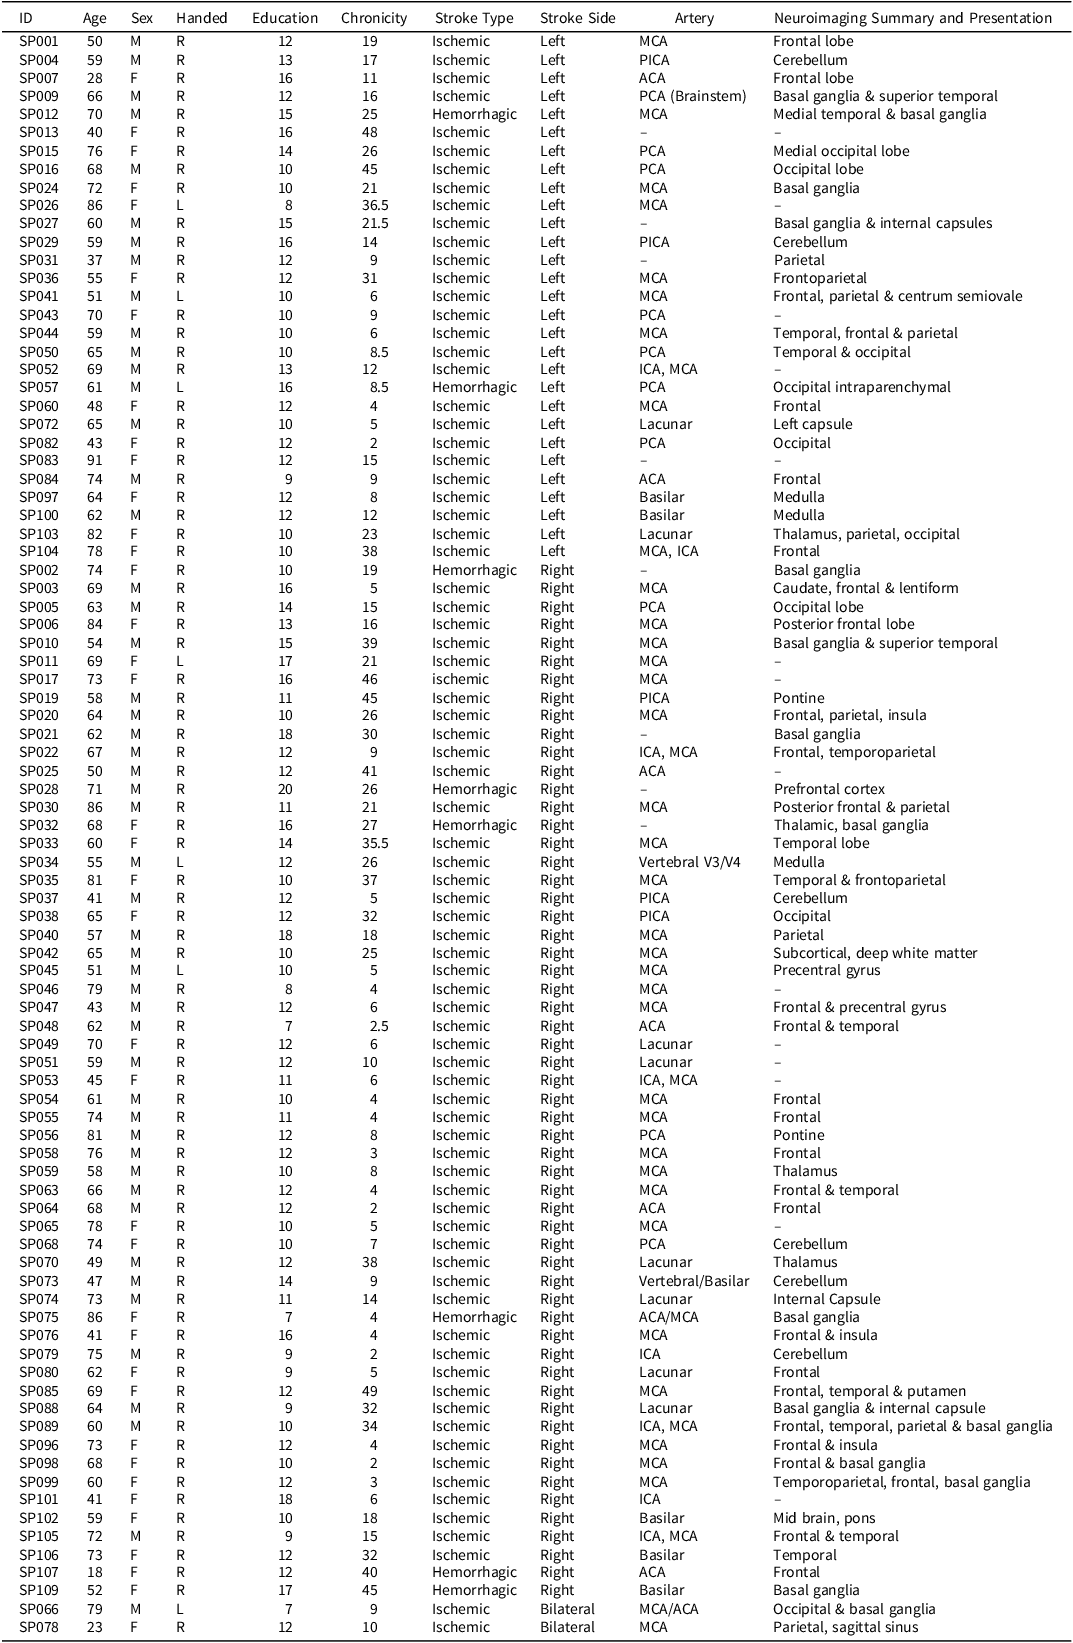
Note: SP002 – “Small Vessel” (Basil Ganglia – lacunar?); SP013 – “NA” (but thalamic – Lacunar?); SP022 – MCA (secondary to ICA occlusion); SP089 – MCA (secondary to ICA dissection). Chronicity refers to number of days post-stroke.
Controls
Inclusion criteria for healthy controls were fluent English speakers aged 18 years or older. Exclusion criteria was any neurological disorder, or impairment (<5th percentile) on more than one neuropsychology test which would meet criteria for mild cognitive impairment or other disorders. Participants were recruited via the University of Queensland networks. The final control group consisted of 116 healthy adults (47% female; handedness: 92% right, 1% right/ambidextrous, 7% left; M AGE = 63.15, SD AGE = 13.52; M EDUCATION = 15.12, SD EDUCATION = 3.56).
Measures
The following cognitive domains were assessed via standard neuropsychology tests (administered according to test manuals) to provide a cognitive baseline and characterize the groups: visual perception (Visual Object Spatial Perception: Incomplete Letters; Warrington & James, Reference Warrington and James1991); premorbid optimal level of function (National Adult Reading Test 2nd Edition; Nelson & Willison, Reference Nelson and Willison1991); fluid intelligence (Advanced Progressive Matrices Set 1; Raven, Reference Raven1965, 1994); naming (Boston Naming Test Short Form; Mack et al., Reference Mack, Freed, Williams and Henderson1992); processing speed and switching/flexibility (Trails Making Test Part A and B; Strauss et al., Reference Strauss, Sherman and Spreen2006); inhibition (Victoria Stroop; Spreen & Strauss, Reference Spreen and Strauss1998; initiation and inhibition (Hayling Sentence Completion Test [HSCT]; Burgess & Shallice, Reference Burgess and Shallice1996).
Hayling sentence completion test
The HSCT (Burgess & Shallice, Reference Burgess and Shallice1996) has two parts: Initiation and Inhibition. Like the BELS-SC, items are from Bloom & Fischler (Reference Bloom and Fischler1980). Fifteen initiation items are administered first in which participants must quickly complete a sentence with one word. Initiation is scored via reaction time, rounded down to the nearest second; faster times indicate better performance. A different set of fifteen items are then administered for Inhibition. Participants must quickly produce a word completely unconnected to the sentence. Inhibition is scored via reaction time rounded down to the nearest second (faster times indicate better performance), and accuracy (higher scores indicate better performance). Inhibition errors are classified as either blatant (“The captain wanted to stay with the sinking… ‘ship’”) or partially connected (“The captain wanted to stay with the sinking… ‘car’”).
BELS-SC
The BELS-SC takes up to five minutes to complete. Items, like the HSCT, were drawn from Bloom & Fischler (Reference Bloom and Fischler1980). See Supplementary Materials for BELS-SC stimuli and scoring and Phillips and colleagues (2024) for BELS administration and scoring instructions.
Part one: initiation
The initiation condition (ten items) is administered first and requires
participants to meaningfully complete a sentence with one word as quickly as possible (e.g., “I could not remember his” … “name”). Selection was incorporated by including five high constraint (HC; low selection) items, and five low constraint (LC; high selection) items in the Initiation section. HC sentences have one or few dominant responses, whereas LC sentences have multiple competing responses (Bloom and Fischler, Reference Bloom and Fischler1980). An example of an HC sentence is: “The paint turned out to be the wrong…,” where “color” is the dominant response. In contrast, the LC sentence “The Smiths had never visited that…,” can elicit multiple responses (e.g., “city,” “country,” “town,” “neighborhood,” “museum,” “park,” “beach”). Selection demands are low for HC sentences but high for LC sentences because multiple competing response options require a selection process to preferentially choose one word that will be produced (Robinson et al., Reference Robinson, Shallice and Cipolotti2005, Reference Robinson, Shi, Nott and Ceslis2021). Initiation is captured predominantly via response times (time between end of stimuli presentation and when participant begins response; Burgess & Shallice, Reference Burgess and Shallice1996). However, selection impairments can either manifest as a failure to produce a word (e.g., in severe cases – Robinson et al., Reference Robinson, Blair and Cipolotti1998; Reference Robinson, Shallice and Cipolotti2005; Reference Robinson2013) or as disproportionately long response times for LC compared to HC items (e.g., in healthy aging – Barker et al., Reference Barker, Ceslis and Robinson2022). Responses on the Initiation section are scored on both accuracy (one-two word answer, response within 20 s, and word meaningfully completes sentence), and response time to two decimal places. A total weighted score out of 10 for BELS-SC Initiation incorporates both reaction times and accuracy (i.e., 2 points for accuracy, 4 points for HC reaction time, 4 points for LC reaction time). See Supplementary Materials for reaction time score cut-offs.
Part two: inhibition
The ten Initiation sentence items are readministered for the Inhibition section; however, participants are required to produce a word completely unconnected to the sentence (e.g., “The paint turned out to be the wrong” … “running”). Readministering the same Initiation items was implemented to increase inhibition demands. This is a key difference from the HSCT, which has different items for Inhibition. On the BELS-SC, the participant has already produced a meaningful word to each sentence (i.e., they have processed the semantic context, lexical items, and grammatical structure of the sentence) immediately prior to having to suppress and override each specific response. For example, “They sat together without speaking a single…” “word,” where “word” must then be suppressed in the Inhibition condition. This was based on the notion that an initial response must be elicited, for subsequent suppression of that response to occur (Aron et al., Reference Aron, Robbins and Poldrack2014; Friedman & Miyake, Reference Friedman and Miyake2004; Li et al., Reference Li, Chen, Zhang, Li and Li2021; Miyake et al., Reference Miyake, Friedman, Emerson, Witzki, Howerter and Wager2000). Performance on BELS-SC Inhibition was captured via accuracy and scored out of ten (see Table 2 for types of errors). Strategy . The BELS-SC extends upon the HSCT by incorporating a score out of two to reflect the number of instances of visual and/or semantic strategy use. An example of a visual strategy is naming things around the room, or a semantic strategy may involve naming animals or multiple items from a semantic category (e.g., fruits, colors, furniture, types of trees). A score of zero is given for no instances of strategy use; a score of one is given for one to two instances of strategy use; and a score of two is given to three or more instances of strategy use. For example, if for five items a participant named an object in the room, that would count for 5 instances of strategy use and be awarded a score of two. A total possible score of 22 can be achieved on the BELS-SC (ten points for Initiation/Selection, ten points for Inhibition, and two points for strategy), with higher scores reflecting better performance.
Table 2. Examples of BELS-SC inhibition errors
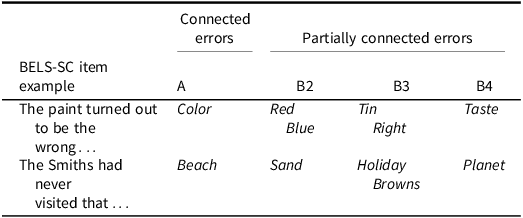
Note: A Error = blatant (sentence is meaningful). B2 Error = response is semantic or opposite to the “meaningful” A response. B3 Error = response is semantic to the sentence. B4 Error = response is bizarre.
Analyses
IBM SPSS Statistics 27 was used for all analyses. An alpha of .05 was set for analyses, except when Bonferroni corrections were applied for multiple comparisons (as stated in Table notes). Three PCAs were conducted to determine construct validity, followed by Cronbach’s Alpha to assess internal consistency of PCA factors and individual BELS-SC items. Next, a series of Receiver Operating Characteristic (ROC) curve analyses were performed to determine sensitivity and specificity of a cut-off score on the BELS-SC when a) distinguishing stroke patients from controls, and b) distinguishing participants who were impaired and intact on standard measures of executive functions. Bivariate Pearson’s (and Kendall’s Tau) correlations were used to determine relationships between BELS, HSCT, and Stroop tests. Outliers more than three standard deviations above or below the mean were removed and log transformations were performed on Initiation reaction time variables. To determine differences between healthy controls, LHS, and RHS on BELS-SC subtests, as well as on standard neuropsychology tests non-parametric tests were used (Kruskal-Wallis and Mann Whitney U), due to data not meeting assumptions of normality. Following data transformation, assumptions of normality remained unmet, and it was not possible to control for demographic differences (education) using parametric analyses. Due to the broad spectrum of stroke and lower education being one risk factor (McHutchison et al., Reference McHutchison, Backhouse, Cvoro, Shenkin and Wardlaw2017; Yusuf et al., Reference Yusuf, Joseph, Rangarajan, Islam, Mente, Hystad and Dagenais2020), it was important to retain a broad range of controls. Thus, like other stroke cognitive screening validation studies (OCS – Demeyere et al., Reference Demeyere, Riddoch, Slavkova, Bickerton and Humphreys2015; QAB – Wilson et al., Reference Wilson, Eriksson, Schneck and Lucanie2018), our stroke group had fewer years of education than controls. However, we provide a supplementary analysis that subsampled 70 healthy controls selected to be age and education matched to stroke patients (Borne et al., Reference Borne, Thienel, Lupton, Guo, Mosley, Behler, Giorgio, Adam, Ceslis, Bourgeat, Fazlollahi, Maruff, Rowe, Masters, Fripp, Robinson and Breakspear2024; Kover & Atwood, Reference Kover and Atwood2013; Mervis & John, Reference Mervis and John2008).
Results
Descriptive statistics for baseline neuropsychology measures and BELS-SC subtests for controls and LHS and RHS stroke groups are reported in Table 3 (see Supplementary Table 1 for whole stroke group descriptive statistics). Patient groups were matched on education, number of days assessed post-stroke (U = 756.50, p = .522), and all baseline neuropsychology tests (See Supplementary Table 2). All groups were matched in age, visual perception, and inhibition/switching (Stroop Error Percentile and Interference). Controls had three years more education than patients and performed significantly better than patient groups on premorbid and fluid intelligence, naming, and processing speed. Controls also performed significantly better than LHS on Trails Switching.
Table 3. DescriptIve statistics for controls and stroke patients (demographic, neuropsychology baseline, BELS-SC)
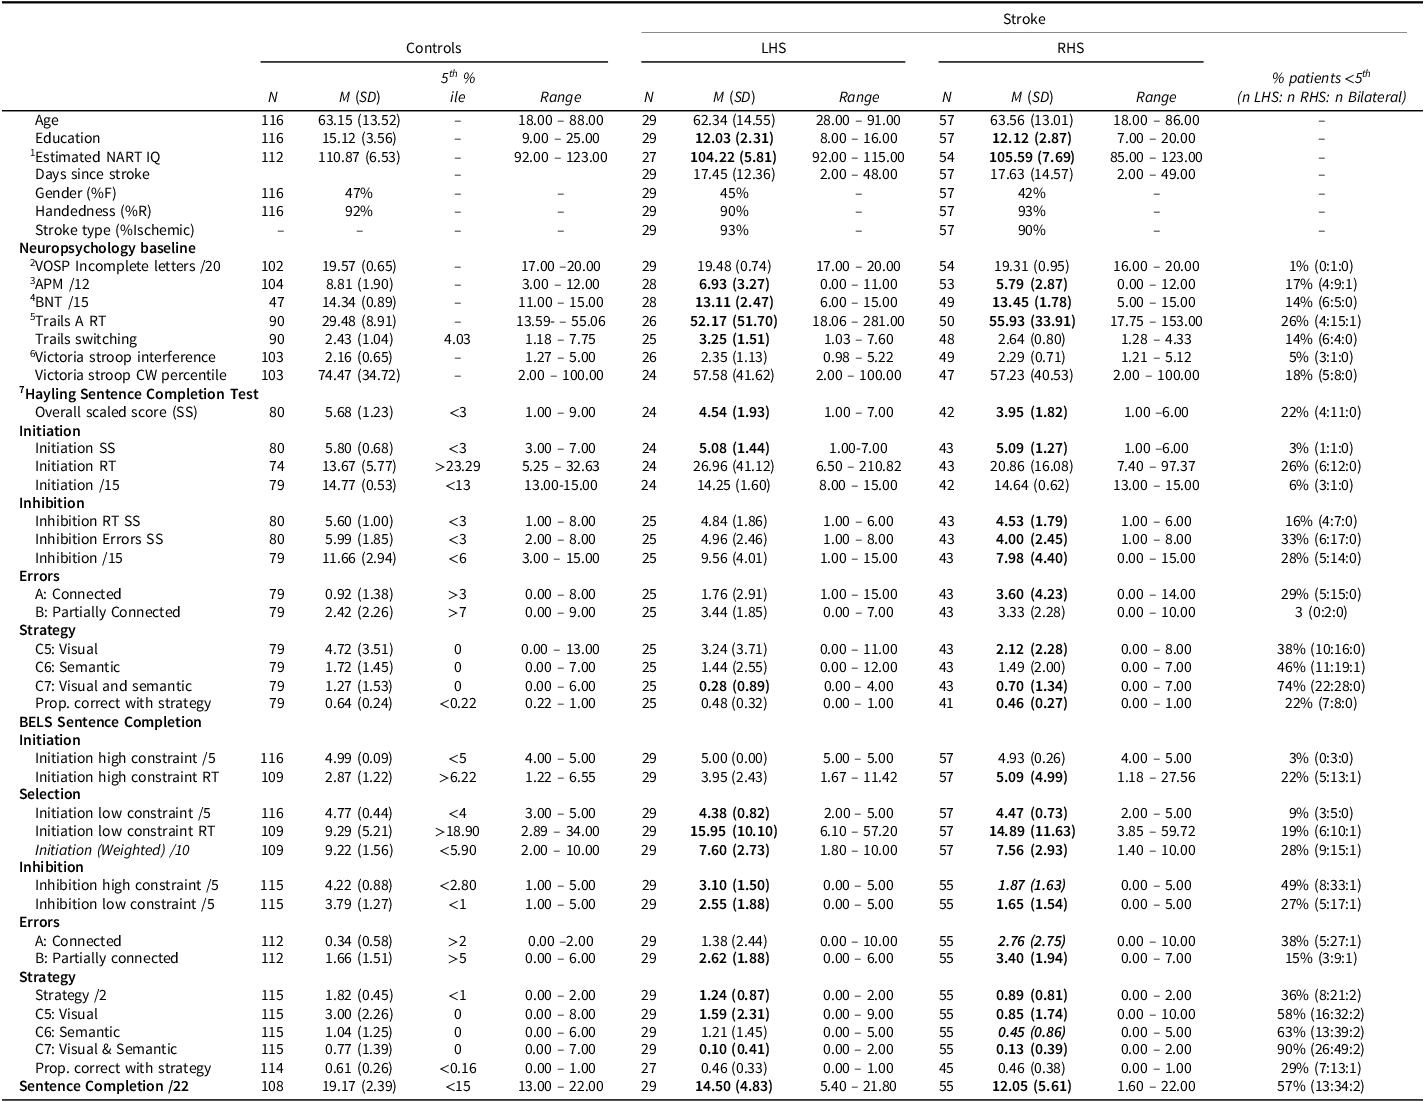
Note: RT = “reaction times” in seconds. HSCT and BELS “Proportion Correct with Strategy” has missing data due to some participants scoring 0 correct. Bolded M(SD) indicates significant difference from controls. Bolded and italicized M(SD) indicates significant difference between patient groups. 1National Adult Reading Test (NART-2nd Edition; Nelson & Willison, Reference Nelson and Willison1991); 2Visual Object Spatial Perception: Incomplete Letters (VOSP-IL; Warrington & James, Reference Warrington and James1991); 3Advanced Progressive Matrices (APM, Set 1; Raven, Reference Raven1965, 1994); 4Boston Naming Test (BNT-Short Form; Mack et al., Reference Mack, Freed, Williams and Henderson1992); 5Trails Making Test Part A (Strauss et al., Reference Strauss, Sherman and Spreen2006); 6Spreen & Strauss, Reference Spreen and Strauss1998; 7Burgess & Shallice, Reference Burgess and Shallice1996. 5th percentile cut-offs (z < −1.645) for impairment: VOSP-IL (Warrington & James, Reference Warrington and James1991); NART (Bright et al., 2018); APM (Murphy et al., 2023); BNT (younger – Abeare et al., 2022; older – Fastenbau et al., Reference Fastenau, Denburg and Mauer1998); TMT (Tombaugh et al., Reference Tombaugh, Rees, McIntyre, Spreen and Strauss1998); Stroop (Troyer et al., Reference Troyer, Leach and Strauss2006); HSCT scaled scores (Burgess & Shallice, Reference Burgess and Shallice1996); HSCT RT and global error score (Burgess & Shallice, Reference Burgess and Shallice1997); All other cut-offs based on current control sample. Stroop Interference = CW RT / Dot RT. Trails Switching = Trails A RT/ Trails B RT.
On the HSCT, control, LHS, and RHS groups did not differ significantly on Initiation, partially connected errors, or semantic strategies (see Supplementary Table 2 for HSCT whole stroke group comparison statistics). On all other HSCT variables, controls performed significantly better than RHS, and patient groups did not differ significantly. Controls only performed significantly better than LHS on C7 strategies (semantic and visual). For age and education comparisons, there were minor changes (for details, see Supplementary Table 3). For clinical scaled scores (SS), patients were mostly intact for Initiation reaction time (1 LHS and 1 RHS impaired, i.e., <5th percentile), compared to 33% of patients impaired on Inhibition errors (24% of LHS; 40% of RHS).
Fewer patients were impaired on Stroop Interference and Trails Switching than on the BELS-SC, with a greater proportion of LHS than RHS performing below the 5th percentile. The proportion of LHS and RHS impaired on HSCT Initiation and Inhibition reaction time scaled scores were similar; however, a greater proportion of RHS were impaired on Inhibition error scaled scores.
Construct validity
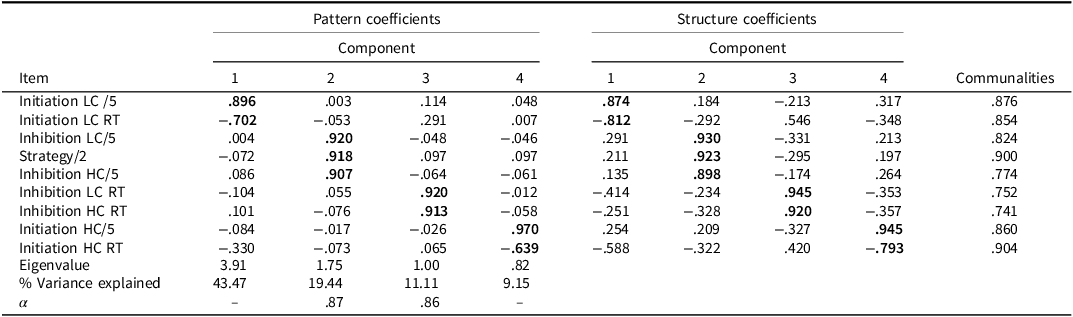
Three PCAs were conducted: 1) whole group, 2) patients only, and 3) controls only (see Tables 4, 5, and 6, respectively). The following variables were entered into the PCAs and considered appropriate: BELS-SC Initiation (HC and LC correct, HC and LC reaction times); Inhibition (HC and LC correct, HC and LC reaction times); and strategy scores. PCAs for the whole group and stroke group, revealed four components with eigenvalues > .70, accounting for 82.2% and 83.2% of the total variance, respectively, and the scree plot also suggested four components (Cattell, Reference Cattell1966; Joliffe, Reference Joliffe1972, Reference Joliffe1986). PCA with controls revealed five components, which accounted for 79.19% of the total variance. Tables 4, 5, and 6 show factor loadings after Oblimin rotation and internal consistencies for each factor.
Table 4. PCA pattern and structure matrix with oblimin rotation for four factor solution of BELS-SC (controls and stroke)
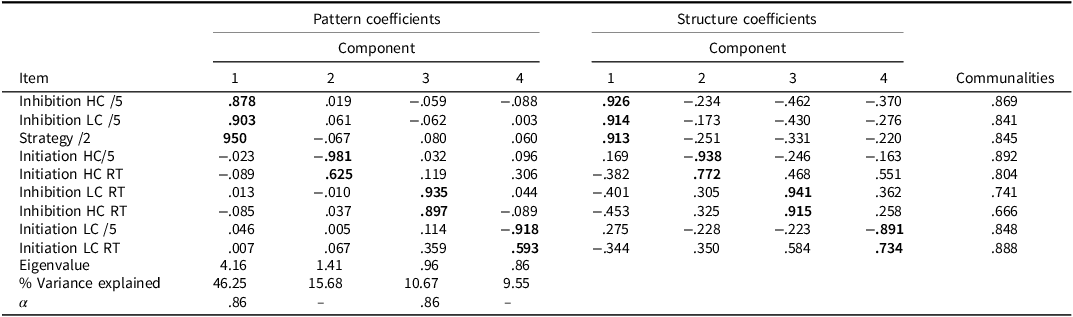
Note: Bolded coefficients indicate major loadings for each item. KMO = .804, Bartlett’s Test of Sphericity: Chi-square = 862.39(36), p < .001. Component 1: Inhibition; Component 2: Initiation; Component 3: Inhibition Response Time; Component 4: Selection. Internal consistencies for Initiation and Selection unable to be calculated due to negative average covariance between variables.
Table 5. PCA pattern and structure matrix with oblimin rotation for four factor solution of BELS-SC (stroke)
Note: Bolded coefficients indicate major loadings for each item. KMO = .758, Bartlett’s Test of Sphericity: Chi-square = 383.644(36), p < .001. Component 1: Selection; Component 2: Inhibition; Component 3: Inhibition Response Time; Component 4: Initiation. Internal consistencies for Initiation and Selection unable to be calculated due to negative average covariance between variables.
Table 6. PCA pattern and structure matrix with oblimin rotation for four factor solution of BELS-SC (controls)
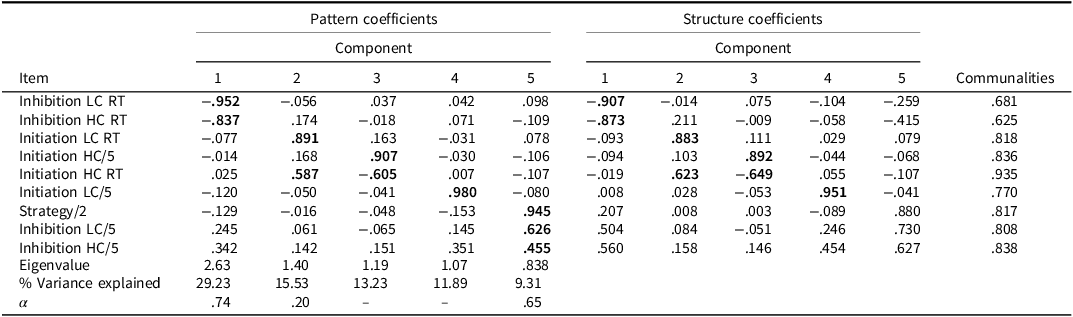
Note: Bolded coefficients indicate major loadings for each item. KMO = .653, Bartlett’s Test of Sphericity: Chi-square = 184.799(36), p < .001. Component 1: Inhibition Response Time; Component 2: Semantic Retrieval Response Time; Component 3: Initiation; Component 4: Selection; Component 5: Inhibition. Internal consistencies for Initiation unable to be calculated due to negative average covariance between variables.
For the whole group (PCA 1: Table 4) and stroke (PCA 2: Table 5) PCAs, the clusters of items that loaded on each component were the same (but were weighted differently). For PCA 1, Component 1 reflects Inhibition, Component 2 reflects Initiation, Component 3 reflects Inhibition Response Time, and Component 4 reflects Selection. Components 1-4 for the stroke only group (PCA 2) were Selection, Inhibition, Inhibition Response Time, and Initiation, respectively. For controls only (PCA 3: Table 6), the Inhibition, Initiation, and Inhibition Response Time components were the same; however, there were two key differences: 1) Initiation LC reaction time did not load on the Selection Component, and 2) there was an additional Semantic Retrieval Response Time Component (with Initiation LC and HC reaction times loading together).
The BELS-SC Inhibition component had high internal consistency across PCAs 1 and 2, but questionable internal consistency for PCA 3 with controls (Cronbach’s α = .86, .87, and .65, respectively). Internal Consistency for Inhibition Response Times was high across all three PCAs (Cronbach’s α = .86, .86, and .74, respectively). Initiation and Selection internal consistencies were unable to be calculated due to a negative average covariance between variables (i.e., reaction time and total correct measured on different scales). The Semantic Retrieval Response Time Component had low internal consistency (Cronbach’s α = .20).
Item analysis
We investigated the internal consistency of Initiation HC and LC reaction times (.63 and .39, respectively), Inhibition reaction times (.82), and Inhibition correct responses (.64). This was consistent with a split-half reliability analysis conducted with healthy controls on the HSCT (Initiation reaction time: .35; Inhibition reaction time: .83; Inhibition Error: .41; Burgess & Shallice, Reference Burgess and Shallice1996).
Convergent validity
Pearson’s correlations were performed to evaluate convergent validity of BELS-SC subtests against the HSCT (see Table 7). Patients and controls were grouped together for these analyses. Reaction times on BELS-SC Initiation and HSCT Initiation subtests were moderately, significantly correlated (N = 134, r = .46, p < .001), indicating convergent validity. This relationship was slightly stronger for high constraint sentences than for low constraint sentences. BELS-SC Initiation HC and LC reaction times and correct responses did not significantly correlate with HSCT Inhibition errors, which demonstrated divergent validity. However, correct responses on the BELS-SC Initiation subtests did not significantly correlate with HSCT Initiation reaction times, possibly suggesting errors and reaction times on sentence completion tasks may tap different aspects of initiation.
Table 7. Correlations between BELS-SC and HSCT variables
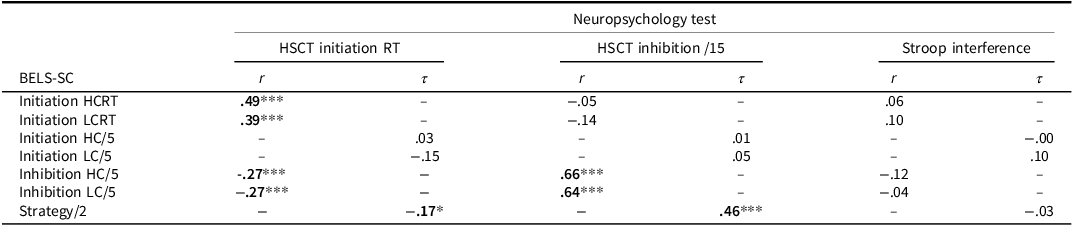
Note: *p < .05, **p < .01, ***p < .001. r = Pearson’s r coefficient. τ = Kendall’s Tau coefficient.
Correct responses on BELS-SC Inhibition and HSCT Inhibition subtests were strongly, significantly correlated (N = 148, r = .69, p < .001), indicating convergent validity. Unexpectedly, there was a weak, negative, significant relationship between BELS-SC Inhibition and HSCT Initiation reaction times, such that faster response times were associated with better inhibition. Of note, correct responses on BELS-SC Inhibition were not significantly related to Stroop Interference scores (Color Word reaction time / Dot reaction time; N = 138, r = −0.08, p = .356), which is consistent with Aron and colleagues (2004, 2014) and Cipolotti and colleagues (2016).
Sensitivity and specificity
A ROC curve analysis determined that a score of 18.4/22 on the BELS-SC had an Area Under the Curve (AUC) of .85 (p < .001), sensitivity of .84, and specificity of .66 when distinguishing controls and stroke patients. A series of ROC curve analyses were performed to determine the sensitivity and specificity of the BELS-SC when distinguishing participants who were impaired and intact on standard measures of executive functions (HSCT, Stroop, Trail Making Test, and Verbal Fluency “S”), determined by 5th percentile cut-offs (see Table 8). Participants impaired on one or more of these measures were classified as “impaired.” A score of 15.90 was highly sensitive (.83) and specific (.80), with a lower false positive rate than when distinguishing stroke patients and controls.
Table 8. SensitivIty and specificity of BELS-SC in distinguishing executive function “Impaired” and “Intact” participants
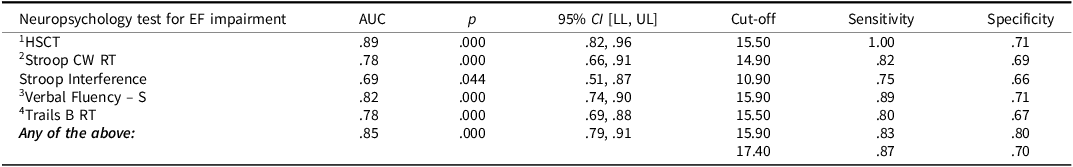
Note: RT = “reaction times” in seconds. 1Burgess & Shallice, Reference Burgess and Shallice1996; 2Spreen & Strauss, Reference Spreen and Strauss1998; 3Benton et al., Reference Benton, D. and Sivan1994; 4Trail Making Test Part A (Strauss et al., Reference Strauss, Sherman and Spreen2006); 5th percentile cut-offs (z < 1.645) for impairment: HSCT scaled scores (Burgess & Shallice, Reference Burgess and Shallice1996); Stroop (Troyer et al., Reference Troyer, Leach and Strauss2006); Verbal Fluency – S (Tombaugh et al., 1998); Trail Making Test (Tombaugh et al., 1998); Stroop Interference = CW RT / Dot RT.
Group differences on the BELS-SC
LHS and RHS groups were relatively equally impaired on BELS-SC Initiation items (HC and LC); however, there were a greater proportion of RHS patients impaired on Inhibition (particularly HC items), strategy, and total scores (see Figure 1 and Table 9). Controls scored significantly higher than both LHS and RHS; however, patient groups did not differ (see Table 10 for all BELS-SC group comparison statistics).
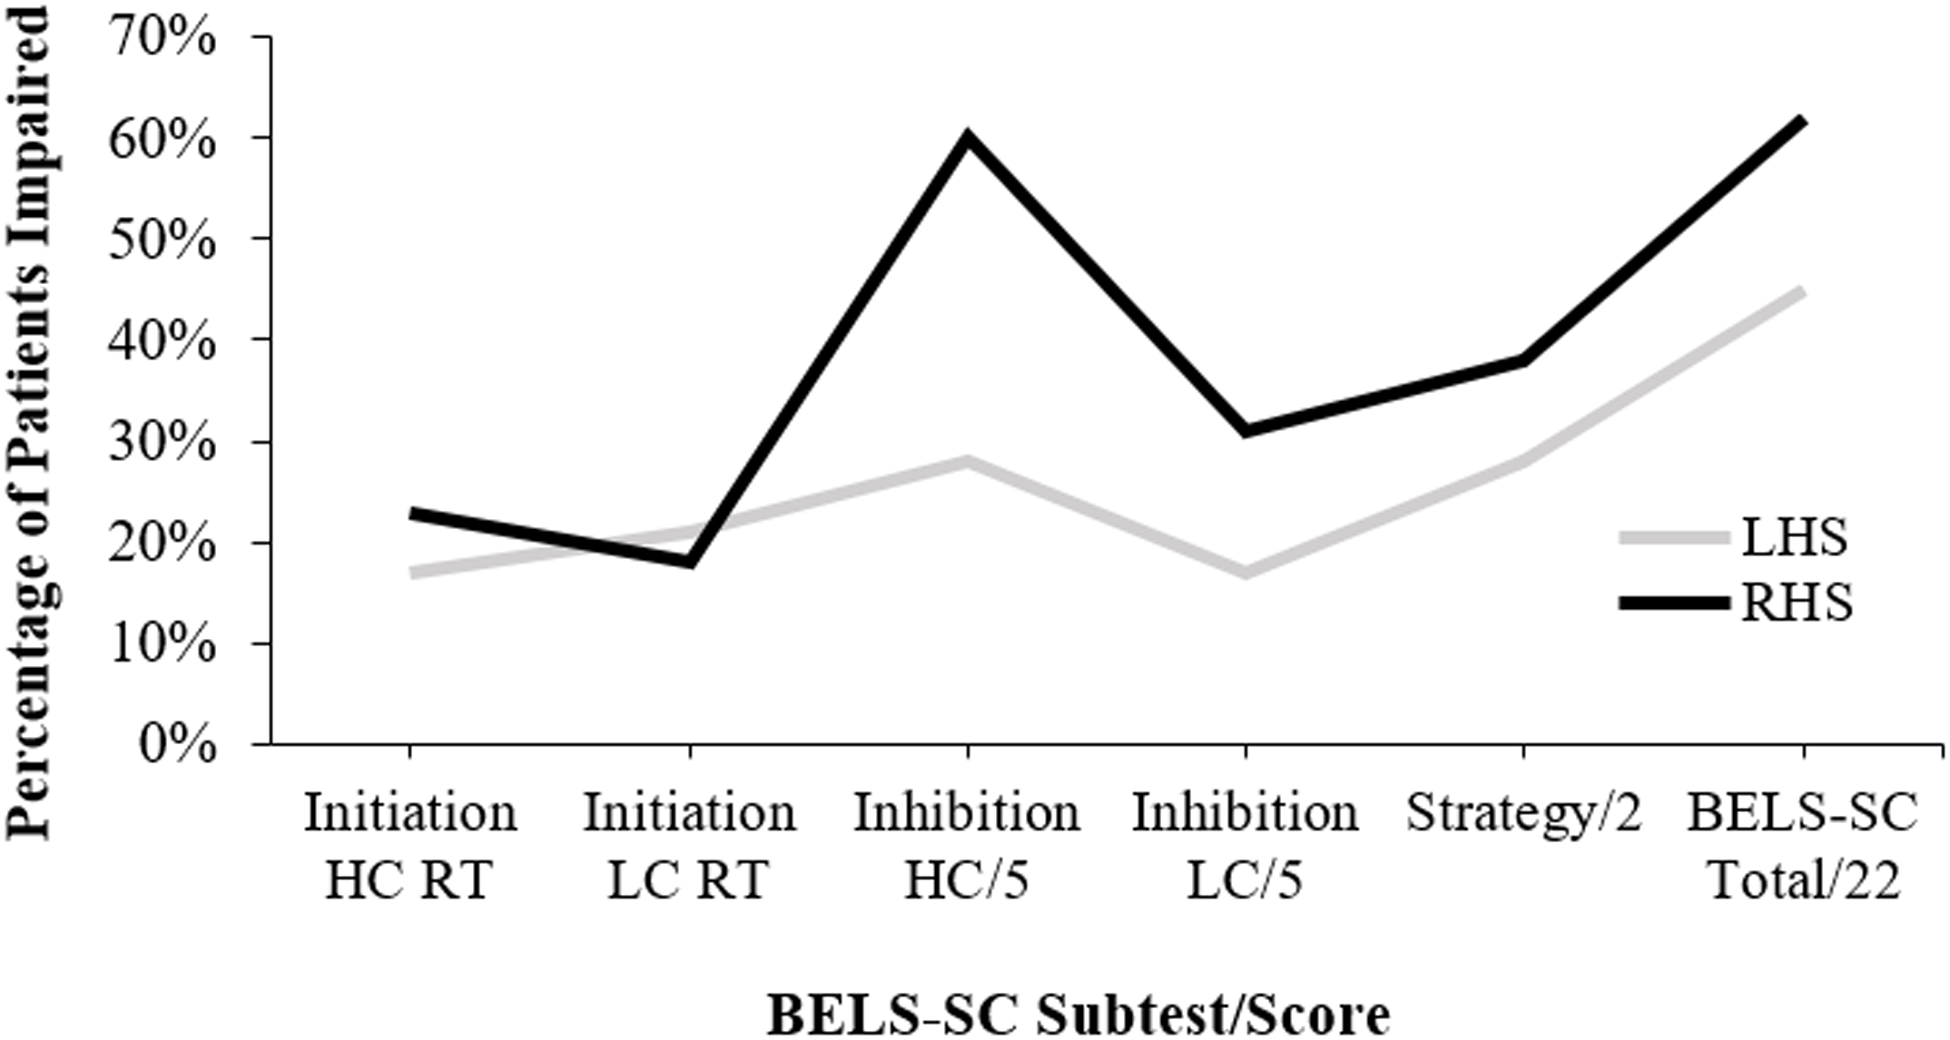
Figure 1. Proportion of LHS and RHS groups impaired (i.e., below 5th percentile) on BELS-SC subtests. LHS = left hemisphere stroke, RHS = right hemisphere stroke, This figure is a visual representation of the “% patients <5th (n LHS: n RHS: n bilateral)” column from Table 3.
Table 9. BELS-SC and standard executive function measures: percent of patients impaired
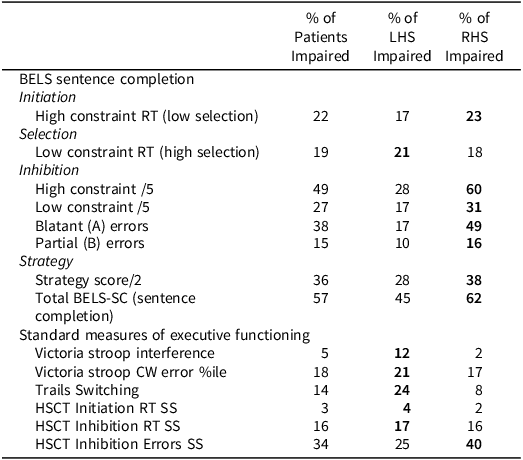
Note: “RT” = reaction time, Bolded percentages indicate group with highest proportion of impairment. Impairment on the above standard neuropsychology tests was classified as: Stroop Interference (Color-Word RT/Dot RT) z < −1.64 and error percentile (“%ile”) < 5th (as per Troyer et al., Reference Troyer, Leach and Strauss2006); Trails Switching (Trails B RT/Trails A RT) <5th percentile of the current healthy control sample; HSCT scaled scores <3 (as per Burgess & Shallice, Reference Burgess and Shallice1997).
Table 10. BELS-SC comparisons for controls, LHS, and RHS
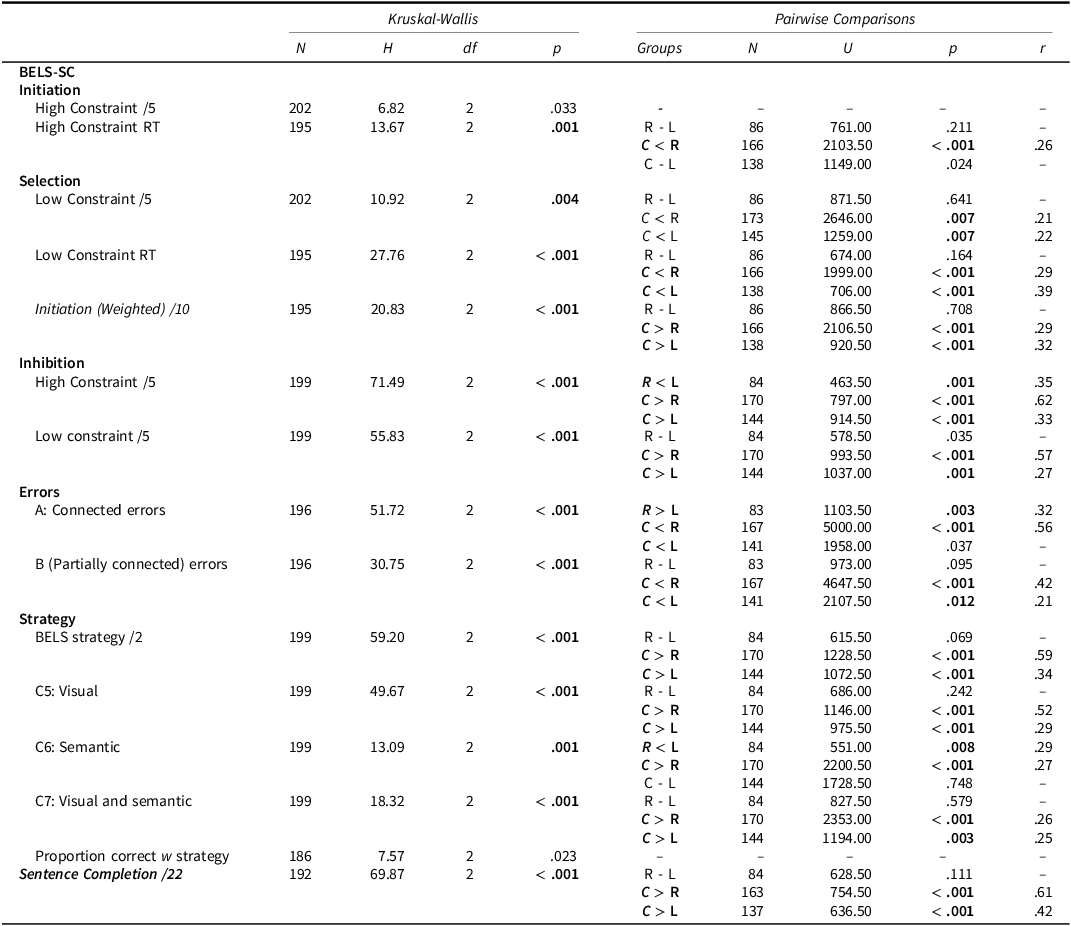
Note: Bonferroni correction applied to Kruskal–Wallis analyses (HSCT: α = .007, BELS-SC: α = .003) and follow-up pairwise comparisons (α = .017). C = Controls, R = RHS, L = LHS.
Initiation
RHS were significantly slower than controls to initiate a response on Initiation HC items (see Figure 2), and all groups performed at ceiling on raw scores, with only 3 RHS patients performing in the impaired range ( <5th percentile). For the age and education-matched comparison, RHS performed significantly worse than controls (accuracy and reaction time; see Supplementary Table 3). Selection. LC reaction times were slower for LHS than RHS; however, this difference was non-significant. Controls were significantly faster than patient groups. Both patient groups made significantly more errors on LC items, but did not significantly differ from one another. Inhibition. Controls performed significantly better than patient groups, and LHS performed significantly better than RHS on HC but not LC items (see Figure 3). Error Types. RHS made significantly more blatant errors than LHS, but patient groups did not differ for partially connected errors (see Figure 4). Controls made significantly fewer blatant errors than RHS but not LHS, and fewer partially connected errors than both patient groups. For the age- and education-matched comparison, only RHS made more partially connected errors than controls (see Supplementary Table 3). Strategy. There was a non-significant trend for LHS to show more instances of strategy use than RHS (p = .074). Controls used significantly more strategies than patient groups; however, groups did not differ for proportion of correct responses that employed a strategy. LHS implemented significantly more semantic strategies (e.g., responding with colors, animals, and foods) than RHS; however, patient groups were equivalent in use of visual strategies (e.g., naming things around the room). Controls used significantly more visual strategies than both patient groups, and more semantic strategies than RHS; however, controls and LHS did not differ in implementation of semantic strategies (see Figure 5). Finally, controls employed significantly more responses that were both visually and semantically related than patient groups, who were comparable.
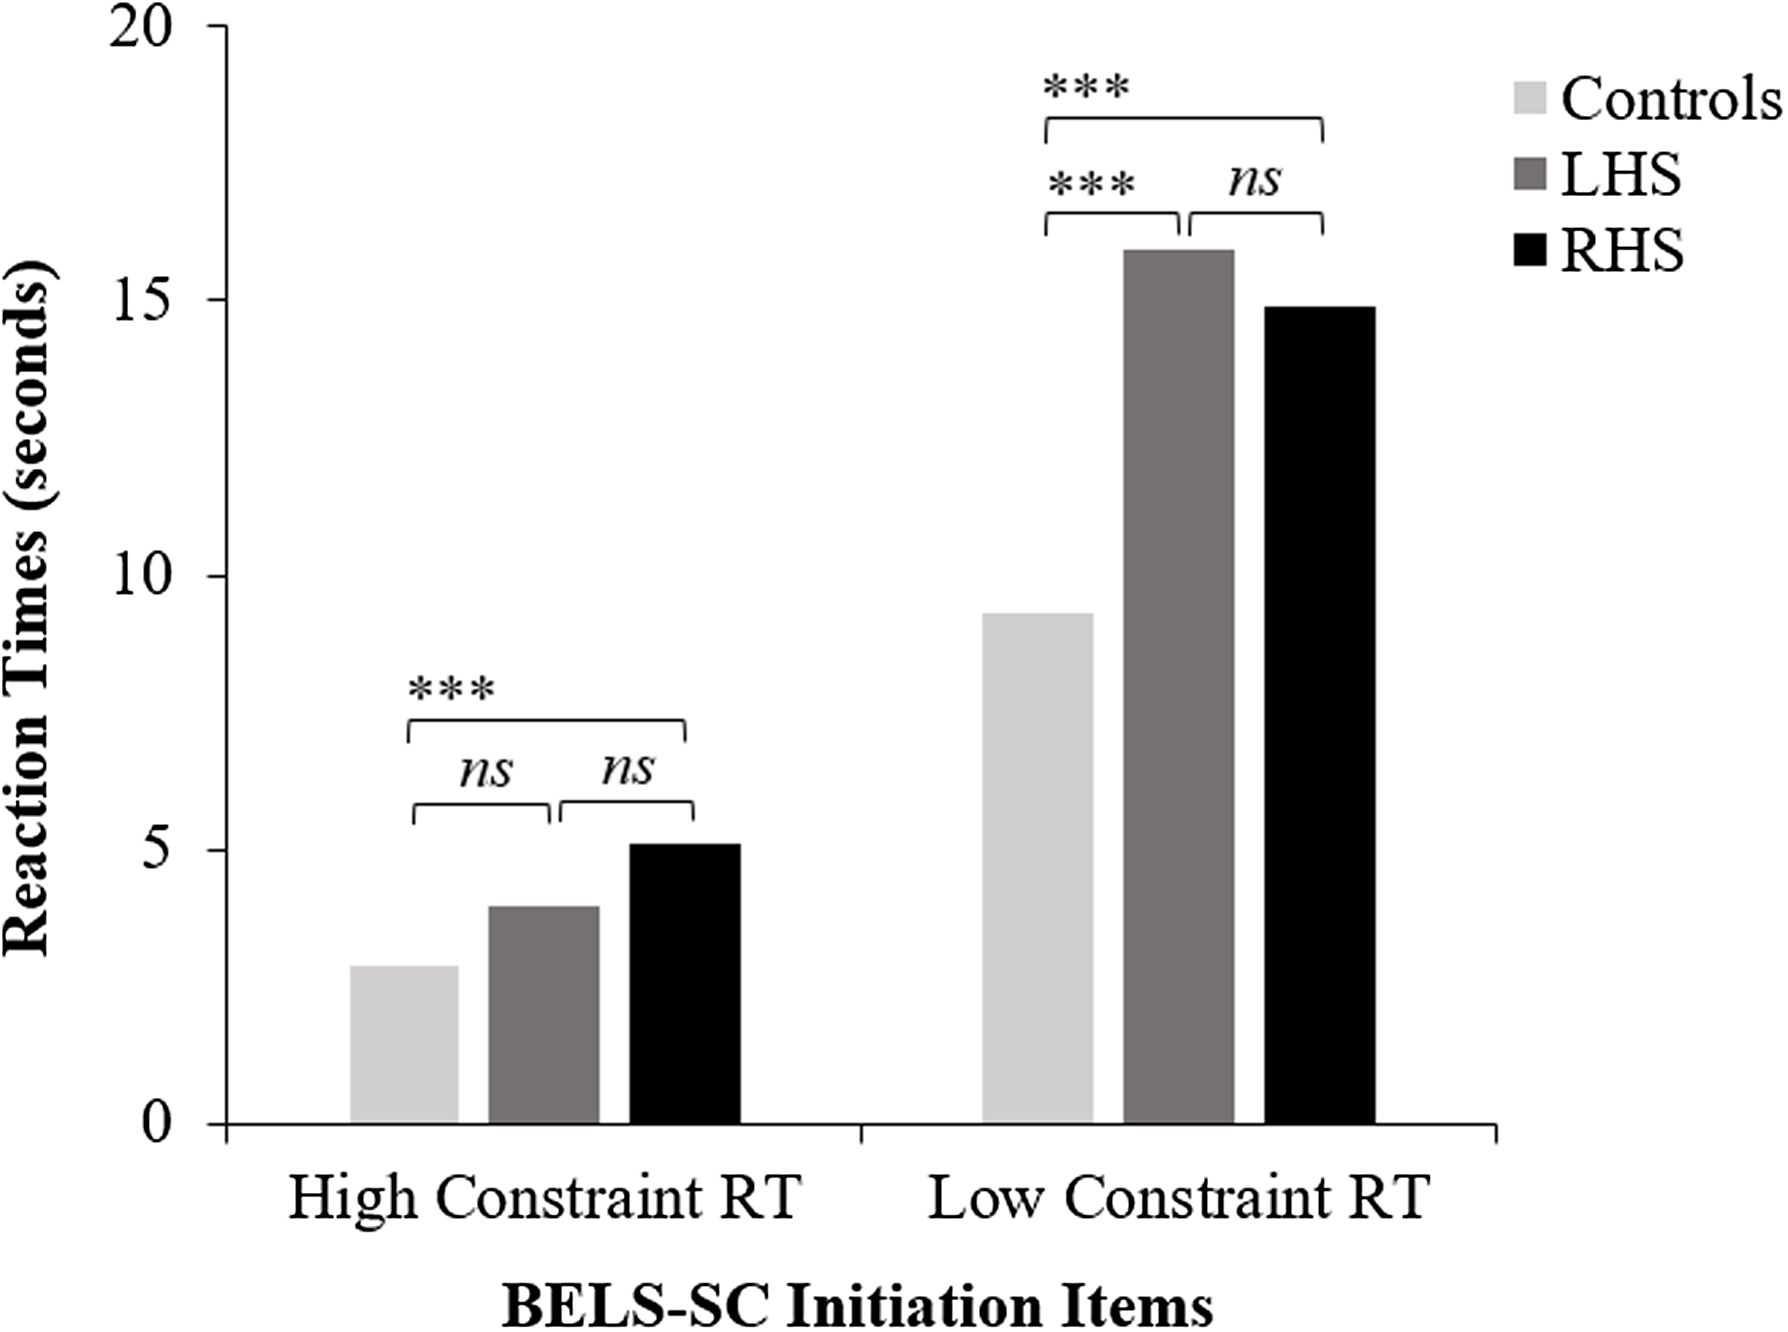
Figure 2. BELS-SC initiation reaction times for controls, LHS, and RHS. LHS = left hemisphere stroke, RHS = right hemisphere stroke, ***p < .001. “ns” = non-significant p value. This figure plots group means for BELS-SC initiation HC and LC reaction times and displays results from Kruskal–Wallis and follow-up pairwise Mann–Whitney U tests.
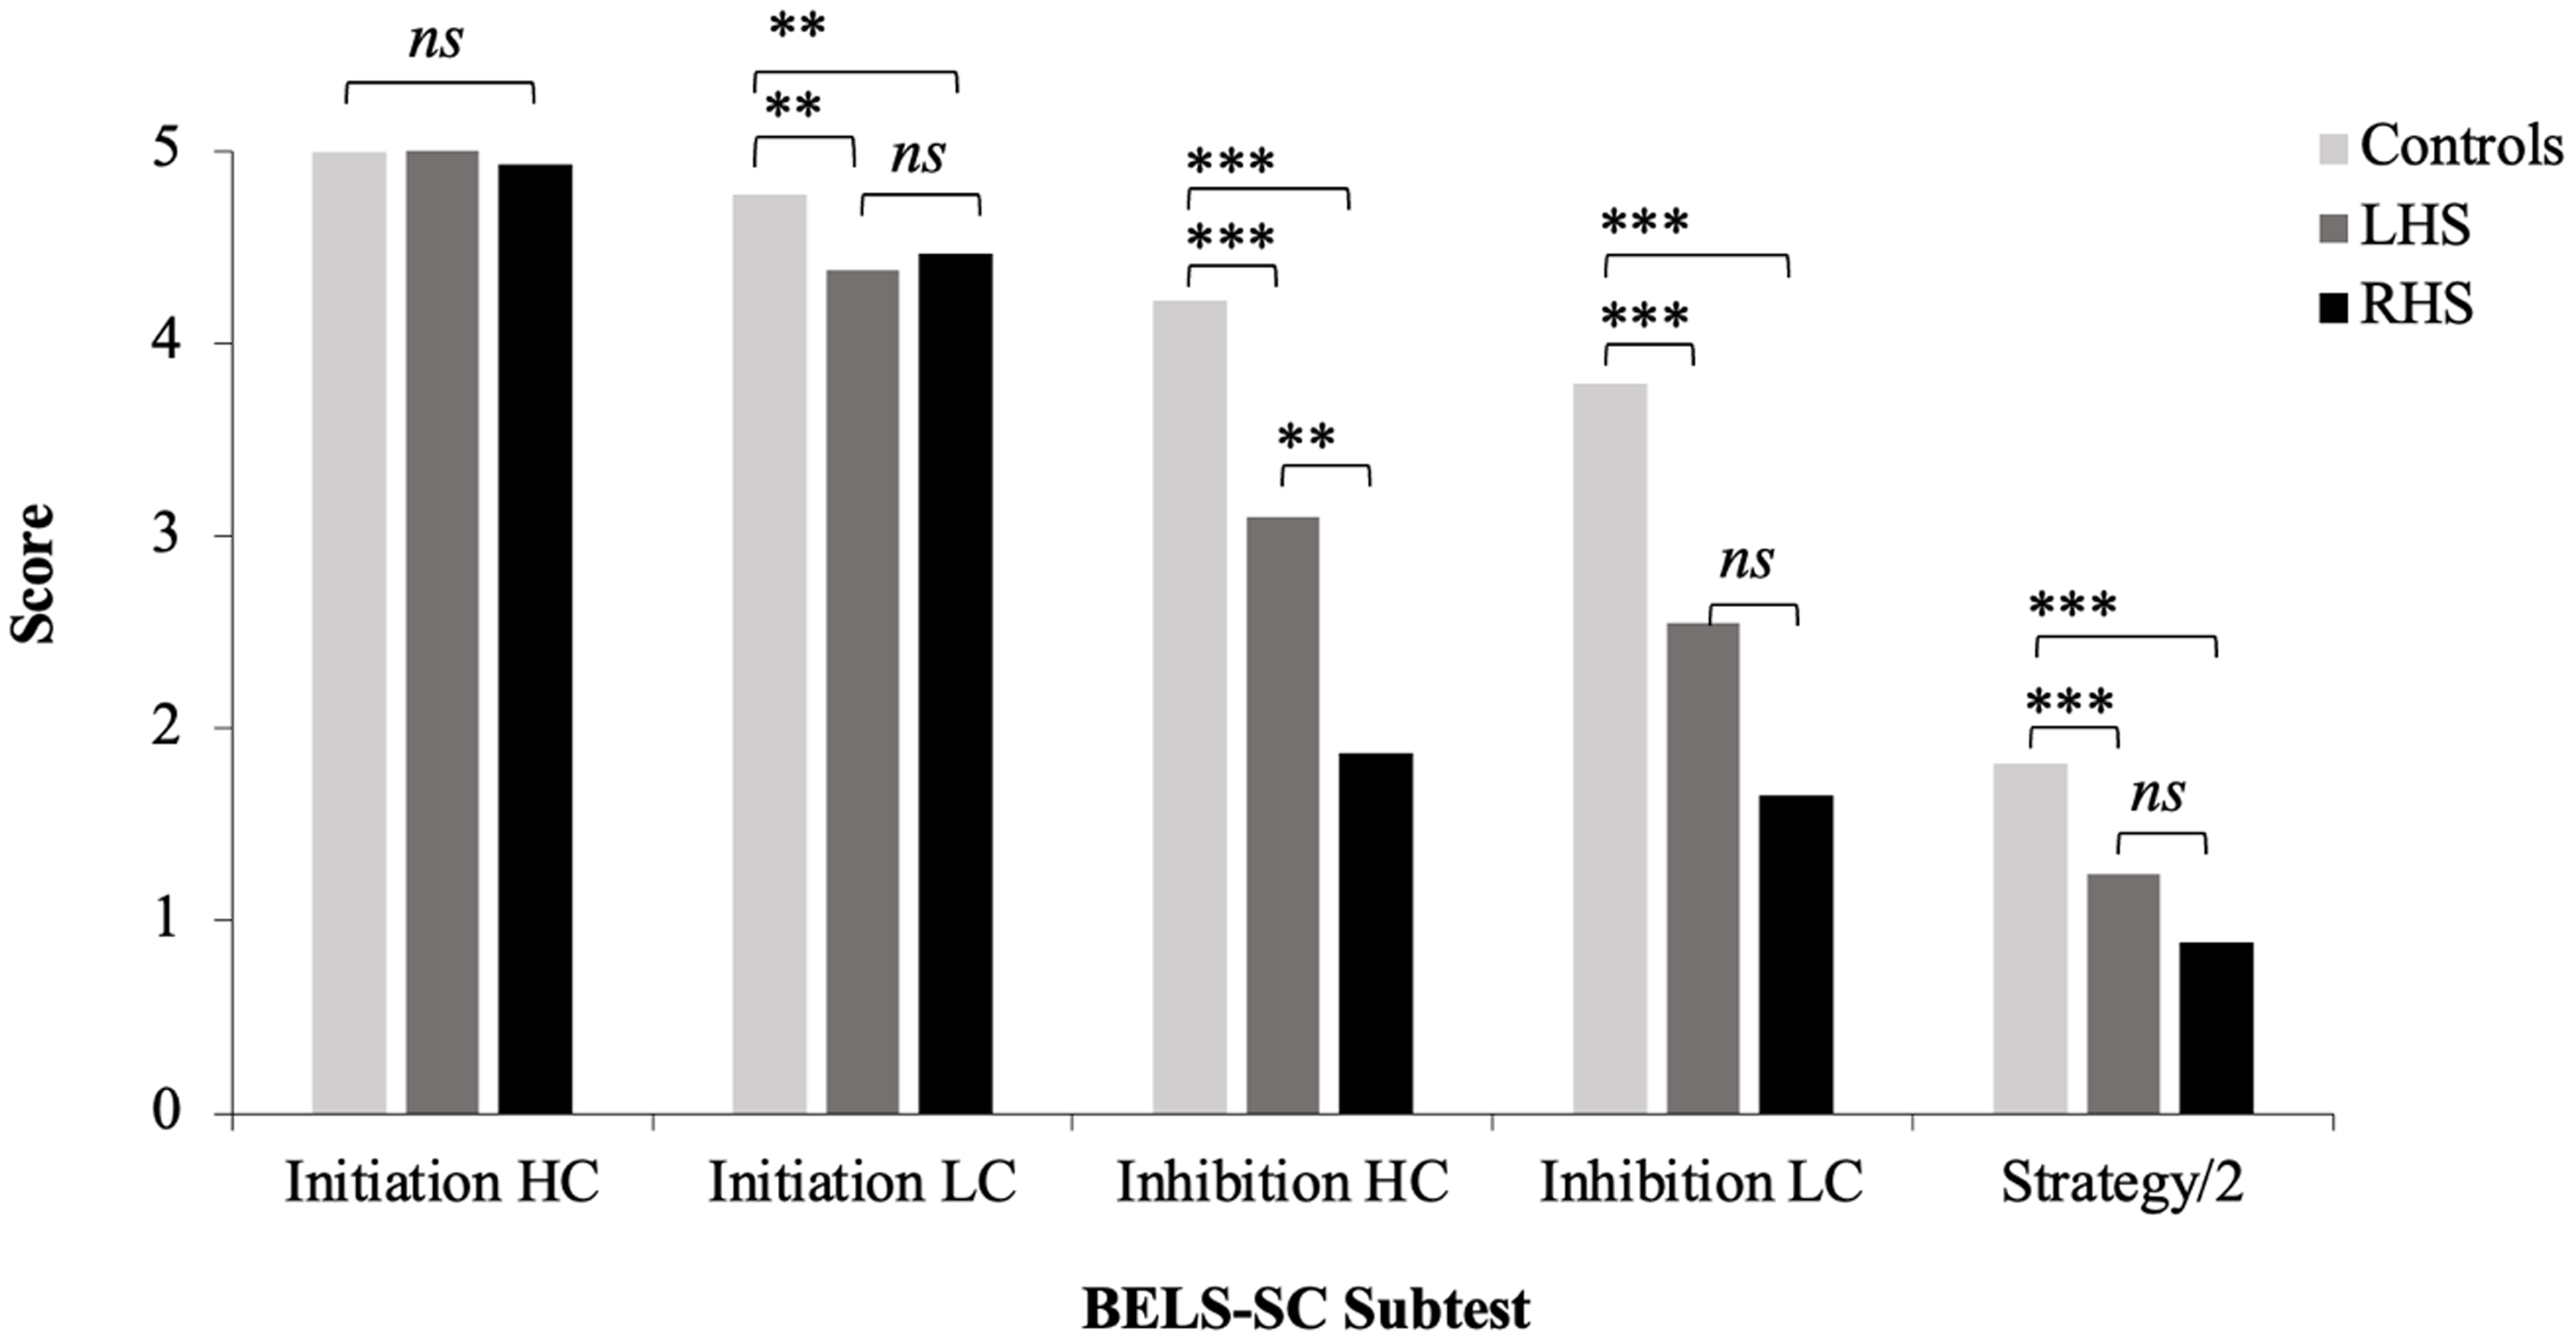
Figure 3. BELS-SC subtest scores for controls, LHS, and RHS. LHS = left hemisphere stroke, RHS = right hemisphere stroke, **p < .01, ***p < .001. “ns” = non-significant p value. This figure plots group means for BELS-SC initiation and inhibition raw scores and displays results from Kruskal–Wallis and follow-up pairwise Mann–Whitney U tests.

Figure 4. BELS-SC error type for controls, LHS, and RHS. LHS = left hemisphere stroke. RHS = right hemisphere stroke. *p < .05, **p < .01, ***p < .001. “ns” = non-significant p value. This figure plots group means for BELS-SC inhibition error types and displays results from Kruskal–Wallis and follow-up pairwise Mann–Whitney U tests.
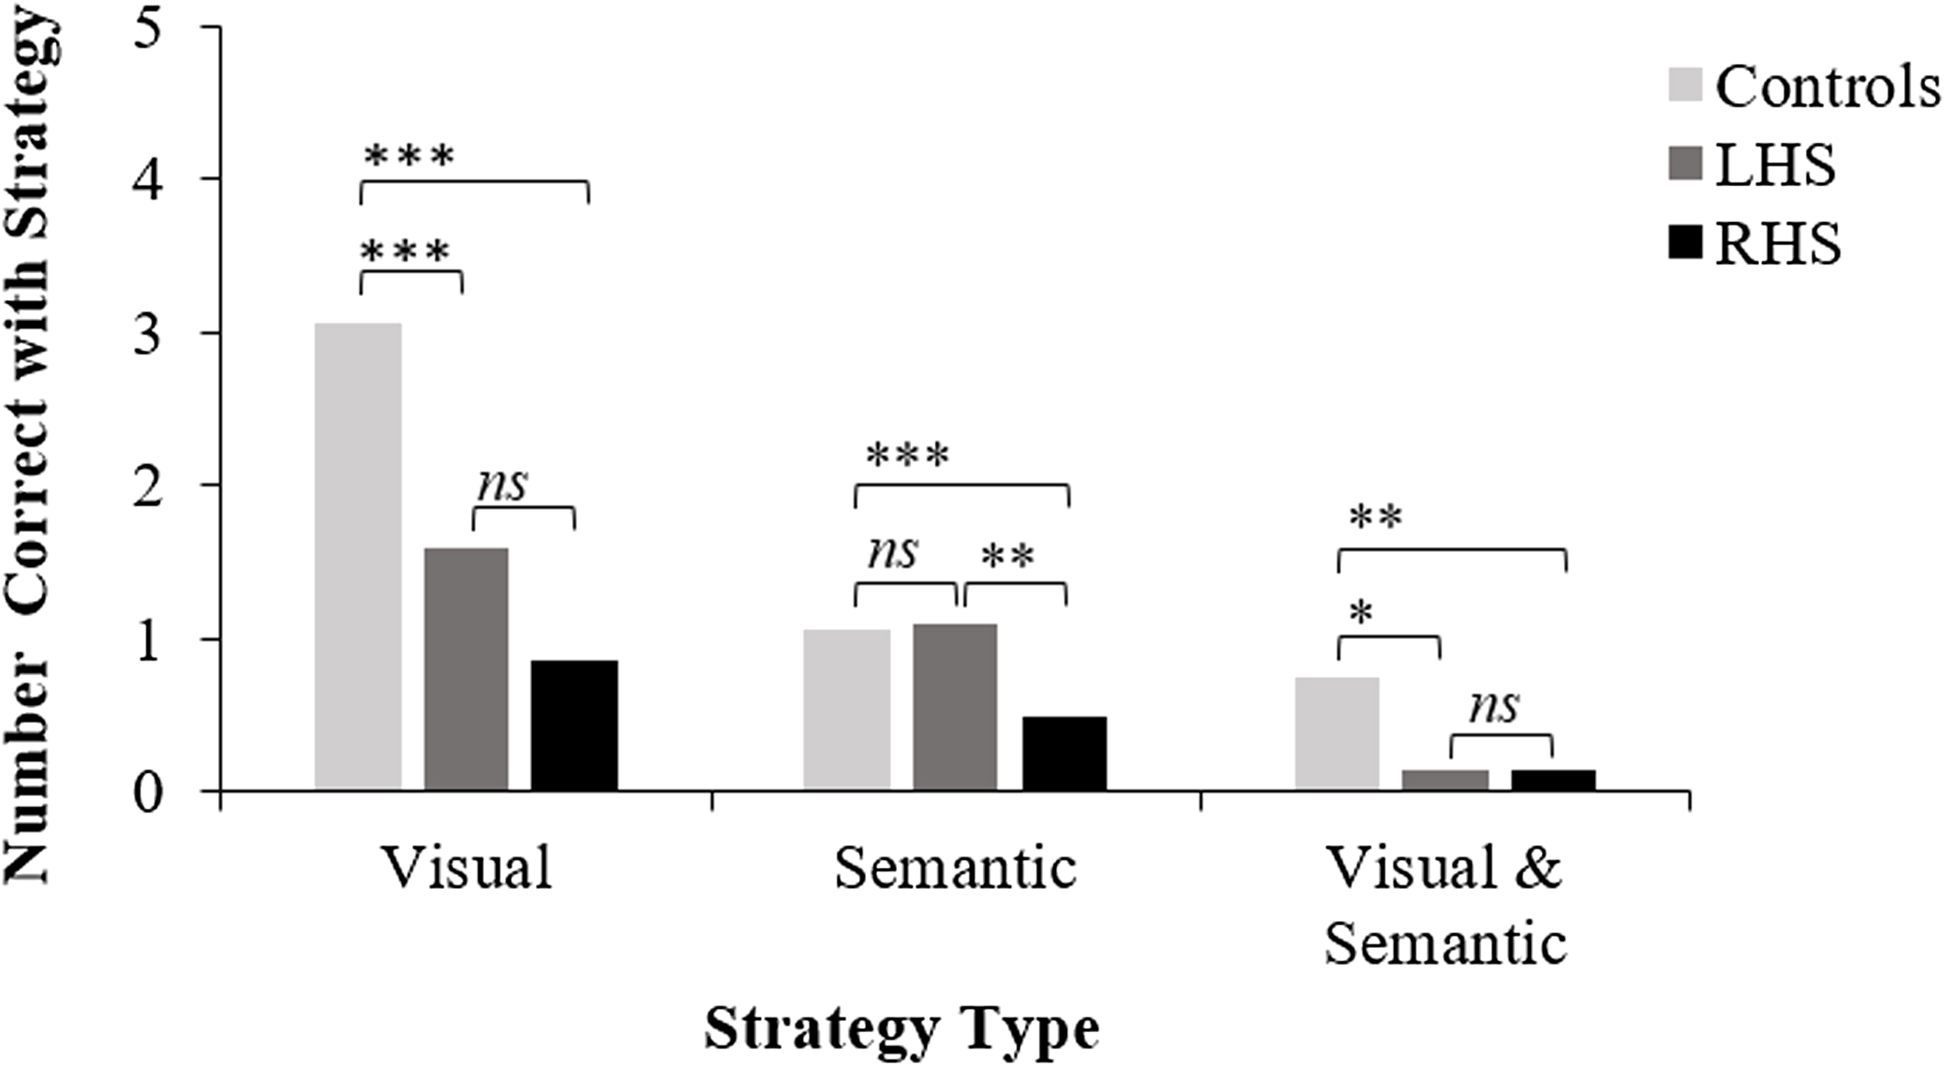
Figure 5. BELS-SC strategy use for controls, LHS, and RHS. *p < .05, **p < .01, ***p < .001. “ns” = non-significant p value. This figure plots group means for BELS-SC inhibition strategy types and displays results from Kruskal–Wallis and follow-up pairwise Mann–Whitney U tests.
Discussion
Executive dysfunction is common after stroke and can predict long-term outcomes (Lesniak et al., Reference Lesniak, Bak, Czepiel, Seniow and Czlonkowska2008; Nys et al., Reference Nys, van Zandvoort, de Kort, van der Worp, Jansen, Algra, de Haan and Kappelle2005, Reference Nys, van Zandvoort, de Kort, Jansen, De Haan and Kappelle2007; Pohjasvaara et al., Reference Pohjasvaara, Leskelä, Vataja, Kalska, Ylikoski, Hietanen, Leppävuori, Kaste and Erkinjuntti2002; Veldsman et al., Reference Veldsman, Werden, Egorova, Khlif and Brodtmann2020; Wolf, Reference Wolf2011). Therefore, early assessment of executive functions is crucial for rehabilitation, yet this must be brief due to fatigue and time constraints on an acute stroke ward. The current study introduced the BELS-SC; a standalone, brief ( <5 minute) executive screen from the BELS (Robinson et al., Reference Robinson, Shi, Nott and Ceslis2021; Phillips et al., Reference Phillips, Byrne, Gibson, Gilbert, Ford, Marsh and Robinson2024). The BELS-SC is based on the HSCT (Burgess & Shallice, Reference Burgess and Shallice1996), but it is different in three key ways: 1) high and low constraint sentence items are included to increase selection demands, 2) Initiation items are repeated to increase Inhibition demands, and 3) a strategy score is incorporated for Inhibition. This study aimed to 1) determine construct validity of the BELS-SC, 2) determine sensitivity and specificity of the BELS-SC, 3) determine convergent and divergent validity of the BELS-SC, and 4) examine the performance of left and right hemisphere stroke on both the BELS-SC and other current standard executive function tests.
Construct, convergent, and divergent validity
Analysis of the BELS-SC among the whole group and stroke group, demonstrated four components: Inhibition (Inhibition HC and LC, Strategy score), Initiation (Initiation HC and Initiation HC reaction time), Inhibition Response Time (Inhibition HC reaction time and Inhibition LC reaction time) and Selection (Initiation LC and Initiation LC reaction time). This was further supported by good internal consistency of Inhibition HC and LC items (for both errors and reaction times), and poor consistency between Initiation HC and LC items (i.e., HC and LC reflect different constructs). Individual BELS-SC Initiation and Inhibition items showed similar internal consistency to that of the HSCT (Burgess & Shallice, Reference Burgess and Shallice1996).
Although it was expected that strategy would be a standalone component on the BELS-SC, it is unsurprising that strategy loaded on inhibition. This is because strategy is a process used to assist with suppression of prepotent responses. Maintaining the inclusion of a strategy score as part of the BELS-SC has important implications for understanding a patient’s ability to generate and implement a strategy, which is very relevant for problem-solving and achieving rehabilitation goals. Unexpectedly, Inhibition reaction times and errors did not load on the same factor. Beyond suppression of the prepotent response (Inhibition component), the Inhibition Response Time component may reflect additional processes related to Inhibition (e.g., time to think of a work, task switching, monitoring, adjusting, generating a strategy: Aron et al., Reference Aron, Robbins and Poldrack2014; Chatham et al., Reference Chatham, Claus, Kim, Curran, Banich, Munakata and Gilbert2012).
When only controls were included in the PCA, the BELS-SC demonstrated five components: Inhibition Response Time (Inhibition HC reaction time and Inhibition LC reaction time), Semantic Retrieval Response Time (Initiation HC reaction time and Initiation LC reaction time), Initiation (Initiation HC total correct and reaction time), Selection (Initiation LC total correct), and Inhibition (Inhibition HC and LC total correct, and Strategy score). The two key differences from the PCA with the whole sample and stroke only group were 1) an additional component reflecting the time taken to retrieve and initiate the appropriate semantic word, of both high and low constraint conditions, and 2) Initiation LC reaction time did not load with Initiation LC correct on the Selection component. It is possible that Initiation HC and LC reaction times loaded together for controls due to less disparity between time taken to retrieve a word in high and low constraint conditions, than there is for stroke. It is likely that stroke patients are slower to select from multiple competing responses and still may not be able to produce a one-word answer that meaningfully completes the sentence within the 20 s time limit.
In relation to convergent validity, the BELS-SC Initiation and Inhibition subtests demonstrated good convergence with HSCT Initiation and Inhibition, respectively. We note that the BELS-SC HC Initiation items were more strongly correlated with the HSCT than LC items, which was likely due to the increased selection demands and slower response times on LC items. Divergent validity was also established, with no significant relationship between BELS-SC Initiation variables and HSCT Inhibition. Unexpectedly, there was a weak but significant relationship between BELS-SC Inhibition and HSCT Initiation reaction time, suggesting participants who were faster to initiate a semantically connected response were better at suppressing prepotent responses on the BELS-SC Inhibition subtest.
Sensitivity and specificity
As predicted, the BELS-SC demonstrated good sensitivity but poorer specificity when distinguishing stroke patients from healthy controls. It is likely that poorer specificity is due to the older age of the control group because age-related declines in executive functioning has been well documented (e.g., Gibson et al., Reference Gibson, Barker, Martin and Robinson2018; Madden et al., Reference Madden, Sale and Robinson2019; Martin et al., Reference Martin, Barker, Gibson and Robinson2021). However, in the current context of acute/early stroke, it is more important for a screen to be sensitive (i.e., detect impairment) rather than specific (i.e., low false positive rate), as this enables potential rehabilitation targets to be identified in a timely manner. Due to the BELS-SC not being a tool to diagnose stroke, sensitivity and specificity were also investigated to determine if the BELS-SC could differentiate between participants who were intact versus impaired on standard, widely used executive function measures. A score of 15.9/22 on the BELS-SC showed similar good sensitivity, and better specificity than when distinguishing controls and stroke patients. The latter is unsurprising given the likely age-related decline in executive functioning for some healthy participants. In addition to use in a stroke population, the BELS-SC may be a valuable early-detection measure for executive impairment in healthy aging.
Left and right hemisphere stroke and the BELS-SC
As expected, LHS and RHS showed different patterns of impairment across the BELS-SC components. However, unexpectedly, on the BELS-SC Initiation items the RHS group were significantly slower than controls to initiate a response regardless of level of constraint, whereas LHS were significantly slower than controls only on low constraint (high selection demand) items. Further, compared to the age and education-matched control group, RHS made significantly more errors on high constraint (low selection demand) items. Slowed energization has been linked to right medial frontal regions, which may partially explain the RHS group showing slower response latencies than controls across both high and low selection items (Stuss & Alexander, Reference Stuss and Alexander2007). While there was a similar proportion of LHS and RHS impaired on BELS-SC Initiation HC reaction times, LHS and controls did not significantly differ at the group level. It is possible more profound selection deficits in LHS were not observed due to the wide range of lesions within the left hemisphere, rather than being localized to the LIFG, which is an areas linked to selection (Barker et al., Reference Barker, Nelson and Robinson2020; Benedek et al., Reference Benedek, Jauk, Fink, Koschutnig, Reishofer, Ebner and Neubauer2014; Fink et al., Reference Fink, Grabner, Benedek, Reishofer, Hauswirth, Fally, Neuper, Ebner and Neubauer2009; Madden et al., Reference Madden, Sale and Robinson2019; Moss et al., Reference Moss, Abdallah, Fletcher, Bright, Pilgrim, Acres and Tyler2005; Robinson et al., Reference Robinson, Blair and Cipolotti1998, Reference Robinson, Shallice and Cipolotti2005, Reference Robinson, Shallice, Bozzali and Cipolotti2010; Thompson-Schill et al., Reference Thompson-Schill, D’Esposito, Aguirre and Farah1997; Zhang et al., Reference Zhang, Feng, Fox, Gao and Tan2004).
For the BELS-SC Inhibition items, patients were most impaired for HC items, with half of all patients (49%) performing below the 5th percentile. Of note, on LC items, the percentage of impaired patients dropped to 27%, highlighting a greater level of difficulty for the HC items. The latter likely reflects the fact that HC items elicit one dominant word to override and suppress. Although both patient groups were impaired on inhibition, the RHS group was disproportionately affected, particularly on HC items (60% of RHS; 28% of LHS) and were significantly poorer than LHS on these items. RHS patients also made more blatant inhibition errors than both controls and LHS, whereas both RHS and LHS made significantly more partially connected inhibition errors than controls (NB: only RHS made more partially connected errors in age and education-matched comparisons). This aligns with prior studies linking inhibition processes to right frontal regions (Aron et al., Reference Aron, Robbins and Poldrack2004, Reference Aron, Robbins and Poldrack2014; Cipolotti et al, Reference Cipolotti, Healy, Spanò, Lecce, Biondo, Robinson, Chan, Duncan, Shallice and Bozzali2016a, Reference Cipolotti, Spanò, Healy, Tudor-Sfetea, Chan, White, Biondo, Duncan, Shallice and Bozzali2016b; Kawashima et al., Reference Kawashima, Satoh, Itoh, Ono, Furumoto, Gotoh, Koyama, Yoshioka, Takahashi, Takahashi, Yanagisawa and Fukuda1996; Konishi et al., Reference Konishi, Nakajima, Uchida, Sekihara and Miyashita1998; Robinson et al., Reference Robinson, Cipolotti, Walker, Biggs, Bozzali and Shallice2015b; Volle et al., Reference Volle, de Lacy Costello, Coates, McGuire, Towgood, Gilbert, Kinkingnehun, McNeil, Greenwood, Papps, van den Broeck and Burgess2012; Wilson et al., Reference Wilson, Evans, Emslie, Alderman and Burgess1998). However, the level of impairment in the LHS group was not negligible, which suggests some bilateral involvement in inhibition.
Patient groups employed significantly fewer strategies than controls, particularly visual (C5) and both visual and semantic strategies (C7). Notably, semantic strategy use (C6) did not differ between controls and LHS; however, RHS used significantly fewer semantic strategies than both groups. This may be due to semantic strategies being slightly more difficult to generate than a visual strategy. Further investigations into strategy use in stroke may help inform cognitive rehabilitation practices (e.g., implementing visual strategies rather than semantic strategies to overcome inhibition impairments). Additionally, strategy generation and implementation have been shown to be distinct processes, with brain tumor patients showing differential capacity to generate and implement a strategy (Robinson et al., Reference Robinson, Spooner and Harrison2015a, Reference Robinson, Walker, Biggs and Shallice2016). This is a potentially beneficial avenue to further explore in stroke rehabilitation. Interestingly, the proportion of correct responses that employed a strategy did not differ between controls and patients, which suggests correct responses were facilitated by strategies, rather than by responding with random words without an obvious strategy.
Executive function tests and the BELS-SC
Despite some similarities between the BELS-SC and HSCT, as anticipated there were differences in how patients performed on these measures. Although the number of patients impaired on BELS-SC and HSCT (raw scores) were comparable, more patients were impaired on the BELS-SC composite score (57%) compared to HSCT overall scaled score (21%). This is likely due to the three key differences in that the BELS-SC comprises i) high and low constraint sentences, ii) repetition of initiation items for inhibition, and iii) the inclusion of a strategy score. A primary strength of the BELS-SC is the novel inclusion of high and low constraint Initiation sentences, which are repeated for Inhibition. While the number of patients impaired on LC Inhibition items (27%) are comparable to those impaired on HSCT Inhibition (28%), 49% of patients were impaired on BELS-SC HC items. This suggests the BELS-SC can detect more inhibition impairments than the HSCT due to increased demands placed on inhibitory processes. This would align with the notion true inhibition requires an automatic, dominant response to be produced, before it can then be suppressed (Aron et al., Reference Aron, Robbins and Poldrack2014; Friedman & Miyake, Reference Friedman and Miyake2004; Li et al., Reference Li, Chen, Zhang, Li and Li2021; Miyake et al., Reference Miyake, Friedman, Emerson, Witzki, Howerter and Wager2000).
It was found that LHS were disproportionately impaired on standard executive function measures such as Stroop Interference and Trails Switching, whereas RHS were disproportionately impaired on the BELS-SC (particularly inhibition). In line with previous research, the Stroop test (commonly viewed as a test of inhibition) was not related to BELS-SC Inhibition. Further, patients did not differ from controls on Stroop interference scores or Color Word percentiles; however, they differed significantly on HSCT Inhibition (raw and scaled scores) and BELS-SC Inhibition. These results add to growing literature suggesting that the Stroop and sentence completion tests tap dissociable functions (Aron et al., Reference Aron, Robbins and Poldrack2014; Cipolotti et al., Reference Cipolotti, Spanò, Healy, Tudor-Sfetea, Chan, White, Biondo, Duncan, Shallice and Bozzali2016b; Moore et al., Reference Moore, Byrne, Gibson, Ford and Robinson2024). As previously noted, a limitation of the Stroop test is that it may not tap true inhibition (Aron et al., Reference Aron, Robbins and Poldrack2004, Reference Aron, Robbins and Poldrack2014; Stuss & Alexander, Reference Stuss and Alexander2007). This is evident behaviorally when comparing performance on the Stroop to the HSCT and BELS-SC, but also anatomically in lesion symptom and advanced network-level lesion mapping studies (Cipolotti et al., Reference Cipolotti, Spanò, Healy, Tudor-Sfetea, Chan, White, Biondo, Duncan, Shallice and Bozzali2016b; Moore et al., Reference Moore, Byrne, Gibson, Ford and Robinson2024). It is also important to note that use of a visual strategy on the Stroop or using a visual or semantic strategy on the HSCT may mean true inhibition is not required (e.g., focusing on the last letter of the word to be inhibited for Stroop, or ignoring the sentence while implementing a semantic strategy on the HSCT). Although this might also apply to the BELS-SC, the repetition of Initiation items for Inhibition means the sentence has already been processed meaningfully and each individual has already produced a prepotent response for each item, which increases the likelihood that it must then be suppressed.
Implications
A major implication is related to the notion that executive functions are comprised of a collection of abilities rather than one common function (Martin et al., Reference Martin, Barker, Gibson and Robinson2021; Miyake et al., Reference Miyake, Friedman, Emerson, Witzki, Howerter and Wager2000; Stuss & Alexander, Reference Stuss and Alexander2007). One executive function measure cannot capture all executive processes, and therefore many executive impairments likely go undetected using current cognitive screens in stroke. Advantages of the BELS-SC are that it taps multiple executive functions (initiation, selection, inhibition, inhibition response time, and semantic retrieval response time), it provides insight into strategy use within 5 minutes, and it can be completed at bedside. Thus, the BELS-SC can provide valuable guidance for cognitive rehabilitation. For example, patients with an initiation impairment have benefitted from cueing, whereas patients with a selection deficit would require options to be limited to one or two possibilities, with minimal open-ended questions (Robinson et al., Reference Robinson, Walker, Biggs and Shallice2016). Inhibition deficits may benefit from implementing a process to increase awareness to override or stop, which can be enhanced via strategies, and may also be improved by targeting adaptive behaviors that require the control mechanisms of initiation, selection, and inhibition (Robinson et al., Reference Robinson, Cipolotti, Walker, Biggs, Bozzali and Shallice2015b, Reference Robinson, Walker, Biggs and Shallice2016).
Additionally, executive functioning in acute stroke can predict long-term stroke outcomes (Lesniak et al., Reference Lesniak, Bak, Czepiel, Seniow and Czlonkowska2008; Nys et al., Reference Nys, van Zandvoort, de Kort, van der Worp, Jansen, Algra, de Haan and Kappelle2005, Reference Nys, van Zandvoort, de Kort, Jansen, De Haan and Kappelle2007; Pohjasvaara et al., Reference Pohjasvaara, Leskelä, Vataja, Kalska, Ylikoski, Hietanen, Leppävuori, Kaste and Erkinjuntti2002; Veldsman et al., Reference Veldsman, Werden, Egorova, Khlif and Brodtmann2020; Wolf, Reference Wolf2011). Therefore, investigating the utility of the BELS-SC as a prognostic tool would possibly assist in identifying patients most at risk for poorer long-term stroke outcomes, including cognition, daily functioning, mental health, and quality of life.
Limitations
Due to the range of stroke lesions, the relationship between BELS-SC performance and specific brain regions (e.g., selection in LIFG patients) could not be determined. Post hoc analyses investigating subgroups with specific strokes (e.g., left middle cerebral artery, anterior cerebral artery), could not be performed due to small numbers. Future network-level lesion mapping (as in Moore et al., Reference Moore, Byrne, Gibson, Ford and Robinson2024) to explore BELS-SC performance would enhance our understanding of regions and networks implicated in each executive process tapped by this task. Further, ceiling effects on the Initiation HC items (number correct) meant individual BELS-SC items were unable to be entered into the PCA, and instead subtotals were used. However, we note that if these items were not at ceiling, it would raise questions as to whether any selection and inhibition impairments were in fact due to underlying initiation and/or semantic retrieval impairments. Further investigation into construct validity and internal consistency in other neurological populations may be beneficial in understanding the executive components captured by the BELS-SC.
Conclusion
In summary, the BELS-SC was found to demonstrate good construct, convergent, and divergent validity, and had good sensitivity but poorer specificity when distinguishing healthy controls and stroke patients. When classifying executively impaired versus intact participants, both sensitivity and specificity were good. The BELS-SC is a useful bedside screening tool that can detect executive dysfunction in acute to early sub-acute left and right hemisphere stroke patients. This is critical when patients do not present with severe and/or obvious cognitive impairments, which may then go undetected on current cognitive screens. In an early stroke setting, the BELS-SC can inform targets for rehabilitation, or it can be a brief triage initial cognitive screen for comprehensive neuropsychological assessment.
Supplementary material
The Supplementary Material for this article can be found at https://doi.org/10.1017/S1355617725101112.
Acknowledgements
This study was supported by the Brazil Family Program for Neurology, NFIA Patron’s Walk and an Australian National Health; and Medical Research Council Boosting Dementia Research Leadership Fellowship (APP1135769) awarded to GAR. We wish to thank all participants for their time, especially stroke patients. We also thank Emily Gibson, Georgia Marsh, Jessica Chow, Amelia Ceslis, Amelia Hobson, and Katie Veretennikoff for assisting with data collection.
Competing interests
The authors declare no conflicts of interest.


 Open access