Introduction
Noise-induced hearing loss is a global problem with a considerable associated health burden.Reference Nelson, Nelson, Concha-Barrientos and Fingerhut1 Legislation has aimed to limit workplace exposure, including mandatory screening in the UK, yet prevalence remains high and under-reported.2
Pure tone audiometry (PTA) is the ‘gold standard’ for serial surveillance of auditory function, with established international protocols allowing reliable diagnosis.Reference Coles, Lutman and Buffin3 Pure tone audiometry enables assessment of auditory sensitivity throughout the auditory pathway, and differentiation of conductive and sensorineural deficit.Reference Coles, Lutman and Buffin3 However, professionally performed screening PTA has associated resource limitations, including suitably trained staff and sound-attenuating facilities. In addition, PTA may not detect subclinical deficits and is open to manipulation by malingerers.
These factors have contributed to efforts in developing more objective screening tools that could supplant or augment PTA. Following the discovery of otoacoustic emissions (OAEs) in the 1970s, OAE testing has been regularly proposed as a potentially superior screening method.Reference Engdahl, Tambs, Borchgrevink and Hoffman4, 5 Otoacoustic emissions are generated by cochlear outer hair cells as a direct physiological consequence of an acoustic stimulus. The outer hair cells act as physiological amplifiers to increase the cochlear sensitivity of low- to moderate-intensity stimuli (i.e. 40–60 dB SPL).Reference Ryan, Robinette and Glattke6 Consequently, OAE measurement would ostensibly enable objective measurement of function in the auditory periphery.5
A considerable amount of literature, over three decades, has documented attempts to develop and extend the application of OAE testing. Whilst clinical use of some classes of OAEs has advanced (e.g. neonatal screening),Reference Kimberley7 there have been obstacles to their broader application as a robust screening tool.5 In particular, OAE screening could be of considerable benefit in those exposed to occupational noise; for example, brickyard workers.5
In this report, PTA data from a group of brickyard workers were compared with distortion product OAEs (DPOAEs) obtained concurrently at routine screening. The study aimed to establish whether there were any clinically predictive relationships between PTA deficit and DPOAE amplitudes.
Materials and methods
Ethical considerations
This study utilised data obtained during mandatory audiometric screening of workers exposed to occupational noise. No ethical considerations arose from the retrospective review of these data. All subjects agreed to inclusion of their audiological data for review.
Demographics and noise exposure
Routine industrial audiological screening was conducted over 1 day on 16 male brickyard workers aged 20–65 years old. Of these, five were from outside the UK (Eastern Europe).
All subjects had been exposed to industrial noise of varying duration and intensity. At the time of screening, all were employed in a brick works where a number of noise sources (e.g. brick ovens, cooling fans and lifting machinery) contributed to a variable noise spectrum.8 Estimated ranges of cumulative exposure were based on employment records and mandatory dosimetry measurements (Shield Environmental Health Services, Newcastle-under-Lyme, UK).
Pure tone audiometry screening was conducted in accordance with Health and Safety Executive guidelines, and on this occasion was accompanied by measurement of distortion product OAEs (DPOAEs).
Subjects were asked questions focusing on medical history; these concerned factors that may contribute to otoneurological pathology, including familial deafness, chronic middle-ear disease, ear surgery and ototoxic medication. Bilateral otoscopy confirmed a patent external acoustic meatus to ensure valid PTA and DPOAE measurements.
Pure tone audiometry was performed by one of the authors (MB) in a soundproof booth, satisfying the criteria for audiometric testing.9 Thresholds were measured over 0.5 to 8 kHz using a Kamplex KLD-21 audiometer and TDH 39P headphones with audiocups (PC Werth, Balham, UK) calibrated according to recommended criteria.10 Threshold values at each frequency were obtained to within 5 dB, according to recognised protocol.10, 11 Bone conduction thresholds were also measured if any conductive loss was suspected, to define the air–bone gap.12
Distortion product otoacoustic emission measurement
The DPOAEs in both ears were measured by one author (PB) directly following PTA assessment in a sound-treated mobile test facility (Industrial Diagnostics, Hinckley, UK) or a quiet room with measured background noise within recommended limits.9 A sound-isolating ear cup was used to additionally attenuate ambient noise.
The DPOAEs were generated using the Otoport Advance instrument (Otodynamics, Hatfield, UK). Calibration of the Otoport system was performed according to the manufacturer instructions, with system electronics tested using an internal self-diagnostic routine.
The delivery of the acoustic stimuli to the ear canal conformed to International Electrotechnical Commission audiometric equipment requirements (IEC 60645).13 Distortion product grams (DP grams) were plotted with the following parameters for the two primary stimulating tones f1 and f2: f2/f1 = 1.22, and f1 and f2 dB SPL = 75 dB SPL. Stimulus frequency increased in quarter octave steps starting with f2 = 1 kHz up to 8 kHz. The primary generator site along the cochlea for the 2f1–f2 distortion product at this stimulus intensity level was taken as the f2 location.Reference Plinkert, Heitmann and Waldmann14, Reference Lukashkin, Lukashkina and Russell15 This was used in direct comparative mapping of 2f1–f2 distortion product with the PTA frequencies. Signal averaging typically used 16 samples, with further averaging carried out to reduce the background noise floor where possible. To ensure measurement validity, the residual noise floor was set to be at least 6 dB below the 2f1–f2 distortion product signal.Reference Harris, Probst, Robinette and Glattke16, Reference Martin-Lonsbury, Martin, Whitehead, Robinette and Glattke17 The DPOAE sets were then plotted as a DP gram over 1–8 kHz.
Data entry, processing and statistical analysis
Data was inspected independently by two authors (NW and MM) prior to entry into Excel™ spreadsheets. Individual subject PTA thresholds and DP gram amplitudes were plotted for direct comparison. Attention was paid to identifying subjects who retained DPOAEs at PTA frequencies exhibiting marked threshold elevation. The PTA thresholds versus DP gram amplitudes were plotted, assuming simple linear regression, and Pearson's correlation coefficients were calculated. Statistical significance was set at p < 0.05.
Results
Demographics and noise exposure history
Median subject age was 37 years. One subject had a clinically significant audiological history (unilateral, recurrent suppurative otitis media) that explained their observed air–bone gap, elevated PTA thresholds and an absence of distortion product OAEs (DPOAEs).
Occupational noise exposure prior to current employment was reported by 9 of the 16 subjects. Exposure was highly variable in duration (2–23 years), intensity and spectral quality. Previous employment included factory work, nightclub work and trombone playing. Subjects with documented firearm noise exposure (n = 5) did not exhibit unilateral auditory deficit in PTA or DPOAE assessment.
The duration of documented employment in the brickyard ranged from 2 to 39 years (median of 7 years). In estimating daily personal noise exposure equivalents, representative audiometric dosimetry measurements returned values between 77 and 90 dB (A-weighted), based on an 8.5-hour working day.18 Individual daily personal noise exposure equivalent values varied depending on task and location within the brickyard. Impulsive peak exposures could fall between 125 and 130 dB (C-weighted), and could reach 140 dB (C-weighted). For comparison, impulsive peak exposure from rifle fire can reach in excess of 150 dB (C-weighted).Reference Rasmussen, Flamme, Stewart, Meinke and Lankford19
Pure tone audiometry and distortion product grams comparison
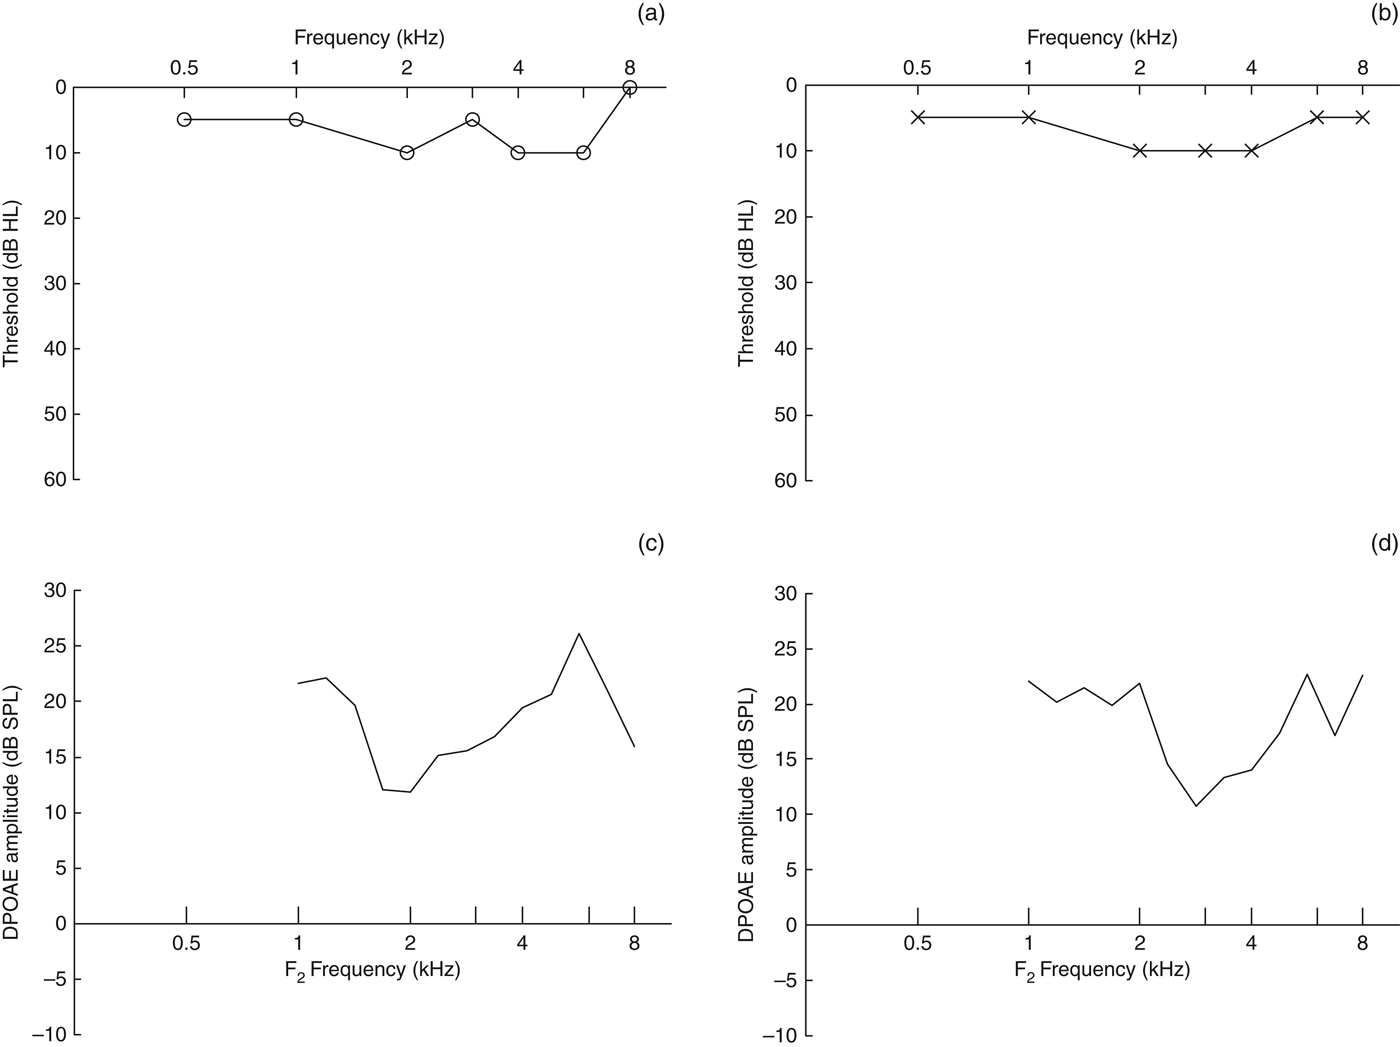
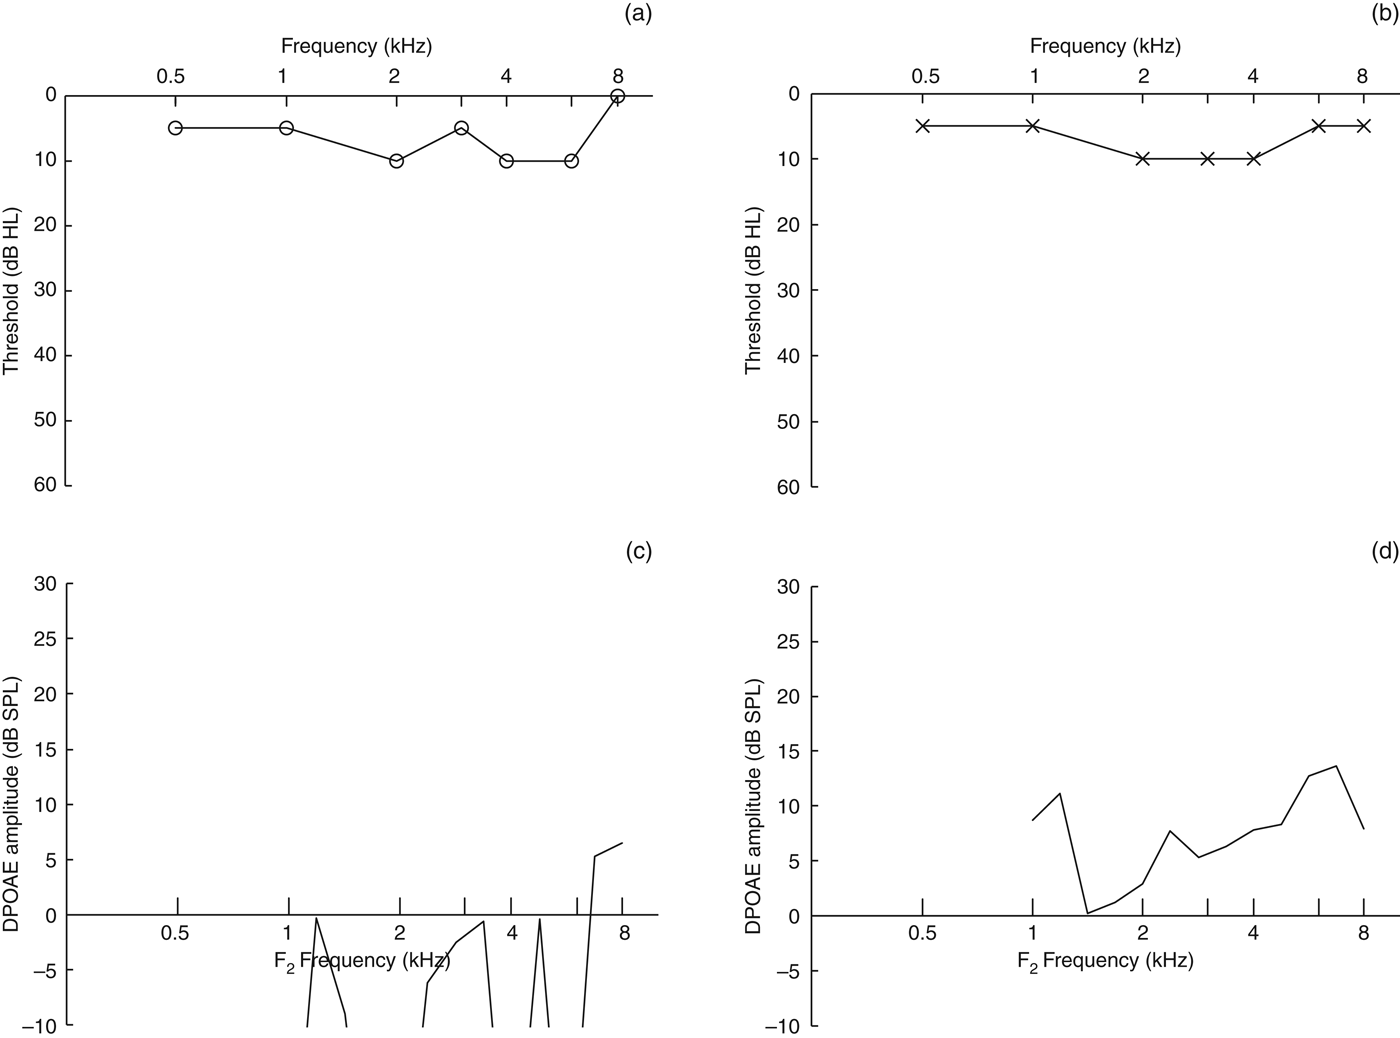
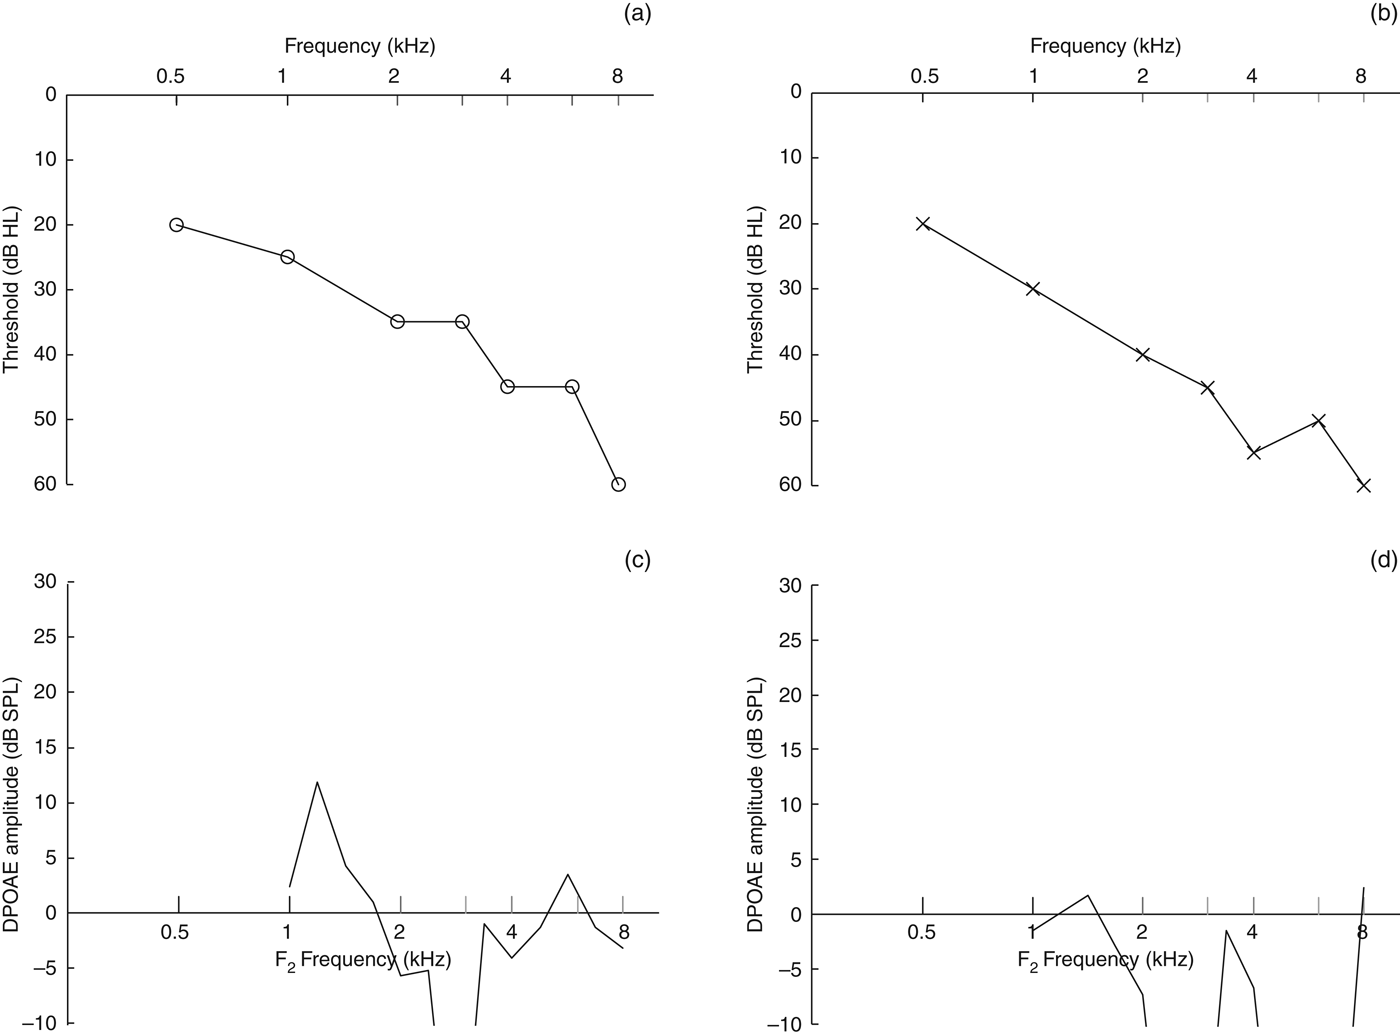
Figures 1–4 illustrate the wide variability in PTA thresholds and of DPOAE amplitudes generated at comparative frequencies (i.e. with f2 referenced as the primary generator site for the distortion product).

Fig. 1 Pure tone audiometry (PTA) findings ((a) right ear, (b) left ear) and distortion product grams ((c) right ear, (d) left ear) for subject four, who was in their early thirties. The PTA and distortion product otoacoustic emission (DPOAE) plots would be judged clinically normal.

Fig. 2 Pure tone audiometry (PTA) findings ((a) right ear, (b) left ear) and distortion product grams ((c) right ear, (d) left ear) for subject 12, who was in their early twenties. The PTA plots are clinically normal. The right ear distortion product otoacoustic emissions (DPOAEs) are effectively absent and left ear DPOAEs are reduced in amplitude.
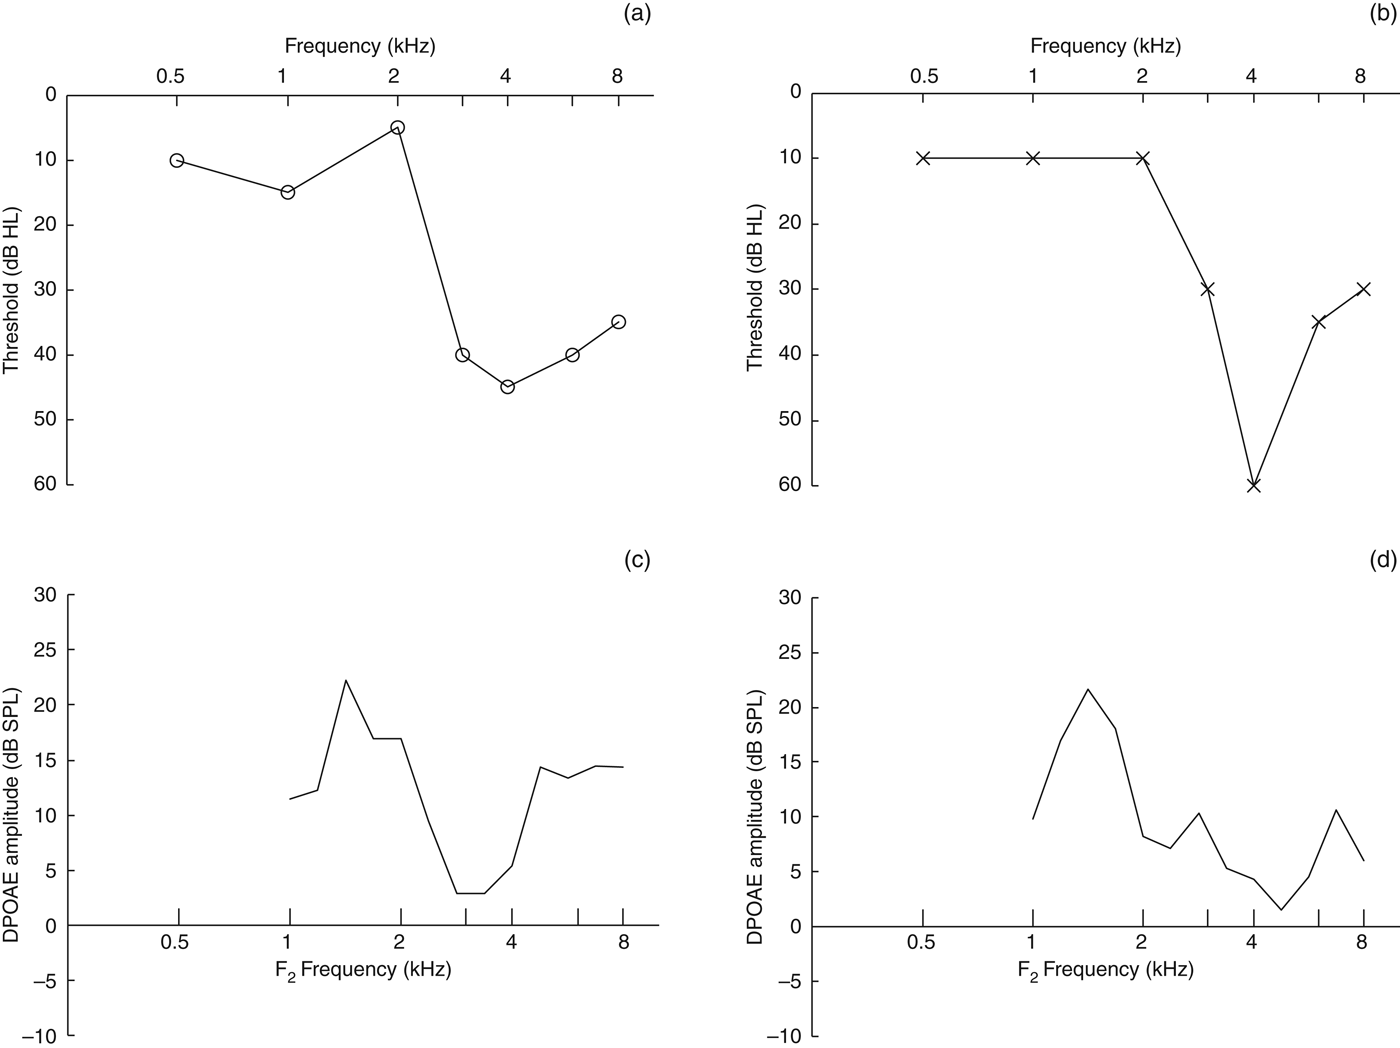
Fig. 3 Pure tone audiometry (PTA) findings ((a) right ear, (b) left ear) and distortion product grams ((c) right ear, (d) left ear) for subject six, who was in their mid-forties. Both PTA plots were pathognomonic for noise-induced hearing loss. In spite of this loss, measurable distortion product otoacoustic emissions (DPOAEs) were still present in both ears, indicating the presence of functioning outer hair cells at those frequencies.

Fig. 4 Pure tone audiometry (PTA) findings ((a) right ear, (b) left ear) and distortion product grams ((c) right ear, (d) left ear) for subject two, who was in their mid-forties. Both PTA plots exhibited marked sloping threshold elevation bilaterally. Distortion product otoacoustic emissions (DPOAEs) were largely absent, which would be consistent with outer hair cell damage.
Figure 1 (a–d) shows the PTA plots and DP grams for subject four, whose PTA plots were unremarkable, with thresholds between 0 to 10 dB HL. The DPOAEs obtained for subject four were present across all frequencies, varying between 10 and 25 dB SPL. With reference to the established literature, these DP grams would be considered normal and reflect functioning outer hair cells.Reference Harris, Probst, Robinette and Glattke16, Reference Martin-Lonsbury, Martin, Whitehead, Robinette and Glattke17 The range of DPOAE amplitude variability when compared with the PTA thresholds would be judged unremarkable, as would the differences between the appearance of the right and left DP grams. Overall, the PTAs and DP grams for subject four would clinically be considered as normal.Reference Harris, Probst, Robinette and Glattke16, Reference Martin-Lonsbury, Martin, Whitehead, Robinette and Glattke17
Figure 2 (a–d) shows the PTA and DP grams for subject 12, whose PTA plots were also unremarkable, with thresholds between 0 to 10 dB HL. In contrast to the DPOAEs for subject 4, those obtained for subject 12 were reduced in amplitude bilaterally. The DPOAE amplitudes for the right ear, as shown in Figure 2c, could not be distinguished from the noise floor (effectively around 0 dB SPL). In the left ear of subject 12, DPOAEs were measurable, ranging between 0 to 10 dB SPL over 1–8 kHz.
The PTA thresholds were largely comparable between subject 4 (Figure 1a and b) and subject 12 (Figure 2a and b), although there was clear discrepancy between their respective DPOAE amplitudes. The PTAs of subject 12 would clinically be considered normal. The DP gram for the right ear was effectively absent and the DP gram for the left ear was poor. In summary, subject 12 exhibits clinically normal PTA thresholds and therefore functioning outer hair cells, but has reduced or absent DPOAEs. This means that the DP grams could not be used in isolation to make any inference about outer hair cell function.
Figure 3 (a–d) illustrates the PTA findings and DP grams obtained for subject six. In Figure 3 (a and b), both PTA plots exhibit marked threshold elevation between 2 and 8 kHz. In the right ear, thresholds over 3–8 kHz fall between 35 and 45 dB HL, with the appearance of a ‘bulge’. In the left ear, the elevation is even more marked between 30 and 60 dB HL, peaking at 4 kHz and forming a clear ‘notch’.
In reviewing the DP grams in Figure 3 (c and d), there are a number of notable features. In the right ear, at about 3–4 kHz, the DPOAEs, whilst of relatively low amplitude at 3–5 dB SPL, are still measurable, indicating residual functioning outer hair cells.Reference Harris, Probst, Robinette and Glattke16, Reference Martin-Lonsbury, Martin, Whitehead, Robinette and Glattke17 Over 5–8 kHz, the DPOAE amplitude is increased to about 14 dB SPL, again indicating functional outer hair cells. In the left ear, the appearance of the DP gram differs from that of the right ear. At about 3 kHz, the DPOAE amplitude is between 5 and 10 dB SPL, at 4 kHz the DPOAE has a value of 5 dB SPL, and between 5 and 8 kHz it peaks at about 11 dB SPL.
From the PTA thresholds measured over 3–8 kHz in the right ear of subject six, it would have been reasonable to expect no DPOAEs to have been present based on a number of previous studies.Reference Martin-Lonsbury, Martin, Whitehead, Robinette and Glattke17 However, this is not the case in subject six, and functioning outer hair cells were still present over these frequencies. Similarly, in the left ear, despite the reduction in DPOAE amplitudes over 3–8 kHz they were still measurable above the noise floor when PTA thresholds were markedly elevated.
At 4 kHz, the PTA threshold of 60 dB HL would be associated with a very low probability of DPOAEs of this amplitude being generated. Therefore, this implies that the site(s) of ototrauma are located elsewhere in the auditory pathway.Reference Martin-Lonsbury, Martin, Whitehead, Robinette and Glattke17 In summary, the PTA thresholds for subject six were consistent with significant ototrauma,Reference Coles, Lutman and Buffin3 whilst the DP grams clearly indicated functioning outer hair cells.Reference Engdahl, Tambs, Borchgrevink and Hoffman4, Reference Ryan, Robinette and Glattke6, Reference Kimberley7, Reference Martin-Lonsbury, Martin, Whitehead, Robinette and Glattke17
Figure 4 (a–d) illustrates the PTA and DP grams obtained for subject two. Both PTA plots exhibited a sloping threshold elevation bilaterally. Thresholds in both ears at 0.5 kHz were 20 dB HL, and fell to 60 dB HL at 8 kHz. Although this is atypical of noise-induced hearing loss, occupational exposure in subject two was a significant documented factor that could have contributed to this loss.Reference Coles, Lutman and Buffin3
As shown in Figure 4 (c and d), both DP grams for subject two showed poor or absent DPOAEs that fell below the recording noise floor. Interestingly, whilst both right and left PTA findings were comparable, the DPOAE amplitudes showed some frequency-specific differences between ears over 1–2 kHz and 5–6 kHz. At this latter frequency range, with a PTA threshold of 45 dB HL, the likelihood of DPOAEs being present above the recording noise floor is again very low.Reference Rasmussen, Flamme, Stewart, Meinke and Lankford19 In summary, the PTA findings for subject two indicated marked hearing loss in combination with predominantly absent DPOAEs.
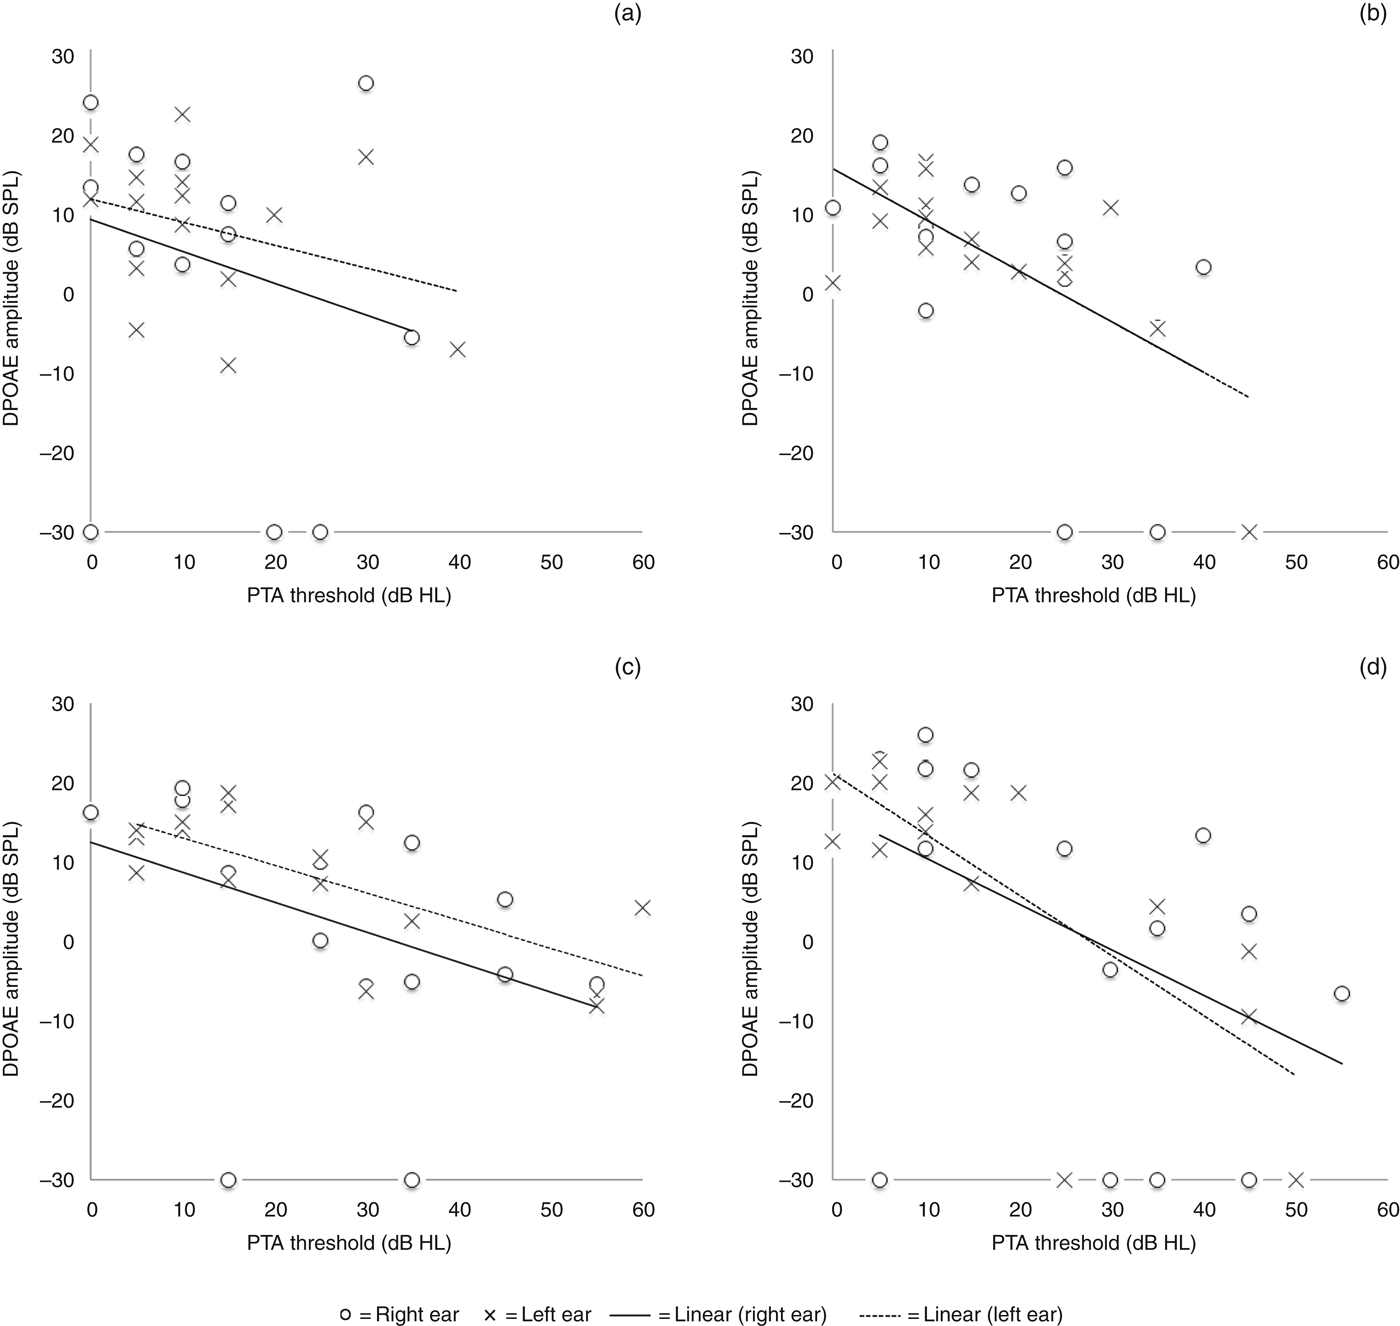
Figure 5 (a–d) shows the correlation plots of individual PTA thresholds versus DPOAE amplitudes at 2, 3, 4 and 6 kHz for the left and right ears. The DPOAE amplitudes of −30 dB SPL (the effective noise floor limit of the Otoport system) were included here as they are clinically relevant in demonstrating the range of variation at a given PTA threshold. Across all the plots, the scatter is large, ranging from 25 to −30 dB HL.

Fig. 5 Correlation plots for pure tone audiometry (PTA) thresholds versus distortion product otoacoustic emission (DPOAE) amplitudes at (a) 2 kHz, (b) 3 kHz, (c) 4 kHz and (d) 6 kHz for both ears. There is marginal evidence of a correlation in the small dataset offset by marked scatter across all frequencies.
The correlation plots (Figure 5) complement Figures 1–4 in demonstrating the absence of any robust relationship between PTA thresholds and DPOAE amplitudes, even at this high-stimulus intensity.Reference Ryan, Robinette and Glattke6, Reference Harris, Probst, Robinette and Glattke16, Reference Martin-Lonsbury, Martin, Whitehead, Robinette and Glattke17 Notwithstanding the lack of a strong predictive relationship between the two variables, lines of ‘best fit’ were calculated to establish any underlying relationship from the limited dataset.
Table I summarises the correlation parameters over 2–6 kHz for the left and right ears. A negative correlation between DPOAE amplitudes and PTA thresholds was apparent (overall, this was around −0.5 dB SPL/dB HL). The intercepts also showed some relationship with frequency. However, the correlation only reached significance (p < 0.05) at four out of the total eight frequencies, which was unsurprising given the limited dataset available for this report.
Table I Correlation results*

*For pure tone audiometry thresholds and distortion product otoacoustic emission amplitudes. NS = not significant
Discussion
Key findings
This small, retrospective data review shows that distortion product OAEs (DPOAEs) do not currently form a suitable replacement for PTA in clinical practice, including as a potential routine screening procedure. This finding reflects much of the existing literature.Reference Engdahl, Tambs, Borchgrevink and Hoffman4–Reference Kimberley7, Reference Harris, Probst, Robinette and Glattke16 What marks this study out is a considered comparison of individual PTA thresholds against DPOAE amplitudes generated at equivalent frequency locations along the length of the basilar membrane.Reference Plinkert, Heitmann and Waldmann14, Reference Lukashkin, Lukashkina and Russell15
Firstly, as already demonstrated in the literature, PTA thresholds and DPOAE amplitudes exhibit poor correlation and a large scatter, which does not support their use to predict hearing thresholds clinically. Secondly, in the presence of elevated PTA thresholds over 30–60 dB HL, the continued appearance of DPOAEs strongly supports the existence of functioning outer hair cells at this frequency location. This in turn serves as evidence that lesion sites other than the outer hair cells are contributing to the deficit arising from noise ototrauma.
If correct, this is of both scientific and clinical importance. It would mean that noise may be producing damage at other sites within the peripheral auditory pathway in addition to, or in place of, that expected to be inflicted on the outer hair cells.Reference Henderson, Hu, Bielefeld, Schacht, Popper and Fay20 This damage is likely to be metabolic or excitotoxic in nature, as opposed to physical derangement affecting the outer hair cell stereocilia alone.Reference Henderson, Hu, Bielefeld, Schacht, Popper and Fay20
Comparison with other studies
As previously stated, there is already a large amount of literature, going back to the 1980s, which attempted to demonstrate that measurement of DPOAEs and other OAE types could supplant PTA. This evidence showed there was too much variation between OAE measures and PTA thresholds to be of clinical use, as is shown in this study.Reference Engdahl, Tambs, Borchgrevink and Hoffman4, 5, Reference Kimberley7, Reference Harris, Probst, Robinette and Glattke16, Reference Martin-Lonsbury, Martin, Whitehead, Robinette and Glattke17 Sources contributing to OAE variation can include at least four different sources, from the outer hair cell through the cochlea, ossicular chain tympanic membrane and external auditory meatus.Reference Kemp, Robinette and Glattke21
Study limitations
This small, retrospective review involved 16 subjects using data obtained from a single routine screening, and only DP grams at a single, high-stimulus intensity were analysed. Clearly, a larger number of subjects with more detailed measurement of DPOAEs would have provided more data to explore the proposed hypothesis. This could have included obtaining DPOAEs over a range of stimulus intensities measured longitudinally. These would also provide evidence of DPOAE repeatability and stability.Reference Engdahl, Tambs, Borchgrevink and Hoffman4, 5
A suitably designed study incorporating these features could be carried out across a number of centres with relatively modest resources, as audiometric data collection is already a statutory requirement. This deserves further formal consideration by the audiological community, as already proposed by the UK Health and Safety Executive.5
• Distortion product otoacoustic emissions (DPOAEs) have been proposed as an objective replacement for pure tone audiometry (PTA) in surveillance
• In noise-exposed individuals, PTA thresholds against DPOAE amplitudes at equivalent frequency locations in the cochlea lack a robust correlation across a range of frequencies
• Moderate-to-large DPOAE amplitudes were seen at frequencies with marked threshold elevation
• This suggests that noise ototrauma may be producing deficit at auditory periphery sites other than the outer hair cells
Clinical application
Sequential PTA and DPOAE assessment could be of significant clinical benefit. The study findings require cautious interpretation. Further investigation is recommended in order to understand the auditory periphery response to differing types of ototrauma, and to comprehend how this is measured by DPOAEs and PTA in combination. Whilst the results presented here are of scientific and clinical relevance, they do not support the replacement of PTA by DPOAEs as the gold standard for audiometric screening.
