Ice-Stream Flowand Basal Conditions
Ice streams drain as much as 90% of the ice of the Antarctic ice sheet (Reference Morgan, Jacka, Akerman and ClarkeMorgan and others, 1982) and flow at velocities which are typically one to two orders of magnitude greater than that of the surrounding tee sheet. Ice-stream flow is largely controlled by friction at the sides and at the bed. with basal conditions relatively more important towards the center of the ice stream (Reference Frolich and DoakeFrolich and Doake. 1988: Echel-meyer and others. 1994), The fast ice flow which is observed at the surface of an ice stream is believed to be associated with three possible processes occurring at the base: basal sliding: deformation of a soft subglacial bed: and deformation of a region of soft ice forming the lower part of the ice column. Thuse three processes presumably occur in different proportions beneath different ice streams and glaciers. and may also vary spatially w ithin an ice stream.
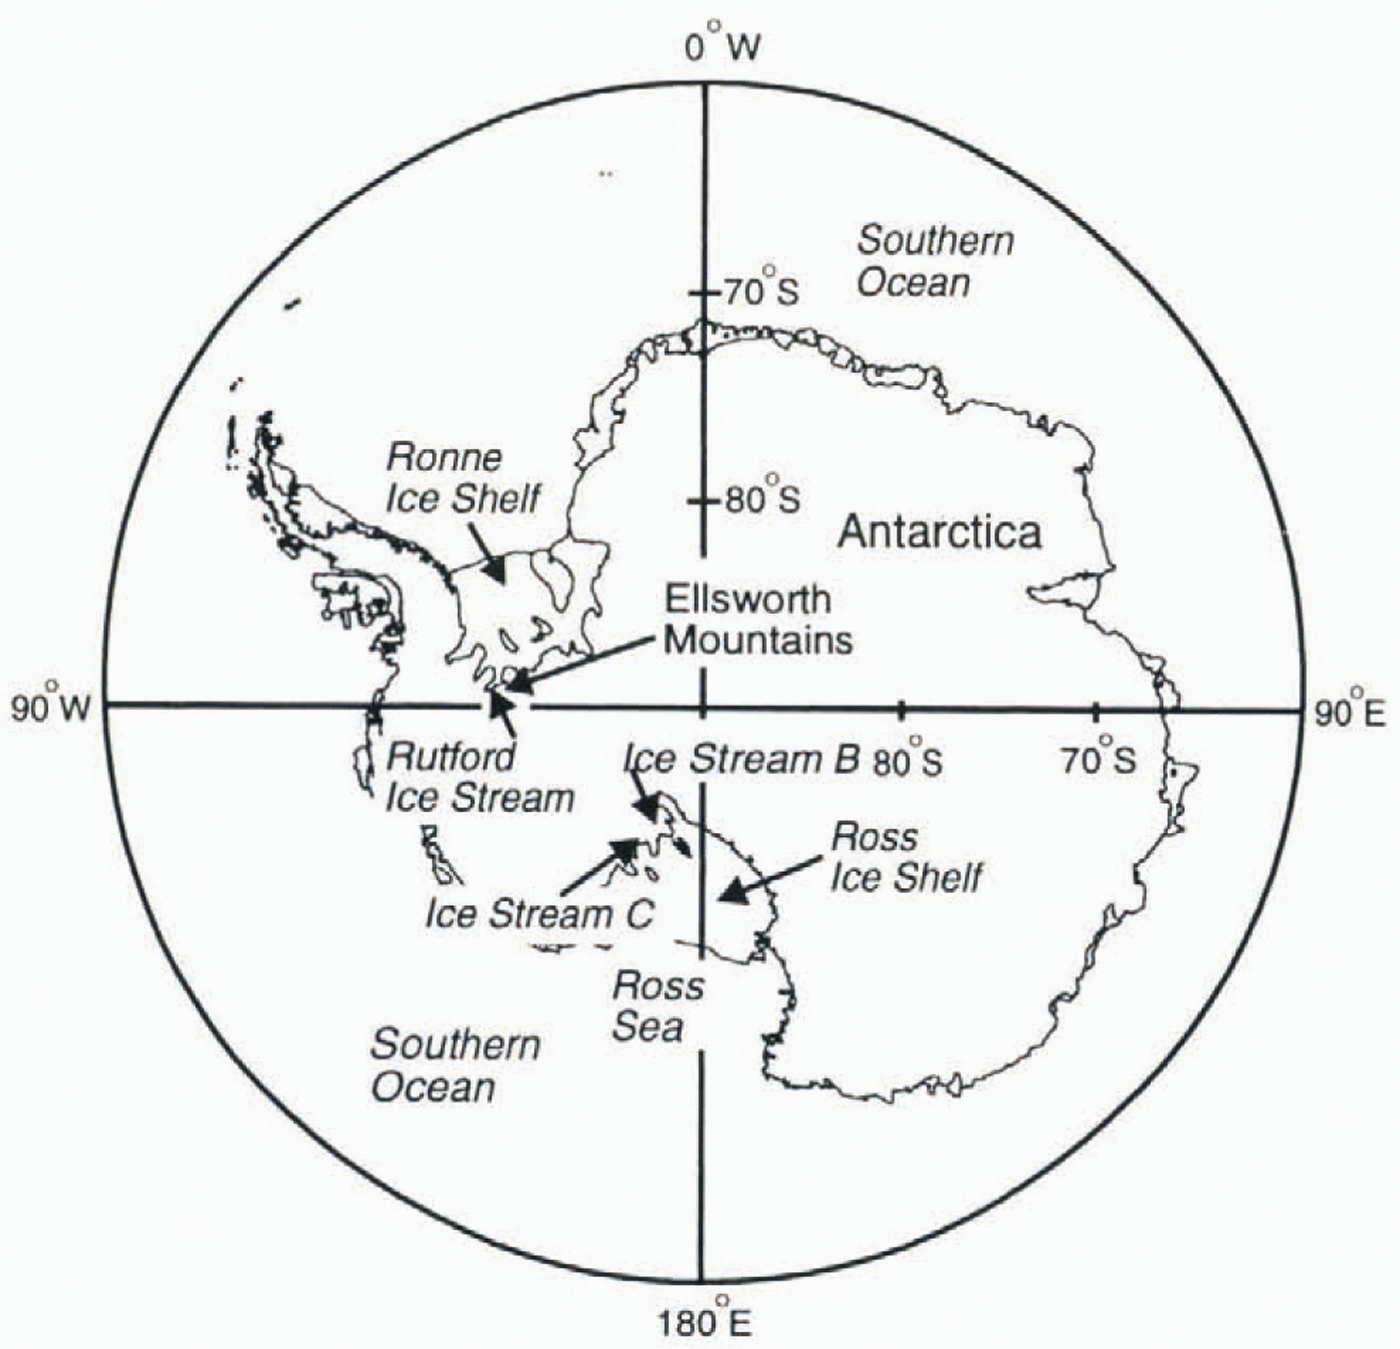
There is little field evidence as to which of these three basal processes actually occur beneath present-day ice Streams and in what proportions. Two ice streams where some evidence of the basal conditions exists are Ice Stream B in West Antarctica and,Jakobshavns Isbræ in Greenland. Seismic surveys provided evidence for a soft deforming bed beneath Ice Stream B (Fig. 1) (Reference Alley, Blankensee, Bentley and RooneyAlley and others. 1986, Reference Alley, Blankenship, Bentley and Rooney1987; Reference Blankenship, Bentley, Rooney and AlleyBlankenship and others. 1986, Reference Blankenship, Bentley, Ronney and Alley1987b), which was confirmed by subsequent drilling (Reference Engelhardt, Humphrey, Kamb and FahnestockEngelhardt and others. 1990). In contrast, temperature profiles suggest that deformation of a thick Iaver of relatively soft basal ice contributes significantly to the fast flow of Jakobshavns Isbræ (Reference Iken, Echelmeyer, Harrison and FunkIken and others. 1993.) Unlike seismic surveys on Ice Stream B. those on Jakobshavns Isbræ did not detect any clearly defined sub-ice layer (Reference Clarke and EchchelmeyerClarke and Echelmeyer, 1996).
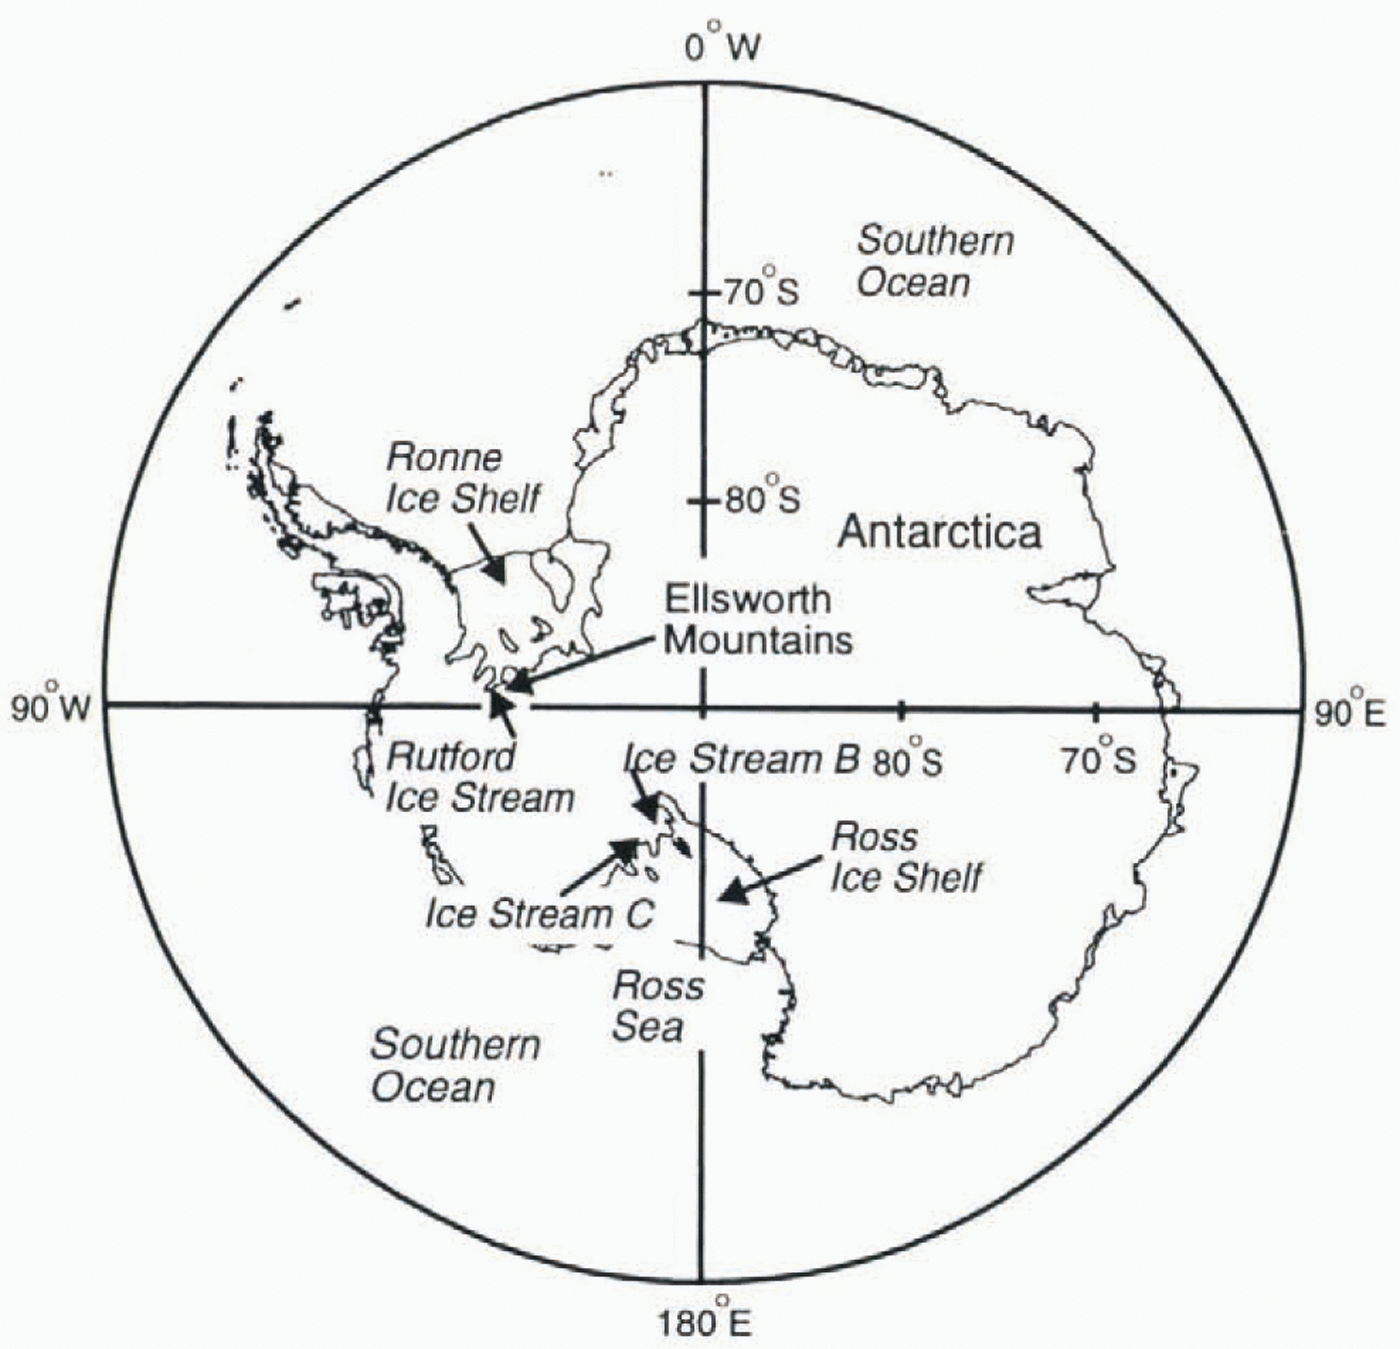
Fig. 1. Location map showing Rutford Ice Streem and other places mentioned in the text.
Rutford Ice Stream is a fas-flowing glaceier (Fig. 1) which drains ice into the Ronne Ice Shelf. The dynamics of its ice flow have been described in a number of papers (Reference Stephenson and DoakeStephen-son and Doake. 1982: Reference Doake, Frolich, Mantripp, Smiih and VaughanDoake and others. 1987: Reference Frolich, Mantripp, Vaughan and DoakeFrolich and others. 1987. Reference Frolich, Vaughan and Doake1989: Reference Frolich and DoakeFrolich and Doake, 1988), Ice velocity is high (300-400ma−1; Reference Frolich, Vaughan and DoakeFrolich and others. 1989) and basal shear stress is low (around 40 KPa; Reference Frolich and DoakeFrolich and Doake. 1988), so the ice stream is not frozen to the bed and the basal ice is probably close to the pressure-melting point. Active seismic surveys were carried out on Rutford Ice Stream during the 1991-92 and 1992-93 field seasons (Smith, 1991)
with the aim of investigating the basal characteristics and processes and in particular Whether basal sliding or soft-bed deformation was predominant. Reference SmithSmith (1997)presented the results from one seismic reflection line. Two more seismic reflection lines are presented and interpreted here.
Choice of Sites for the Seismic Surveys
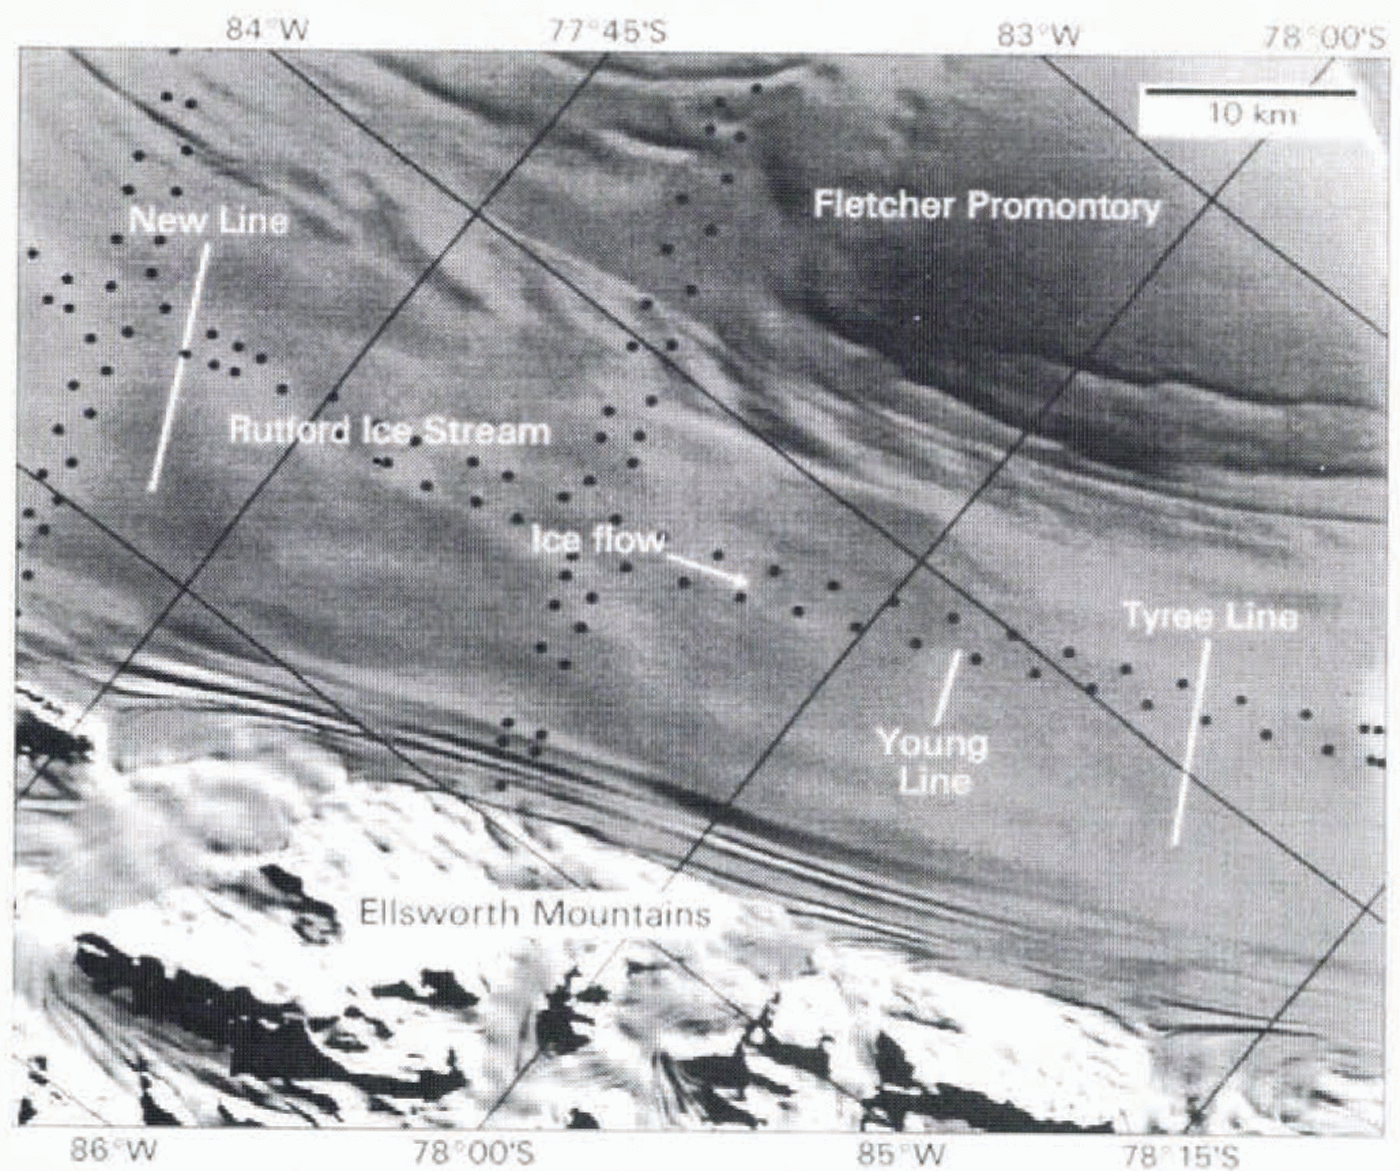
During the 1992-93 field season seismic reflection data were collected along two lines. New Line and Young Line (Fig. 2.) perpendicular to the ice-flow direction. Figure 2also shows the stake positions of part of the survey network reported in a number of papers (Reference Doake, Frolich, Mantripp, Smiih and VaughanDoake and others. 1987; Reference Frolich, Mantripp, Vaughan and DoakeFrolich and others, 1987,Reference Frolich, Vaughan and Doake1989; Reference Frolich and DoakeFrolich and Doake. 1988). The survey data show that the characteristic fast ice flow is already well established in the region of the seismic lines (Reference Doake, Frolich, Mantripp, Smiih and VaughanDoake and others. 1987). The pattern of surface features seen on satellite images suggests that the upstream seismic line (New Line) is positioned about halfway down the length of the ice stream. New Line was 12.6km long and Young Line was 3.7km long. Young Line is situated in a wide area of relatively smooth and Level surface topography seen on satellite images. Surface glaciological measurements in this area (Reference Frolich, Mantripp, Vaughan and DoakeFrolich and others, 1987) indicate that basal shear stress is low (>40kPa) and that the ice-flow velocity is roughly constant at around 366 ma−1. New Line was situated 40km further upstream. Satellite images show that the surface topography in the region of New Line is much more undulating, presumably reflecting a rougher ice-stream bed. Basal shear stress and longitudinal surface slope are higher (Reference Frolich, Vaughan and DoakeFrolich and others. 1989); ice-flow velocity is lower (around 310 ma−1) and the longitudinal velocity gradient in the area is positive (Reference Frolich, Vaughan and DoakeFrolich and others, 1989). Figure 2also shows the position of the seismic line presented by Reference SmithSmith (1997). This line was not named in that source, but here it is called Tyree Line.
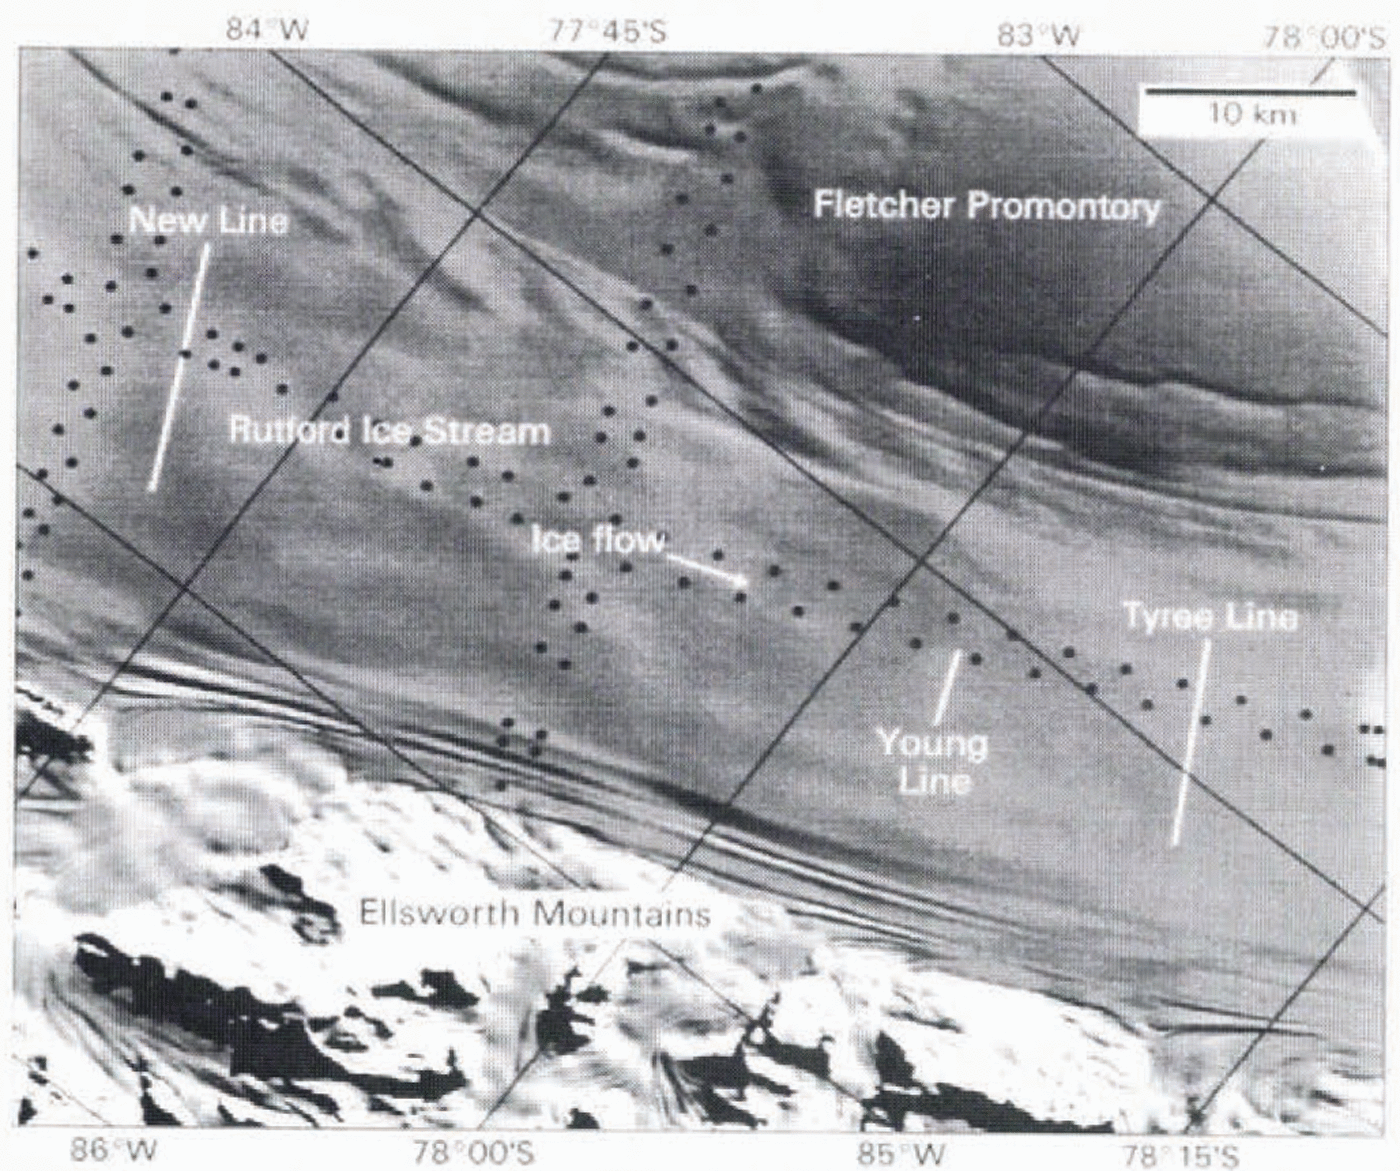
Fig. 2. Layout of the main reflection lines (labelled while lines) on Rutford Ice Stream, 1991-92 ami 1992-93 field seasons, superimposed on Landsat satellite image. (Tyree Line was presented by Reference SmithSmith (1997)but was not named in that work.) Black dots mark some of the stake positions of the survey network (Reference Doake, Frolich, Mantripp, Smiih and VaughanDoake and others. 1987; Reference Frolich, Mantripp, Vaughan and DoakeFrolich and others. 1987, Reference Frolich, Vaughan and Doake1989; Reference Frolich and DoakeFrolich and Doake. 1988).
Seismic Acquisition and Data Processing
Seismic reflection surveys
The acquisition parameters and data processing were the same for both New and Young seismic reflection lines. The seismic source was 300 g of high explosive, placed in 20 in deep holes produced with a small hot-water drill. Shots were Spacod at 120m intervals and were detected by 24 vertically orientated geophones (natural frequency 40Hz) at 10m spacing. This produced single fold data with reflection points Spaced 5 m apart on the bed. Offset from the shot to the first geophone was 30 m. The recording instrument (BISON 9024) sampled ev ery 0.2 ms.
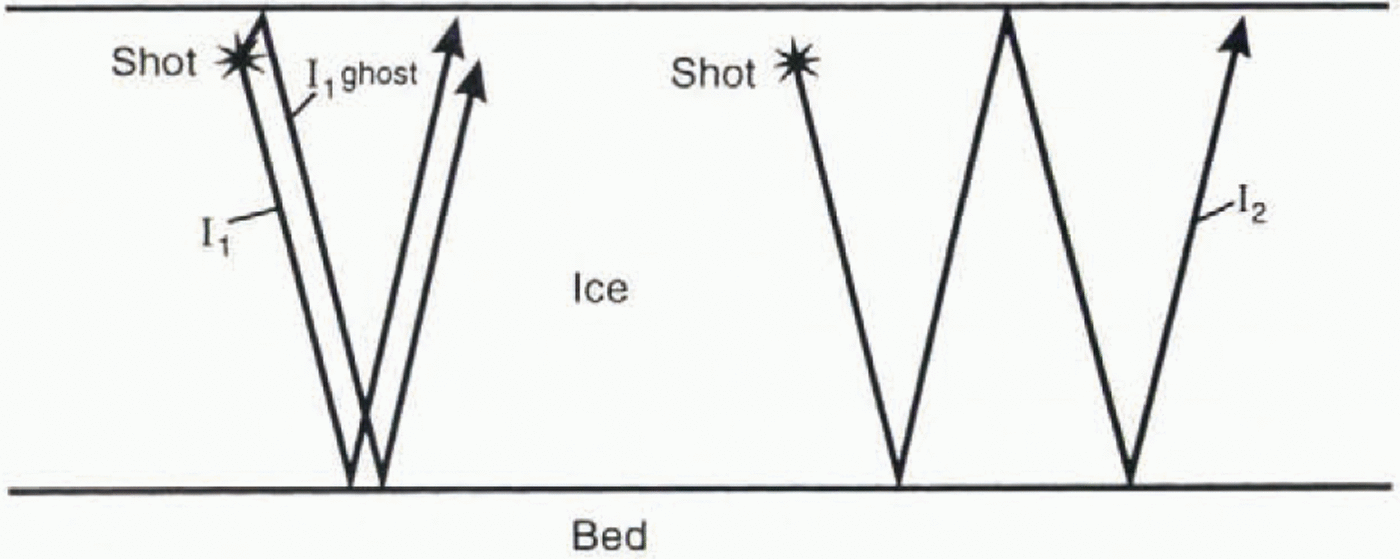
The data were adjusted for slight variations in the shot depths and also for the surface topography, assuming thai the thickness of the firn was constant along each line. A normal move-out correction was applied, which accounts for the different distances from a given shot to each of the 24 geophones. A predictive deconvolution filler was designed for each shot and applied to remove the Surface ghost reflection (this is energy which travels upwards from the shot before bouncing off the surface and going downwards, a short time after the initial downward-travelling shot energy: see Fig. 3). The coefficients and the prediction distance for the dcconvolution filter were designed such that the ice bed reflection was not altered. Finally, the data were migrated to collapse numerous hyperbolas (Reference Smith and OerlerSmith, 1994) and to position reflections correctly.
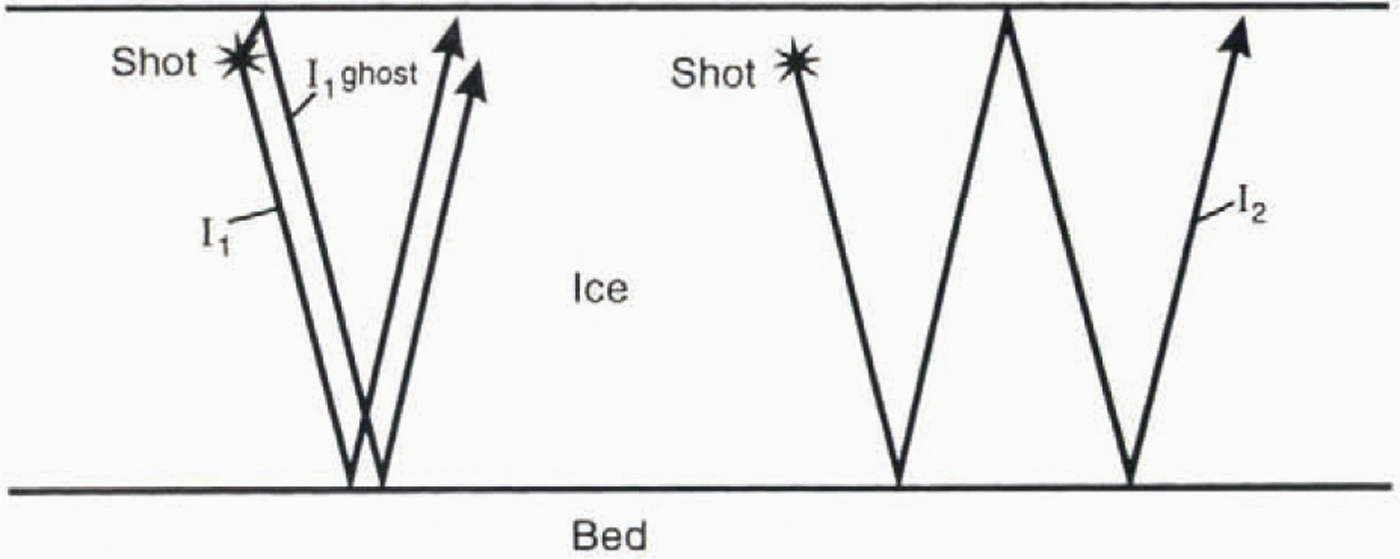
Fig. 3. Diagrammatic ray-paths for tee bed reflection (I1). ice bed ghost (I1ghost) and first iee multiple (I2)
Wide-angle and shallow refraction surveys
At a number of sites along both New Line and Young Line, seismic wide-angle and shallow-refraction surveys were conducted to complement the reflection data, as discussed later. The wide-angle experiments recorded data from source receiver offsets ranging from 10m to over 4km. using charge sizes of 750 -2250 g. For the shallow-refraction surveys, small surface sources (either a single detonator or a 50 g charge) were recorded out to source receiver offsets of 440m, to provide information on the velocity and density structure of the tipper 100-120 m of snow and firn.
The Seismic Reflection Data
Ice-bed reflections
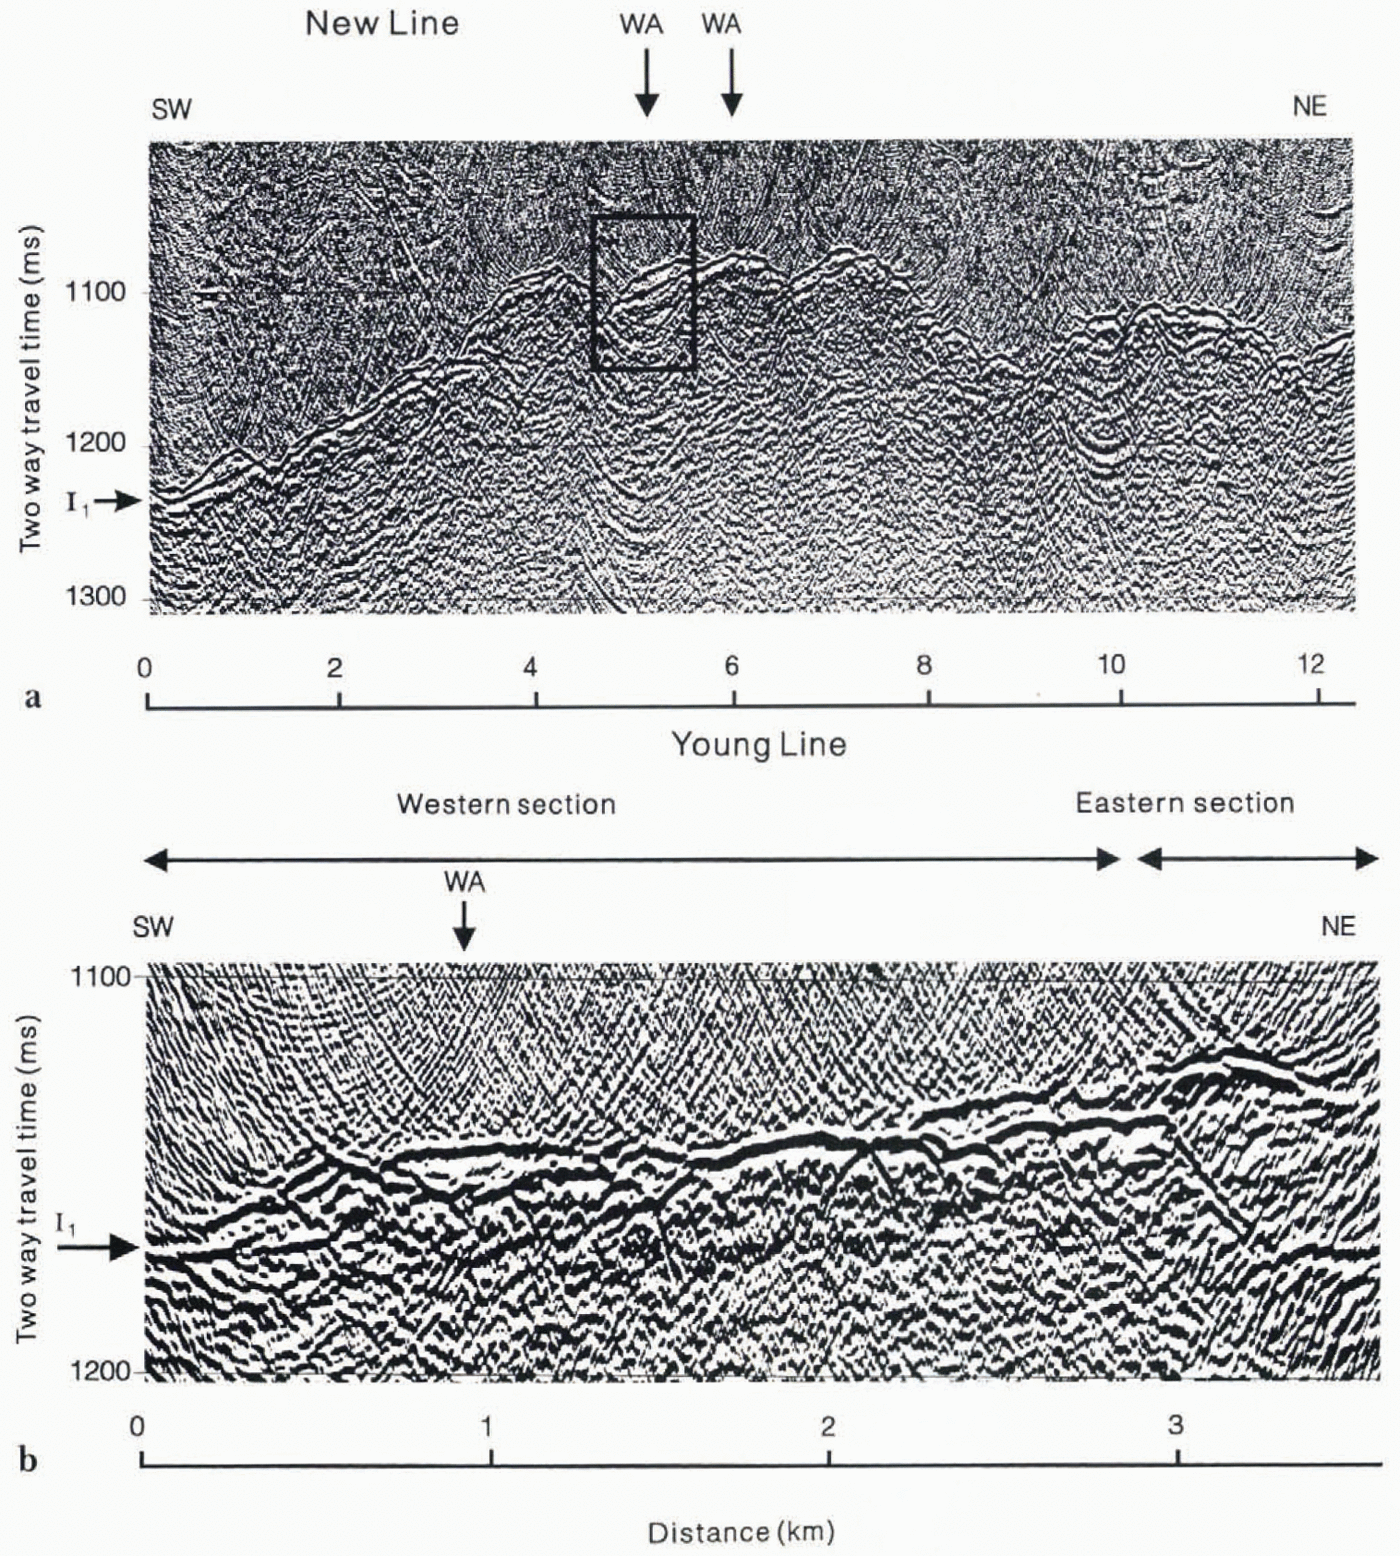
The two final processed seismic reflection sections are presented in Figure 4. The arrival labelled I1(after Reference Crary, Rabinson, Bennett and BoydCrary and others. 1962) is the reflection from the base of the ice. Along both lines, this reflection is usually easy to identify, indicatinga significant acoustic impedance contrast at the ice-bed interface. The acoustic impedance, Z. of a medium is defined as:
where ρ is its density and V is its seismic velocity If the acoustic impedance of the bed (Zb) is greater than that of the ice (Zi). the polarity of the resulting Iireflection will be normal. Conversely, if Zb, is less than Zithe resulting I1reflection will be reversed in polarity. The polarity ofthe ice bed reflections was determined by comparisons with direct waves and with reflections from ice-water interfaces, both of which can be predicted. The I1reflection for all of New Line and for most of young Line is normal polarity, for the eastern end of young Line, the I1reflection is reversed in polarity.Young Linchad been divided into western and eastern sections on this basis (Fig. 4b).
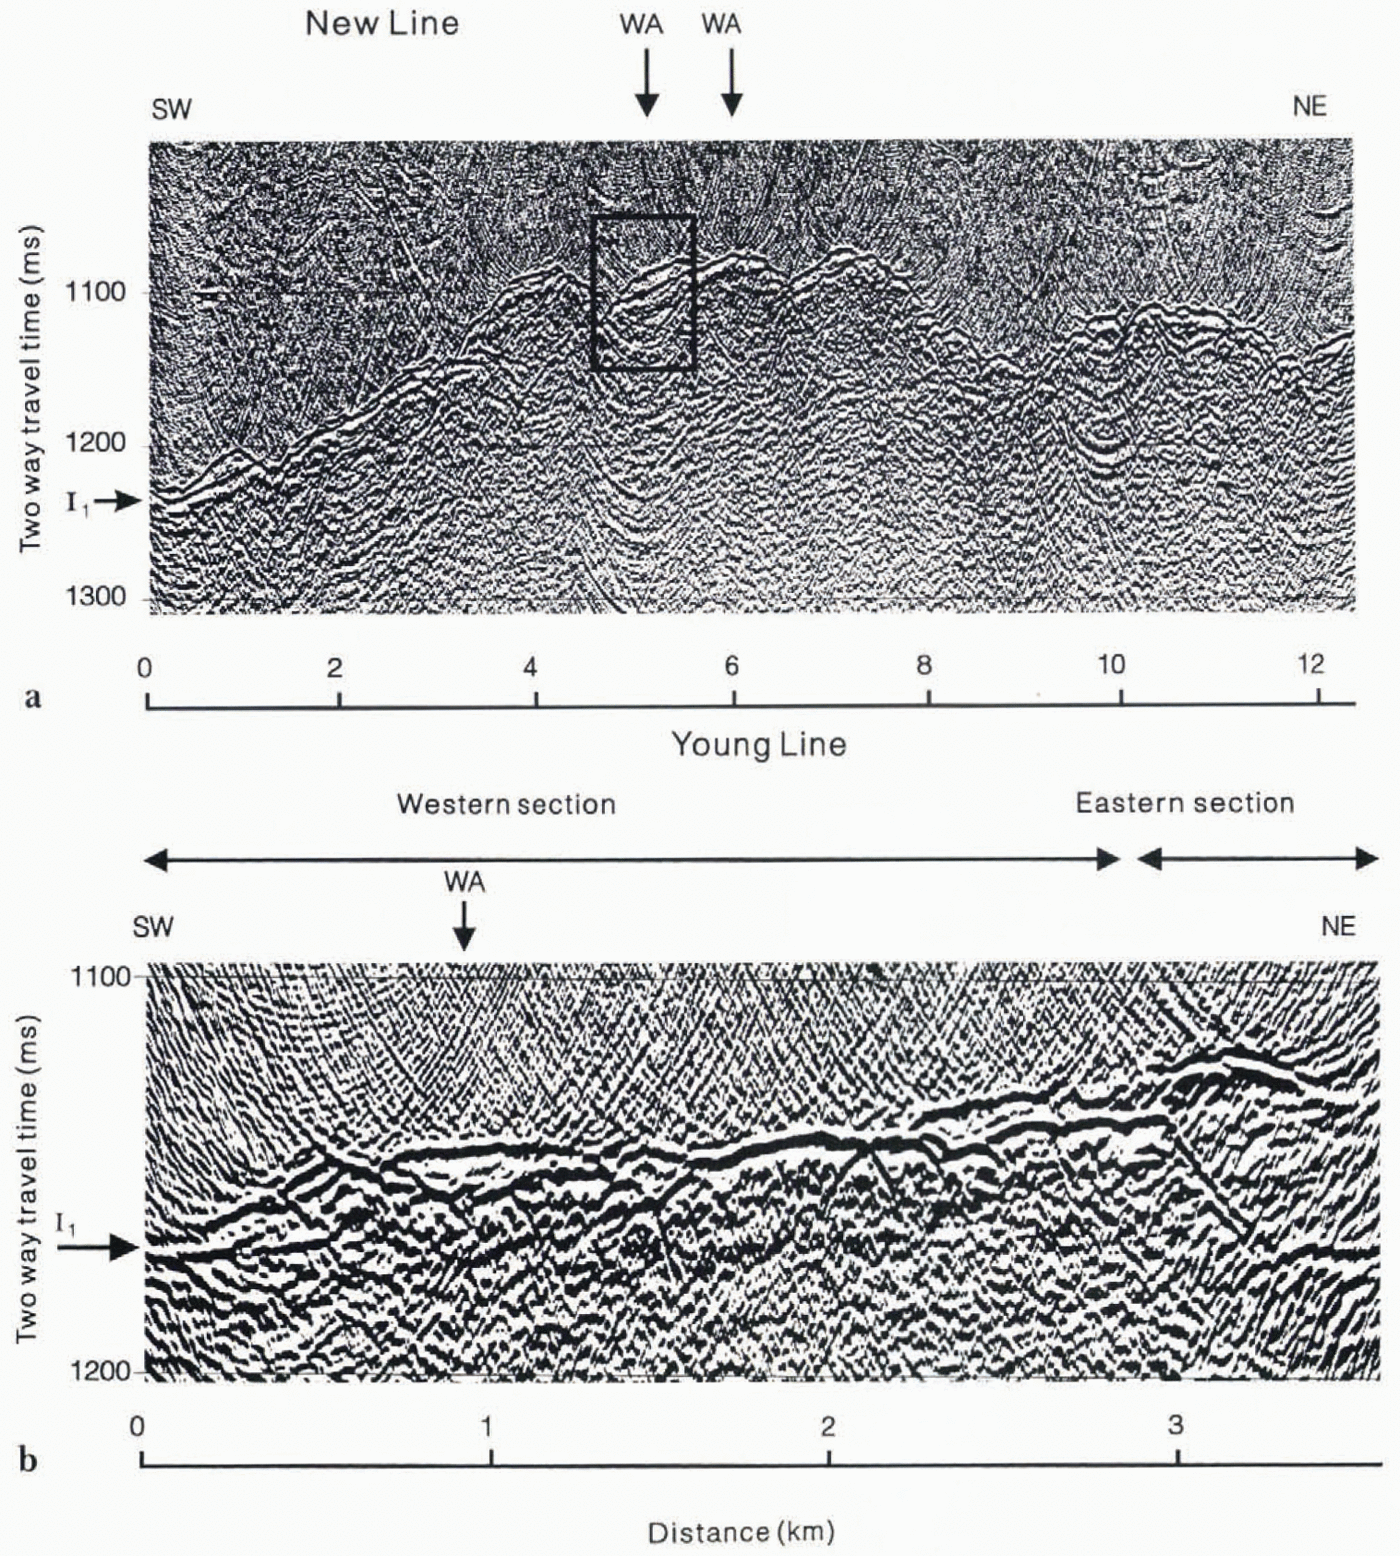
Fig. 4. Processed seismic reflection sections for (a) New Line and (b) yong Line, (Note the different horizontal and vertical scales.) I1is the ice-bed reflection. WA marks the positions of the wide-angle surreys. Box on New Line shows the section enlarged in Figure 5. The first part of a normal polarity reflection is white (unfilled); the first part of a reversed polarity reflation is black (filled).
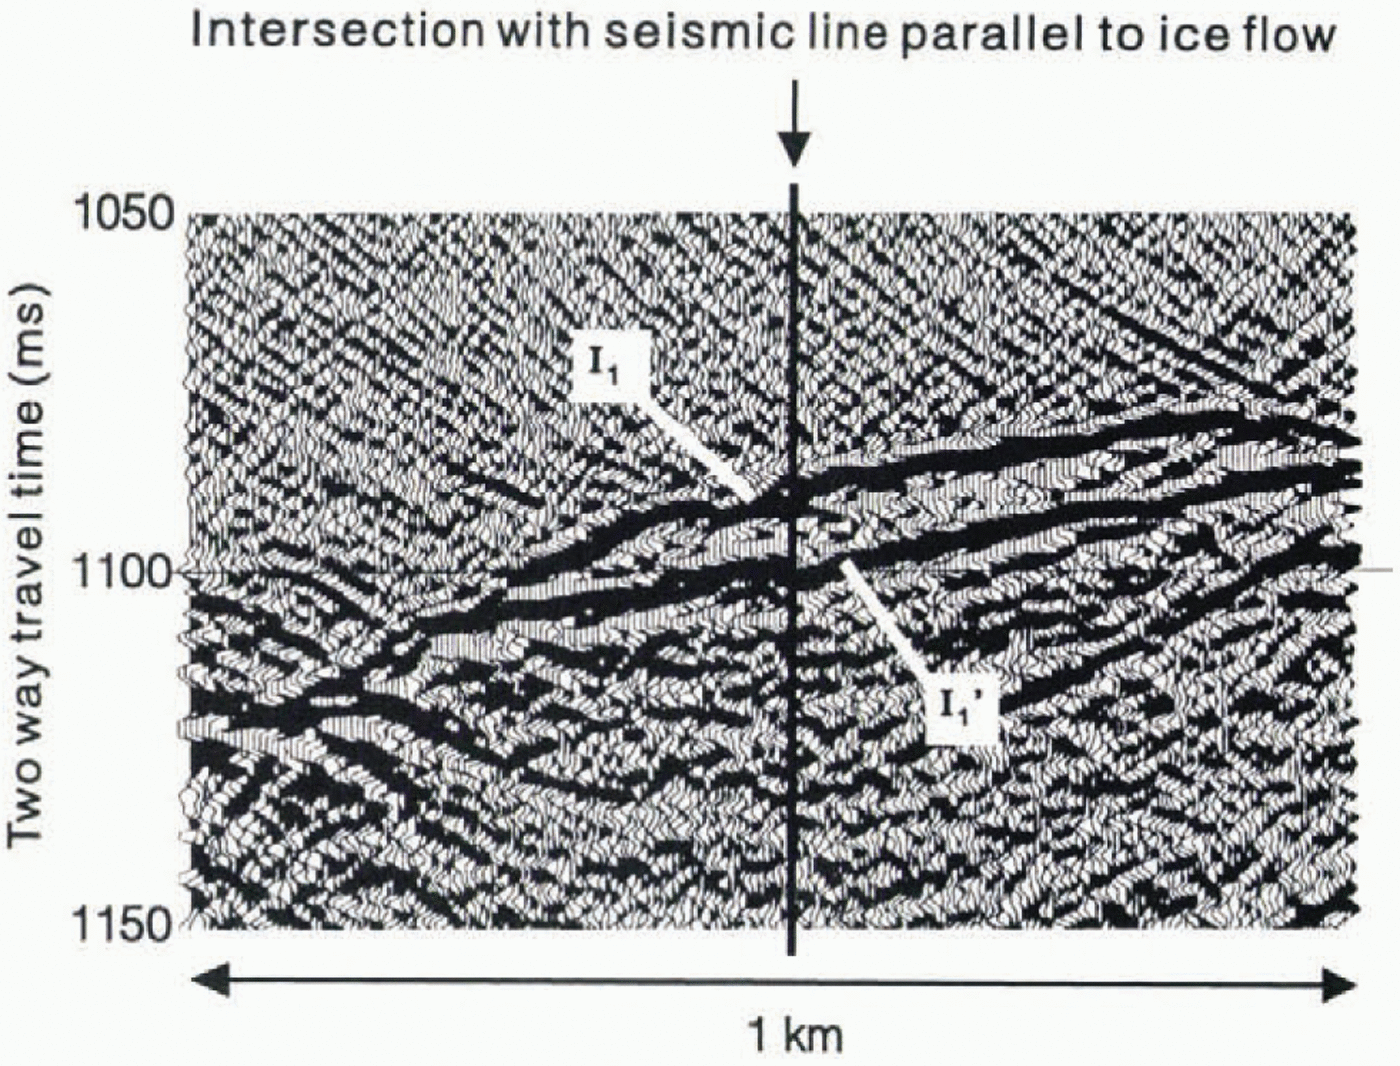
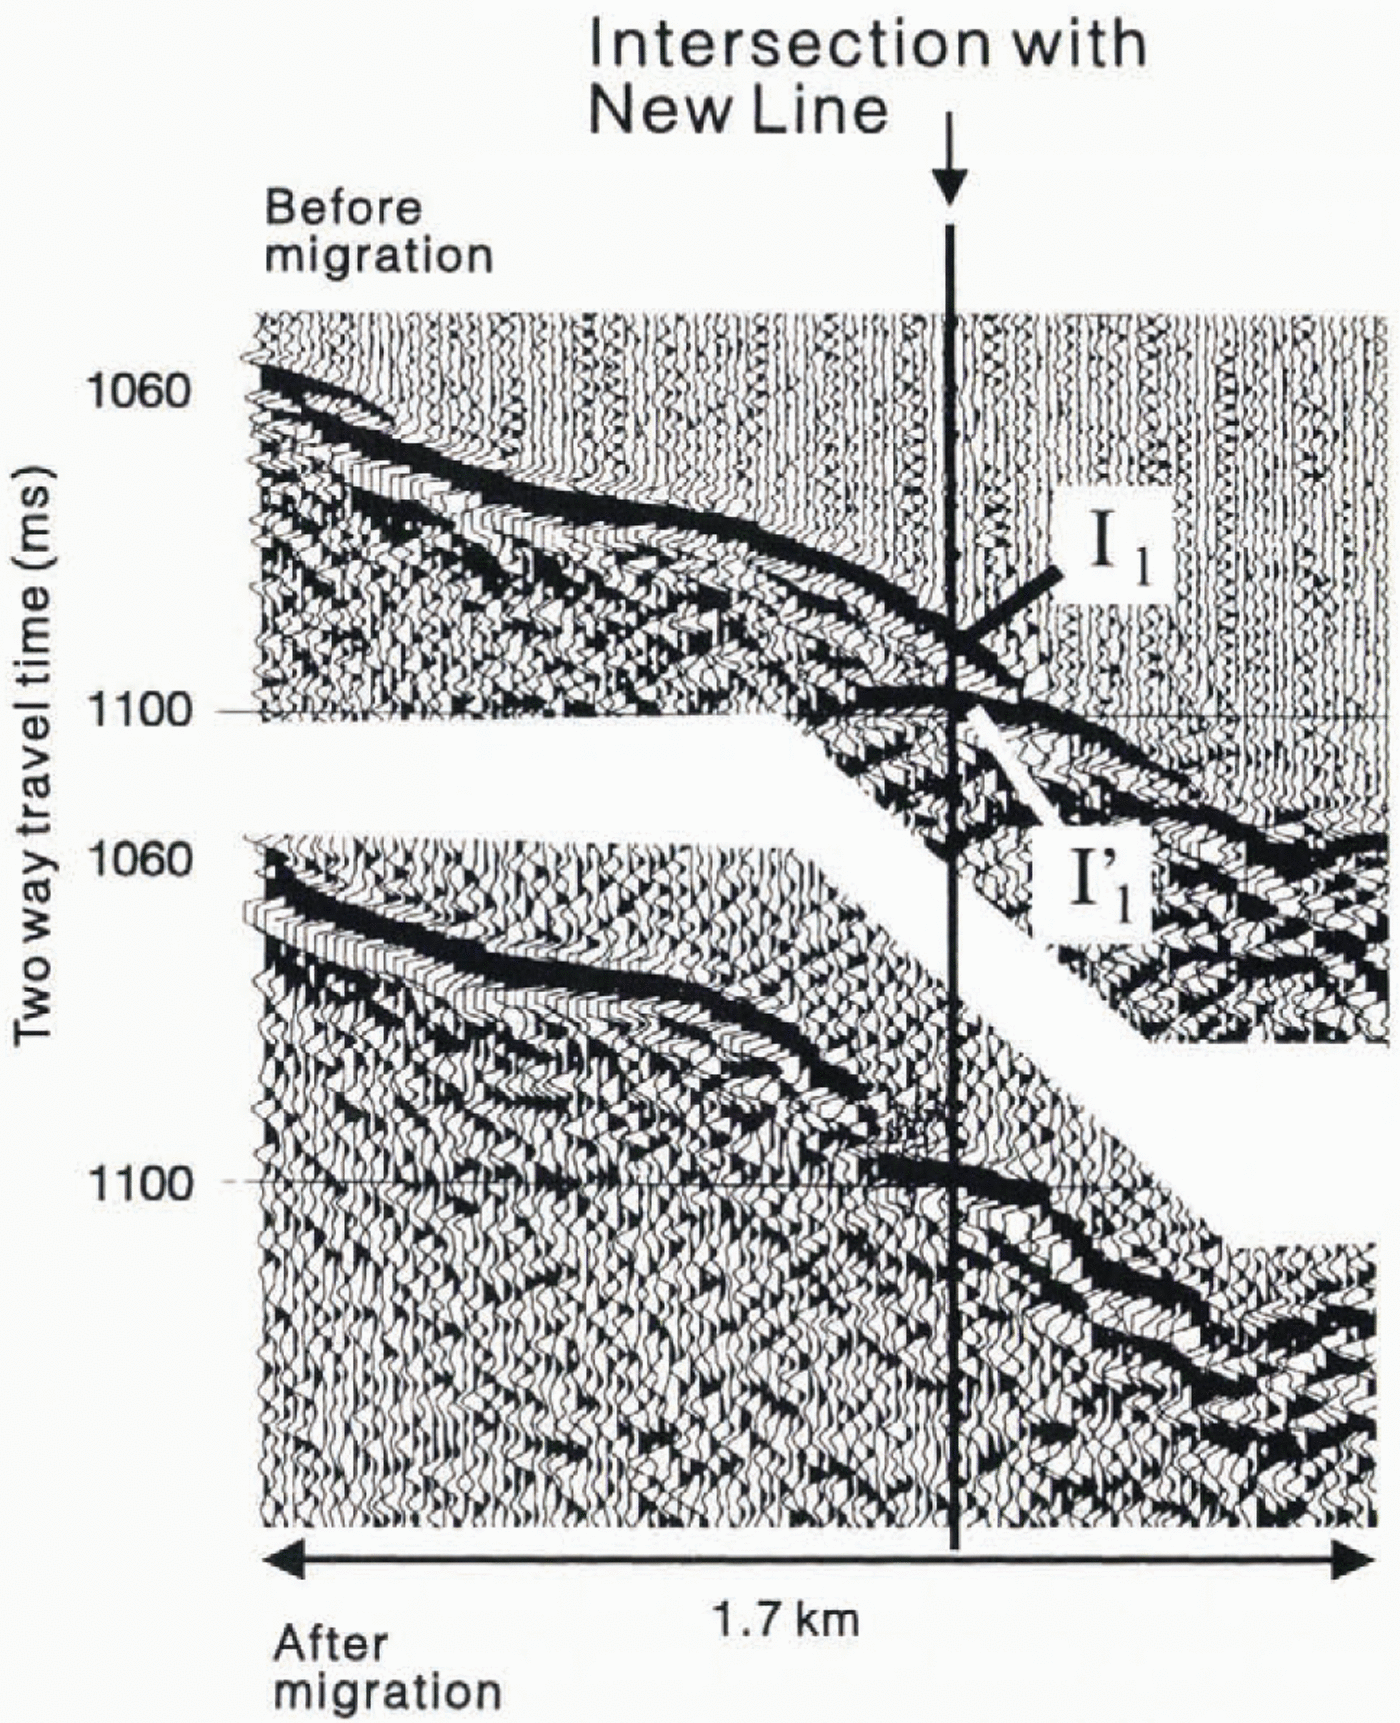
In a number of places along both New Line and young Line, the normal polarity I1reflection is followed after 10-20ms by another strong, normal polarity arrival (labelled I1in Figure 5). It is not obvious whether this later arrival is a reflection from within the bed or else a rellection from another part ofthe ice bed interface, of to one side of the reflection line. A short seismic reflection line was acquired, intersecting New Line and perpendicular to it (that is, parallel to the ice flow direction), The acquisition parameters for this additional line were slightly differeint to those for New and young lines, resulting in a poorer-quality section. However, study of the I1and I1′ reflections before and after migration (Fig. 6) shows that, at least at this point on New Line, both these arrivals come from the ice bed interface. One arrival (I1′) comes from the interface directly below the intersection of the two seismic lines, whereas the other (I1) comes from a sloping part of the interface, just downstream of the intersection. The similarity between these two arrivals at this point and where they occur elsewhere along New Line suggests that they usually represent two reflections from the ice-bed interface.
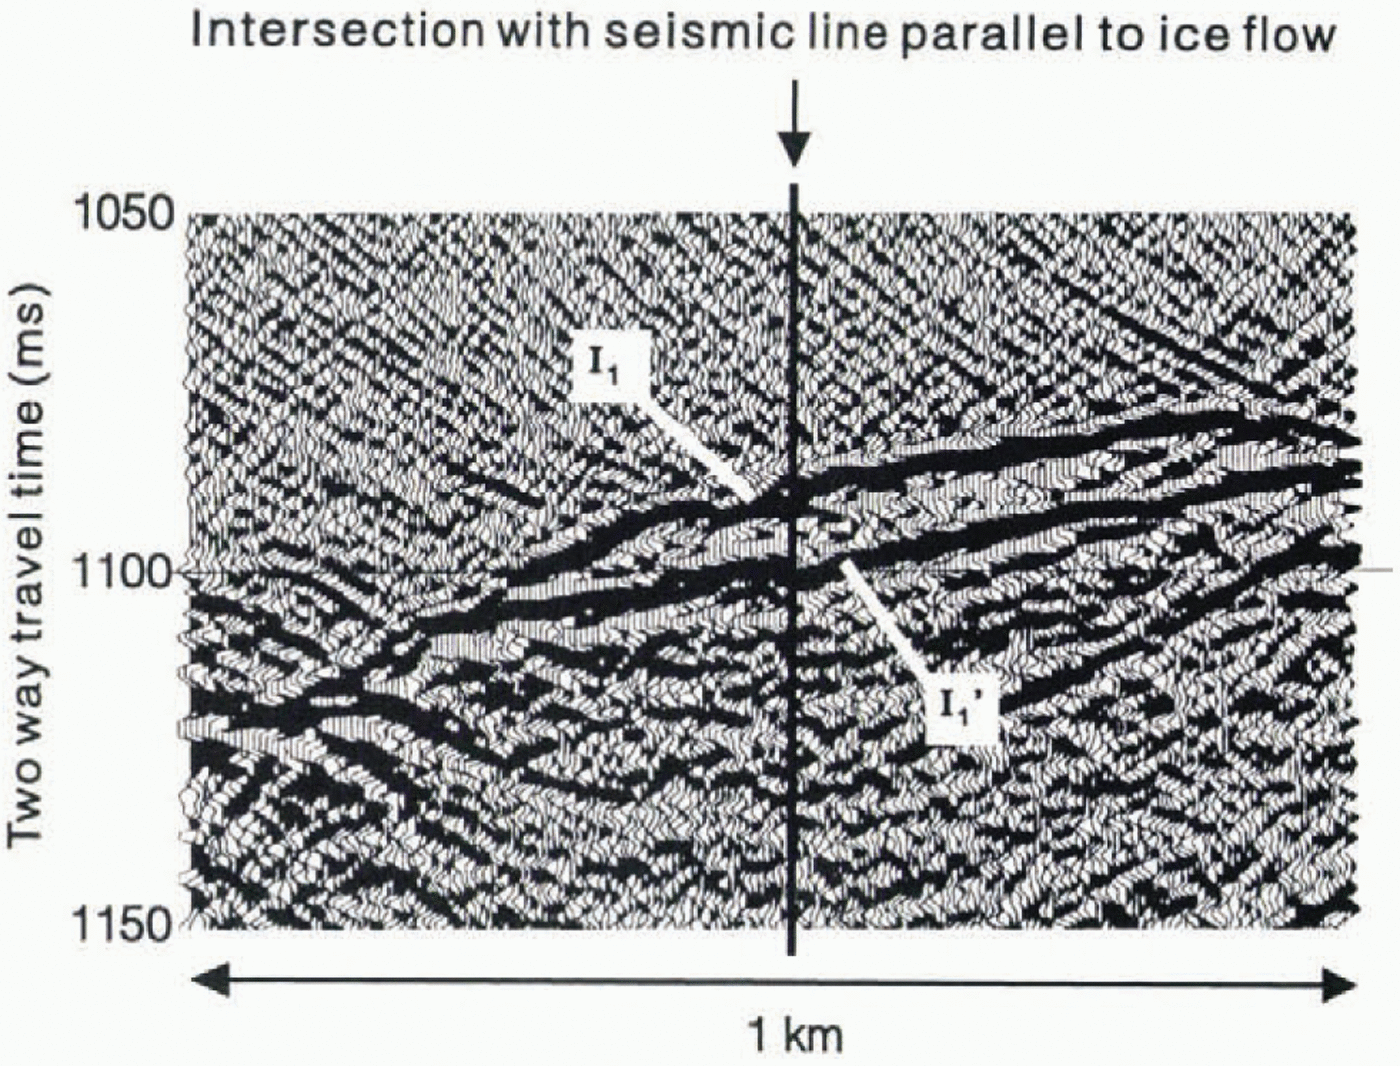
Fig. 5. Enlarged section of ice bed reflection on New Line, where it intersects with the seismic reflection line parallel to ice flow. I1is the earlier reflection: I1’ is the later one.
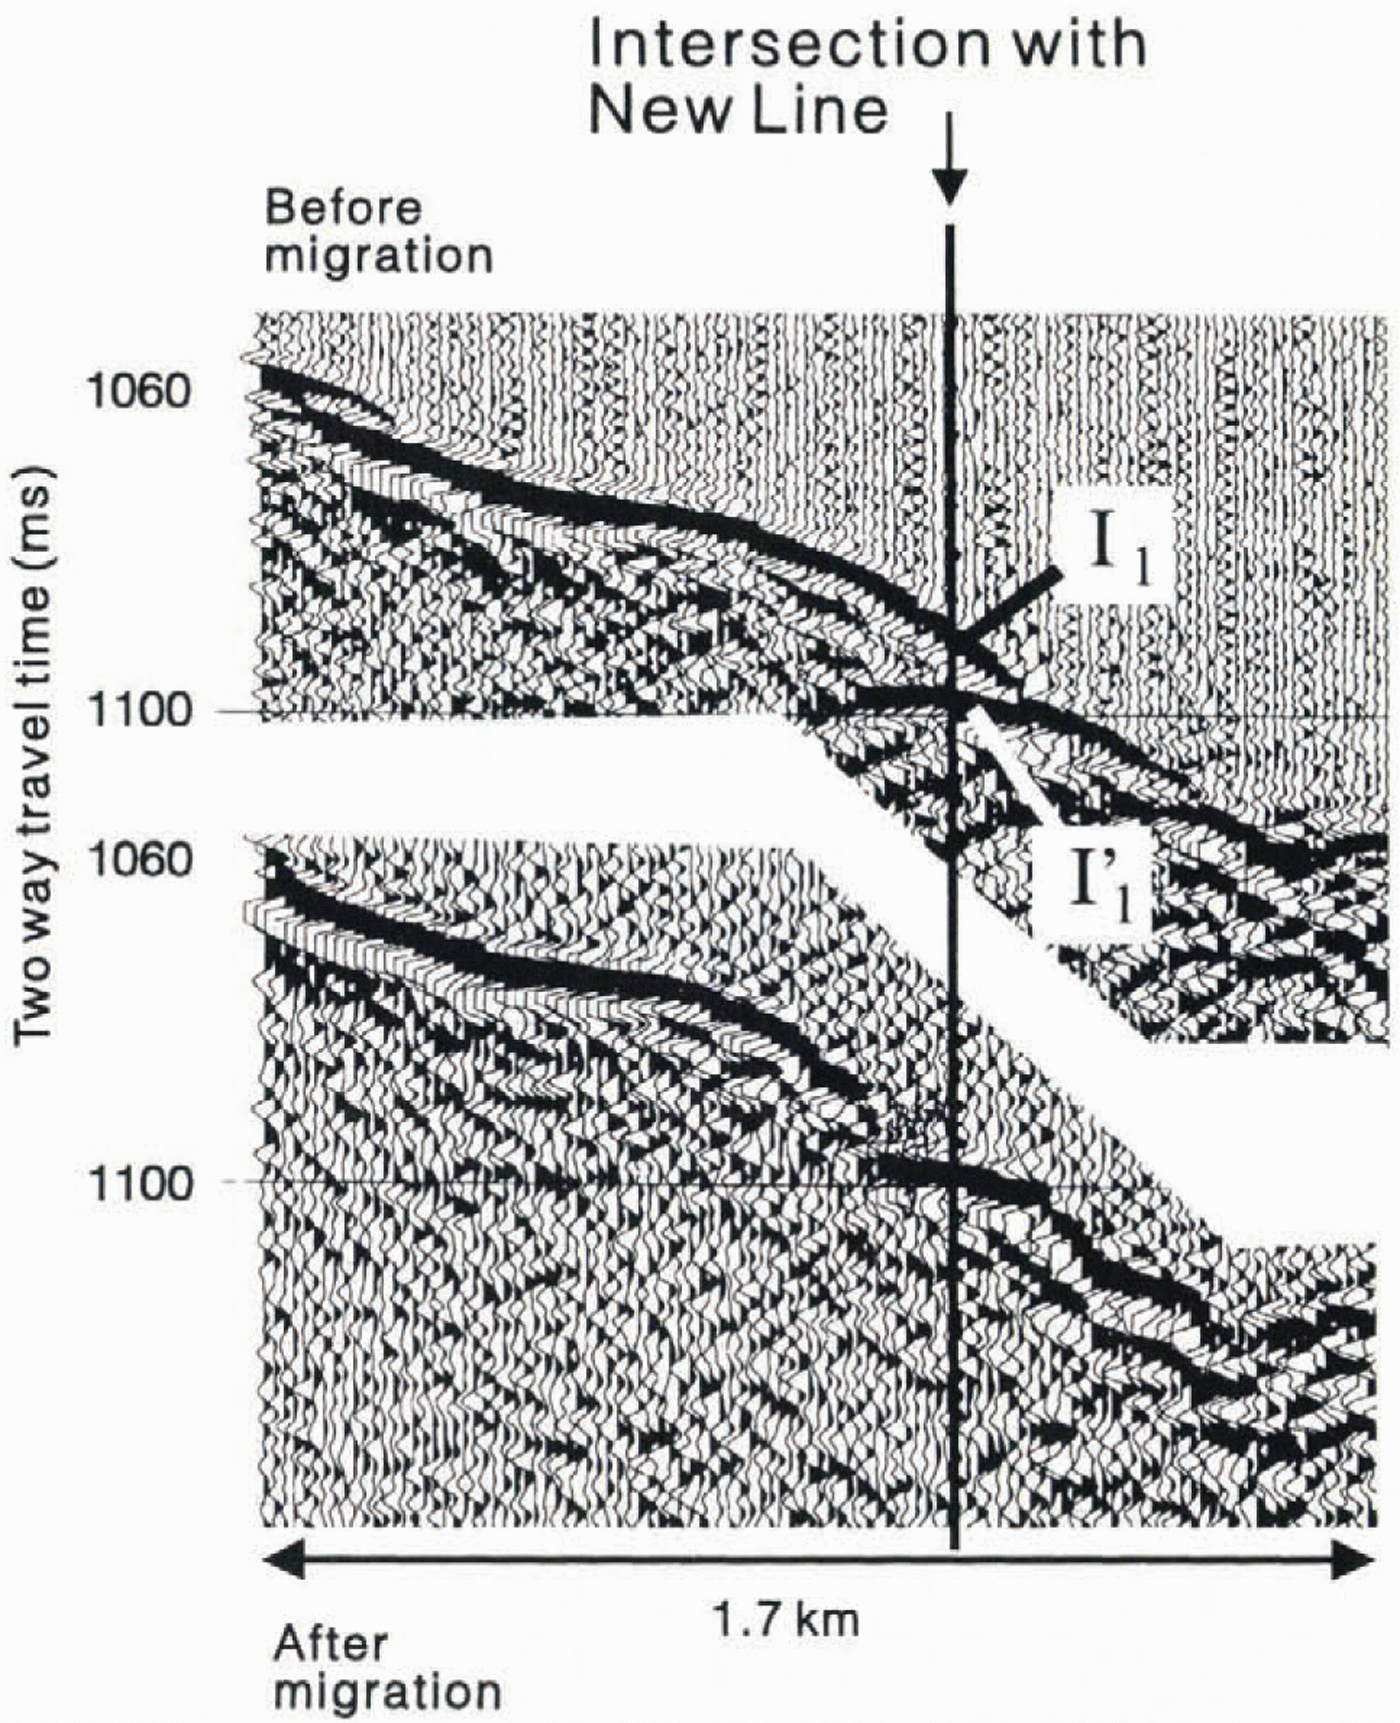
Fig. 6. Part of the seismic reflection section, parallel to ice flow which intersects. New Line. Upper section is before migration; lower section is afterwards. Ice flow is from right to left.
There are strong similarities between this pattern of two arrivals (I1and I1′) on New Line and a similar pattern in places and young Line (below WA in Figure 4b. for example). This might be taken to suggest that, on Young Line too, both the arrivals come from the ice-bed interface. However. young Line is much closer to Tyree Line (12 km away) than to New Line (40 km), and a reflection survey perpendicular to Tyree Line (see Reference SmithSmith, 1996. Fig. 3b) showed a very smooth, level bed. very different to that in Figure 6. Hence, although it is likely that the I1′ reflections on Young Line do come from the ice-bed interface, this conclusion cannot yet be proved.
In the following analysis the I1reflections are studied in detail. The I1′ reflection has not been used in the analysis because of possible corruption by energy immediately following I1. Even where the I1′ arrival is actually the one which is directly beneath the seismic line (as in Fig. 6). this is not considered to compromise the analysis, as the reflection points on the bed are close to each other and show reflections of similar strengths.
Ice thickness and bed elevation
Ice thickness was calculated using a seismic velocity determined in the following way. Reduction of the shallow-refraction seismic experiments, following the method ol Reference Kirchner, Bentley, Bentley and HayesKirchner and Bently (1990). gave a mean seismic velocity of 2839 ms−1for the snow and firn in the upper 100 in of the ice column (Reference Smith and DoakeSmith and Doake, 1994) A mean seismic velocity for the rest of the ice column of 3841 m s−1was calculated Iruni Kohnert’s (1974 temperature velocity relationship. This calculation assumed a constant temperature in the upper half of the ice column (−27° C; Reference Jenkins and DoakeJenkins and Doake. 1991; personal communication from R. M Frolich. 1996), followed by a lineariucrease in temperature to the pressure-melting point (−1.5°C) at the base. The seismic velocity in the ice column is accurate to ±15−1; ice thicknesses are accurate to ±7 in. Surface elevation above sea level (based on the WGS72 geoid model) was determined by Doppler satellite surveying (accuracy ±5m) at selected locations, combined with standard optical survey techniques. Ice thickness on New Line ranges from 2335 m a1 the western end of the line to 2036m close to the middle. Bed elevation is lowest (−1839m) and highest (−1540m) at lhese two points, respectively (the equal surface elevation at diese two points is coincidental). The ice-bed interface of Young Line is smoother. Ice thickness is greatest (2190m) at the western end and least (2121m) close to the eastern end. Corresponding bed elevations at these points are −1880 and −1798 m, respectively.
Ice-Bed Interface Reflection and Acoustic Properties of the Bed
The seismic sections Iiir New Line and young Line (Fig. 4) can he used to calculate the strength of the reflection from the ice-bed interface (the reflection coefficient) and some of the acoustic properties of the bed material. The method Ior doing this is described in detail by Reference SmithSmith (1997)and is presented briefly here.
Reflection coefficient at the ice-bed interface
The energy E1of an ice bed interface reflection I1; (the energy of a wavelet being the sum of the squared amplitude values) is given by (Reference RoethlisbergerRoethlisberger 1972):

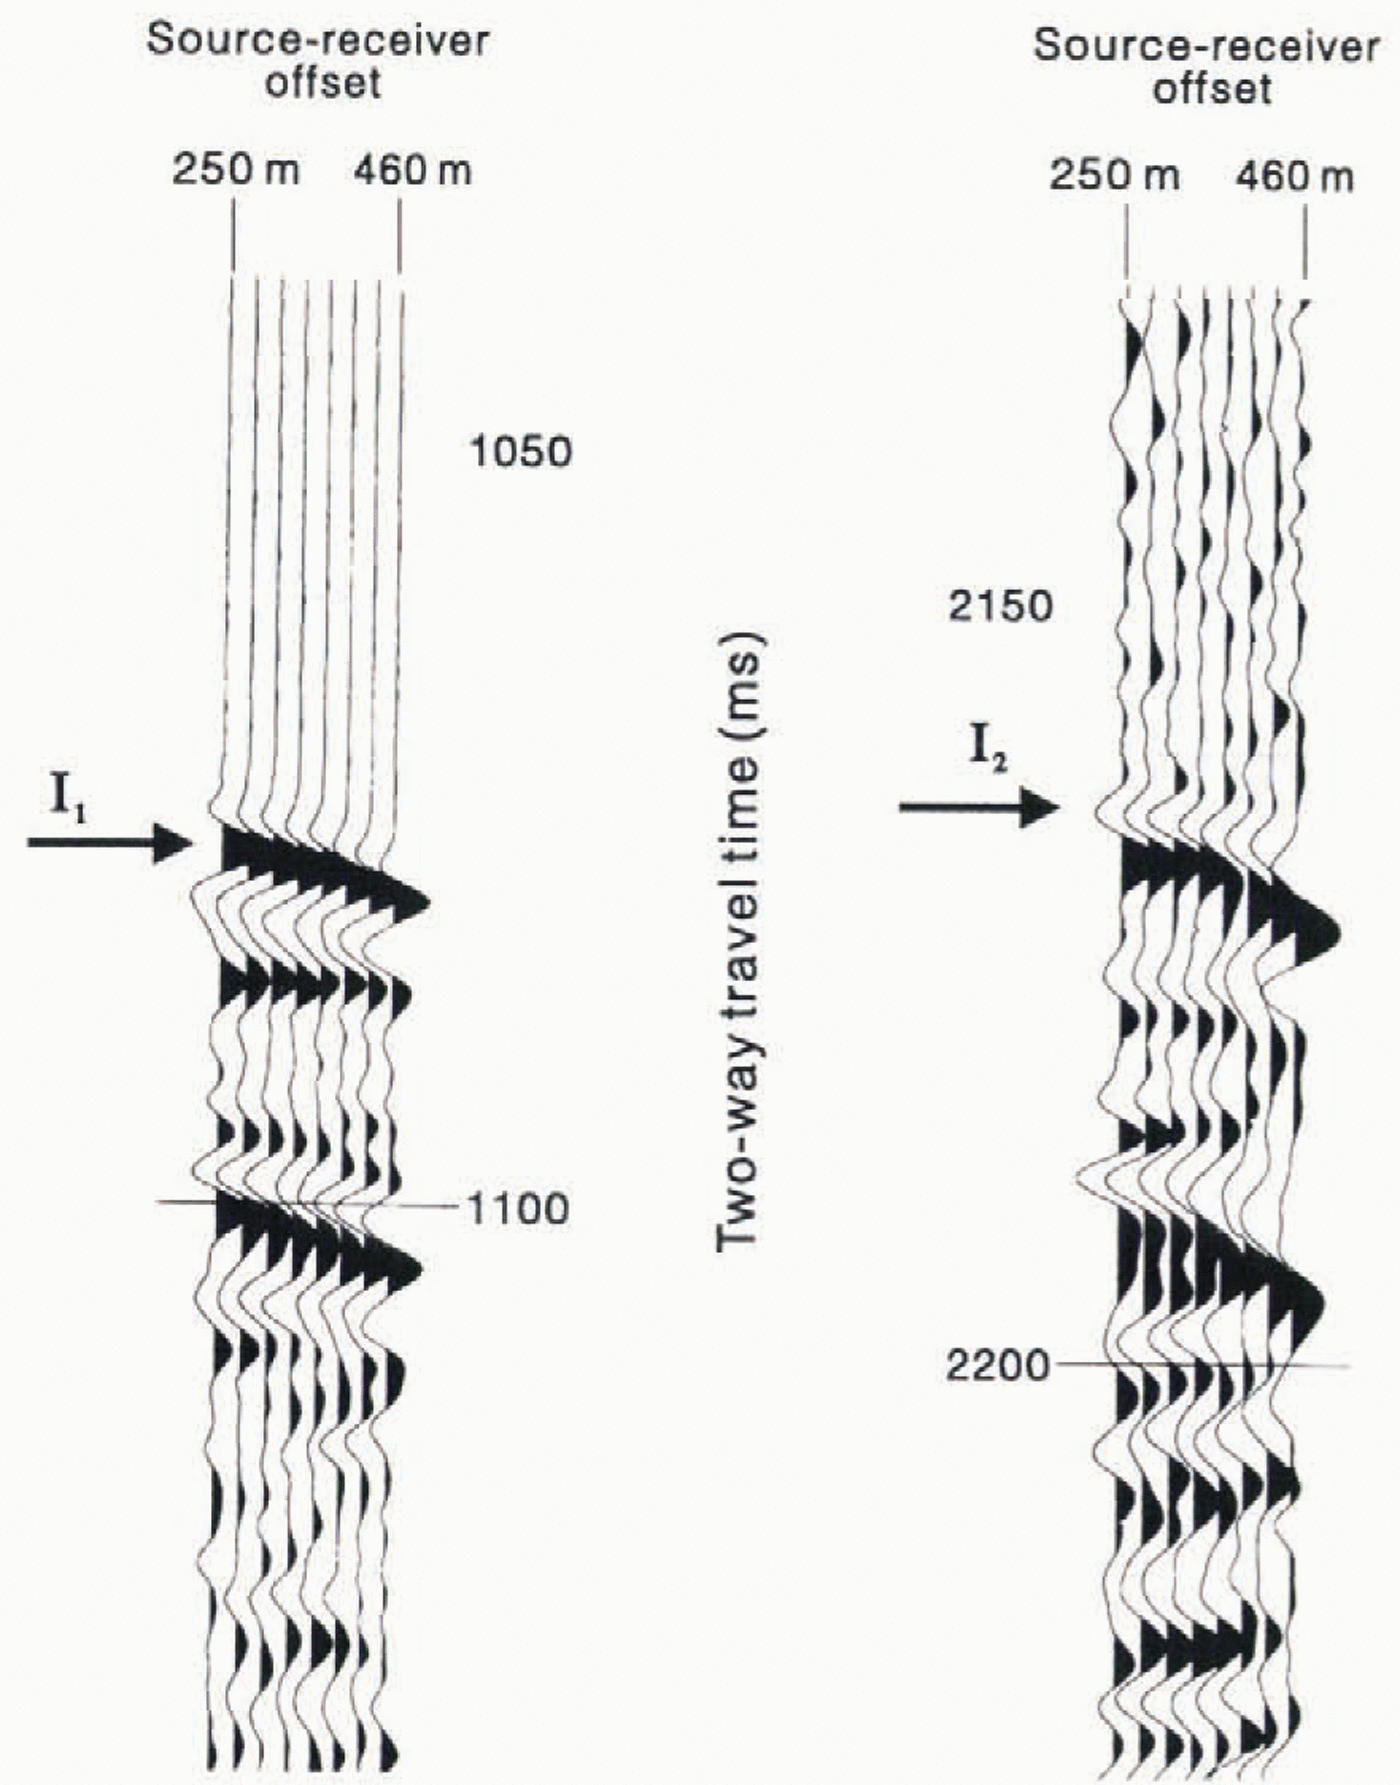
where E0is the initial energy of the seismic wavelet at the source. R is the reflection coefficient at the ice bed interface, ice thickness is h. and nais the attenuation within the ice. Record lengths Iiir the wide-angle surveys were sufficient to record the first ice multiple reflection (I2Figs 3 and 7). Assuming that the reflection coefficient at the snow air interface is −1, Equation 2can be used to give the change in energy between the I1and I2reflections (Reference RoethlisbergerRoethlisberger, 1972):

where E2is the wavelet energy of the I2. reflection. Wavelet amplitudes (and hence, energies) on the wide-angle data were measured by identifying the high-amplitude central lobe and the adjacent lobe on each side. Zero-crossings at the start and end of these three lobes were used to delineate the wavelet.
Reference SmithSmith (1997)presented a compilation of attenuation data from a number of.sites. Attenualion is related to the ice temperature. Estimating the mean ice-column temperature on Rutford Icc Stream to be −20°C suggests that Ote correct attenuation value there is 0.21 x 10⁻³m−1(see Reference SmithSmith, 1997. Table 1) . An error in the estimated mean ice temperature (it could be warmer than −20°C but is unlikely to be colder) would lead to an underestimate of t he attenuation value. However, a mean ice-column temperature up to 5°C wanner than that estimated (the error is unlikely to be greater than this) would lead to the magnitude of the calculated reflection coefficients being mo low by less than 10%. Reference SmithSmith (1997)also show cd that, even with unrealistically high and low attentuation estimates, the interpretation of reflection coefficients and derived acoustic impedance values remains unaffected.
Table 1. Mean values of acoustic impedance in the different sections of the bed

Equation 3is strictly, only valid fora reflection perpendicular to a plane interface, so only data from geophones relatively close to the shots were used (maximum offset 460m), corresponding to a maximum incident angle of around 6° . At each wide-angle site two sites on New Line and one on Young Line; Fig. 4), E1/E2was measured from 16 separate seismic traces (8 traces from each of two shots), and a mean value calculated. Using Equation 3, mean values of R1were then calculated for each of the wide-angle sites. From these, R was determined, the sign being given by the observed polarity of the I1reflection.
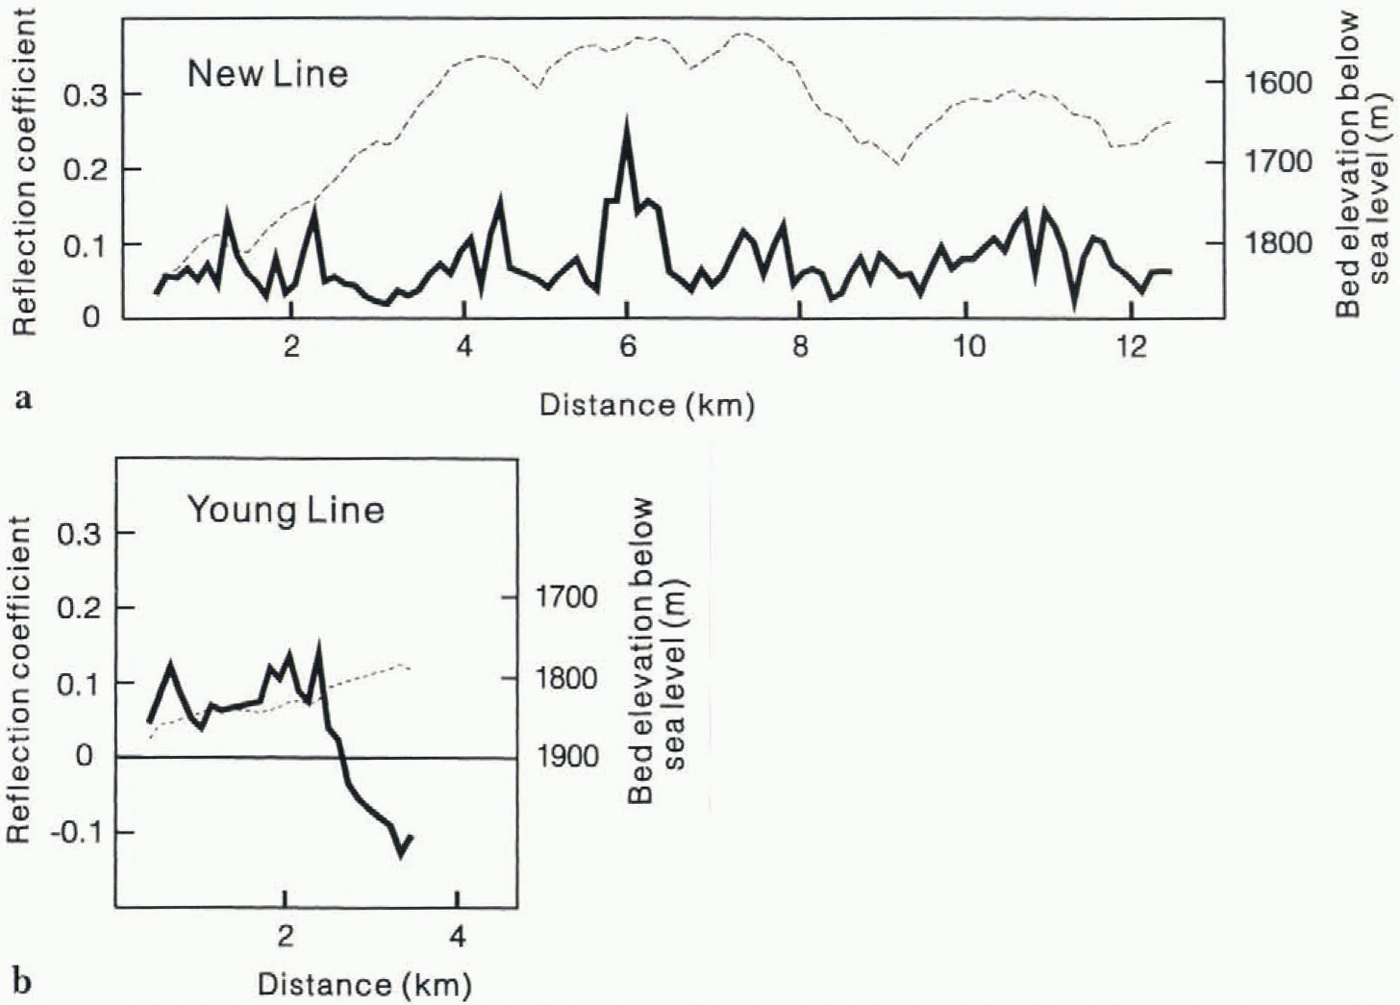
Knowing the reflection coefficient at the positions of the wide-angle sites, the way it changes along the reflection line can be calculated using the variation in reflection strengths along the line. Foreaeh shot on the seismic reflection lines, the I1, wavelet on all 24 channels was averaged and its energy (E1) measured. Knowing R at a wide-angle site allows a value of E0to be calculated from Equation 2, using a value for E1measured from the reflection line at that point. It is necessary to assume that the initial energy is the same !breach shot on the reflection line. Although this is unlikely to be strictly correct, as the coupling of the shots with the firn will have varied to some extent, it is reasonable to assume that, for the majority of shots, the initial energy imparted to the firn will be similar. The consistency of the strenght of both the I1reflection and the surface ghost (before it was removed) between adjacent shots supports this assumption. Rcan then be calculated for each shot on the seismic reflection lines. Clalculaled reflection coefficient values of the ice-bed interface along New Line and Young Line are given in Figure 8.

Fig. 8. Reflection coefficient (solid lines ) of the ice-bed interface along (a) New Line and (b) young line. Dashed lines are the bed elevation profiles.
An estimate of the accuracy oi the derived reflection coefficient values in Figure 8can he obtained from the two wide-angle sites on New lane. At each site, 16 traces were used to calculate the reflection coefficient, giving a total of 32 separate estimates of the reflection coefficient along the bed of New Line, from which a mean value was calculated. The resulting estimate of the rnss error in the reflection coefficients was ![]() . A similar error value was calculated for young Line, from 16 traces at the single wide-angle site.
. A similar error value was calculated for young Line, from 16 traces at the single wide-angle site.
Acoustic impedance of the bed: calculation and errors
The reflecion coefficient is relaled to the acoustic impedances of the ice and die bed (Ziand Zb. respectively) by:

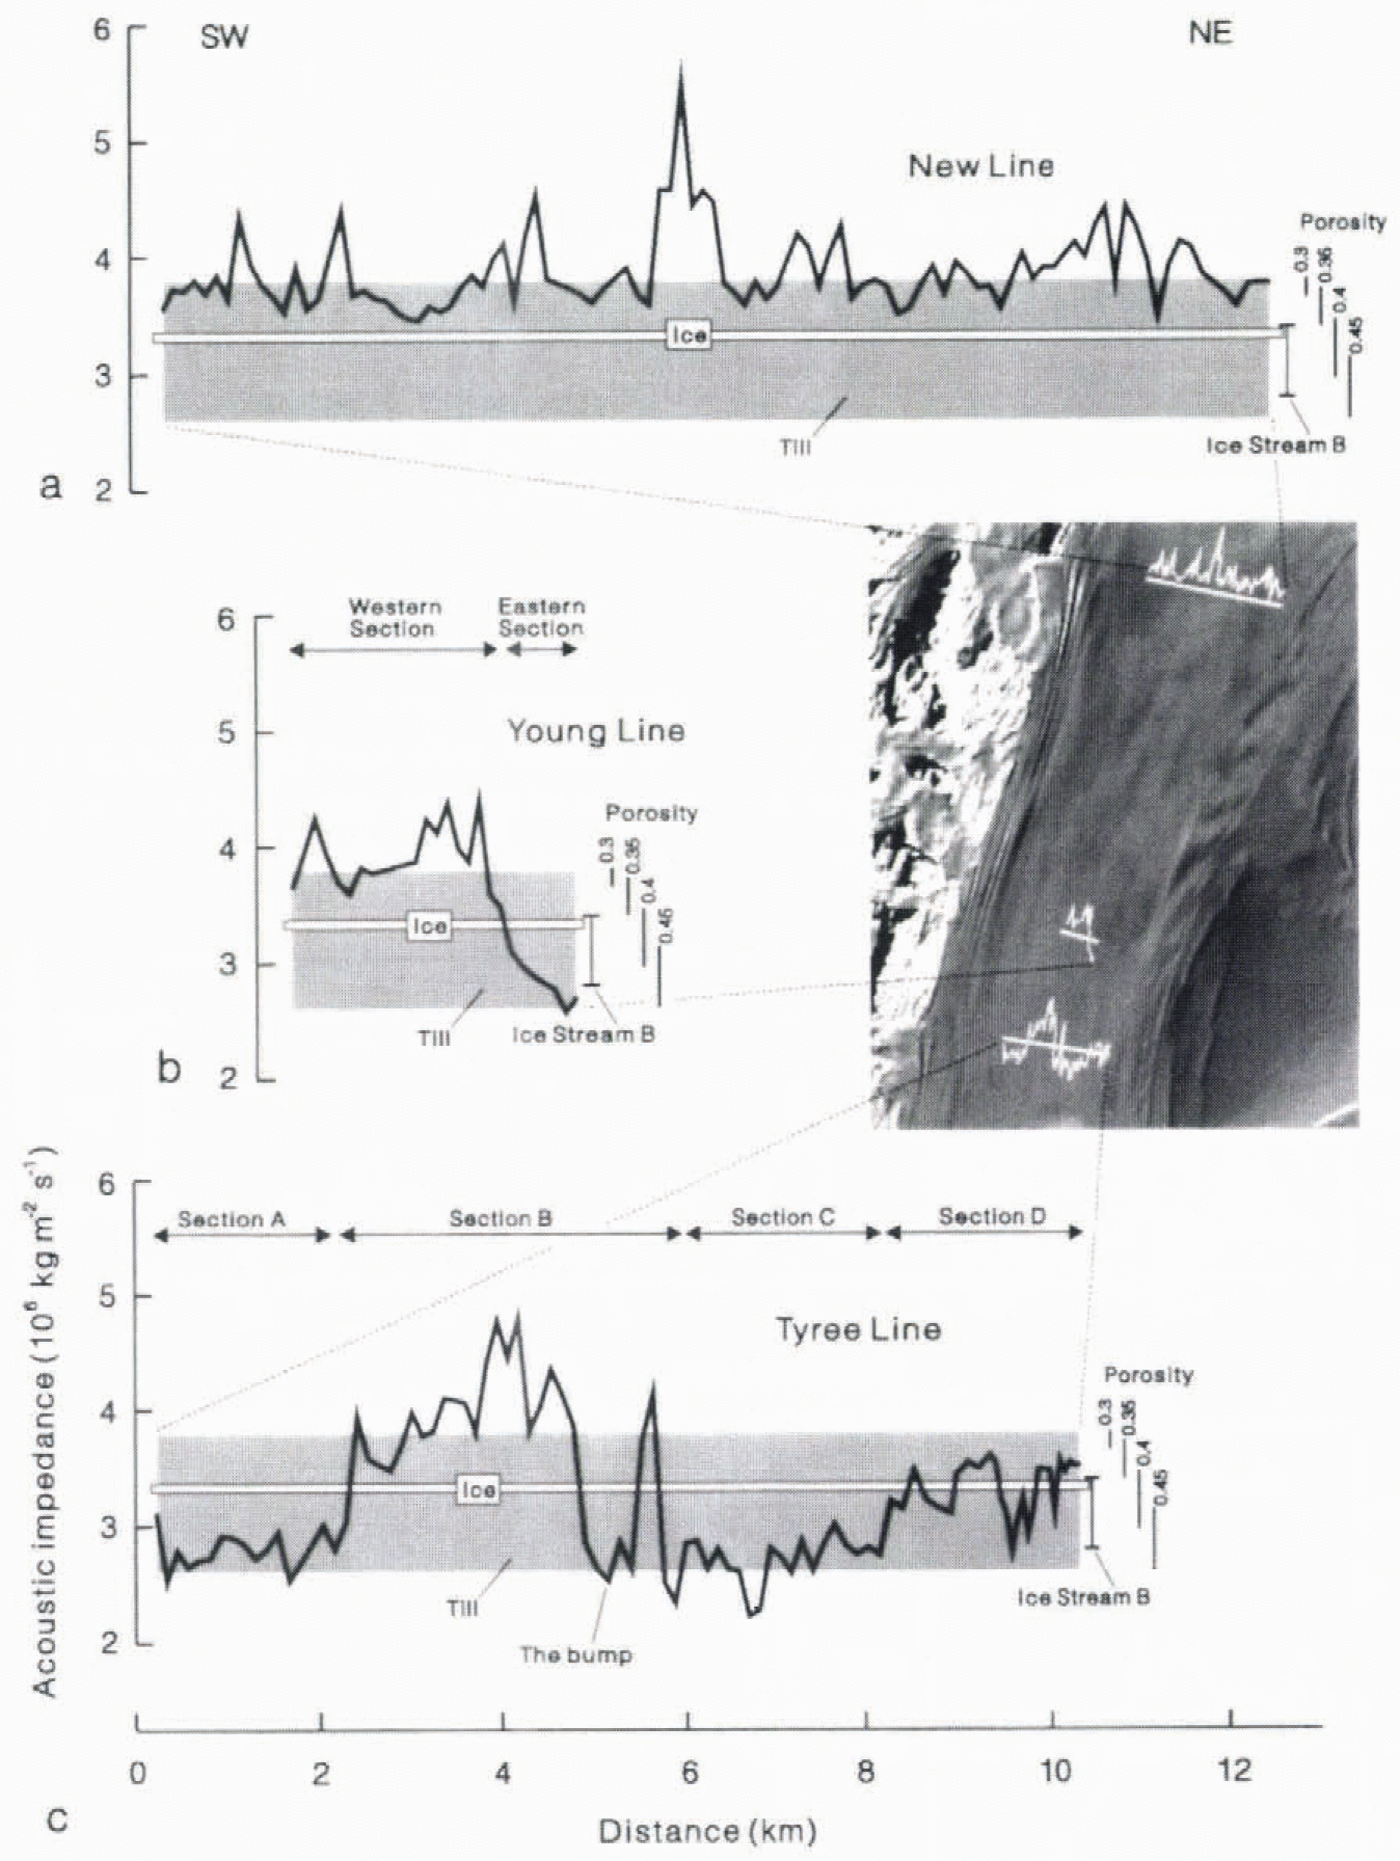
Using the reflection coefficient data presented in Figure 8, the acoustic impedance of the bed material. Zb, can be calculated from Equation(4) if the acoustic impedance in the iee Zib, is known. Reference Atre and BentleyAtre and Bentley (1993)discussed the estimation of Ziin some detail, with particular reference to the Stream B, concluding that a value of (3.33 ± 0.004) x 106kg ms−2s−1was the best estimate. Basal ice temperatures on Rutford Ice Stream and Ice Stream B are expected to be similar and the seismic reflections from the beds of the two ice streems were of similar frequencies (200-300 Hz; Atrc and Bentley, 1993). so Atre and Bentley’s value for the acoustic impedance in the ice,Zi, is used here. Ii is expected to vary little laterally (Reference Atre and BentleyAtre and Bentley 1993). The acoustic impedance of the bed along New Line and Young Line can thus be calculated (Fig. 9a and b.) The resulting values are similar to those which are typical of soft, water-saturated sediments.
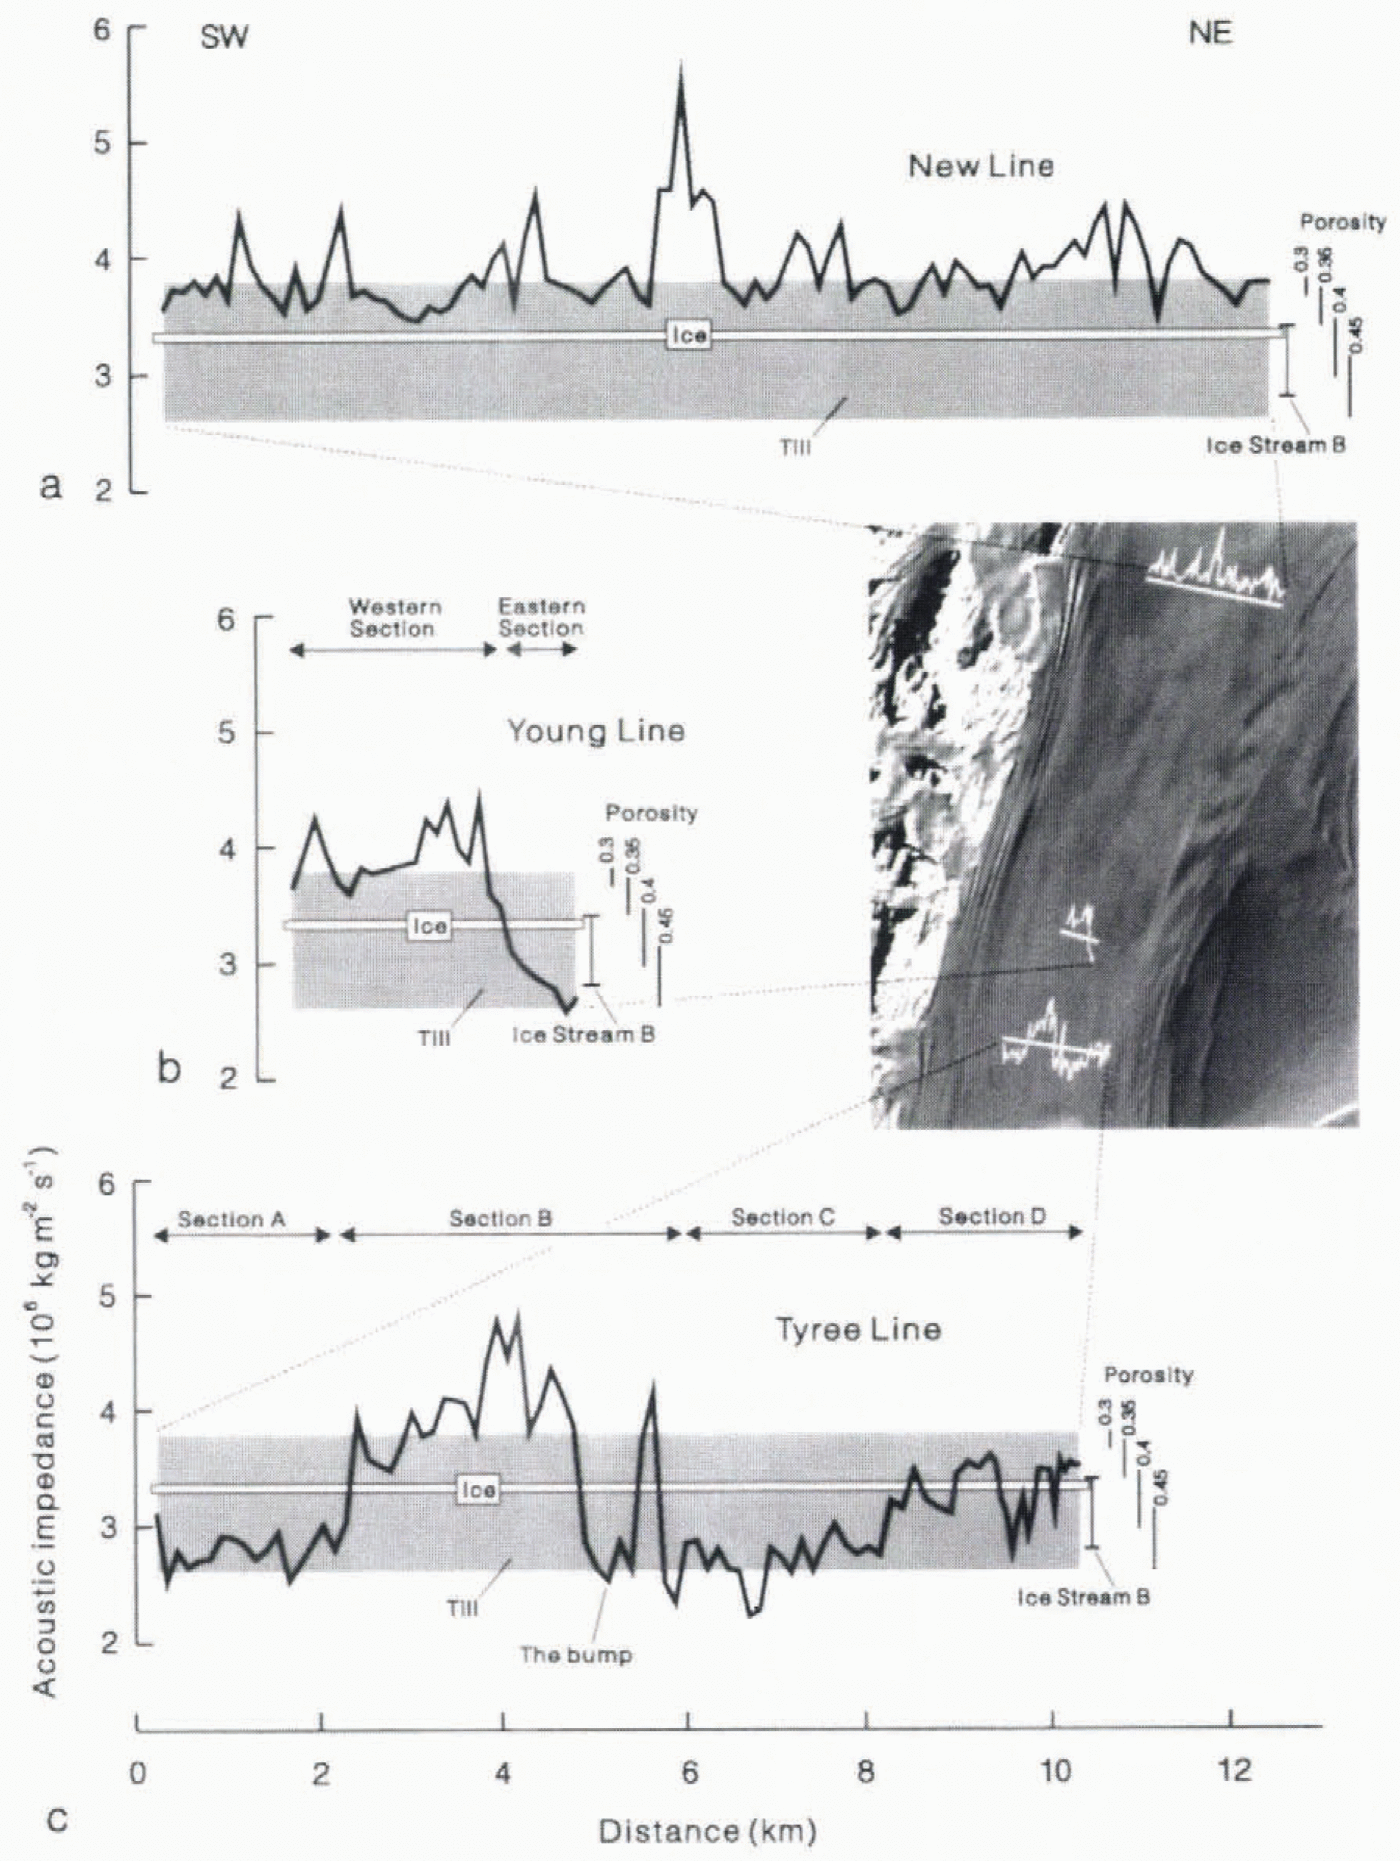
Fig. 9. Acoustic impedance of the bed along (a). New Line, (b) young Line and (e)Tyree Line (modifiedfrom Reference SmithSmith, 1997). The bands labelled “Till” (shaded) and “Ice” (white) and the ranges of porosity values are taken from Reference Atre and BentleyAtre and Bentley (1993). vertical bar shows the acoustic impedance of the bed at one site on Ice Stream B (Reference Blankenship, Bentley, Ronney and AlleyBlankenship and others. 1987b). The satellite image with the line positions and corresponding acoustic impedance plots is the same as that presented in Figure 2 but has been rotated 90° clockwise.
The main sources of error in ihe Calculated acoustic impedance values are the likely errors in lhe reflection coefficient and the assumed seismic velocities within the ice. These combine to give an rms error in the acoustic impedance of the bed of ![]() (where Zb, > Zi), though the error ran occasionally be more than this where the magnitude of the reflection coefficient is high. The calculated reflection coefficients may also include an unknown systematic error resulting Iroin an underestimate ol the attenuation value within the ice. This is unlikely to be greater than 10% and. as it would lead to the magnitude of reflection coefficients being underestimated, would imply that bed acoustic impedance values differ from those in the ice by even greater amounts than are shown in Figure 9. This means that the interpretation which follows is valid even where the rms error is high and even if there is an unknown systematic error arising from the estimated attenuation value.The overall conclusions arising from the interpretation can therefore be treated with confidence.
(where Zb, > Zi), though the error ran occasionally be more than this where the magnitude of the reflection coefficient is high. The calculated reflection coefficients may also include an unknown systematic error resulting Iroin an underestimate ol the attenuation value within the ice. This is unlikely to be greater than 10% and. as it would lead to the magnitude of reflection coefficients being underestimated, would imply that bed acoustic impedance values differ from those in the ice by even greater amounts than are shown in Figure 9. This means that the interpretation which follows is valid even where the rms error is high and even if there is an unknown systematic error arising from the estimated attenuation value.The overall conclusions arising from the interpretation can therefore be treated with confidence.
Interpretation of the Acoustic Impedance Data
Relationship between acoustic impedance and sediment porosity
Figure 9also includes likely acoustic impedance values for ice and for water-saturated till. The range of values for till has been taken from data compiled by Reference Atre and BentleyAtre and Bentley (1993)and includes both deforming and non-deforming (lodged) till. Reference Atre and BentleyAtre and Bentley (1993)show how the acoustic impedance of likely till material varies for porosity values between 0.3 and 0.45 (see Reference Atre and BentleyAtre and Bentley. 1993. Fig. 12) This range of porosities is expected to be particularly relevant to subglacia] sediments. Lodged basal till has a porosity of ≤0.3, whereas shear deformation of saturated sediments causes dilation and an increase in porosity to around 0.4 (Boulion and Dent, 1974: Boulion and others. 1974; Boullon and Paul. 1976). Porosiiy can thus be used to distinguish between deforming and lodged subglacial till (e.g. Reference Alley, Blankensee, Bentley and RooneyAlley and others, 1986. Reference Alley, Blankenship, Bentley and Rooney1987). Corresponding porosity ranges, taken from Reference Atre and BentleyAtre and Bentley (1993), are included in Figure 9. Reference SmithSmith (1997)proposed that subglacial sediment porosity can be estimated from acoustic impedance. Although this is not a well-constrained relationship it is good enough to distinguish between porosity values of 0.3 and 0.4. Hence, the acoustic impedance can be used to distinguish between lodged till and till which is dilated and deforming.
New Line
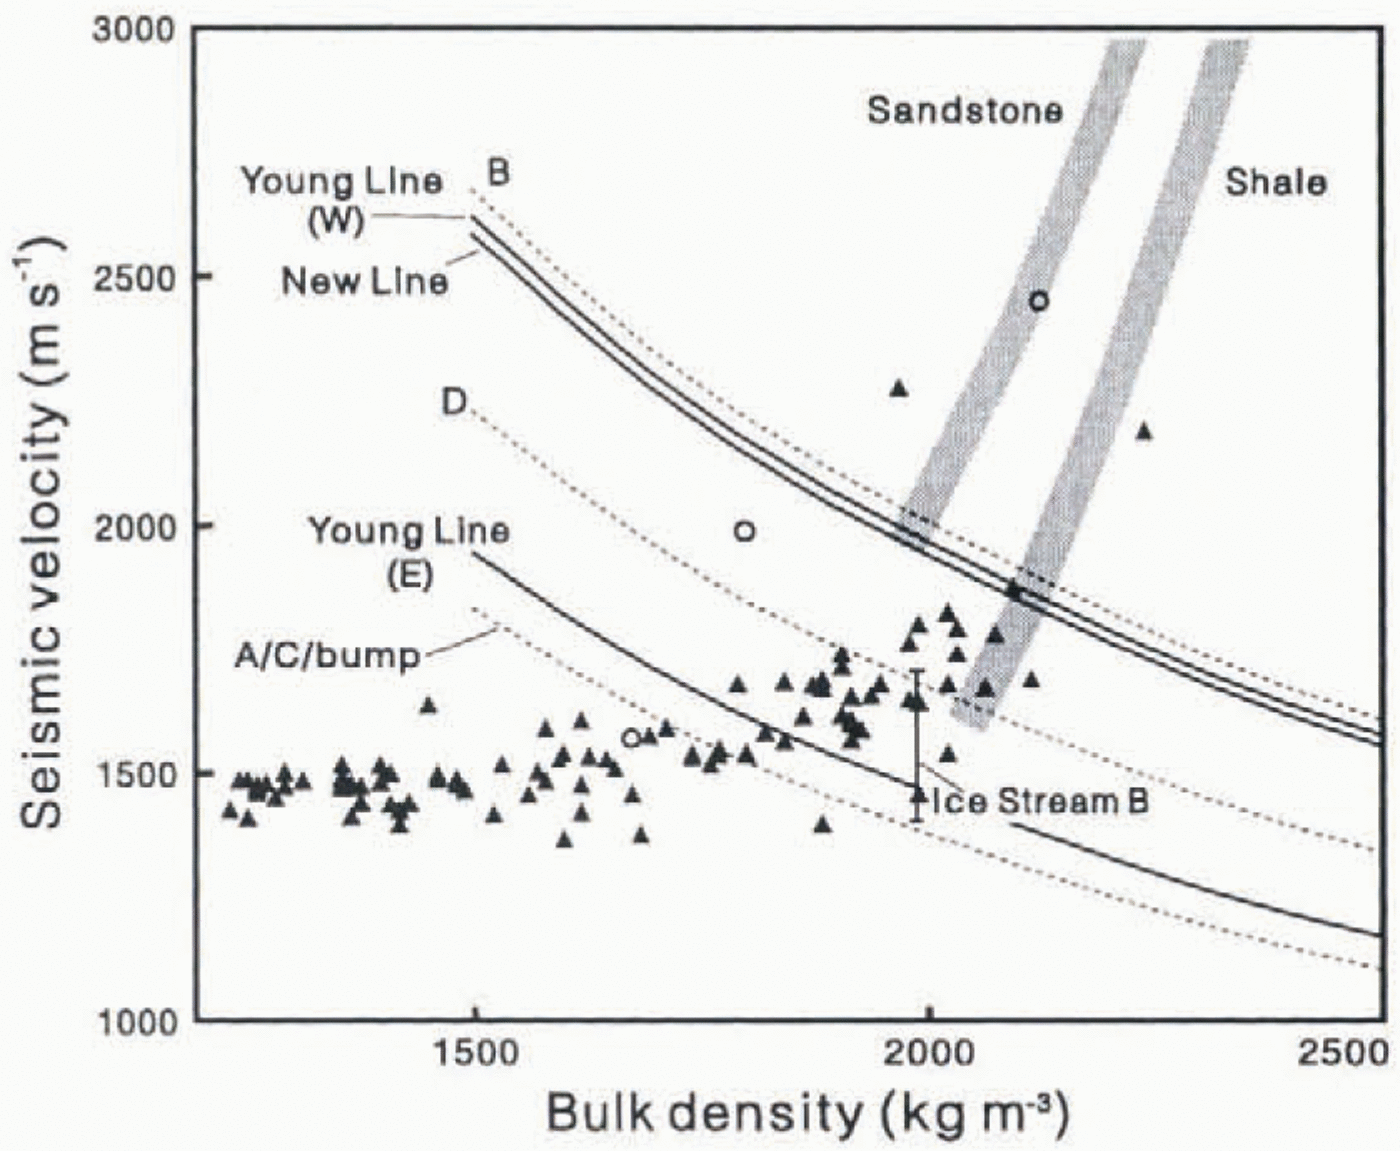
The acoustic impedance of the bed along New Fine (Fig. 9a) is always greater than that of the ice and is mostly greater than or close to the top of the range for till. Implied porosily is mostly 0.3 or less. Il is therefore unlikely that this malerial is deforming to any significant degree. Ice-stream Ilow may be influenced more by basal sliding than by subglacial deformation at this site. Figure 10’(modified from Reference SmithSmith. 1997. Fig. 7) presents a compilation of measured values of velocity and density for saturated, porous sediments and poorly lithified Sedimentary rocks. Figure 10also includes a line of constant acoustic impedance determined from the average value along New Line (Table 1). Where this line intersects the region of values for sediments and rocks shows that the bed of New Line is not only at the upper end of the main range of values for sediments but also at the bottom end of the range for sedimentary rocks. Considering the soft sediment identified elsewhere beneath Rutford Ice Stream (Reference SmithSmith. 1997) and also beneath other ice streams (Reference Blankenship, Bentley, Rooney and AlleyBlankenship and others. 1986; Reference Engelhardt, Humphrey, Kamb and FahnestockEngelhardt and others. 1990: Reference Clarke and EchchelmeyerClarke and Echelmeyer, 1996), the bed material on New line is Likely to be lodged till rather than poorly lithified sedimentary rock. The data in Figure 10suggest that the average scismic velocity in the top few metres of the bed material is around 1750-2100 m−1.
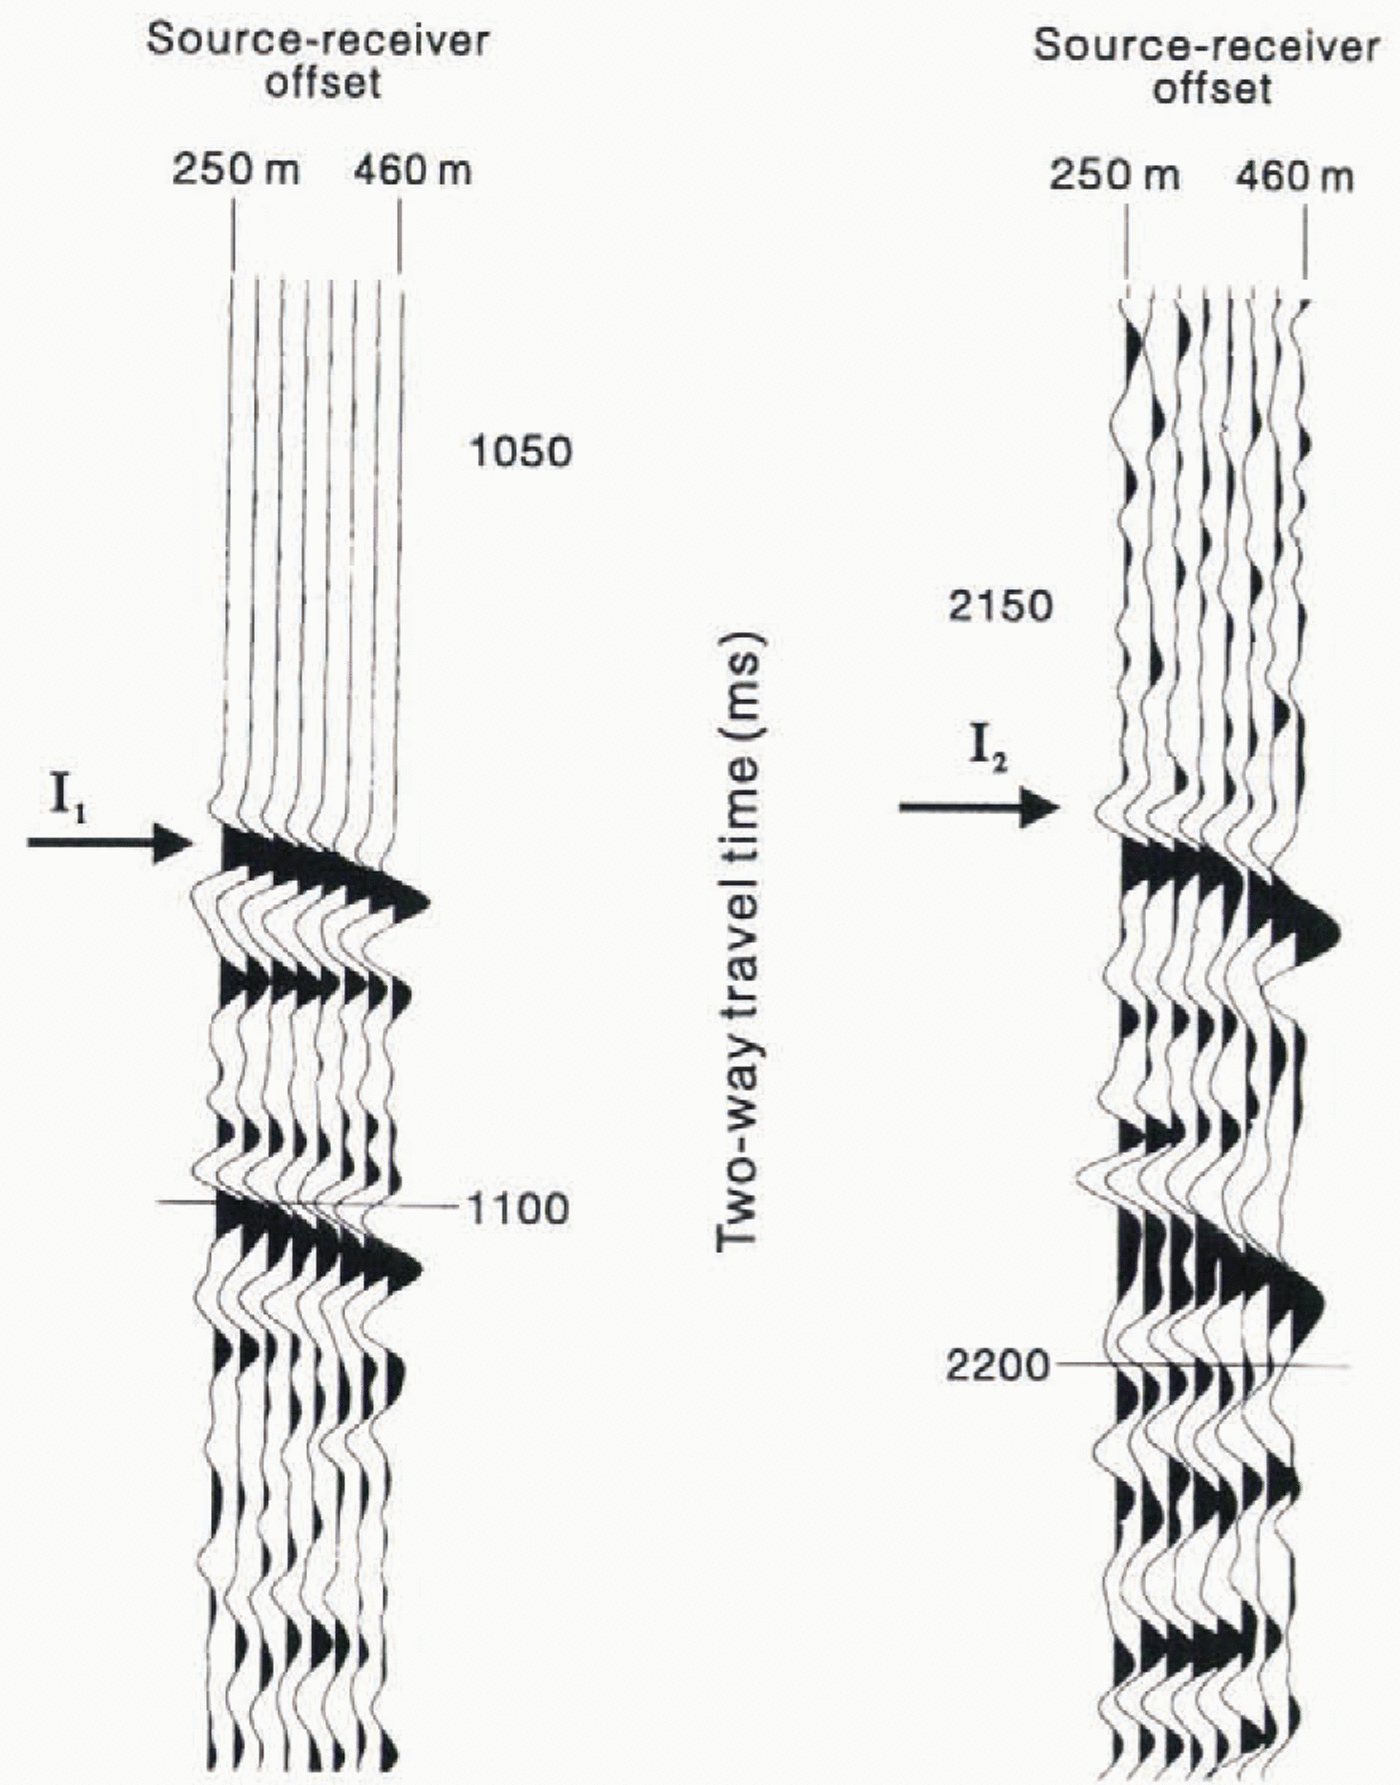
Fig. 7. Example of data from one of the wide-angle surveys showing the I1and I2reflections for a single shot. A low-pass filler has been used to remove frequencies greater than 300 Hz from the traces. showing the I2wavelet The amplitude of these traces has been increased slightly relative to the I1refection, for clarity.
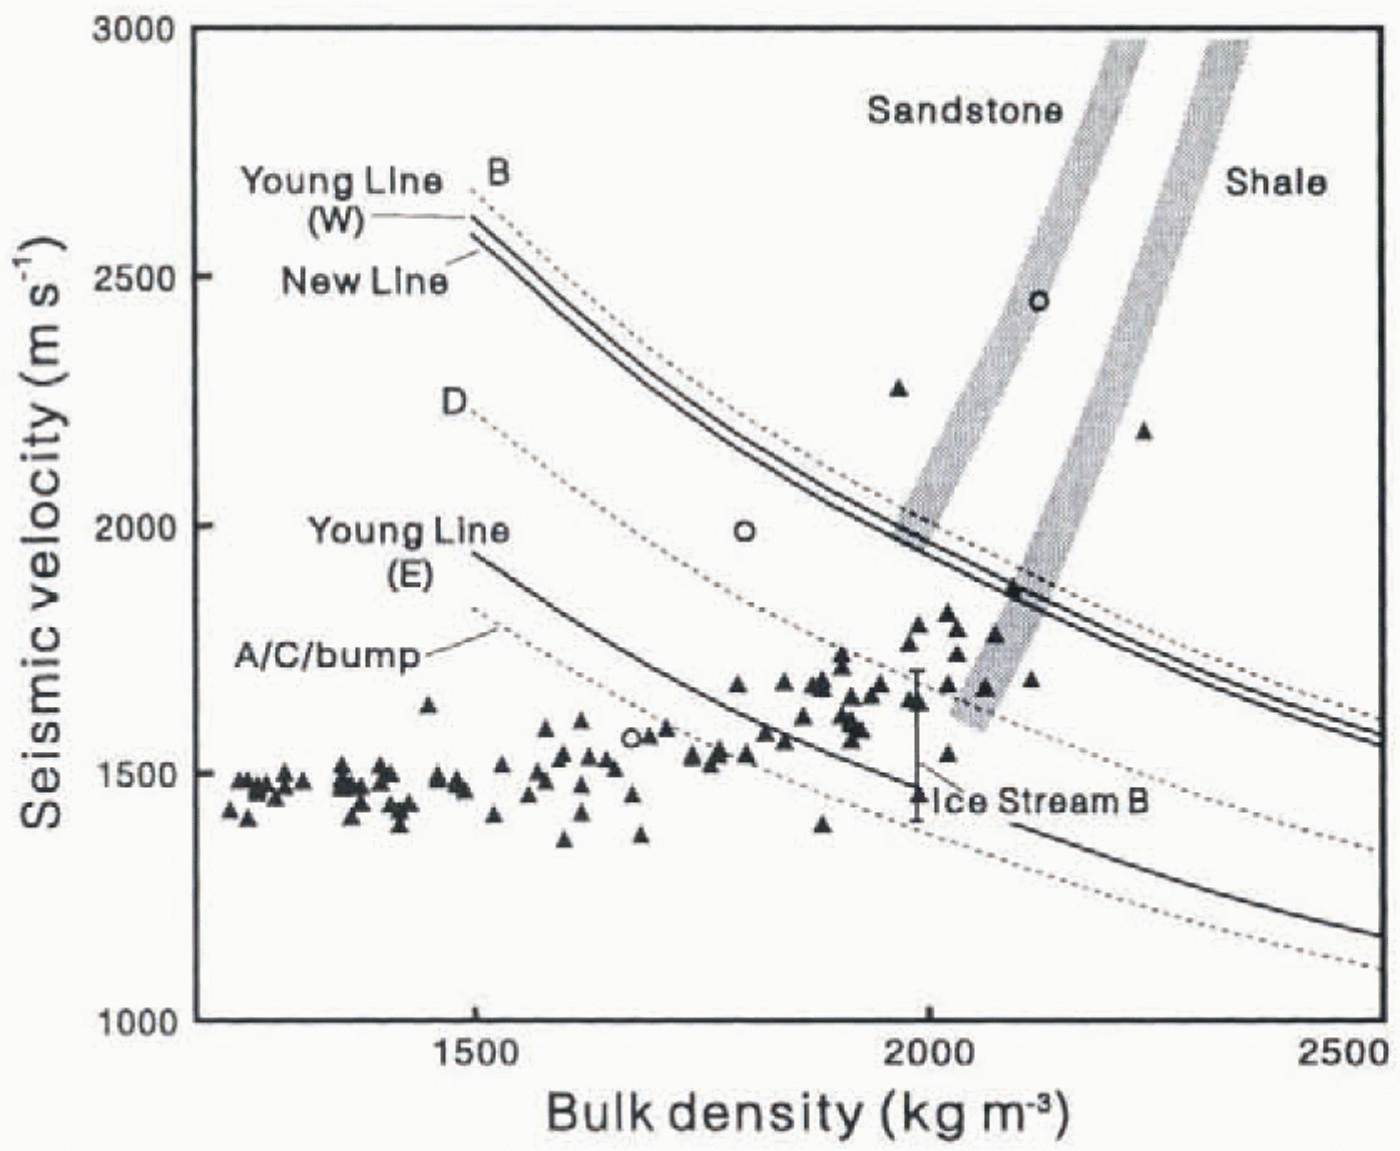
Fig. 10. Published values of density and seismic velocity for sediments and rocks, compared with Iinrs of constant acoustic impedance determined for New Line and the various sections of young and Tyree Lines. Mndified from Reference SmithSmith (1997). Triangles are from saturated fresh-water sediments and from marine sediments, corrected to fresh-icalcr values (following Reference Blankenship, Bentley, Ronney and AlleyBlankenship and Others, l987b) where necessary. Sources are. Reference Nafe, Drake and HillNafe and Drake (1963). Reference MorganMorgan (1969)and Reference HamiltonHamilton (1970). Open circles are from poorly lithified Cenozoic rocks from drillholes around McMurdo Sound, Ross Sea (Reference Barrett and FroggattBarrett and Froggatt. 1978). Vertical bar is the velocity and density for the bed of Ice Stream B (Reference Blankenship, Bentley, Ronney and AlleyBlankenship and others. 1987b). Shaded areas show the lower ends of typical ranges for sedimentan rocks (e.g. Reference Gardner, Gardner and GregoryGardner and others, 1974).
Young Line
The bed of Young Line has two distinct sections (Fig. 9b): a western section with relatively high acoustic impedance, and an eastern section with a much lower acoustic impc-rlanee, mostly less than that for ice anil at the lower end of the range for till, implied porosity for the higher-impedance, western section is 0.3 or less, and the average acoustic impedance (Table 1) is very similar to that for New lane, as shown by the curve of the constant acoustic impedance labelled “Young Line (W)” Figure 10. This suggests a similar interpretation for the western section to that for New Line, namelv, a lied of lodged till with an average seismic velocity of around 1750-2100 m−1in the top few metres of the bed. Acoustic impedance for the bed on the eastern section olAbimg Line is much less than that in the west (see the line labelled “Young Line (E)” in Figure 10), Implied porosity is around 0.4 or above. Such high porosity is believed to be possible only during sediment deformation (Reference Alley, Blankenship, Bentley and RooneyAlley and others. 1986), so the eastern section ol Young Line is interpreted as deforming subglacial sediment. T his interpretation is supported by the fact that the average acoustic impedance for the eastern part of Young Line is even less than that reported for the till beneath Ice Stream B (Fig. 10: Table 1), which is believed to be deforming (Reference Blankenship, Bentley, Ronney and AlleyBlankenship and others, 1987b). Seismic velocity in the bed material of the eastern section appears to be around 15001700 ms−1.
Variations in bed characteristics between the three seismic reflection lines
Reference SmithSmith (1997)presented a detailed analysis of Tyree Line (Fig. 2), which can be divided into four sections. A-D (Fig. 9c). Two sections. A and C. have a low acoustic impedance which is believed to indicate subglacial deformation. These two sections are separated by another section, B, with a much higher acoustic impedance, except for a short section of low impedance, referred mas “the bump”. In section B, ice flow is believed to be influenced more by basal sliding than by subglacial deformation (Reference SmithSmith, 1997). The bump is believed to be similar to the two sections of subglacial deformation (sections A and C). A fourth section, D, has an acoustic impedance between that for section B and that for the other sections, but is still believed to exhibit subglacial deformation. lines of constant acoustic impedance for sections B and D and for the mean of A, C and the bump are included in Figure 10.
The pattern of acoustic impedance is very similar on on line (Fig. 9b) and on that part of Tyree Line which spans section B and the bump (Fig. 9c). The highest points on both Lines show low acoustic impedance values. On Tyree Line this point (the bump) is interpreted as a mound of deforming sediments, tentatively called a subglacial drumlin (Reference SmithSmith. 1997), resting ona harder substrate. Although the corresponding eastern section of Young Line does not appear to the directly upstream of the bump (sec satellite image in Figure 9), it is clearly possible that these two could be a continuous sub-ice feature. The western section of Young Line has a similar acoustic impedance to section B of Tyree Line, as well as to all of New Line (Fig. 10). Hence, although Young Line is relatively short (3.6km) the fact that it is situated close to Tyree Line suggests that the pattern of acoustic impedance at the bed beyond both ends of Young Line could be similar to that seen on Tyree Line. The bed in the region of both these lines (Young and Tyree) therefore has areas where significant subglacial deformation is occurring and other areas where it is not.
The similarities between Young Line and Tyree Line suggest that the boundaries between the areas of different bed character are aligned roughly in the direction of ice flow. Assuming that the highest point on Young Line and the bump on Tyree Line are parts of a straight, continuous feature, then this Ieaiure is orientated approximately 10° to the ice-flow direction. A second estimate of the orientation of bed features, relative to the flow direction, can be made from the hyperbolas which remain on lhe seismic sections (Fig. 4; Reference SmithSmith, 1997, Fig. 3). The fact that a number of hyperbolas remain on the seismic sections after migration could be due to features which are not perpendicular to the seismic line. Re-migration of the sections using a progressively higher velocity value can be used to estimate what the difference in orientation might he. The migration velocity (Vm) required to collapse a hyperbola is related to the angle between the seismic line and the strike of a featues(α) by:

In this way, it was determined that some of the features at the bed could be orientated up to 13 to the direction of the seismic line. Reference Atre and BentleyAtre and Bentlcy (1994)found similar orientations of bed features (up to around 20°) on the ice plain of Ice Stream B.
The pattern of acoustic impedance on New Line is clearly different to that on both Tyree Line and Young Line. Along most of New Line, there is no evidence for pervasive subglacial sediment deformation. Il is therefore similar to only the relatively high-impedance parts of Tyree Line (section B) and Young Line (western section). Further downstream, at Tyree and Young Lines, sediment deformation occurs across a significant proportion of the ice-stream width (almost three-quarters of the width of Tyree Line). Reference SmithSmith’s (1997)analysis of Tyree Line concluded that significant variations in bed characteristics occurred across the width of the ice stream. The comparison between Tyree Line, Young Line and few Line shows that significant along-flow variations in bed characteristics also exist on RutIiird Ice Stream.
Comparison with ice-bed reflections on Ice Streams B and C
Reference Atre and BentleyAtre and Bentley (1993, 1991)found that seismic reflections from the bed of Ice Streams B and C (Fig. 1) varied between normal and reversed polarity.They also found that, qualitatively, the reversed-polarily reflections ranged from strong to weak, whereas the normal-polarity ones, beneath Ice Stream 1B at least, were weak. Reference Atre and BentleyAtre and Bentley (1993)concluded that reflection polarity alone cannot distinguish between a dilated, deforming bed and an undilated. non-deformity one. In contrast to Ice Stream B, the strength of both normal- and reversed-polarity reflections from the bed of Rutford Ice Stream varies from strong to weak. The quantitative analysis of reflection strength shows thai the acoustic impedance of some parts of the bed of Rutford Ice Stream is too high for the bed malerial to be deforming. Combining the reflection polarity analysis with a quantitative amplitude analysis therefore allows die distinction between deforming and non-deforming beds to be he made.
Reference Atre and BentleyAtre and Beniley (1993)suggested thai some of the variations in acoustic impedance at the bed of Ice Streams B and C could be due to relatively minor changes in die porosity and/or sediment type of a dilatant, deforming bed. This may also explain some of the variations seen within the low-impedance parts of the bed of Rutford Ice Stream (the difference between sections C and D on Tyree Line, for example). However, such minor changes are insufficient Io explain the high-impedance parts of the bed of Rutford Ice Stream. These can be explained by relatively large changes in the porosity and the degree of deformation of the subglacial sediments.
Ice-Stream Bed Variability and the Controlling Mechanisms for Ice-Stream Flow
Three possible basal processes are believed to be associated with ice fast flow of ice streams: (1) pervasive soft-bed deformation. (2) deformation of a basal Layer of soft ice at the pressure-melting point, and (3) sliding of ice over the bed, whether lubricated by water or not. The concept of “sticky spots” (e.g. Reference AlleyAlley, 1993) is a way of describing the spatial Variability of basal conditions. These basal processes arc not necessarily mutually independent, but examples exist where each process is believed to be dominant. Soft-bed deformation is believed to be important on the Siple Coast ice streams in West Antartica, although it is accepted that the full explanation of ice-stream Ilow there is not simple and requires variations in basal friction (Reference KambKamb. 1991; Reference AlleyAlley, 1993; Reference Anandakrishnan and BenleyAnandakrishnan and Bentley, 1993: Anandakrishinan and Alley, 1994: Reference MacAyeal, Bindschadler and ScambosMacAyeal and others, 1995). Seismic surveys show a lodged till at the bed of Jakobshavns Isbræ. West Greenland Marke and Eclichiicy er. 1996). However, even though the ice at the bed of Jakobshavns Isbræ al the melting point, basal sliding appears not to be important and the fast ice flow can be explained by deformation within a layer of soft basal ice (Tken and others, 1993; Reference Clarke and EchchelmeyerClarke and Echelmeyer. 1996). Reference Iverson, Hanson, Hooke and JanssonIverson and others (1995)showed that periods of high ice velocity on Storglaciärcn, Sweden, were related to high water pressure and low rates of deformation in the bed. leading them to coclude that enhanced ice motion was the result of reduced coupling between lhe ice and the bed. allowing significant basal sliding In occur.
The different characteristics in the seismic data from Rutford Ice Stream have been used to identify areas where pervasive bed deformation is occurring. Pervasive deformation requires at least some degree of coupling between the ice and the bed to maintain deformation within the sediment and the dilation which results from it. Hence, basal sliding is believed to be less important than bed deformation in these areas. Where the bed is interpreted as lodged till, coupling of ihe ice with the bed is insufficient to mobilise the bed material to any significant degree. Hence, sliding is more likely than bed deformation. The seismic data cannot establish how important deformation of the basal ice may be However, the low basal shear stress suggests dial it is unlikely to be ihe major component of ice flow. Hence, understanding why the differences in lied characteristics occur and whether these differences an related m variations in basal friction is important m understanding die ice-stream flow. The differences between areas of the bed which are deforming and those which are not might be expected to be reflected in the pattern of ice flow observed at the surface. Upstream and downstream of the seismic lines, transverse velocity profiles are Smooth and undisturbed (Reference Frolich, Vaughan and DoakeFrolich and others. 1989), suggesting little correlation with the identified pattern of basal variations. However, whilst die longitudinal surface velocity at New Line is accelerating, it becomes Constant before Miiuig and Tyree Fines, possibly reflecting the along-flow changes in basal conditions. Unfortunately, the surface velocity field along die seismic lines is not know well enough to allow a detailed comparison of basal variations and ice flow, but it is interesting to note that there is no clear correlation between the different sections identified at the bed and the Surface features on satellite images.
For part of an ice stream to exhibit deformation of a dilatant, saturated sediment at the bed requires the presence of a suitable sediment Supply and the presence of water at high pressure high enough to almost equal the overburden pressure but not enough to actually float the ice. The subglacial sedimciil is mobilised beneath much of Tyree Line, but not beneath New Line, so the conditions of sediment supply, water supply or effective pressure the difference between the ice-overburden and the water pressure) probably change over the intervening 52km. Although other factors (roughness of the till surface, for example) may also influence the degree of deformation, they are probably of lesser importance.
Sediment supply
The areas of subglacial deformation are evidence dial there is a supply of at least some deformable sediment beneath Rutford Ice Stream. It is possible that this represents the total amount of sediment which Ls available. At the other extreme, it is possible that the whole of the ice-stream bed represents a source of sediment which is available to be mobilised (if not already mobile) under suitable conditions. This latter condition is considered more likely on the basis of the acoustic impedance of die bed material (Figs 9 and 10; Table 1). All of New line and parts of both Tyree and Young Lines hav e relatively high acoustic impedance values. However, these values are still low relative to other rock types, even poorly lithified ones. There is probably very little difference between sediments classified as lodged till and those classified as weak sedimentary rocks, in terms of how easily they can be eroded, mobilised anil deformed. The implication is therefore that the ice-stream bed beneath all of the seismic lines would be relatively easily deformed, given suitable conditions. It seems likely, though not certain, that lack of available sediment is not the reason for the differences in bed characteristics.
Water supply
There are a number of reasons why a lack of water at the ice-stream bed is considered very unlikely. The fast flow of Rulford Ice Stream and low basal shear stress indicate that the ice is not frozen tothe bed and that the base must be close to the pressure-melting point. Sources of heal at the bed include geothermal heat flow. strain-heating due to deformation within the ice (or the bed) and friction as the ice slides over the bed. It is likely that the ice at the bed is melting and supplying water lo whatever subglacial drainage system may be present. This is supported by the fact that water has been found at the beds of other ice streams (Reference Engelhardt, Humphrey, Kamb and FahnestockEngelhardt and others, 1990; Reference Iken, Echelmeyer, Harrison and FunkIken and others, 1993).
Effective pressure
It follows that the differences between the bed beneath New Line and that beneath Tyree and Young Lines are probably related to the amounts and distribution of subglacial water and the pressure of this water at the ice bed interface. For deformation to occur, the effective pressure must be low, but not zero. As deformation occurs along much of Tyree Line, the effective pressure there must he low. If the bed material behaves as a Mohr-Caiulomb material (Reference Boulton and HindmarshBoulton and Hindmarsh, 1987), the effective pressure must be of a similar order of magnitude to the basal shear stress (10-40kPa at Tyree Line: Reference Frolich, Mantripp, Vaughan and DoakeFrolich and others, 1987) for deformation to occur.
Beneath New Line there is no evidence for deformation. However, the seismic data cannot show whether this is because the effective pressure is too low or to high. If the effective pressure is zero the ice can lift off the bed, removing any coupling across the ice bed interface and precluding deformation. If, however, the effective pressure is too high, some shearing of the bed may occur but it is not expected to be pervasive and will not be associated with dilation or a significant increase in porosiiy. Either of those two possibilities would be consistent with the interpretation of the seismic data, but the high basal shear stress at New Line (around 100 kPa: Reference Frolich, Mantripp, Vaughan and DoakeFrolich and others. 1987: personal communication from R. M. Frolich, 1996) suggests that the effective pressure there is relatively high and decreases downstream. This decrease could be associated with the accumulation of meltwater and/or changes in the basal drainage system. Alternatively, effective pressure at New Line could be relatively low. with the basal shear stress distributed over localised sticky spots, particularly as bed topography in the region of New Line is relatively rough (Fig. 4a). Basal water pressure may also be very variable on a relatively small scale (Reference Murray and ClarkeMurray and Clarke. 1995).There is still considerable uncertainty in the pattern of effective pressure at the ice-stream bed.
Conclusions
The bed of Rutford Iee Stream in the region ol the seismic surveys consists of sediments (or, in places, possibly pooriy lithified sedimentary rock). The characteristics of the bed vary both along and across the ice stream. In some areas, the sediments are dilated and are undergoing pervasive deformation. In other areas, there is no evidence for deformation, and basal sliding may be a more important process. Seismic velocities within the deforming sediments are estimated to be in the range 1500-1700ms−1. whereas in the non-deforming sediments they are estimated to be around 1750-2100 ms−1. The proportion of the ice-stream width exhibiting bed deformation increases downstream (Fig. 11).
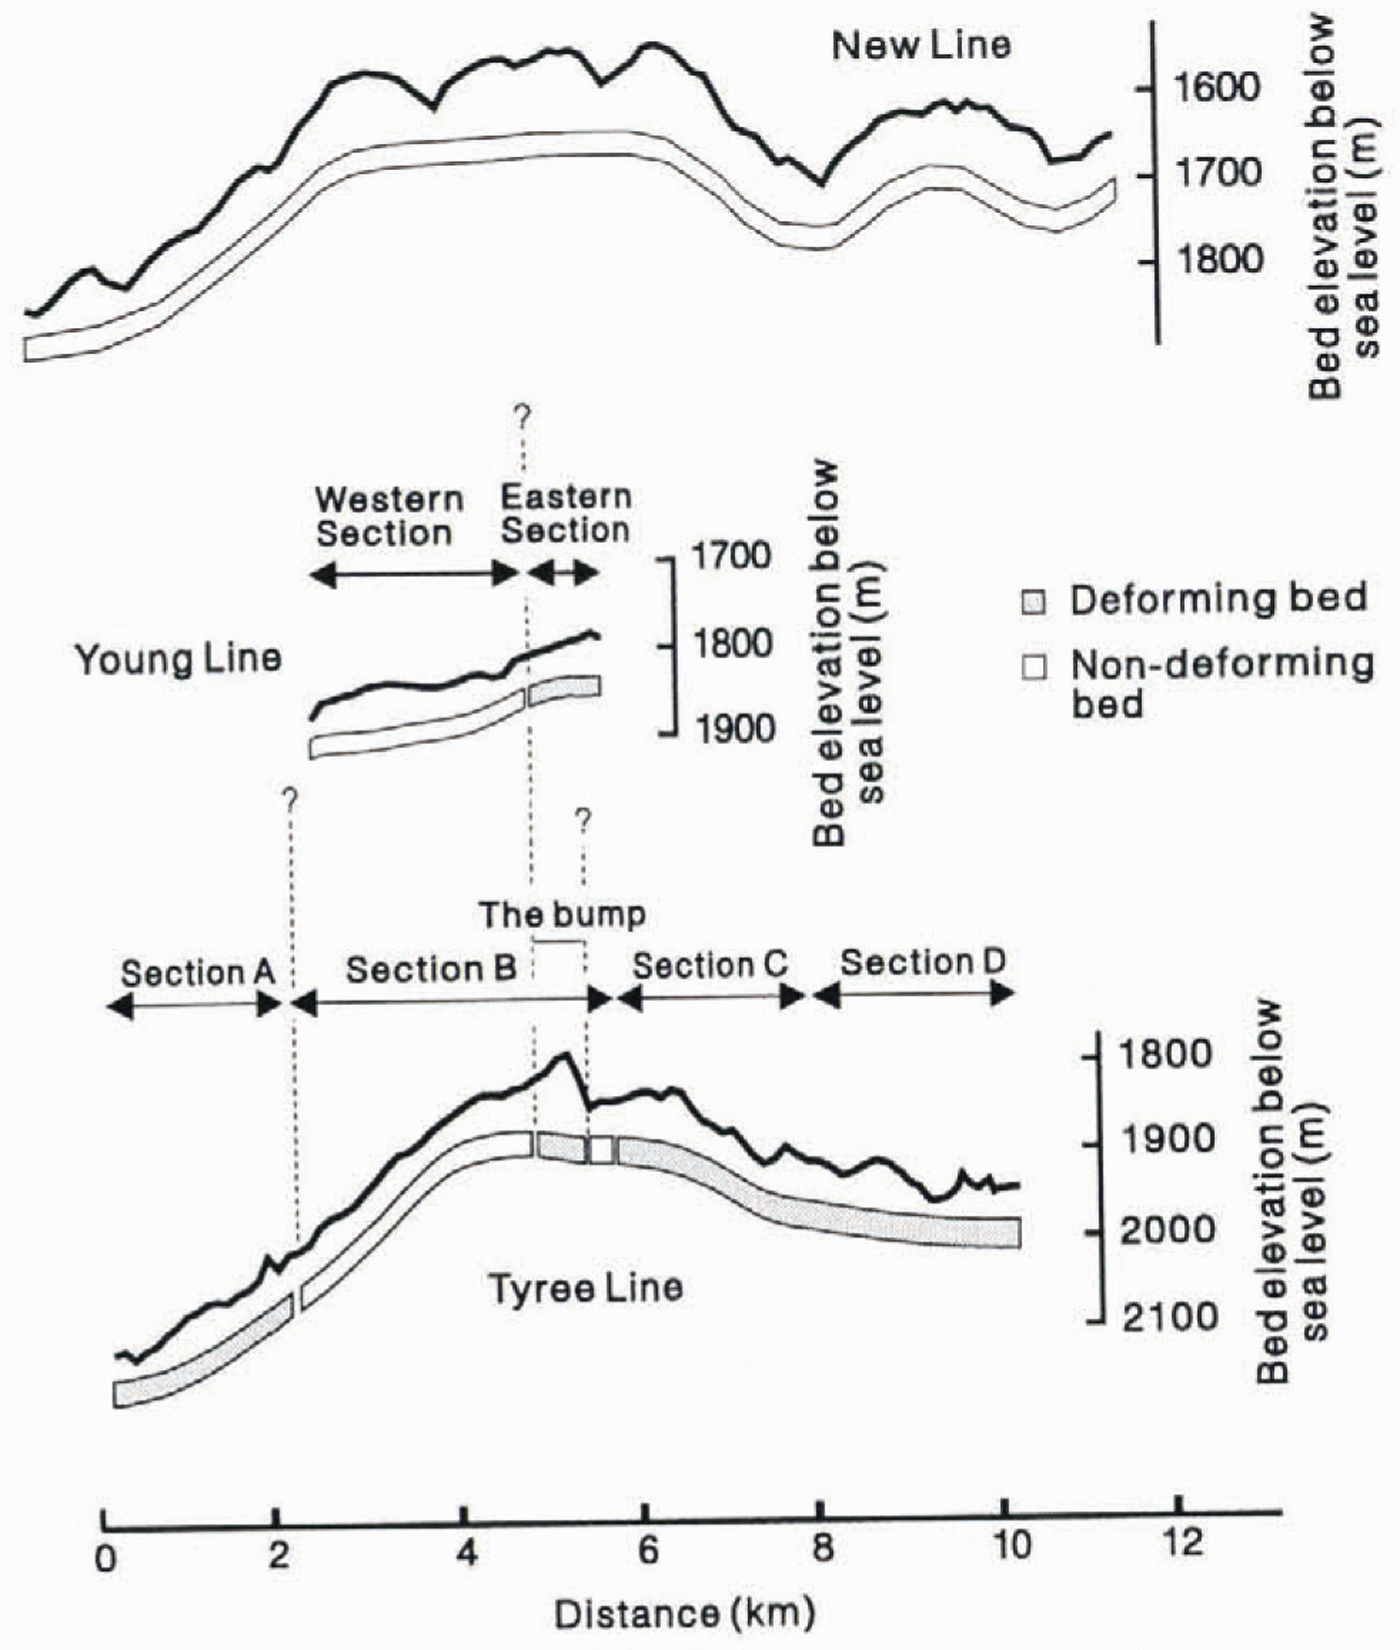
Fig. 11. Areas of bed de for million and basal sliding interpreted from the acoustic impedance data showing downstream and cross-stream variations. Dashed lines show possible correlations between the different sites (they are nut meant to imply ice-flow lines). Tyree Line modified from Reference SmithSmith (1997).
The average acouslic impedance value across New Line is 3.88 x 10⁶kg m−2s−1, Across Tyree Line, 52 km further downstream, it is 3.19 x 10⁶kg m−1s−1, The downstream changes in bed characteristics may be related to variations in the effective pressure, though it is still possible that other factors (e.g. sediment grain-size distribution, degree of lithi-fiction, bed roughness, drainage system) are also involved. Reference AlleyAlley (1993)suggested that an ice stream with spatially variable basal friction might behave in a fundamentally different way to one with uniform drag,Variations in the basal characteristics of Rutford Ice Stream may be associated with fundanienial changes in the basal boundary condition and with different amounts of basal friction. If so, it is difficult to say at present whether this is reflected in the surface velocity field. Further work is needed to investigate any relationship between variations in basal conditions and basal friction. One possible way to do this would be to deploy passive seismic monitoring arrays, which have been used successfully in Antarctic a on Iir Streams B and C (Blanken-ship and others, 1987a: Reference Anandakrishnan and BenleyAnandakrishnan and Bentley, 1993: Reference Anandakrishnan and AlleyAnandakrishnan and Alley. 1994). Using this technique, it may he possible to determine to what degree the different sections of the ice-stream bed are associated with varying amounts of basal friction.
Acknowledgements
I thank S. Abrahams, S. Redshaw and A. Taylor for then help in the field. C. Doake and N. Goulty have- provided much guidance throughout this work, which has also benefited from discussions with D.Vaughan, R. Frolich. R. Hind-marsh. G. Clarke, S. Anandakrishnan and D. Blankenship T. Clarke kindly provided a pre-publication copy of a manuscript.

