Hostname: page-component-745bb68f8f-b95js Total loading time: 0 Render date: 2025-01-26T22:15:16.803Z Has data issue: false hasContentIssue false

A shear and elongational decomposition approach of the rate-of-deformation tensor for non-Newtonian flows with mixed kinematics

Published online by Cambridge University Press:  10 December 2024
Paulo J. Oliveira*
Affiliation:
Departamento de Engenharia Electromecânica, C-MAST, Universidade da Beira Interior, 6201-001 Covilhã, Portugal
*
Email address for correspondence: pjpo@ubi.pt

Abstract

We propose a novel approach for non-Newtonian viscoelastic steady flows based on a decomposition of the rate-of-deformation tensor which here, in a simplified version, leads to an anisotropic generalised Newtonian fluid-like model with separated treatment of kinematics pertaining to shear and extensional flows. Care is taken to assure that the approach is objective and does not introduce spurious effects due to dependence on a specific reference frame. This is done by separating the rate-of-deformation tensor into shear and elongational components, with the local scalar shear and elongation rates being the second invariant of each tensor separately, and by modifying the method used to separate the rate-of-deformation tensor so that it becomes independent of superimposed rigid rotations, thus satisfying the principle of material indifference. We assess the model with two test cases: planar contraction flow, often employed to evaluate numerical methods or constitutive equations and for which experimentally observed corner vortex enhancement and pressure drop increase are seldom found in numerical simulations; and flow past confined or unconfined cylinders, for which experiments indicate a drag increase due to elasticity and most predictions give a drag decrease. With our anisotropic model, incorporating additional elongational-flow-related terms, large vortices and accentuated pressure drop coefficients can be predicted for the contraction problem and enhanced drag coefficient for the cylinder problems. This is the first work where problems of non-Newtonian fluid mechanics are solved numerically with separation of strain rate into shear and elongational components.

Type
JFM Papers
Copyright
© The Author(s), 2024. Published by Cambridge University Press

1. Introduction

Complex fluids, such as biological fluids and polymer melts and solutions, contain large molecules having either simple (linear shape) or elaborated (star shape, H-shape or other shapes resulting from molecular branching) microstructures which are difficult to extend in weak flows but may be fully extended in strong flows. Here, following Larson (Reference Larson1988, pp. 12 and 195), the flow is said to be slow/weak if the separation between two neighbouring fluid particles tends to increase only linearly with time, such as in shear flows, whereas in fast/strong flows the separation increases exponentially, as predominantly occurs in uniaxial elongational flow. In addition, it is known that shear is accompanied by local fluid rotation (Batchelor Reference Batchelor1967, p. 83) and therefore the macromolecules in flow will tend to retain a deformed spherical/ellipsoidal shape leading to an average isotropic behaviour of the stress/strain rate response. On the other hand, the highly extended configurations typical of elongational flow induce an anisotropic response when compared with that of shear: for instance, it is well known that the elongational viscosity of dilute polymer solutions can be orders of magnitude higher than the corresponding shear viscosity – see e.g. Larson (Reference Larson1988, p. 256), Jones, Walters & Williams (Reference Jones, Walters and Williams1987), Kim & Lee (Reference Kim and Lee2019) and Haward et al. (Reference Haward, Varchanis, McKinley, Alves and Shen2023). So while we still consider the fluid to be isotropic at rest, some degree of anisotropy will be accounted for in flow due to the distinct treatment of shear and elongation.

In this work we want to explore the consequences of using an anisotropic approach at a fundamental level of non-Newtonian fluid modelling: the two viscosity functions, for simple shearing motion and for simple extension, are considered different as given by the measurements, and the nonlinear relation between rate of strain and stress follows that for a generalised Newtonian fluid (GNF, see Bird, Armstrong & Hassager Reference Bird, Armstrong and Hassager1987, Chap. 4). Our motivation is to see if such relatively simple inclusion of an elongational viscosity in viscoelastic flow simulations may explain an intriguing long-standing issue in non-Newtonian fluid mechanics: Why is it that most of the current differential viscoelastic models (upper-convected Maxwell (UCM), Oldroyd-B, finitely extensible nonlinear elastic with Peterlin approximation (FENE-P), Phan-Thien–Tanner (PTT), Giesekus – see Larson Reference Larson1988 for the respective constitutive equations) are unable to predict the large pressure drops, and the accompanying enhanced vortex formation, in entry flows (Debbaut & Crochet Reference Debbaut and Crochet1988; Alves, Oliveira & Pinho Reference Alves, Oliveira and Pinho2003, Reference Alves, Oliveira and Pinho2004; Walters, Webster & Tamaddon-Jahromi Reference Walters, Webster and Tamaddon-Jahromi2009; López-Aguilar et al. Reference López-Aguilar, Tamaddon-Jahromi, Webster and Walters2016; Varchanis et al. Reference Varchanis, Tsamopoulos, Shen and Haward2022), or in flows constricted by an obstacle (Debbaut & Crochet Reference Debbaut and Crochet1988; Alves, Pinho & Oliveira Reference Alves, Pinho and Oliveira2001), that are observed in experiments (flow in contractions: Binding & Walters Reference Binding and Walters1988; Rothstein & McKinley Reference Rothstein and McKinley1999, Reference Rothstein and McKinley2001; Rodd et al. Reference Rodd, Scott, Boger, Cooper-White and McKinley2005, Reference Rodd, Cooper-White, Boger and McKinley2007; flow around cylinders: James & Acosta Reference James and Acosta1970; Talwar & Khomami Reference Talwar and Khomami1995; Verhelst & Nieuwstadt Reference Verhelst and Nieuwstadt2004; flow past spheres: Solomon & Muller Reference Solomon and Muller1996)?

A comprehensive review of this issue, when related to converging flows (sudden contractions or hyperbolic-shaped tubes or channels forming a smooth contraction), is given in the introduction section of the recent paper by Boyko & Stone (Reference Boyko and Stone2022) and has been also discussed in many other papers, including those cited above and especially by Koppol et al. (Reference Koppol, Sureshkumar, Abedijaberi and Khomami2009) who attempted to solve it using ‘mesoscopic’ simulations of an axisymmetric contraction/expansion geometry. While conventional macroscopic viscoelastic models solve the equations for the stress in terms of macroscopic variables, mesoscopic simulations act at an intermediate scale and the rheological equation of state must be solved in a stochastic fashion, obtaining average quantities from simulations over many configurations. Not only does this becomes very expensive in practical terms, but the results of Koppol et al. (cf. their figure 4) show a pressure drop trend that is not quite like that found in the experiments of Rothstein & McKinley (Reference Rothstein and McKinley1999). These authors have argued that a possible cause for the increased pressure drop seen in experiments could be a hysteresis effect in the stress–conformation relationship observed in fast extensional flows of real fluids but not represented by those standard constitutive equations mentioned above. In an effort to elucidate this issue, Zografos, Afonso & Poole (Reference Zografos, Afonso and Poole2022) have recently carried out a comprehensive numerical study using a form of the adaptive length scale (ALS) of the FENE model, which is capable of describing coil-stretch hysteresis, but in spite of the complexity of the model involved the pressure drop predicted was much smaller than that found experimentally.

Our approach to introduce anisotropy is easily explained if we consider a ‘simple fluid’ (in the sense of Coleman & Noll Reference Coleman and Noll1961; see also Tanner Reference Tanner1988, p. 133), without memory, and assume a nonlinear relation between the stress ($\boldsymbol{\sigma }$) and rate-of-deformation ($\boldsymbol{D}$) tensors, as in the generalised Stokes model (see Leigh Reference Leigh1968, p. 8)

(1.1)\begin{equation}\boldsymbol{\sigma } = \boldsymbol{f}(\boldsymbol{D}),\end{equation}

where $\boldsymbol{f}$ is a tensor-valued function of $\boldsymbol{D}$. Since the principle of material frame indifference (see e.g. Leigh Reference Leigh1968, Chap. 8) requires that $\boldsymbol{f}$ be an isotropic function ($\boldsymbol{Q\,f}{\boldsymbol{Q}^T} = \boldsymbol{f}(\boldsymbol{QD}{\boldsymbol{Q}^T})$ for any orthogonal time-dependent tensor ${\boldsymbol{Q}^T}(t) = {\boldsymbol{Q}^{ - 1}}(t)$), then the fundamental representation theorem for such functions (Leigh Reference Leigh1968, pp. 73–75) gives immediately the classical result of Reiner (Reference Reiner1945, Reference Rivlin1948)

(1.2)\begin{equation}\boldsymbol{\sigma } = {f_0}{\boldsymbol{\mathsf{I}}} + {f_1}\boldsymbol{D} + {f_2}{\boldsymbol{D}^2},\end{equation}

where ${f_0}$, ${f_1}$, ${f_2}$ are scalar-valued functions of the three invariants of $\boldsymbol{D}$ (${I_{i,D}}$, $i = 1,\;2,\;3$), and ${\boldsymbol{\mathsf{I}}}$ is the identity tensor. The term in ${f_0}$ is an isotropic contribution to the stress that may be added to the pressure, and the term in ${f_2}$ corresponds to a contribution proportional to the second normal stress difference coefficient (in simple shear flow) which we shall not consider in the present simplified approach. Thus, setting ${f_1} = 2\eta ({I_{i,D}})$ where $\eta $ is the shear-viscosity function, we end up with the standard GNF model for the extra stress ($\boldsymbol{\tau }$) tensor

(1.3)\begin{equation}\boldsymbol{\tau } = \boldsymbol{\sigma } + p{\boldsymbol{\mathsf{I}}} = 2\eta \boldsymbol{D}.\end{equation}

Now, the previous discussion has shown us that complex fluids respond differently to shearing and elongational deformations even in the extremely simplified case followed here of assuming GNF-like responses to both types of deformation. If we take ${\boldsymbol{\sigma }_S}$ and ${\boldsymbol{\sigma }_E}$ to be the stress tensors resulting from shear and elongation, then we assume

(1.4)\begin{equation}\boldsymbol{\sigma } = {\boldsymbol{\sigma }_S} + {\boldsymbol{\sigma }_E} = {\boldsymbol{f\!}_S}\textrm{(}{\boldsymbol{D}_S}) + {\boldsymbol{f\!}_E}\textrm{(}{\boldsymbol{D}_E}),\end{equation}

with ${\boldsymbol{f\!}_S}$ and ${\boldsymbol{f\!}_E}$ being again isotropic tensor-valued functions of the shear and elongational rate-of-deformation tensors (${\boldsymbol{D}_S}$ and ${\boldsymbol{D}_E}$). The same representation theorem applied to these functions gives our anisotropic GNF-like model

(1.5)\begin{equation}\boldsymbol{\tau } = {\boldsymbol{\tau }_S} + {\boldsymbol{\tau }_E} = 2{\eta _S}{\boldsymbol{D}_S} + 2{\eta _E}{\boldsymbol{D}_E}.\end{equation}

This represents an extremely simple approach but, as far as we are aware, has never been attempted previously probably because a method to separate $\boldsymbol{D}$ into shear and elongational components was not available until only a few years ago (Kolar Reference Kolar2007). The triple-decomposition method of Kolar permits us to obtain the local velocity gradient as a sum of shear, elongation and solid-body rotation contributions, and while the original interest was mainly focused on the latter component (rotation) so that it would be useful to identify vortices in turbulent flows, our interest is obviously into separating shear deformations and elongation deformations. For two-dimensional (2-D) flows Kolar's method is sufficiently simple to allow integration into a flow solver algorithm, but such simplicity disappears in three-dimensional (3-D) flows. Consequently, we shall concentrate here on the application of our anisotropic model to 2-D flows; if the results are deemed to be interesting enough, as we will hopefully demonstrate here, extension to three dimensions will be attempted in future research.

Although the description of our approach given above might give the impression that it is only valid for an inelastic fluid, in fact it may be put into the context of a limiting case for the general viscoelastic ‘simple fluid’ in steady flows, as we will explain next.

1.1. Steady shearing flows

A GNF is then defined by (1.3), where $\eta $ is a non-Newtonian viscosity which may be given as a scalar function of the invariants of $\boldsymbol{D}$ (sometimes of $\boldsymbol{\tau }$) by many of the existing GNF models, such as the power law, Carreau and so on (see e.g. Bird et al. Reference Bird, Armstrong and Hassager1987, pp. 169–175). Since liquids are usually considered as incompressible, the first invariant of $\boldsymbol{D}$ is zero (${I_{1,D}} \equiv \textrm{tr}\,\boldsymbol{D} = \boldsymbol{\nabla }\boldsymbol{\cdot }\boldsymbol{u} = 0$), and in planar 2-D flows, more generally in viscometric flows, the third invariant (${I_{3,D}} \equiv \textrm{det}\,\boldsymbol{D}$) is also zero. Then the functional dependence of the viscosity can only be related to the second invariant (${I_{2,D}} \equiv {\textstyle{1 \over 2}}(\textrm{tr}\,\boldsymbol{D} - \boldsymbol{D}:\boldsymbol{D})$), which is usually expressed as ${\dot{\gamma }_D} = \sqrt {2\boldsymbol{D}:\boldsymbol{D}} $, thus becoming identical to the absolute value of the shear rate $\dot{\gamma }$ in a simple shear flow ($u = \dot{\gamma }y$, $v = 0$, $w = 0$). It is important, however, to distinguish between the two; in general the local shear rate $\dot{\gamma }$ is not equal to ${\dot{\gamma }_D}$. Note that this ${\dot{\gamma }_D}$ is related to the usual expression of tensor magnitude by ${\dot{\gamma }_D}/2 = ||\boldsymbol{D} ||\equiv \sqrt {{\textstyle{1 \over 2}}\boldsymbol{D}:{\boldsymbol{D}^T}} $. For future reference we rewrite here the constitutive equation for the standard GNF model

(1.6)\begin{equation}\boldsymbol{\tau } = 2\eta ({\dot{\gamma }_D})\boldsymbol{D}\quad \textrm{with}\;{\dot{\gamma }_D} = \sqrt {2\boldsymbol{D}:\boldsymbol{D}} = 2\sqrt {( - {I_{2,D}})} .\end{equation}

Although GNF models were originally proposed on the basis of empirical fitting of measured shear viscosity as a function of the applied shear rate, there is a theoretical foundation for their use in steady shearing flows. Under these restrictions, of steady viscometric flow, an important paper by Criminale, Eriksen & Filbey (Reference Criminale, Ericksen and Filbey1958) (CEF model) showed that the Rivlin–Ericksen expansion for a ‘simple fluid’, in which $\boldsymbol{\tau }$ is expressed as a succession of terms of increasing higher-order n of the Rivlin–Ericksen tensors ${\boldsymbol{A}_n}$ (defined as ${\boldsymbol{A}_1} = 2\boldsymbol{D}$ and ${\boldsymbol{A}_{n + 1}} = \textrm{D}{\boldsymbol{A}_n}/\textrm{D}t + {\boldsymbol{A}_n}\boldsymbol{L} + {\boldsymbol{L}^T}{\boldsymbol{A}_n}$ for $n = 1,2,3, \ldots $), turns out to be finite and given by

(1.7a)\begin{equation}\boldsymbol{\tau } = \eta {\boldsymbol{A}_1} + ({\psi _1} + {\psi _2})\boldsymbol{A}_1^2 - {\textstyle{1 \over 2}}{\psi _1}{\boldsymbol{A}_2}\end{equation}

or, in terms of the rate-of-deformation tensor,

(1.7b)\begin{equation}\boldsymbol{\tau } = 2\eta \boldsymbol{D} - {\psi _1}\mathop{\boldsymbol{D}}\limits^\nabla + 4{\psi _2}\boldsymbol{D}\boldsymbol{D}.\end{equation}

Here, $\mathop {(\textrm{ })}\limits^\nabla $ is one of the convected derivatives introduced by Oldroyd (Reference Oldroyd1950), given by $\mathop {\boldsymbol{A}}\limits^\nabla = \boldsymbol{u}\boldsymbol{\cdot }\boldsymbol{\nabla }\boldsymbol{A} - \boldsymbol{L}\boldsymbol{A} - \boldsymbol{A}{\boldsymbol{L}^T}$ for any second-order tensor $\boldsymbol{A}$ in steady flows, and the velocity gradient tensor is defined by $\boldsymbol{L} \equiv \boldsymbol{\nabla }{\boldsymbol{u}^T} = \boldsymbol{D} + \boldsymbol{W}$, where $\boldsymbol{D} = {\textstyle{1 \over 2}}(\boldsymbol{L} + {\boldsymbol{L}^T})$ and the vorticity tensor is $\boldsymbol{W} = {\textstyle{1 \over 2}}(\boldsymbol{L} - {\boldsymbol{L}^T})$. The three scalar coefficients, $\eta ({\dot{\gamma }_D})$, ${\psi _1}({\dot{\gamma }_D})$, ${\psi _2}({\dot{\gamma }_D})$, in (1.7) are possible functions of the second invariant of $\boldsymbol{D}$, ${\dot{\gamma }_D}$. It is easy to show that, in the simple shear flow mentioned above, the coefficients of the CEF model defined by (1.7) become: $\eta \equiv {\tau _{xy}}/\dot{\gamma }$, the shear viscosity; ${\psi _1} \equiv ({\tau _{xx}} - {\tau _{yy}})/{\dot{\gamma }^2}$, the first normal stress difference; ${\psi _2} \equiv ({\tau _{yy}} - {\tau _{zz}})/{\dot{\gamma }^2}$ the second normal stress difference, thus gaining their standard meaning. If normal stress effects are omitted, by setting the first and second normal stress coefficients to zero, ${\psi _1} = {\psi _2} = 0$, then we recover the GNF model.

With this interpretation it is clear that effects of first and second normal stress differences in shear cannot be predicted by GNF-type models, such as secondary flows in straight channels of rectangular cross-section (which can arise if ${\psi _2} \ne 0$ and non-uniform; e.g. Tanner Reference Tanner1988, pp. 155–157) or secondary flows in wall-driven Taylor–Couette apparatus (co-axial rotating cylinders) at low velocities (which are due to hoop stresses, that is normal stresses along the circumferential direction ${\tau _{\theta \theta }}$, coupled with streamline curvature, or ${\psi _1} \ne 0$; e.g. Tanner Reference Tanner1988, Chap. 10; also Larson, Shaqfeh & Muller Reference Larson, Shaqfeh and Muller1990).

1.2. Steady elongational flows

A theoretical work that parallels the CEF model, which we recall is valid for shear flow only, to the case of elongational flow was given by Coleman & Noll (Reference Coleman and Noll1962). These authors showed that the relationship between stress and rate-of-strain tensors in steady elongational flow of an incompressible ‘simple fluid’ must have a form similar to (1.2), namely

(1.8)\begin{equation}\boldsymbol{\sigma } = {h_0}{\boldsymbol{\mathsf{I}}} + {h_1}\boldsymbol{D} + {h_2}{\boldsymbol{D}^2},\end{equation}

where ${h_k}$ are functions of the invariants of $\boldsymbol{D}$ in extensional flow. Again, the term in ${h_0}$ is irrelevant because only stress differences can be measured and, to simplify the approach, in this work we decided not to include the term in ${h_2}$ so that the function ${h_1} = 2{\eta _E}({I_{2,{\boldsymbol{D}_E}}})$acquires the meaning of our elongational viscosity component. We have verified that the function ${h_2}({I_{2,{\boldsymbol{D}_E}}})$ is much smaller than ${h_1}({I_{2,{\boldsymbol{D}_E}}})$for some common constitutive equations, such as FENE-P, PTT and Giesekus, and that it goes quickly to zero when the elongational viscosity starts to increase. Expression (1.8) represents a viscoelastic model valid for a large class of fluids (they only need to behave as a ‘simple fluid’) in a particular, but still quite general, type of flow: steady elongational flow. Coleman & Noll pointed out that the material functions ${h_1}$ and ${h_2}$ are not related to the usual viscometric functions ($\eta ,{\psi _1},{\psi _2}$) and cannot be determined from a shear flow experiment; they discussed possible experimental arrangements to measure those two functions.

1.3. Combination of both flow types

In summary, if we exclude effects of normal stresses in shear from the CEF equation (1.7) and of second order in the rate of deformation in elongation from the Colemann–Noll equation (1.8), our proposed anisotropic GNF-like model reads (from 1.5)

(1.9a)\begin{equation}{\boldsymbol{\tau }_S} = 2{\eta _S}\textrm{(}\dot{\gamma }\textrm{)}{\boldsymbol{D}_S}\quad \textrm{with}\;\dot{\gamma } = \sqrt {2{\boldsymbol{D}_S}:\boldsymbol{D}_S^T} \end{equation}

and

(1.9b)\begin{equation}{\boldsymbol{\tau }_E} = 2{\eta _E}\textrm{(}\dot{\varepsilon }\textrm{)}{\boldsymbol{D}_E}\quad \textrm{with}\;\dot{\varepsilon } = \sqrt {{\textstyle{1 \over 2}}{\boldsymbol{D}_E}:\boldsymbol{D}_E^T} ,\end{equation}

where $\dot{\gamma }$ and $\dot{\varepsilon }$ are related to the second invariants of ${\boldsymbol{D}_S}$ and ${\boldsymbol{D}_E}$, respectively. Due to incompressibility the first invariants of both ${\boldsymbol{D}_S}$ and ${\boldsymbol{D}_E}$ are zero, and in 2-D flows these are the only invariants required. It is noted that, while (1.9a) represents a constitutive equation for an inelastic fluid, (1.9b) is a restricted form of a viscoelastic constitutive equation, as was commented by Petrie (Reference Petrie2006). Another way of looking to this issue may be taken through the definition of Jones et al. (Reference Jones, Walters and Williams1987): an inelastic fluid has a Trouton ratio, defined as the ratio of the elongational viscosity and the shear viscosity, ${T_R}(\dot{\varepsilon }) \equiv \eta_{el}(\dot{\varepsilon })/\eta (\dot{\gamma } = 2\dot{\varepsilon })$, equal to four, ${T_R}(\dot{\varepsilon }) = 4$ (in planar extension), for all elongation rates, $\dot{\varepsilon }$. Clearly, in our case if ${\eta _E}(\dot{\varepsilon })$ is strain hardening ${T_R}(\dot{\varepsilon })$ will be larger than 4 and our model may no longer be classified as an ‘inelastic fluid’ according to the definition of Jones et al. Hence, we often refer to ‘elastic effects’ as those resulting from the elongational viscosity component, and the designation of GNF is probably somewhat inadequate; this is why we tend to classify the model as GNF-like or GNF-type.

We will apply the model represented by (1.9) to two typical problems often used as benchmarks in computational rheology: (i) flow in a 2-D planar sudden contraction with a contraction ratio of 4:1; (ii) flow around a cylinder either in a unconfined domain or confined at the central plane of a channel with a blockage ratio (cylinder diameter/channel width) of 1:2. In both cases we will be primarily interested in low Reynolds number flow, $Re \le 1$, since this is the usual situation in the related experimental works dealing with non-Newtonian fluids, however, for the unconfined-cylinder flow some simulations are extended to Re up to 20 to observe inertial effects. In terms of fluid rheological behaviour we will be essentially concerned with the two scenarios:

  1. (a) Constant shear viscosity and strain hardening (or tension stiffening) elongational viscosity – elastic behaviour.

  2. (b) Shear-thinning shear viscosity and the same elongational viscosity (that is, zero additional elongational viscosity, as defined below in 2.20) – inelastic behaviour.

Our results will demonstrate the following three main points which we list here to highlight at the outset the interest in this class of model:

  1. (i) In the ‘elastic’ case of scenario (a) the anisotropic model predicts significant pressure drop enhancement and vortex intensification, for the sudden contraction problem, or drag increase, for the cylinder problem.

  2. (ii) In the ‘inelastic’ case of scenario (b) the anisotropic model gives predictions that are somewhat different (differences of approximately 15 % in pressure drop) from standard GNF models; this issue can only be solved with recourse to experimental data and will be a subject of future investigation.

  3. (iii) In addition to point (ii), inelastic flow simulations with the anisotropic model predict an instability in front of the cylinder, for both the unconfined and confined cases, which has been observed experimentally (Ribeiro et al. Reference Ribeiro, Coelho, Pinho and Alves2014) but was attributed to elastic effects.

These last two points, (ii) and (iii), are a consequence of the standard GNF model definition: from (1.6) the viscosity function to be prescribed is given in terms of the second invariant of $\boldsymbol{D}$ by $\eta = \eta ({\dot{\gamma }_D})$ but the problem is that ${\dot{\gamma }_D}$ contains contributions that do not simply originate from past shear flow deformations (Hodgkinson et al. Reference Hodgkinson, Chaffin, Zimmerman, Holland and Howse2022). Flows having mixed kinematics, even in the 2-D plane flows here considered, will certainly contain terms related to shear flow, terms related to extensional flow and also terms related to rotational flow. In this case, we refer to those not contained in the anti-symmetric part of the velocity gradient tensor since the vorticity tensor is known not to contribute to the deformation of fluid elements (Batchelor Reference Batchelor1967, pp. 80–81).

There are numerous works where non-Newtonian fluid flow is simulated using some GNF model on the expectation that the flow is essentially governed by shear viscosity and, consequently, depending on how viscosity varies with shear rate. To give a few examples, we highlight only the recent works of Boyko & Stone (Reference Boyko and Stone2021) and Alam et al. (Reference Alam, Raj, Khan, Kumar and Roy2021). Both used the Carreau model to study theoretically and numerically the flow of non-Newtonian liquids, the first dealing with microfluidic channel flows for which the pressure drop versus flow rate was sought, and the second with vortex shedding from an oscillating cylinder in two dimensions. Clearly, while the Boyko & Stone study is focused on a viscometric flow for which the assumptions required for the GNF model to hold are satisfied, the flow is Eulerian steady and it is a simple shear flow although not homogeneous ($\dot{\gamma }$ depends on spatial position), Alam et al., on the other hand, consider a more complex flow case, with regions of extensional kinematics near the upstream and downstream stagnation points for the flow around the cylinder, with the added complication that the flow is Eulerian (and Lagrangian) unsteady.

So, while GNF models are the simplest constitutive models to account for non-Newtonian effects resulting from the dependence of viscosity on shear rate, thus accurately representing inelastic viscous effects in shear flows, we see that they are often used outside their range of validity. Here, we wish to devise the next simplest model, on a subsequent level of complexity, in which shear deformations are represented by a quasi-standard GNF model (except that viscosity is calculated as $\eta (\dot{\gamma })$ and not $\eta ({\dot{\gamma }_D})$) and elongational deformations are represented also by a GNF-like model in a suitable reference frame. With this approach some ‘elastic’ effects can be predicted by the model, namely those related to the existence of an elongational component of the viscosity raising suddenly when elongation rate is increased above a certain threshold (we refer to this as strain hardening). In the next section we describe our approach and the anisotropic model with all details.

2. Proposed anisotropic model

In this paper we shall consider only 2-D flows, for the reasons already alluded to in the Introduction, however, the ideas can be extended to the 3-D case without too much complexity. Given a velocity field $\boldsymbol{u}(x,y)$, obtained in the course of a certain flow simulation, we construct the respective rate-of-deformation tensor in the fixed frame using a Cartesian coordinate system $(x,y)$, with Cartesian velocity components $\boldsymbol{u} = (u,v)$

(2.1) \begin{equation}\boldsymbol{D} = \left[ {\begin{array}{@{}cc@{}} {{D_{xx}}}&{{D_{xy}}}\\ {{D_{yx}}}&{{D_{yy}}} \end{array}} \right] = \left[ {\begin{array}{@{}cc@{}} {\dfrac{{\partial u}}{{\partial x}}}&{\dfrac{1}{2}\left( {\dfrac{{\partial u}}{{\partial y}} + \dfrac{{\partial v}}{{\partial x}}} \right)}\\ {\dfrac{1}{2}\left( {\dfrac{{\partial v}}{{\partial x}} + \dfrac{{\partial u}}{{\partial y}}} \right)}&{\dfrac{{\partial v}}{{\partial y}}} \end{array}} \right].\end{equation}

Now, a starting assumption for our model is that it should be possible to find a suitable local reference frame, by an appropriate rotation of the fixed frame, in which we can identify the shear ($\dot{\gamma }$) and elongation ($\dot{\varepsilon }$) rates of deformation. If vector and tensor components in that new frame are indicated by single primes, then the rate-of-deformation tensor becomes either

(2.2a) \begin{equation}\boldsymbol{D^{\prime}} = \left[ {\begin{array}{@{}cc@{}} {{D^{\prime}_{xx}}}&{{D^{\prime}_{xy}}}\\ {{D^{\prime}_{yx}}}&{{D^{\prime}_{yy}}} \end{array}} \right] = \left[ {\begin{array}{@{}cc@{}} 0&{{\textstyle{1 \over 2}}\dot{\gamma } + \dot{\varepsilon }}\\ {{\textstyle{1 \over 2}}\dot{\gamma } + \dot{\varepsilon }} & 0 \end{array}} \right]\end{equation}

or

(2.2b) \begin{equation}= \left[ {\begin{array}{@{}cc@{}} {{{\dot{\varepsilon }}_1}}&{{\textstyle{1 \over 2}}\dot{\gamma } + {{\dot{\varepsilon }}_2}}\\ {{\textstyle{1 \over 2}}\dot{\gamma } + {{\dot{\varepsilon }}_2}}&{ - {{\dot{\varepsilon }}_1}} \end{array}} \right],\end{equation}

depending on the specific choice of the suitable reference frame; in both cases, it is assumed that the ${D^{\prime}_{ij}}$ can be easily related to $\dot{\gamma }$ and $\dot{\varepsilon }$ (in 2.2b the total elongation rate is given by $\dot{\varepsilon } = \sqrt {\dot{\varepsilon }_1^2 + \dot{\varepsilon }_2^2} $). As we will show below, in (2.2a) $\boldsymbol{D^{\prime}}$ is written in the pure-shear frame, the one which will be followed for our model; in (2.2b) $\boldsymbol{D^{\prime}}$ is written in the streamline frame, which looked plausible at the initial stage of this work but was found to give erroneous results. These issues are analysed in the next sub-section.

Our approach is based on two steps. Firstly, we will be concerned with identifying the local shear and elongational components of the flow, as discussed above. Secondly, the elongational component is brought back from an appropriate local basis where it was identified to the original Cartesian basis and a GNF-type model is implemented dealing separately with the shear flow component, which is treated as a truly GNF contribution, and an additional elongational correction, which in the Cartesian coordinate system of the fixed frame does not entirely appear as a GNF contribution.

2.1. Identification of shear and elongational components (step 1)

In principle this could be done in several ways, all based on transformation of the rate-of-deformation tensor, which is a real and symmetric tensor, into a local reference frame where a shear flow and an extensional flow may be identified. An intuitive approach is to define a streamline basis locally tangent to the velocity vector, as done for example by Tseng (Reference Tseng2020); the corresponding transformed rate-of-deformation tensor has then the form (2.2b) (Tseng did not include the ${\dot{\varepsilon }_2}$ contribution in 2.2b). However, we could not find any effective way of obtaining the rate of shear $\dot{\gamma }$ following this approach.

For this reason, we decided to abandon the streamline approach and followed the approach of Kolar (Reference Kolar2007) who, in a work whose main objective was related to vortex identification in complex flows, has developed a method which allows extraction of the shear and elongation rates we need here. Kolar's triple-decomposition method in a general 3-D case consists first of decomposing the velocity gradient tensor into shear and residual parts ($\boldsymbol{L} = {\boldsymbol{L}_S} + {\boldsymbol{L}_{Res}}$) with ${\boldsymbol{L}_S}$ having a matrix structure such that some of the off-diagonal components are the largest possible and the diagonal components are zero (${({L_S})_{ij}} = {s_{ij}}\,\textrm{Max}[(|{{L_{ij}}} |- |{{L_{ji}}} |),0]$ with ${s_{ij}} = \textrm{sign}({L_{ij}})$). The components of ${\boldsymbol{L}_S}$ cannot, however, be immediately determined using these expressions in the Cartesian frame. Kolar recognised that an ‘effective’ shear rate must be defined in such a way that it minimises the norm of ${\boldsymbol{L}_{Res}}$, and this only occurs in a particular frame, named the basic reference frame (BRF) by Kolar. Such a frame is characterised by an orthonormal rotation matrix $\boldsymbol{R}$ defining its orientation relative to the fixed frame and allowing transformation of vectors and tensors using standard tensorial rules

(2.3a,b)\begin{equation}\boldsymbol{u^{\prime}} = \boldsymbol{R}\boldsymbol{u}\quad \textrm{and}\quad \boldsymbol{L^{\prime}} = \boldsymbol{R}\boldsymbol{L}{\boldsymbol{R}^T}.\end{equation}

To find this frame a time-consuming search must be undertaken by systematic changing the angles in the expressions for the components of $\boldsymbol{R}$, obtaining $\boldsymbol{L^{\prime}}$ from (2.3) and calculating ${\boldsymbol{L}^{\prime}_{Res}}$ (the expressions for this are ${({L^{\prime}_{Res}})_{ij}} = {s_{ij}}\,\textrm{Min[}|{{L^{\prime}_{ij}}} |,|{{L^{\prime}_{ji}}} |\textrm{]}$) and its norm in any of the rotated frames, until one arrives at a point where the norm attains its minimum value and the corresponding $\boldsymbol{R}$ defines the BRF. Both shear and residual components are calculated in this frame, and ${\boldsymbol{L}^{\prime}_{Res}}$ is further decomposed into symmetric and unsymmetric parts, which are identified respectively as the elongational ${\boldsymbol{L}^{\prime}_E}$ and rotational ${\boldsymbol{L}^{\prime}_R}$ components of the velocity gradient. At that stage we have the triple decomposition in the BRF, $\boldsymbol{L^{\prime}} = {\boldsymbol{L}^{\prime}_S} + {\boldsymbol{L}^{\prime}_E} + {\boldsymbol{L}^{\prime}_R}$, and any of the components may then be transformed back to the fixed frame using the inverse of (2.3).

Fortunately, Kolar has also shown that for the 2-D case finding such a frame is straightforward and requires little computational cost. The main point of Kolar's method to this subsection is that $\dot{\gamma }$ and $\dot{\varepsilon }$ may be easily obtained in a reference frame where the rate-of-deformation tensor has a purely shearing representation (in that frame the only non-zero components of $\boldsymbol{D}$ are ${D^{\prime}_{xy}} = {D^{\prime}_{yx}}$ as in 2.2a). This special frame, the BRF of Kolar, is obtained by first rotating the Cartesian axes by the principal angle of $\boldsymbol{D}$, so that $\boldsymbol{D}$ will then be represented by a diagonal tensor with its eigenvalues in the main diagonal, followed by a second rotation of $- 45^\circ$, to bring back the tensor to a pure-shear representation. Note that in some texts of elasticity the term ‘pure shear’ means a planar elongational flow; we shall not use pure shear in that sense.

To make the situation more understandable one can consider a simple shear flow with the shear axes coincident with the fixed Cartesian axes, so that the usual unit vectors $(\boldsymbol{i},\boldsymbol{j})$ of the Cartesian system also define the shear and shear-rate directions. The velocity vector is then $\boldsymbol{u} = (\dot{\gamma }y)\boldsymbol{i}$ with $\dot{\gamma } = \textrm{d}u/\textrm{d}y$ and so the velocity gradient and the rate-of-deformation tensors in that Cartesian coordinate system are given by

(2.4)\begin{equation}\boldsymbol{L} = \left[ {\begin{array}{@{}cc@{}} 0&{\dot{\gamma }}\\ 0& 0 \end{array}} \right] \Rightarrow \boldsymbol{D} = \frac{1}{2}(\boldsymbol{L} + {\boldsymbol{L}^T}) = \left[ {\begin{array}{@{}cc@{}} 0&{\dot{\gamma }/2}\\ {\dot{\gamma }/2}& 0 \end{array}} \right].\end{equation}

If the axes are rotated by $+ 45^\circ$ the rate of deformation becomes diagonal and the same shear flow is represented by a pure straining motion with rate of strain $\dot{\varepsilon } = \dot{\gamma }/2$. Hence the rate-of-deformation tensor in those principal axes (denoted by index p) becomes

(2.5)\begin{equation}{\boldsymbol{D}_p} = \left[ {\begin{array}{@{}cc@{}} {\dot{\varepsilon }}& 0\\ 0&{ - \dot{\varepsilon }} \end{array}} \right] = \left[ {\begin{array}{@{}cc@{}} {{\textstyle{1 \over 2}}\dot{\gamma }}& 0\\ 0&{ - {\textstyle{1 \over 2}}\dot{\gamma }} \end{array}} \right].\end{equation}

This well-known result serves to justify that if a tensor is diagonal in a certain basis, when that basis is rotated by ${\mp} 45^\circ$ a pure-shear representation will be obtained. In this sense, we see that a reversion of the last 45° rotation, brings any diagonal tensor back to a pure-shear representation.

Batchelor (Reference Batchelor1967, pp. 83–84) had already discussed the problem of representing any local deformation as the superposition of an isotropic expansion (not relevant for the incompressible fluid case), a simple shearing flow and a solid-body rotation, and in the 2-D case he arrived at the same reference frame as the BRF of Kolar. Batchelor also discusses the general 3-D case and he seems to arrive at a representation of $\boldsymbol{D}$ (the only non-zero entries are ${D_{xy}} = {D_{yx}}$ and ${D_{yz}} = {D_{zy}}$) which is the same of that for a general shear flow in the shear axes (e.g. Bird et al. Reference Bird, Armstrong and Hassager1987, p. 166). However, Batchelor did not consider the problem of extracting shear and elongational components from the non-zero entries of $\boldsymbol{D}$ in those particular reference frames, either in two or in three dimensions.

From these considerations, and after combining the two rotations mentioned above (one to the principal axes and another of $- 45^\circ$ in relation to the first), we deduce that the orthonormal matrix that defines the pure-shear frame is

(2.6) \begin{align} \boldsymbol{R} & = {\boldsymbol{R}_{( - 45^\circ )}}{\boldsymbol{R}_{{\theta _p}}} = \left[ {\begin{array}{@{}cc@{}} {{\textstyle{{\sqrt 2 } \over 2}}}&{ - {\textstyle{{\sqrt 2 } \over 2}}}\\ {{\textstyle{{\sqrt 2 } \over 2}}}&{{\textstyle{{\sqrt 2 } \over 2}}} \end{array}} \right]\left[ {\begin{array}{@{}cc@{}} {\textrm{cos}\,{\theta_p}}&{\textrm{sin}\,{\theta_p}}\\ { - \textrm{sin}\,{\theta_p}}&{\textrm{cos}\,{\theta_p}} \end{array}} \right]\nonumber\\ & = \left[ {\begin{array}{@{}cc@{}} {{\textstyle{{\sqrt 2 } \over 2}}(\textrm{cos}\,{\theta_p} + \textrm{sin}\,{\theta_p})}&{{\textstyle{{\sqrt 2 } \over 2}}(\textrm{sin}\,{\theta_p} - \textrm{cos}\,{\theta_p})}\\ { - {\textstyle{{\sqrt 2 } \over 2}}(\textrm{sin}\,{\theta_p} - \textrm{cos}\,{\theta_p})}&{{\textstyle{{\sqrt 2 } \over 2}}(\textrm{cos}\,{\theta_p} + \textrm{sin}\,{\theta_p})} \end{array}} \right], \end{align}

where ${\theta _p}$ is the angle of the principal axes in relation to the original Cartesian frame

(2.7)\begin{equation}{\theta _p} = \frac{1}{2}\,\textrm{arctan}\left( {\frac{{{D_{xy}}}}{{{D_{xx}}}}} \right)\end{equation}

being defined in the range $- {\textstyle{1 \over 4}}{\rm \pi} $, $+ {\textstyle{1 \over 4}}{\rm \pi} $. In the local reference frame, the rate-of-deformation tensor is decomposed into a simple shear deformation (index S), with shear rate $\dot{\gamma }$, and a planar elongation (index E), with elongational rate $\dot{\varepsilon }$

(2.8) \begin{equation}\boldsymbol{D^{\prime}} = \boldsymbol{D}^{\prime}_S + \boldsymbol{D}^{\prime}_E \equiv \left[ {\begin{array}{@{}cc@{}} 0&{{\textstyle{1 \over 2}}\dot{\gamma }}\\ {{\textstyle{1 \over 2}}\dot{\gamma }}& 0 \end{array}} \right] + \left[ {\begin{array}{@{}cc@{}} 0&{\dot{\varepsilon }}\\ {\dot{\varepsilon }}& 0 \end{array}} \right] = \left[ {\begin{array}{@{}cc@{}} 0&{{\textstyle{1 \over 2}}\dot{\gamma } + \dot{\varepsilon }}\\ {{\textstyle{1 \over 2}}\dot{\gamma } + \dot{\varepsilon }}& 0 \end{array}} \right].\end{equation}

Thus we recover the representation (2.2a) given at the start of this section. By identifying the appropriate components of $\boldsymbol{D^{\prime}}$ (cf. 2.2a) with those resulting from the transformation of $\boldsymbol{D}$ to the pure-shear basis, we obtain

(2.9)\begin{equation}\dot{\gamma }/2 + \dot{\varepsilon } = {D^{\prime}_{xy}} = [2\,\textrm{cos}\,{\theta _p}\,\textrm{sin}\,{\theta _p}{D_{xy}} + {\textstyle{1 \over 2}}(\textrm{co}{\textrm{s}^2}\,{\theta _p} - \textrm{si}{\textrm{n}^2}\,{\theta _p})({D_{xx}} - {D_{yy}})].\end{equation}

Kolar (Reference Kolar2007) has shown that when his general triple-decomposition method is applied in two dimensions a simple physical interpretation emerges: if the flow is strain dominated, vorticity is just sufficient to equilibrate shear and the remaining part of strain is elongation; if the flow is rotation dominated, part of vorticity equilibrates shear, the remaining is the effective rotation and there is no elongation. Hence, the shear and elongational rates of (2.9) are determined from the following alternative expressions, depending on the relative sizes of $\boldsymbol{D}$ and $\boldsymbol{W}$:

(2.10a)\begin{gather}\dot{\gamma } = 2{W_{xy}}\;\textrm{and}\;\dot{\varepsilon } = |{{D^{\prime}_{xy}}} |- |{\dot{\gamma }} |/2,\quad \textrm{if}\;||\boldsymbol{D} ||> ||\boldsymbol{W} ||\;(\textrm{predominant}\;\textrm{elongational}\;\textrm{flow}),\end{gather}
(2.10b)\begin{gather}\dot{\gamma } = {\dot{\gamma }_D}\;\textrm{and}\;\dot{\varepsilon } = 0,\qquad\qquad\qquad\ \ \ \ \textrm{if}\;||\boldsymbol{D} ||\le ||\boldsymbol{W} ||\;(\textrm{predominant}\;\textrm{rotational}\;\textrm{flow}).\end{gather}

In (2.10b) an appropriate sign has to be ascribed to ${\dot{\gamma }_D}$ (we use $\dot{\gamma } = \textrm{sgn}({W_{xy}}){\dot{\gamma }_D}$); this is not indicated to avoid unnecessary complication and, anyway, since the viscosity functions to be employed are even functions of $\dot{\gamma }$ and $\dot{\varepsilon }$ their signs become unimportant except for visualisation of the respective fields.

Expressions (2.10) are important in that they allow calculation of a shear rate $\dot{\gamma }$ and an elongation rate $\dot{\varepsilon }$ which are true measures of the local type of flow and they will be used in the empirical functions to determine the shear and elongational components of the viscosity. Note that $\dot{\gamma }$ is an invariant of ${\boldsymbol{D}_S}$ ($|{\dot{\gamma }} |= \sqrt {2\,\textrm{tr}\,\boldsymbol{D}^{\boldsymbol{\prime 2}}_S}$) and $\dot{\varepsilon }$ is an invariant of ${\boldsymbol{D}_E}$ ($|{\dot{\varepsilon }} |= \sqrt { - \textrm{det}\,{{\boldsymbol{D^{\prime}}}_E}} $); the prime serves only to highlight that these invariants are easily obtained from the rotated matrices representing the tensors on the pure-shear basis – the tensors themselves are obviously entities independent of the basis on which they are evaluated.

At this point it is important to note that the use of the rate-of-rotation tensor $\boldsymbol{W}$ in (2.10), both to discriminate between the choice of what is an elongational flow compared with a rotational flow and for the prescription of the shear rate in the former case, may be problematic because that tensor is known not to be objective (e.g. Leigh Reference Leigh1968, p. 143). In fact, it is easy to show that, for a general time-dependent orthogonal matrix, $\boldsymbol{Q}(t)$, related to an arbitrary Euclidean transformation defining a change of reference frames ($\boldsymbol{x^{\prime}} = \boldsymbol{Q}(t)\boldsymbol{x} + \boldsymbol{c}(t)$), the anti-symmetric tensor $\boldsymbol{W}$ transforms as

(2.11) \begin{equation} \boldsymbol{W}^{\prime} = \boldsymbol{Q}(t)\boldsymbol{W}{\boldsymbol{Q}^T}(t) + \dot{\boldsymbol{Q}}(t){\boldsymbol{Q}^T}(t)\end{equation}

(see Leigh Reference Leigh1968, p. 146) and so the last term containing the time derivative of $\boldsymbol{Q}$ ($\dot{\boldsymbol{Q}} = \textrm{D}\boldsymbol{Q}/\textrm{D}t$) makes $\boldsymbol{W}$ non-objective. However, Haller (Reference Haller2021) has recently shown how some of the popular vortex identification methods, which typically are non-objective, may or may not be re-written under an objective framework. A particularly simple approach described by Haller is to define a volume average vorticity, as

(2.12)\begin{equation}\overline{\boldsymbol{W}} = \frac{1}{V}\int {\boldsymbol{W}\,\textrm{d}V} ,\end{equation}

where V is the volume of the computational domain, and then use a relative rate-of-rotation tensor

(2.13)\begin{equation}{\boldsymbol{W}_r} = \boldsymbol{W} - \overline {\boldsymbol{W}} ,\end{equation}

which is clearly objective according to (2.11) since the last term will cancel out. Kolar's method is then modified, by re-writing the velocity gradient decomposition as

(2.14)\begin{equation}\boldsymbol{L} = \boldsymbol{D} + {\boldsymbol{W}_r} + \overline {\boldsymbol{W}} , \end{equation}

and the equations giving the shear and elongation rates become

(2.15a)\begin{gather}\dot{\gamma } = 2{W_{r,xy}}\;\textrm{and}\;\dot{\varepsilon } = |{{D^{\prime}_{xy}}} |- {\textstyle{1 \over 2}}|{\dot{\gamma }} |,\quad \textrm{if}\;||\boldsymbol{D} ||> ||{{\boldsymbol{W}_r}} ||\;(\textrm{predominant}\;\textrm{elongational}\;\textrm{flow}),\end{gather}
(2.15b)\begin{gather}\dot{\gamma } = {\dot{\gamma }_D}\;\textrm{and}\;\dot{\varepsilon } = 0,\qquad\qquad\qquad\ \ \ \ \, \textrm{if}\;||\boldsymbol{D} ||\le ||{{\boldsymbol{W}_r}} ||\;(\textrm{predominant}\;\textrm{rotational}\;\textrm{flow}),\end{gather}

which will here substitute the original proposal of Kolar (expressions 2.10a,b). Again, and as commented above, ${\dot{\gamma }_D}$ in (2.15b) should be accompanied by a sign, e.g. $\textrm{sgn}({W_{r,xy}}){\dot{\gamma }_D}$. In practical terms, the volume average vorticity tensor $\overline {\boldsymbol{W}} $ may be calculated, or evaluated, at the start of the algorithm for obtaining the flow field, and since its components in the fixed Cartesian frame are constants (over the whole domain) they are stored and used when required along that algorithm.

In the next section we explain the main point of our proposal for a simple non-Newtonian viscosity model integrating the well-known fact that shear and elongational viscosities tend to be different in polymeric liquids.

2.2. A shear GNF model plus an elongational correction (step 2)

The second part of the model is where we depart from previous proposals, typically based on the notion of a flow type indicator (e.g. Larson Reference Larson1988, p. 253), a scalar function of $\boldsymbol{L} = \boldsymbol{D} + \boldsymbol{W}$ that serves to classify a flow as elongational, shear or rotational, in an average sense. A recent and comprehensive review of such inelastic models can be found in Poole (Reference Poole2023); most of them basically follow the standard GNF expression (1.3), with an effective viscosity evaluated as a weighted average of shear $\eta ({\dot{\gamma }_D})$ and elongational viscosities ${\eta _{el}}({\dot{\varepsilon }_D})$, ${\eta _{eff}} = (1 - f)\eta + f{\eta _{el}}$. The weight ( $f$) used in those expressions is either the flow type parameter itself (a popular choice being $\xi = (||\boldsymbol{D} ||- ||\boldsymbol{W} ||)/(||\boldsymbol{D} ||+ ||\boldsymbol{W} ||)$, see Poole Reference Poole2023, Reference Poole2024) or some function of it, but there is no rigorous justification for such average viscosity formulae. In addition, the viscosity in those GNF models is taken as a function of the second and third invariants of $\boldsymbol{D}$ as indicated above, with an extension rate usually defined as ${\dot{\varepsilon }_D} = 3{I_{3,D}}/( - {I_{2,D}})$ and ${\dot{\gamma }_D} = 2{( - {I_{2,D}})^{1/2}}$ as before (1.6), and so the extensional effects are related to the third invariant but the problem is that ${I_{3,D}} = 0$ in planar flows. Debbaut & Crochet (Reference Debbaut and Crochet1988) followed a different approach, dispensing with the weighted viscosity and using instead a combined viscosity function $\eta ({\dot{\gamma }_D},{\dot{\varepsilon }_D})$, in a very interesting paper, perhaps the first to show through numerical simulations the direct influence of elongational viscosity on vortex enhancement and excess pressure drop for an axisymmetric contraction. However, at the end of the paper they remarked ‘the models have limited applicability since the effect of ${I_3}$ disappears in plane flow’; this deficiency is circumvented by the present approach.

Instead, and as discussed in the Introduction, we consider that, if a fluid element responds differently to a shearing deformation as compared with an extensional one, then the two need to be taken separately. Hence, the stress acting on a fluid element in the local reference frame, where the shear and elongational rates of deformation can be identified, is also decomposed into a shear component and an extensional component as (cf. 1.5)

(2.16)\begin{equation}\boldsymbol{\tau ^{\prime}} = \boldsymbol{\tau}^{\boldsymbol{\prime}}_S + \boldsymbol{\tau}^{\boldsymbol{\prime}}_E = 2{\eta _S}\boldsymbol{D}^{\prime}_S + 2{\eta _E}\boldsymbol{D}^{\prime}_E,\end{equation}

where the idea of GNF modelling has been applied separately to both shear and elongational components of the stress tensor in the local frame. The rate-of-deformation tensor is also considered to be made up by adding in the local frame a shear and an elongational component

(2.17a) \begin{equation}\boldsymbol{D^{\prime}} = \boldsymbol{D}^{\prime}_S + \boldsymbol{D}^{\prime}_E, \end{equation}

and is then transformed back to the fixed frame

(2.17b) \begin{align}\boldsymbol{D} = {\boldsymbol{R}^T}\boldsymbol{D^{\prime}}\boldsymbol{R} = {\boldsymbol{R}^T}(\boldsymbol{D}^{\prime}_S + \boldsymbol{D}^{\prime}_E)\boldsymbol{R} = {\boldsymbol{R}^T}\boldsymbol{D}^{\prime}_S\boldsymbol{R} + {\boldsymbol{R}^T}\boldsymbol{D}^{\prime}_E\boldsymbol{R} = {\boldsymbol{D}_S} + {\boldsymbol{D}_E},\end{align}

where the distributive property of matrix product has been utilised. In the same way, the stress in the original fixed frame becomes

(2.18a)\begin{gather}\boldsymbol{\tau } = {\boldsymbol{\tau }_S} + {\boldsymbol{\tau }_E} = 2{\eta _S}{\boldsymbol{D}_S} + 2{\eta _E}{\boldsymbol{D}_E} = 2{\eta _S}\boldsymbol{D} + \underline {2({\eta _E} - {\eta _S}){\boldsymbol{D}_E}} ,\end{gather}
(2.18b)\begin{gather}\equiv {\tilde{\boldsymbol{\tau }}_S} + {\tilde{\boldsymbol{\tau }}_E},\end{gather}

an operation only allowed provided ${\eta _S}$ and ${\eta _E}$ are functions of the invariants of each rate-of-deformation tensor separately, as they are by construction. In the last expression for the stress tensor in (2.18a) we have used the decomposition given in (2.17b) (namely ${\boldsymbol{D}_S} = \boldsymbol{D} - {\boldsymbol{D}_E}$) and we end up with a (almost) standard GNF model having a viscosity based solely on the local shear properties of the flow, and an additional term shown underlined in (2.18a) (it will be denoted ${\tilde{\boldsymbol{\tau }}_E}$ as indicated in 2.18b) which takes into account the local flow extensional properties. To use this expression, we need ${\boldsymbol{D}_E}$ explicitly

(2.19) \begin{align} {\boldsymbol{D}_E} & = {\boldsymbol{R}^T}\boldsymbol{D}^{\boldsymbol{\prime}}_E\boldsymbol{R} = \left[ {\begin{array}{@{}cc@{}} {(\textrm{co}{\textrm{s}^2}\,{\theta_p} - \textrm{si}{\textrm{n}^2}\,{\theta_p})\dot{\varepsilon }}&{2\,\textrm{cos}\,{\theta_p}\,\textrm{sin}\,{\theta_p}\dot{\varepsilon }}\\ {2\,\textrm{cos}\,{\theta_p}\,\textrm{sin}\,{\theta_p}\dot{\varepsilon }}&{ - (\textrm{co}{\textrm{s}^2}\,{\theta_p} - \textrm{si}{\textrm{n}^2}\,{\theta_p})\dot{\varepsilon }} \end{array}} \right]\nonumber\\ & = \dot{\varepsilon }\left[ {\begin{array}{@{}cc@{}} {({c^2} - {s^2})}&{2cs}\\ {2cs}&{ - ({c^2} - {s^2})} \end{array}} \right], \end{align}

with $c = \textrm{cos}\,{\theta _p}$ and $s = \textrm{sin}\,{\theta _p}$. We note from this expression that the elongational component of the rate-of-deformation tensor written in the original Cartesian basis is symmetric, as it should, it has a zero trace, on account of incompressibility, and that its determinant is given by $\textrm{det}\,{\boldsymbol{D}_E} ={-} ({\dot{\varepsilon }^2})({c^4} + {s^4} + 2{c^2}{s^2}) ={-} {\dot{\varepsilon }^2}$(since ${({c^2} + {s^2})^2} = 1$), thus confirming the invariancy of $\dot{\varepsilon }$.

The Cartesian components of the extensional correction to the stress (from 2.18b)

(2.20)\begin{equation}{\tilde{\boldsymbol{\tau }}_E} = 2({\eta _E} - {\eta _S}){\boldsymbol{D}_E} \equiv 2{\tilde{\eta }_E}{\boldsymbol{D}_E},\end{equation}

are then (from 2.19)

(2.21) \begin{equation}\left. {\begin{array}{c@{}} {{{({{\tilde{\tau }}_{xx}})}_E} = 2({\eta_E}(\dot{\varepsilon }) - {\eta_S}(\dot{\gamma }))[({c^2} - {s^2})\dot{\varepsilon }],}\\ {{{({{\tilde{\tau }}_{yy}})}_E} = 2({\eta_E}(\dot{\varepsilon }) - {\eta_S}(\dot{\gamma }))[({s^2} - {c^2})\dot{\varepsilon }] ={-} {{({{\tilde{\tau }}_{xx}})}_E},}\\ {{{({{\tilde{\tau }}_{xy}})}_E} = 2({\eta_E}(\dot{\varepsilon }) - {\eta_S}(\dot{\gamma }))[(2cs)\dot{\varepsilon }].} \end{array}} \right\}\end{equation}

In (2.16) and (2.20) it is tacitly assumed that the viscosity function can be separated as

(2.22a)\begin{equation}\eta \equiv \eta (\dot{\gamma },\dot{\varepsilon }) = {\eta _S}(\dot{\gamma }) + {\tilde{\eta }_E}(\dot{\varepsilon }),\end{equation}

where the shear component of the viscosity is defined by

(2.22b)\begin{equation}{\eta _S} \equiv {\eta _S}(\dot{\gamma }) = \eta (\dot{\gamma },\dot{\varepsilon } = 0),\end{equation}

and the additional elongational component by

(2.22c)\begin{equation}{\tilde{\eta }_E} \equiv {\tilde{\eta }_E}(\dot{\varepsilon }) = \eta (\dot{\gamma },\dot{\varepsilon }) - {\eta _S}(\dot{\gamma })\quad \textrm{or}\quad {\eta _E} = \eta (\dot{\gamma } = Cte,\dot{\varepsilon }).\end{equation}

It is implicit in such assumption that shear is the dominant mechanism responsible for interaction and momentum transfer between fluid elements, that is, shear viscosity is taken as the ‘glue’ that sticks the fluid together. Elongational flow, on the other hand, occurs with significant magnitude only in certain limited regions of the flow domain. The specific form of the viscosity functions ${\eta _S}(\dot{\gamma })$ and ${\tilde{\eta }_E}(\dot{\varepsilon })$ will be given in the next section. Also, it should be clear that ${\tilde{\eta }_E}$ is not the commonly defined elongational viscosity (which is ${\eta _{el}} = ({\tau _{xx}} - {\tau _{yy}})/\dot{\varepsilon }$ in a stretching flow along x, e.g. Tanner Reference Tanner1988); rather, ${\tilde{\eta }_E}$ is the viscosity in a purely elongational flow.

To summarise, the model described is based on a decomposition of the velocity gradient tensor into two rates-of-deformation tensors, one linked to shearing (index $S$) and the other to elongational (index $E$) deformations, and a rate of solid-body rotation tensor (index $R$), which does not contribute to deformation of fluid elements and was not considered above. If we want also to have the rate of solid-body rotation, which may be important to identify portions of fluid in coherent spiral motion (true ‘vortices’), we write

(2.23)\begin{equation}\boldsymbol{L} = \boldsymbol{D} + {\boldsymbol{W}_r} + \overline {\boldsymbol{W}} = ({\boldsymbol{D}_S} + {\boldsymbol{D}_E}) + ({\boldsymbol{W}_{r,S}} + {\boldsymbol{W}_{r,R}}) + \overline {\boldsymbol{W}} ,\end{equation}

where

(2.24) \begin{equation}{\boldsymbol{W}_r} = \boldsymbol{W} - \overline {\boldsymbol{W}} = \left[ {\begin{array}{@{}cc@{}} 0&{{W_{xy}} - {{\overline W }_{xy}}}\\ { - ({W_{xy}} - {{\overline W }_{xy}})}& 0 \end{array}} \right] \equiv \left[ {\begin{array}{@{}cc@{}} 0&{{W_{r,xy}}}\\ { - {W_{r,xy}}}& 0 \end{array}} \right], \end{equation}

is an anti-symmetric tensor and so its matrix remains unchanged upon a change of basis. In (2.23) the relative rate-of-rotation tensor ${\boldsymbol{W}_r}$ was decomposed into two relative rotation tensors, one due to shear ${\boldsymbol{W}_{r,S}}$ and the other representing (true) rotation as a solid body ${\boldsymbol{W}_{r,R}}$. Both retain the same matrix (their components do not change) when the axes are rotated, and the off-diagonal component of the latter is the one we wish to determine. This is done in the pure-shear frame where the identification becomes immediate

(2.25)\begin{equation}{\boldsymbol{W}^{\prime}_{r,R}} = {\boldsymbol{W}^{\prime}_r} - {\boldsymbol{W}^{\prime}_{r,S}}\quad \Rightarrow \quad - \dot{\omega } = W^{\prime}_{{r,xy}} - W^{\prime}_{{rS,xy}} = \frac{1}{2}\left( {\frac{{\partial u}}{{\partial y}} - \frac{{\partial v}}{{\partial x}}} \right) - \frac{1}{2}\dot{\gamma },\end{equation}

where $\dot{\omega }$ is the z-component (in two dimensions) of the solid-body rate-of-rotation vector or angular velocity vector ($\dot{\boldsymbol{\omega }}$). Note that this vector is defined with the opposite sign of the corresponding entry in the rate-of-rotation tensor (in two dimensions) thus the minus sign in the left term of (2.25); generally, in three dimensions, ${\dot{\omega }_i} ={-} {\textstyle{1 \over 2}}{\varepsilon _{ijk}}{W_{jk}}$. Also, the vorticity vector, $\boldsymbol{\omega } = \boldsymbol{\nabla } \times \boldsymbol{u}$, often employed instead of the angular velocity vector, is the double of the latter, so ${\omega _z} = 2\dot{\omega }$ for the z-component of the vorticity.

3. Numerical aspects and viscosity functions

In this section we first explain how a standard Navier–Stokes solver is affected by the present anisotropic viscosity model and then we describe the functions used to represent both the shear and the elongational viscosities.

3.1. Numerical aspects

Some parts of the additional extensional stress ${\tilde{\boldsymbol{\tau }}_E}$ (2.20) lead to viscosity-like terms (in the sense of implying a positive viscosity coefficient) but if these terms are interpreted as a viscosity then the model has an anisotropic viscosity coefficient. This is visible if the elongation rate $\dot{\varepsilon }$ of (2.15a) (if 2.15b is the valid relation, then we have standard GNF equations without additional ${\tilde{\boldsymbol{\tau }}_E}$ terms) is introduced into the additional stress components of expressions (2.21)

(3.1a)\begin{gather}{({\tilde{\tau }_{xx}})_E} = 2{\tilde{\eta }_E}\left[ {\underline {{{({c^2} - {s^2})}^2}} \frac{{\partial u}}{{\partial x}} + cs({c^2} - {s^2})\left( {\frac{{\partial u}}{{\partial y}} + \frac{{\partial v}}{{\partial x}}} \right) - ({c^2} - {s^2})\frac{1}{2}\left( {\frac{{\partial u}}{{\partial y}} - \frac{{\partial v}}{{\partial x}}} \right)} \right],\end{gather}
(3.1b)\begin{gather}{({\tilde{\tau }_{yy}})_E} = 2{\tilde{\eta }_E}\left[ {\underline {{{({c^2} - {s^2})}^2}} \frac{{\partial v}}{{\partial y}} - cs({c^2} - {s^2})\left( {\frac{{\partial u}}{{\partial y}} + \frac{{\partial v}}{{\partial x}}} \right) + ({c^2} - {s^2})\frac{1}{2}\left( {\frac{{\partial u}}{{\partial y}} - \frac{{\partial v}}{{\partial x}}} \right)} \right],\end{gather}
(3.1c)\begin{gather}{({\tilde{\tau }_{xy}})_E} = 2{\tilde{\eta }_E}\left[ {({c^2} - {s^2})2cs\frac{{\partial u}}{{\partial x}} + \underline {2{c^2}{s^2}} \left( {\frac{{\partial u}}{{\partial y}} + \frac{{\partial v}}{{\partial x}}} \right) - cs\left( {\frac{{\partial u}}{{\partial y}} - \frac{{\partial v}}{{\partial x}}} \right)} \right].\end{gather}

The underlined terms in these equations are positive and may be interpreted as effective viscosities, but while such effective viscosity for the normal additional extensional stress is $\tilde{\eta }_{E,ef}^n = ({\eta _E} - {\eta _S}){({c^2} - {s^2})^2}$, it will take a different value for the tangential additional extensional stress, $\tilde{\eta }_{E,ef}^t = 4({\eta _E} - {\eta _S}){c^2}{s^2}$. Therefore, overall, we have an anisotropic GNF model with extra extensional-related terms (those not underlined in (3.1), which cannot fit into a GNF model). We note that this interpretation is valid for fluids with ${\eta _E} \ge {\eta _S}$, that is fluids that are either shear thinning and strain thickening, or shear thinning but with a constant elongational viscosity, or finally having both viscosities diminishing with either $\dot{\gamma }$ or $\dot{\varepsilon }$ but with the elongational viscosity being equal to, or higher, than the shear viscosity.

In terms of boundary conditions, the only relevant one is that concerned with the additional extensional stress at a solid wall, where the no-slip condition is applied to the velocity vector. Suppose the wall is along the $x$-coordinate; then the tangential unit vector has ${n_x} = 1$ and ${n_y} = 0$, that is ${\theta _p} = {\rm \pi}/4$ and $c = s = \sqrt 2 /2$, so that (2.21) gives

(3.2ac)\begin{equation}{({\tilde{\tau }_{xx}})_E} = 0,\quad {({\tilde{\tau }_{yy}})_E} = 0,\quad {({\tilde{\tau }_{xy}})_E} = 2({\eta _E} - {\eta _S})cs(2cs - 1)\frac{{\partial u}}{{\partial y}} = 0.\end{equation}

Then we see that the extensional component of the stress does not contribute to a shear stress at a solid wall (${\tilde{\tau }_{xy,E}} = 0$ because $2cs = 2{\textstyle{1 \over 2}}\sqrt 2 {\textstyle{1 \over 2}}\sqrt 2 = 1$ and the no-slip condition implies $\partial v/\partial x = 0$ for a wall along x) and the normal components are also both zero (${\tilde{\tau }_{xx,E}} = {\tilde{\tau }_{yy,E}} = 0$ because ${c^2} = {s^2} = 1/4$ in (3.1) so that ${c^2} - {s^2} = 0$).

The full set of governing equations is described in more detail in Appendix A, mainly with view to contrast them against the Navier–Stokes equations for a fluid with variable viscosity. Those equations were solved with a time-marching finite-volume method which has been employed in many studies involving Newtonian fluids, purely inelastic non-Newtonian fluids and, mainly, viscoelastic fluids obeying several differential constitutive equations; a number of relevant references in Alves, Oliveira & Pinho (Reference Alves, Oliveira and Pinho2021) may be consulted for a more comprehensive explanation of the method and its application.

3.2. Viscosity functions

To obtain a standard GNF model and to represent the increase of elongational viscosity with elongation rate (here designated as strain hardening) we use the functions

(3.3)\begin{gather}{\eta _S} = {\eta _\infty } + ({\eta _0} - {\eta _\infty }){[1 + {({\lambda _s}\dot{\gamma })^2}]^{(n - 1)/2}},\end{gather}
(3.4)\begin{gather}{\eta _E} = {\eta _0}[1 + {\textstyle{1 \over 4}}(Tr - 4)\,\textrm{tanh}{({\lambda _e}\dot{\varepsilon })^2}] + {\eta _S} - {\eta _0}.\end{gather}

The first is simply a Carreau model for a shear-thinning fluid ($n \le 1$), where ${\eta _0}$ is the zero-shear-rate viscosity, ${\eta _\infty }$ is the infinite-shear-rate viscosity, n is a power-law index ($n = 1$ gives the Newtonian case) and ${\lambda _s}$ is a time constant defined as the inverse of a characteristic shear rate beyond which the viscosity starts decreasing. The elongational component of the viscosity (3.4) was proposed by Poole (Reference Poole2023) and gives a relatively fast increase of the elongational viscosity from the inelastic value up to a plateau defined by the parameter $Tr$, which represents the usual Trouton ratio (${T_r}(\dot{\varepsilon }) \equiv {\eta _{el}}(\dot{\varepsilon })/\eta (\dot{\gamma }) = 4{\eta _E}/{\eta _S}$ for the present planar elongational flow) at large elongation rate. If $Tr = 4$ the fluid is inelastic having ${\eta _E} = {\eta _S}$ (it may be shear thinning), and if in addition $n = 1$ the fluid is Newtonian with constant viscosity, ${\eta _E} = {\eta _S} = {\eta _0}$. The parameter ${\lambda _e}$ is a time constant defining the elongation rate (equal to $\lambda _e^{ - 1}$) for inception of strain hardening; in most cases we have used ${\lambda _e} = {\lambda _s}$ for simplicity. Limited experimental measurements show that this is approximately the case, at least for polystyrene melts, since the decay of shear viscosity tends to occur at the same shear rate as the strain rate when elongational viscosity starts to rise (e.g. Bird et al. Reference Bird, Armstrong and Hassager1987, p. 132).

We note that the last two terms in (3.4) have been added so that the right physical limits are obtained for Newtonian and inelastic GNF fluids. The important elongational-related viscosity, in (2.18) to (2.21), is then

(3.5)\begin{equation}{\tilde{\eta }_E} \equiv ({\eta _E} - {\eta _S}) = {\eta _0}{\textstyle{1 \over 4}}(Tr - 4)\,\textrm{tanh}{({\lambda _e}\dot{\varepsilon })^2},\end{equation}

which is zero if $Tr = 4$ (inelastic fluid).

Figure 1 shows the variation of the shear-viscosity function with shear rate and the elongational viscosity function with elongation rate. In panel (a) we see that the Carreau model (here shown with ${\eta _\infty } = 0$) becomes more shear thinning as n decreases, as expected, but the value of the dimensionless parameter ${\lambda _s}\dot{\gamma }$ for shear thinning to start is approximately 0.2, and ${\lambda _s}\dot{\gamma } = 1$ gives already a viscosity in the constant decay-rate range; note that we use a linear–log scale contrary to the more classical log–log representation. Similar comments apply to the additional elongational viscosity plot, with ${\lambda _e}\dot{\gamma } = 1$ corresponding already to a situation of almost full elongation for which the maximum plateau viscosity value is given by ${\tilde{\eta }_{E,max}}/{\eta _0} = (Tr - 4)/4$, as indicated in the figure.

Figure 1. Functions used in the present work for the shear viscosity (a) and the additional elongational viscosity (b).

We now turn to the presentation and discussion of results with the proposed model, emphasising the ensuing differences compared with standard GNF models and current differential constitutive equations.

4. Results

Computational results here presented are from simulations with a finite-volume method of either flow through a 4:1 planar contraction (§ 4.1) or 2-D flow around a confined (§ 4.2) or unconfined (§ 4.3) cylinder. The sudden contraction and confined-cylinder geometries have been employed in numerous validation tests for viscoelastic fluid flow (see Alves et al. Reference Alves, Oliveira and Pinho2021 for a recent review).

All results are presented in terms of dimensionless quantities, with distances normalised with a length scale L, velocity components with a velocity scale U, time with a convective time scale $L/U$, viscosities with ${\eta _0}$ (its value when $\dot{\gamma } \to 0$ or $\dot{\varepsilon } \to 0$) and stresses and pressure with a more appropriate diffusive scale $({\eta _0}U/L)$. In § 4.1, L is the half-width of the smaller channel ($H$) and U is the average velocity in that channel; in § 4.2, L is the cylinder radius ($R$) and U the average velocity in the channel where the cylinder is symmetrically placed; in § 4.3, L is the cylinder diameter ($D = 2R$) and U the unperturbed upstream velocity.

4.1. Contraction flow

A planar sudden contraction geometry is considered with laminar flow from a larger inlet channel having width $2{H_1}$ and average velocity ${U_1}$ into a smaller outlet channel of width $2{H_2}$and velocity ${U_2}$ (contraction ratio is defined as $\beta = {H_1}/{H_2}$). While in this case the accumulated strain is only half of that in a corresponding axisymmetric case, it has the advantage that most works with either GNF models or even viscoelastic models having a constant shear viscosity show the presence of only relatively small corner vortices (non-dimensional sizes of ${X_R} = {x_R}/H \approx 1$), while other works (Debbaut & Crochet Reference Debbaut and Crochet1988; López-Aguilar et al. Reference López-Aguilar, Tamaddon-Jahromi, Webster and Walters2016 and references therein) with complex models point to the existence of much larger vortices and significant increased pressure drop.

For a contraction ratio of $\beta = 4$ (the benchmark value; larger values would accentuate the elongational part of the flow) the outlet channel is scaled so that its half-width is $H \equiv {H_2} = 1$ and the inlet channel has a half-width of ${H_1} = 4$. The averaged velocity in the small channel is scaled to $U \equiv {U_2} = 1$, therefore giving an average velocity at inlet of ${U_1} = {U_2}({H_2}/{H_1}) = 0.25$ which was used to prescribe the parabolic velocity-profile boundary condition at the inlet. A Reynolds number is defined as $Re = \rho UH/{\eta _0}$ based on H and U, and we set $Re = 1$ since most experimental works were performed under creeping or low Re conditions (e.g. Nigen & Walters Reference Nigen and Walters2002: $0 < Re < 0.15$; Rothstein & McKinley Reference Rothstein and McKinley1999: $0 < Re < 0.01$; Rodd et al Reference Rodd, Cooper-White, Boger and McKinley2007: $0.03 < Re < 0.6$ for the more viscous fluid) and no major differences on pressure drop and corner vortex characteristics are expected in the range $0 \le Re \le 1$. For such low Re, it is sufficient to consider a dimensionless length of ${L_2} = 5$ for the small channel and ${L_1} = 10$ for the larger (this length is controlled by the growth of the corner vortex: if this vortex becomes too large, then ${L_1}$ should be increased). A uniform and square mesh has been employed in these simulations, with mesh spacing $\varDelta x = \varDelta y = 0.05$, thus having 32 000 control volumes on the larger channel and 4000 on the small, a total of 36 000 cells. The origin of the coordinate system ($x = y = 0$) is at the entrance to the small channel, on its midline.

In the next subsections we assess the proposed model and discuss the results of the simulations for: (i) the Newtonian case, where the solution for the velocity and pressure fields is obviously independent of the viscosity model but still one may look at the underlying $\dot{\gamma }$ and $\dot{\varepsilon }$ fields; (ii) the pure elastic viscosity case without shear-thinning, where elastic effects are predominant due to the steep rise of elongational viscosity while the shear viscosity remains constant; and (iii) an inelastic case without any elastic effects, where viscosity decays with shear rate but in elongational flow it stays constant.

4.1.1. Newtonian flow

We start with the results for the Newtonian flow in the 4:1 contraction at $Re = 1$ and in particular we want to see how the newly defined shear rate and elongation rate fields differ from the classical definitions. We have decided to do the simulations using the full channel, without imposing symmetry about the mid-plane ( $y = 0$), so that possible flow asymmetries could be captured.

We show first that, even for the Newtonian velocity field, from which we can extract the shear rate ($\dot{\gamma }$) and the ‘standard’ shear rate based on the second invariant of $\boldsymbol{D}$ (${\dot{\gamma }_D}$), the respective contour plots in the domain of the 4:1 planar contraction have marked differences, as figure 2 highlights, especially near the entrance to the smaller channel where mixed shearing/elongational-flow types exist. One aspect is that $\dot{\gamma }$ can be either negative (in the upper part of the domain) or positive (lower part), whereas ${\dot{\gamma }_D}$ is positive by definition being equal to twice the magnitude of tensor $\boldsymbol{D}$. The dissimilar structures in the contour plots of shear rate seen in figure 2 imply that, for a purely inelastic liquid, the pressure drop calculated with a GNF model where the viscosity is obtained from $\eta = {\eta _S}(\dot{\gamma })$ should be different from the value obtained with a standard GNF model where $\eta = \eta ({\dot{\gamma }_D})$. Such a situation will be analysed more closely in § 4.1.3.

Figure 2. Comparison of the fields of (a) shear rate ($\dot{\gamma }$) and (b) second invariant of D (${\dot{\gamma }_D} = \sqrt {2\boldsymbol{D}:\boldsymbol{D}} $) for the Newtonian case. Contour values 0, ±0.1, 0.5, 1(1)3.

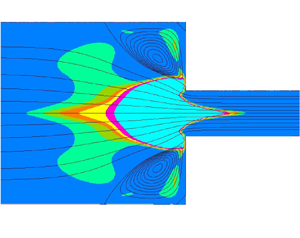
It is useful, with the Newtonian fluid, to look also at the fields of strain rate and solid-body rotation rate $\dot{\omega }$, shown in figure 3. A planar elongational flow is seen at the entrance to the smaller channel with non-dimensional strain rates $\dot{\varepsilon }$ rising from 0.1 up to approximately 0.5, and extending towards the central line of that channel; near the two re-entrant corners ($x = 0;\;y ={\pm} 1$), the flow changes from being mixed shear and elongational to pure shear (since $\dot{\varepsilon } = 0$) plus solid-body rotation ($\dot{\omega } \ne 0$); these two zones are separated by a well-defined curved line having a cusped shape, seen as the last $\dot{\varepsilon }$-contour on the right in figure 3(a). To the right of that line, the shear rate is given, in absolute value, by the second invariant $|{\dot{\gamma }} |= {\dot{\gamma }_D}$ and the elongation rate is zero. As the fluid elements turn the corners, they are not stretched, they simply rotate in a solid-body fashion, as shown in panel (b), with a positive rotation rate around the upper corner (so $\dot{\omega }$ is oriented along $+ z$) and negative in the lower corner (along $- z$). This occurs in two relatively small, confined areas, and further downstream the flow becomes a pure-shear rectilinear flow with non-homogeneous shear rate (that is, fully developed channel flow).

Figure 3. Fields of (a) strain rate $\dot{\varepsilon }$ and (b) rotation rate $\dot{\omega }$ for the Newtonian case. Just upstream of the contraction plane ${\dot{\varepsilon }_{max}} \approx 0.5$; in that zone the contours are for $\dot{\varepsilon } = 0.01$, 0.05, 0.1(0.1)0.5. Same values (±) for $\dot{\omega }$ plus ±0.001.

It is interesting to mention that when contours of $\dot{\omega } ={\pm} 0.001$ are shown in figure 3(b) the two small standing corner vortices do show up. Thus, the solid-body rotation rate identifies the corner vortices (sometimes called Moffatt eddies, Moffatt Reference Moffatt1964) as true vortices, albeit with very low magnitudes of $\dot{\omega }$, and not only as recirculating eddies.

In a 2-D planar flow it is not possible to compare the elongation rate field with an ${\dot{\varepsilon }_D}$ proportional to or representative of the third invariant of $\boldsymbol{D}$ (typically ${\dot{\varepsilon }_D} = 6\,\textrm{det}\,\boldsymbol{D}/\textrm{tr}\,{\boldsymbol{D}^2}$, e.g. Debbaut & Crochet Reference Debbaut and Crochet1988), since $\textrm{det}\,\boldsymbol{D} = 0$ (here the determinant is calculated with the complete 3-D matrix, which has a zero diagonal entry in ${D_{zz}}$).

A final comment relevant here is that the fields of elongation and shear rates have been found from contour plots like those in figure 3 to be continuous over the whole flow domain, not only for the Newtonian case as shown here, but also for the non-Newtonian cases treated in the next sections.

4.1.2. Strain-hardening fluid with constant shear viscosity

We turn now to the cases that interest us more, with a sharply increasing elongational viscosity representative of strain hardening where the maximum value is fixed by the Trouton parameter Tr in the ${\tilde{\eta }_E}$ versus $\dot{\varepsilon }$ expression (3.5) (see figure 1b). To make interpretation of the results easier in this section we keep the shear-viscosity component constant, as in a Newtonian flow – here with ‘elastic’ effects arising from the elongational viscosity component, which correspond to normal stresses in elongation.

Firstly, we define dimensionless coefficients to measure the pressure loss from the variation of pressure along the central plane and compare the pressure drop with measured data. Then we vary the time parameter of the model, ${\lambda _e}$, and see how the flow patterns (visualised by streamlines) respond to changes of Tr and ${\lambda _e}$; in particular, we are interested in the corner vortices formed upstream of the contraction. Finally, we quantify the size and intensity of those corner vortices, and the loss coefficient induced by the contraction for a range of parameters.

4.1.2.1 Pressure drop and comparison with experiments

A well-known effect of fluid elasticity in entrance flows is the increased pressure drop observed in experiments, but not predicted in simulations where viscoelasticity is modelled with common constitutive differential equations such as the Oldroyd-B or FENE-CR models (e.g. Larson Reference Larson1988; the latter model is due to Chilcott & Rallison Reference Chilcott and Rallison1988, hence the acronym CR). These two particular models predict a constant shear viscosity in simple shear flow and an abrupt increase of the elongational viscosity in steady uniaxial or planar extensional flow; in fact, for the Oldroyd-B model ${\eta _{el}}$ goes to infinity at $\lambda \dot{\varepsilon } = 0.5$ where $\lambda $ is the relaxation time of the model fluid.

Figure 4 shows the predicted pressure variation along the central plane of the contraction geometry, $y = 0$, for the Newtonian fluid and three cases of constant-shear-viscosity fluid models having strain hardening in the elongational viscosity, at $Tr = 30$ and increasing values of the dimensionless group ${\lambda _e}U/H$ (this is a kind of Weissenberg number for the present anisotropic GNF-like model with elongational viscosity). Although the smaller value ${\lambda _e}U/H = 2$ is too low to guarantee that the elongational viscosity reaches its maximum range, ${\lambda _e}U/H = 6$ is just above the threshold value that gives maximum ${\tilde{\eta }_E}$, and ${\lambda _e}U/H = 10$ is a representative large value (see next subsection). The pressure variations shown in figure 4, together with the Newtonian case to allow a visual perception of the pressure loss, which is proportional to the distance of $p(x)$ at the contraction plane ($x = 0$) to the corresponding Newtonian value, demonstrate considerable enhanced pressure drop.

Figure 4. Pressure variation along the central plane for the Newtonian fluid and three strain-hardening cases ($Tr = 30$, ${\lambda _e}U/H = 2$, 6 and 10, $n = 1$). The dashed (magenta) line on the upper part of the graph indicates the fully developed pressure decay in the inlet channel.

The local pressure drop, after discounting from the overall pressure variation $\mathrm{\Delta }p \equiv {p_1} - {p_2}$ the corresponding fully developed values in the inlet and outlet channels, gives a measure of the irreversible loss due to the contraction and is denoted $\mathrm{\Delta }{p_I} = \mathrm{\Delta }p - (\mathrm{\Delta }{p_{fd,1}} + \mathrm{\Delta }{p_{fd,2}})$ (index fd indicates fully developed conditions; indices 1 and 2 refer to the inlet and outlet channels). It was calculated either analytically (given the predicted $\varDelta p$) or with curve fitting from plots such as figure 4: the blue dashed straight line at the top of the figure is a fit to the fully developed region at the inlet; if straight lines were similarly fitted in the fully developed region at outlet, where the pressure variation becomes approximately linear, then the difference of the former fit to any of the latter, obtained at $x = 0$, would give $\varDelta {p_I}$. The analytical approach, which is perhaps easier to apply, starts from the Hagen–Poiseuille formula for fully developed channel flow ($\varDelta {p_{fd}} = 3{\eta _0}(U/H)(L/H)$; dimensional quantities), to arrive at the following theoretical result:

(4.1)\begin{equation}{C_I} \equiv \frac{{\varDelta {p_I}}}{{2{\tau _w}}} = {\textstyle{1 \over 2}}\left[ {\frac{{\varDelta p}}{{{\tau_w}}} - \left( {\frac{{{L_1}{{({\varDelta p/L} )}_{fd,1}}}}{{{\tau_w}}} + {L_2}} \right)} \right],\end{equation}

where the irreversible loss coefficient ${C_I}$ is the extra pressure drop normalised with the fully developed wall shear stress in the smaller channel (${\tau _w} = {(\Delta p/L)_{fd,2}}$). All quantities in (4.1) and in this expression for ${\tau _w}$ are non-dimensional in the usual way, as explained at the beginning of § 4.1. The parameter ${C_I}$ is sometimes called the Couette correction and physically it gives the increase in channel length (non-dimensionally) equivalent to the irreversible pressure loss due to the local change in channel cross-section. In non-Newtonian fluid mechanics, it is common practice to define a normalised loss coefficient, relatively to the loss of the corresponding Newtonian case (index $N$), as

(4.2a,b)\begin{equation}K = \Delta {p_I}/\Delta {p_{I,N}}\quad \textrm{or}\quad K = {C_I}/{C_{I,N}}.\end{equation}

These two expressions are equal for a constant-shear-viscosity model, as that used in this section. In other situations, of shear-thinning viscosity, it will be made clear which expression is used for K; the first is more fundamental to assess pressure losses.

For the Newtonian case at $Re = 1$, expression (4.1) gives ${C_{I,N}} = 0.484$ and, for the strain-hardening cases here considered, we have ${C_I} = 0.603$, 0.836 and 1.086 (for ${\lambda _e}U/H = 2$, 6 and 10, respectively). So in relative terms, the local pressure drop increases by $K = 1.246$, 1.728, 2.245, for the given ‘Weissenberg’ numbers (at Trouton parameter of 30). That is, for the two highest Wi cases we have 72.8 % and 224 % larger pressure losses than for the Newtonian fluid, a considerable increase. For completeness and to assess accuracy, under conditions of zero Reynolds number (discarding the advection terms from the equations of motion) we predict ${C_{I,N}} = 0.362$, which is 3.5 % different from the benchmark value (0.374) of Alves et al. (Reference Alves, Oliveira and Pinho2003) who used much finer meshes and based their estimation on a Richardson extrapolation procedure. Since ${C_I}$ is computed from the difference of two large and approximately equal pressure differences ($\varDelta p$ and $\varDelta {p_{fd}}$) it is therefore susceptible to mesh refinement. We have checked by redoing the simulations on other two successively refined meshes that the extrapolated value of the Newtonian loss coefficient for $Re = 0$ is the same as theirs (on a uniform mesh with half the spacing of our base mesh, we get ${C_{I,N}} = 0.368$ with $\varDelta x = 0.025$; refining once more, ${C_{I,N}} = 0.371$ with $\varDelta x = 0.0125$; extrapolating the 3 values, we find ${C_{I,N}} = 0.3745$).

Our predictions of the loss coefficient normalised with the corresponding Newtonian value (${C_I}/{C_{I,N}}$, the loss coefficient K defined in 4.2) for increasing values of the dimensionless time parameter ${\lambda _e}U/H = {\lambda _e}{\dot{\gamma }_c}$ where the characteristic shear rate is ${\dot{\gamma }_c} = {U_2}/{H_2}$, are shown in figure 5 where they are compared with the experimental data of Rothstein & McKinley (Reference Rothstein and McKinley1999). These data were obtained directly from their figure 7 plotting the dimensionless pressure drop $P = \varDelta p^{\prime}(De)/\varDelta p^{\prime}(De = 0)$, equal to our ${C_I}/{C_{I,N}}$, versus the Weissenberg number $Wi = {\lambda _0}{U_2}/{R_2}$, where ${\lambda _0}$ is the relaxation time of the constant-viscosity elastic fluid, a solution of polystyrene in oligomeric styrene solvent, at zero shear rate. Since their contraction is axisymmetric, this $Wi$ needs to be multiplied by the contraction ratio $\beta = 4$ to be plotted in terms of our group ${\lambda _e}{U_2}/{H_2}$ (because, in the axisymmetric case, $Wi = {\lambda _0}{U_2}/{R_2} = {\lambda _0}{\beta ^3}{U_1}/{R_1}$, corresponding to $\Leftrightarrow {\lambda _e}{\beta ^3}{U_1}/{H_1} = \beta ({\lambda _e}{U_2}/{H_2}) = \beta \,Wi$, in the planar case, assuming the two characteristic times are identical, ${\lambda _0} = {\lambda _e}$, since the same fluid is being considered). Such a scaling procedure is similar to the one they used in the subsequent paper (Rothstein & McKinley Reference Rothstein and McKinley2001, their figure 18) to collapse pressure drop results for the cases with and without rounded corners. We see good agreement in figure 5 between our predictions using a parameter $Tr = 40$, the round symbols, and the experimental data plotted in terms of the scaled Weissenberg number, triangle symbols. Both show the expected increase of pressure drop with elasticity, in our case resulting solely from strain-hardening elongational viscosity, while results from numerical simulations using standard constitutive equations wrongly predict a pressure loss decrease and even an elastic recovery for the Oldroyd-B model (dashed red line). These results, using also the linear Phan-Thien–Tanner (LPTT, black line) and exponential Phan-Thien–Tanner (EPTT, blue line) forms of that model are from Alves et al. (Reference Alves, Oliveira and Pinho2003) but are replicated by many other authors. It is noted that the apparent increase in pressure drop seen for the EPTT model at larger De is a consequence of the scaling used to define the Couette correction ${C_I} = \varDelta p_I/2{\tau _w}$; the EPTT is the most shear thinning of the two forms of the PTT model and the fully developed wall shear stress ${\tau _w}$ decreases substantially at high Wi, making ${C_I}$ rise.

Figure 5. Pressure loss coefficient normalised with the Newtonian value for flow in a 4:1 contraction and comparison with experimental data of Rothstein & McKinley (Reference Rothstein and McKinley1999).

Another interesting set of data for a different Boger fluid, 0.05 % polyacrylamide in a viscous aqueous solution of maltose syrup, is that of Binding & Walters (Reference Binding and Walters1988). It shows the same trends of entry pressure drop discussed by Rothstein & McKinley (Reference Rothstein and McKinley1999Reference Rothstein and McKinley2001) in the axisymmetric contraction/expansion and Rodd et al. (Reference Rodd, Scott, Boger, Cooper-White and McKinley2005, Reference Rodd, Cooper-White, Boger and McKinley2007) in the planar microfluidic configuration, namely the sudden increase of $\varDelta {p_I}$ compared with a Newtonian fluid having the same viscosity once the flow rate goes beyond a critical value. The feature of interest in these data is that Binding & Walters used the same Boger fluid in both an axisymmetric contraction and an approximately 2-D planar contraction; this allows us the check the above scaling rule using experimental measurements only. Zografos et al. (Reference Zografos, Afonso and Poole2022) discussed these data and have reproduced them in their figure 1 in the numerical study about the suitability of the ALS model to predict enhanced pressure drops that we have already mentioned in the Introduction.

Figure 6(a) shows the raw data of Binding & Walters for the entry pressure drop of both the constant-viscosity elastic fluid and the equivalent Newtonian fluid in the axisymmetric (triangle symbols) and the planar (round symbols) contractions as the respective flow rates are increased. To distinguish the Newtonian data, power-law fits through that data are shown as blue lines that appear linear under the log–log scales of the graph. Pressure drops for the Newtonian fluid are calculated from those fits at flow rates for which $\varDelta {p_I}$ data exist, and it is then an easy matter to calculate the normalised loss coefficient $K = \varDelta {p_I}/\varDelta {p_{I,N}}$. Figure 6(b) shows the same data presented normalised in the way just described and rescaled in terms of the planar contraction volumetric flow rate (${\dot{Q}_{v,P}}$), using the same scaling rule employed for figure 5. With our notation, this entails

(4.3a,b)\begin{equation}{\dot{Q}_{v,A}}/{\dot{Q}_{v,P}} = \frac{{{\rm \pi} R_2^2}}{{2{H_2}W}}\frac{{{U_{2,A}}}}{{{U_{2,P}}}} = \frac{{{\rm \pi} R_2^3}}{{2H_2^2W}}\frac{{W{i_A}}}{{W{i_P}}}\quad \textrm{and}\quad W{i_A} = \beta \,W{i_P}.\end{equation}

Figure 6. Entry pressure drop data of Binding & Walters (Reference Binding and Walters1988): (a) raw data with power-law fits through the Newtonian data; (b) normalised pressure drop versus rescaled volumetric flow rate.

In these expressions the indices A and P refer to axisymmetric and planar contractions, the Weissenberg numbers are defined as used above ($W{i_A} = \lambda {U_2}/{R_2}$ and $W{i_P} = \lambda {U_2}/{H_2}$) and W is the depth of the channel in the planar configuration. With the actual dimensions of Binding & Walters’ experimental apparatus, ${R_2} = 2.4$ mm, ${H_2} = 1.1$ mm, $W = 62.5$ mm, $\beta \cong 14.3$, we get ${\dot{Q}_{v,A}}/{\dot{Q}_{v,P}} = 4.1$ the value used to express ${\dot{Q}_{v,A}}$ in terms of ${\dot{Q}_{v,P}}$ in figure 6(b).

It is apparent that the rescale procedure to present pressure drop data in terms of an equivalent flow rate of the planar case is satisfactory and results in approximately the same evolution of K vs. ${\dot{Q}_v}$ (or K vs. Wi). It seems from figure 6(b) that the value of K for the axisymmetric case is slightly above that of the planar, as ${\dot{Q}_v}$ is raised, but further data would be required for the planar contraction to clarify this point.

In figure 7, our pressure drop results based on a Trouton parameter of $Tr = 50$, fixing the maximum elongational viscosity, are compared with the experimental measurements of Binding & Walters (Reference Binding and Walters1988) for the Boger fluid in the planar contraction. Since their contraction ratio is $\beta = 14.3$, the Weissenberg number ($Wi = \lambda U/H$) has to be adjusted as explained below to be comparable to our $\beta = 4$, the same value used by Zografos et al. (Reference Zografos, Afonso and Poole2022) in simulations with the ALS model. These results are also shown to highlight the inadequacy of even the most sophisticated constitutive equations to capture the levels of pressure drop indicated by experiments. For the representation of the experimental data there is some doubts about the relaxation time $\lambda $ of the polyacrylamide (PAA) solution. Viscometric data of ${N_1}(\dot{\gamma })$ and $\eta (\dot{\gamma }) \approx {\eta _0} = 6.6$ Pa.s provided by Binding & Walters allow us to estimate the zero-shear-rate value of ${\psi _{10}}/2{\eta _0} \approx 0.065$s as $\dot{\gamma } \to 0$; however, the corresponding relaxation time ${\lambda _0} = {\psi _{10}}/2{\eta _0}(1 - {\beta _s})$ also depends on the solvent viscosity ${\eta _s}$ (through the solvent viscosity ratio ${\beta _s} = {\eta _s}/{\eta _0}$), which was not given. Typical Boger fluids based on PAA have ${\beta _s} \ge 0.9$ and two representative values are considered in figure 7, ${\beta _s} = 0.90$ and 0.95 (for example, the constant-viscosity polystyrene solution used by Rothstein & McKinley in figure 5 had a solvent viscosity ratio of 0.92). Again, the level of pressure loss enhancement as $\lambda U/H$ increases ($\lambda = {\lambda _e}$ in the simulations; $\lambda = {\lambda _0}$ in the experiments) is well captured by our model with $Tr = 50$, and the path followed by K vs. $Wi$ is relatively well predicted when the solvent viscosity ratio of the experimental fluid is ${\beta _s} = 0.95$. On the contrary, predictions of Zografos et al. with the ALS model grossly underpredict the data; the results shown in figure 7 with star symbols for the ALS correspond to the largest pressure increase reported by Zografos et al., using a solvent viscosity ratio of ${\beta _s} = 0.90$ and a large extensibility parameter $b = 1500$. Since the ALS, as well as the FENE-P on which it is based, are shear-thinning models, part of the pressure coefficient increase is due to a reduction of the wall shear stress (their results are in terms of Couette corrections, that is $K = {C_I}/{C_{I,N}}$ in 4.2). They also used the standard FENE-P model and the figure includes results using ${\beta _s} = 0.95$ and a smaller extensibility $b = 300$. These results are similar to those for the PTT model shown in figure 5.

Figure 7. Pressure loss coefficient $K = \Delta {p_I}/\Delta {p_{I,N}}$ versus elasticity parameter in planar contractions: comparison of our numerical predictions ($n = 1$, $Tr = 50$; cross symbols) with the measurements of Binding & Walters (Reference Binding and Walters1988) (circular symbols for two solvent viscosity ratios, ${\beta _s} = {\eta _s}/{\eta _0}$). Predictions by Zografos et al. (Reference Zografos, Afonso and Poole2022) with the FENE-P and the ALS models are also shown (star symbols).

The rationale to understand the adjustment required to compare results from different contraction ratios is to admit that pressure loss is determined by the elongational character of the flow along the contraction central zone and so depends on a Deborah number defined as $De = \lambda ({U_2} - {U_1})/({H_1} - {H_2})$ (the flow time scale corresponds to a change of velocity from the large to the small channel occurring in a length equal to the contraction height). Note that, in this way, it is not viable to define a De from upstream or downstream characteristics; there is only one De which is related to our previous Weissenberg number, here denoted $Wi \equiv W{i_2} = \lambda {U_2}/{H_2}$, by $De = (\lambda {U_2}/{H_2})(1 - 1/\beta )/(\beta - 1) = Wi/\beta $. This argument is the basis for the scaling used for the x-axis in figure 7. In fact, Alves et al (Reference Alves, Oliveira and Pinho2004) have already shown from numerous numerical simulations of viscoelastic entry flows, using various contraction ratios and the UCM, Oldroyd-B and PTT models, that the corner vortex characteristics scale as $Wi/\beta $, especially at large contraction ratios.

4.1.2.2 Corner vortex enhancement

We look now to the flow patterns and the effect of the elongational component of the viscosity on the size (${X_R}$), intensity (${\psi _R}$) and shape of the corner vortices formed upstream of the contraction plane. Here, ${X_R}$ is defined as the non-dimensional distance along the $x$-coordinate of the detachment point near the upper or lower walls (where $u = 0$, obtained by linear interpolation) to the contraction plane ($x = 0$); ${\psi _R}$ is defined as the maximum non-dimensional streamfunction value in the upper part of the channel minus unity, or the minimum value in the lower part of the channel (${\psi _R} = {\psi _{max}} - 1$ or ${\psi _R} = |{{\psi_{min}}} |$; the two are equal if the vortices are symmetrical) and corresponds to the amount of recirculating fluid in the standing vortices normalised with the total inlet flow rate.

We recall that all simulations are for a small Reynolds number, $Re = 1$, and when the shear viscosity is constant (by setting $n = 1$) there is no ambiguity in the definition of the viscosity used to calculate $Re$ (it is ${\eta _0}$). Figure 8 shows the streamlines for various flow cases, starting from the Newtonian case ($Tr = 4$), which obviously has no elongational viscosity effects hence forming rather small and weak eddies attached to the salient corner (so-called Moffat eddies; we predict ${\psi _R} = 2.16 \times {10^{ - 4}}$ at $Re = 1$ and ${\psi _R} = 5.70 \times {10^{ - 4}}$ at $Re = 0$; the benchmark data of Alves et al. (Reference Alves, Oliveira and Pinho2003) give almost the same value ${\psi _R} = 5.89 \times {10^{ - 4}}$ for $Re = 0$), and then we increased the Trouton parameter to $Tr = 10$, 20 and 30. Larger and more intense corner vortices are observed and these must be generated by the elongational flow developed at the entrance to the small channel, although the elongation rates are modest there, as was seen in figure 3(a), with a local maximum along the central line of $\dot{\varepsilon } \approx 0.5$ for the Newtonian fluid and lower values for the non-Newtonian fluids (not shown here), ${\dot{\varepsilon }_{max}} \approx 0.3\unicode{x2013} 0.4$. In the case of the flow patterns shown in figure 8 we used a dimensionless time parameter of ${\lambda _e}U/H = 5$ and so the rise of ${\tilde{\eta }_E}$ starts when ${\lambda _e}\dot{\varepsilon } \ge 0.25$.

Figure 8. Streamlines for the Newtonian case and three strain-hardening cases with constant shear viscosity ($n = 1$, ${\lambda _e}U/H = 5$): (a) $Tr = 4$; (b) $Tr = 10$; (c) $Tr = 20$; (d) $Tr = 30$ (streamfunction values: 0(0.1)1 including 0.05 and 0.95; in recirculation $\delta \psi = {10^{ - 3}}$).

For a given Trouton parameter of $Tr = 30$, fixing the maximum plateau value of the elongational viscosity, figure 9 shows that an increase of the time constant, from the value ${\lambda _e}U/H = 2$ to 20, results in much larger and more intense corner vortices. The vortex size increases from ${X_R} = 1.82$ to 3.57, now occupying approximately half of the inlet channel length, while the intensity rises from ${\psi _R} = 1.41 \times {10^{ - 3}}$ to $18.7 \times {10^{ - 3}}$ (approximately 2 % of the inlet flow rate; compare with the Newtonian case, of 0.022 %). Such large corner vortices are often reported in the literature related to experimental work with non-Newtonian viscoelastic liquids, as exemplified by the following studies.

Figure 9. Effect of time parameter (or Weissenberg number) on the corner vortices at $Tr = 30$: (a) ${\lambda _e}U/H = 2$; (b) ${\lambda _e}U/H = 20$ (streamfunction values: 0(0.1)1 including 0.05 and 0.95; in recirculation, $\delta \psi = 2 \times {10^{ - 3}}$).

Evans & Walters (Reference Evans and Walters1986) employed several contraction ratios (4:1, 16:1, 32:1) in planar geometries using aqueous solutions of polyacrylamide at various concentrations. These are shear-thinning fluids possessing viscoelasticity, as measured by the first normal stress, and Evans & Walters reported considerable vortex growth as the elasticity parameter (a kind of Weissenberg number) was increased and they also mentioned the appearance of ‘lip vortices’ near the re-entrant corner for contraction ratios larger than 4:1. Such lip vortices may be a manifestation of elastic effects related to first normal stresses in shear and these cannot be predicted by the present model, where elasticity only arises through an increase of the steady elongational component of the viscosity. Evans & Walters did not measure the pressure drop. Rothstein & McKinley (Reference Rothstein and McKinley1999) used viscoelastic polystyrene solutions having an almost constant shear viscosity in 4:1:4 contraction/expansion axisymmetric geometries; the measured pressure drop coefficient, similar to our K, was compared with our predictions in figure 5 and the quantitative agreement found corroborates the view that it is the elongational viscosity the main cause for the increased pressure drop observed in viscoelastic systems at moderate and high Weissenberg numbers. In a second study, Rothstein & McKinley (Reference Rothstein and McKinley2001) considered other contraction/expansion ratios ($\beta \equiv {R_1}/{R_2} = 2$, 4, 8, 16), with or without rounded re-entrant corners, in axisymmetric flow with careful elongational characterisation of the viscoelastic fluids in unsteady uniaxial extension. This latter study by Rothstein & McKinley benefitted from advancements in experimental techniques for the measurement of elongational viscosities in mobile fluid systems, especially for low-concentration polymeric solutions (see McKinley & Sridhar Reference McKinley and Sridhar2002 for the filament-stretching techniques then in vogue), and that allowed them to make a clear connection between vortex characteristics in viscoelastic contraction and contraction/expansion flows with elongational fluid properties.

We have previously compared our pressure drop predictions against the measured data of Rothstein & McKinley (Reference Rothstein and McKinley1999) – see figure 5 – and it is relevant now to see how the predicted vortex size compares with those experiments, even if they were done in an axisymmetric geometry. We already know that the Wi value of the experiments needs to be multiplied by the contraction ratio ($\beta = 4$ in this case) to make an adequate comparison in terms of the Weissenberg number for the planar contraction. Figure 10 shows the data obtained directly from figure 12 of Rothstein & McKinley (Reference Rothstein and McKinley1999), which gives ${X^{\prime}_R} = {x_R}/2{R_1}$ vs. Wi, thus requiring ${x_R}$ to be rescaled to our ${X_R}$ (${X_R} = {X^{\prime}_R}2\beta $), and we have decided to shift the experimental Wi by $- 4$, after transforming it to the planar case, so that the rise of vortex size occurs approximately at the same Weissenberg number as in the predictions. This decision was taken because the initial delay of vortex growth seen in the experimental data cannot be predicted by our model, since stress or strain rate advection is not considered, the term with $\mathop {\boldsymbol{D}}\limits^\nabla $ in (1.7b). We see a reasonable agreement between predictions and experiments up to a relatively large $Wi = \lambda U/H \approx 7$ when the measurements capture an instability (the measured vortex size oscillates between the two limiting values shown in the figure). What is relevant here is to see that our elongational GNF-like model predicts the right level of vortex size, compared with Rothstein & McKinley data, while classical differential viscoelastic models, such as the Oldroyd-B and the linear and exponential forms of the PTT, shown with lines in the figure, give much smaller vortices. The values of ${X_R}$ given as lines in the bottom part of figure 10 for those viscoelastic models were obtained directly from Alves et al. (Reference Alves, Oliveira and Pinho2003), for the planar contraction (solid lines), and Oliveira et al. (Reference Oliveira, Oliveira, Pinho and Alves2007), for axisymmetric contraction (dashed lines; Wi rescaled to the planar case, as before). We recall that the PTT is a shear-thinning model while our model is used here as a constant-shear-viscosity model, as with the fluid of the experiments. Shear thinning should allow higher values of De to be attained and larger vortices to develop. Yet, vortex size is approximately half of that predicted by our model and even smaller when compared with experiments, for the range of Wi shown. In the case of the Oldroyd-B model results (using the benchmark value of the solvent viscosity ratio, ${\beta _s} = {\eta _s}/{\eta _0} = 1/9$), shown by red lines, for the planar case there is an initial decay of ${X_R}$ because the model predicts then a lip vortex; for the axisymmetric case, there is no lip vortex and the results shown by the dashed red line, after having scaled Wi (it is multiplied by $\beta = 4$), follow the linear PTT results of the planar case. Again, by comparing the LPTT results for the planar and axisymmetric geometries, we see a reasonable agreement thus re-confirming the scaling procedure (in this case using numerical predictions).

Figure 10. Vortex size as a function of elasticity parameter. Comparison of predictions using the anisotropic model ($n = 1$, $Tr = 40$, round symbols) with experimental data of Rothstein & McKinley (Reference Rothstein and McKinley1999) (triangular symbols). Some numerical results for classical viscoelastic models are also shown (continuous, Alves et al. Reference Alves, Oliveira and Pinho2003, and dashed, Oliveira et al. Reference Oliveira, Oliveira, Pinho and Alves2007, lines without symbols).

Before closing this sub-section, we relate vortex shape with the additional elongational viscosity ${\tilde{\eta }_E}$. It is noteworthy in figure 9(b) that the boundary of the standing corner vortices assumes a different shape, imposing a wedge-like (it could be described as conical, if the geometry were axisymmetric) convergent envelope to the main flow going through the small channel. Such differences occur because the value ${\lambda _e}U/H = 10$ is sufficient for the elongational viscosity to attain its maximum value, as we show now. For ${\eta _{el}} = 4{\eta _E}$ to be within the range of 2 % of its maximum value we see, from (3.4), that we must have $\textrm{tanh}{({\lambda _e}(U/H)\dot{\varepsilon })^2} = 0.98$ with $\dot{\varepsilon }$ dimensionless; that is, for a maximum strain rate of $\dot{\varepsilon } = 0.4$ we need ${\lambda _e}U/H \simeq 3.8$, and for $\dot{\varepsilon } = 0.3$, ${\lambda _e}U/H \simeq 5.0$. Therefore, ${\lambda _e}U/H$ should be larger than approximately 5 for the elastic cases having ${\dot{\varepsilon }_{max}} \approx 0.3\unicode{x2013} 0.4$ if we want to guarantee that the maximum elongational viscosity is attained (that is, to have $\max ({\eta _{el}}) = {\eta _0}Tr$ where ${\eta _{el}}$ is the standard elongational viscosity).

Such a situation is exemplified in figure 11, which shows the variation of the elongation strain rate $\dot{\varepsilon }(x)$ and the effective elongational component of the viscosity ${\eta _{E,ef}}$ along the central line, $y = 0$. This effective viscosity defined below (3.1), as ${\tilde{\eta }_{E,ef}} = ({\eta _E} - {\eta _S}){({c^2} - {s^2})^2}$, is then equal to the additional elongational component itself ${\tilde{\eta }_E} = ({\eta _E} - {\eta _S})$ because the streamline along the central plane is aligned with the principal axes of $\boldsymbol{D}$ and so there is no shear and it only remains a tensile strain at $y = 0$; thus ${\theta _p} = 0^\circ $ giving $c = \textrm{cos}\,0^\circ{=} 1$ and $s = \textrm{sin}\,0^\circ{=} 0$. Figure 11(a) indicates that the maximum $\dot{\varepsilon }$ is approximately 0.3, irrespective of ${\lambda _e}$, and the previous estimation analysis showed that ${\lambda _e}U/H = 2$ is insufficient for the elongational viscosity to attain its extreme value, which is confirmed by the lower curve in figure 11(b), while values above ${\lambda _e}U/H \simeq 5$ should allow complete development of ${\eta _E}$, again confirmed in figure 11(b) for both curves with higher time parameters, ${\lambda _e}U/H = 6$ and 10.

Figure 11. Influence of parameter ${\lambda _e}U/H$ on the longitudinal variation along the centreline ( $y = 0$) of (a) elongation strain rate and (b) effective elongational component of viscosity, for a Trouton parameter of $Tr = 30$.

In conclusion, the field of additional elongational viscosity ${\tilde{\eta }_E}$, responsible for the new terms in the equations of motion whose action is to alter the velocity field when ${\tilde{\eta }_E} > 0$, rises gradually and attains its maximum level upstream of the contraction plane, forming a plateau region that enters slightly into the small channel, if ${\lambda _e}U/H$ is sufficiently high (in figure 11b, ${\eta _{E,max}} = Tr/4 - 1 = 30/4 - 1 = 6.5$; this value is shown by the dashed magenta horizontal line at the top of the viscosity curves). This longitudinal variation of ${\tilde{\eta }_E}$ then decreases sharply to zero along the small channel centreline, in a distance of order H, which may be further extended for larger ${\lambda _e}U/H$ and $Tr$. It is this area of large localised ${\tilde{\eta }_E}$, extending farther upstream than downstream of the contraction (distances are normalised with $H \equiv {H_2}$), that is responsible for the increased pressure drop and for the large corner vortices observed in the experiments and in our simulations with the anisotropic model, as a consequence of a kind of obstruction for the flow to freely proceed along the central portion of the contraction geometry.

4.1.2.3 Quantification of increased vortex size and intensity and of pressure drop by strain hardening

Simulations of the kind previously considered have been systematically carried out for increased Trouton number $Tr$ at fixed extensional time parameter ${\lambda _e}$, and for increased time parameter at fixed Trouton number. Results of these simulations, consisting in the size and intensity of the recirculating corner vortex and the normalised irreversible pressure drop are plotted in figures 12 to 14, thus allowing a visual assessment of the effects brought about by strain hardening in viscosity as predicted by the present anisotropic GNF-like model.

Figure 12. Influence of Trouton number parameter of the elongational viscosity model on the (a) intensity and (b) size of the corner vortex, with two time-constant parameters.

The increase of the amount of recirculating fluid inside the corner vortex ${\psi _R}$ and of its axial size ${X_R}$ are illustrated in figure 12(a,b), respectively, for the lower value of ${\lambda _e}U/H = 2$ and for a medium value, ${\lambda _e}U/H = 5$, for which almost complete elongational viscosity development along the contraction central plane is expected on the basis of the previous analysis. While the vortex size is seen to increase by 62 % and 133 % at the largest $Tr = 40$ for the two values of ${\lambda _e}U/H$ considered, the vortex intensity increases much more: by 8 times for ${\lambda _e}U/H = 2$ and 37 times for ${\lambda _e}U/H = 5$. We recall that, in these simulations, the fluid is non-shear thinning since we have $n = 1$ and so (3.3) gives a constant shear viscosity equal to unity in non-dimensional terms. Therefore the observed increase of size ${X_R}$, which seems to follow a square root variation with $Tr$, and the increase of intensity ${\psi _R}$, which is almost linear in $Tr$, except at the highest $Tr$ values where some reduction in the rate of increase is perceived from the figure, are solely due to the elongational-hardening aspect of the imposed elongational viscosity.

Again, we emphasise that strain or elongational hardening is a concept that here is meant to describe the sudden increase of the steady elongational component of the viscosity with elongation rate. Often, strain hardening is synonymous with tensile stresses raising sharply above the linear viscoelastic variation when strain is increased in an unsteady constant strain-rate experiment. These two situations are somewhat similar, and the concept of strain hardening is used for both with equivalent meaning.

In terms of the local pressure drop induced by the contraction, figure 13 shows an increase of 70 % when the dimensionless time parameter of the model is ${\lambda _e}U/H = 5$ and the Trouton parameter rises from $Tr = 4$ (no extensibility effects) to $Tr = 40$ (maximum extensibility effects here considered).

Figure 13. Normalised irreversible loss coefficient for the cases ${\lambda _e}U/H = 2$ and 5 as a function of Trouton number parameter.

The ordinate in figure 13 is equal to the normalised factor $K = \varDelta {p_I}/\varDelta {p_{I,N}}$ previously defined (4.2) and we see that here we have a pressure drop increase similar to that found experimentally by Rothstein & McKinley with a viscoelastic liquid when the elasticity parameter was raised from a Weissenberg number of 0 to 5 (cf. figure 5, where K is shown versus $Wi = {\lambda _e}U/H$ instead of $Tr$ as in this figure). It is possible to contrast the results when elastic effects are pushed to extreme values: pressure drop rises by a factor of two, whereas the vortex size rises by a factor of 3 to 4, as shown in the figure 14.

Figure 14. Vortex size ${X_R}$ (right) and recirculating strength ${\psi _R}$ (left) as a function of dimensionless time constant, at $Tr = 40$.

The effect of increasing the time parameter ${\lambda _e}$ of the elongational viscosity function at the largest $Tr$ number ($Tr = 40$) has a more pronounced impact on the variation of both vortex size and intensity, as shown by figure 14, than that resulting from an increase of $Tr$. While ${X_R}$ has a continuing tendency to rise as the dimensionless time constant ${\lambda _e}U/H$ is increased, albeit at a reduced rate, the amount of fluid rotating inside the vortex seems to attain a maximum value at approximately ${\lambda _e}U/H \cong 15$ and then remains approximately constant, in spite of an increase of vortex longitudinal size. Figure 14 shows that both ${X_R}$ and ${\psi _R}$ have a rise in magnitude of approximately 3.5 to 4 times compared with the Newtonian fluid when ${\lambda _e}U/H$ is increased from 0 to 20. However, the rate of increase of vortex size and intensity tends to diminish once the value of $\lambda _e^{ - 1}$ is above the maximum predicted elongation rate along the central plane, ${\dot{\varepsilon }_{max}}$, and consequently the largest elongational viscosities are then attained for the given $Tr$. This explains the levelling out of the curves in figure 14.

After considering in this section a number of elastic cases, in which the fluid had a constant shear viscosity but an elongational viscosity component that increased with tensile strain rates in regions where elongational flow was present, we turn attention to the case of no additional elongational viscosity, i.e. GNF-like.

4.1.3. Inelastic shear-thinning flow case

Even in the case of an inelastic fluid, which in the present context means that the elongational component of the viscosity is the same as the shear component (${\eta _E} = {\eta _S}$), thus resulting in the absence of the additional elongational stress ${\tilde{\boldsymbol{\tau }}_E}$ of (2.20), the predictions of the present model should differ from a standard GNF model since ${\eta _S}(\dot{\gamma }) \ne \eta ({\dot{\gamma }_D})$. To assess such discrepancies we employ in the current section the simplified (${\eta _\infty } = 0$) Carreau model (3.3) with a power-law exponent of $n = 0.5$, thus inducing shear thinning in viscosity, and set $Tr = 4$ to avoid any extensional-viscosity flow effects.

Figure 15 shows the viscosity fields for the new model (on the left), which in this case corresponds only to the shear component of the viscosity ${\eta _S}$ as a function of the local shear rate, $\eta = {\eta _S}(\dot{\gamma })$, and for the standard GNF Carreau model (on the right), with $\eta = \eta ({\dot{\gamma }_D})$, and serves to demonstrate the contrasting behaviour of the predicted local viscosities, whose differences mainly occur along the central part of the contraction geometry. These plots in some way reflect the shear-rate fields already depicted in figure 2. While the new model has an essentially homogeneous distribution of shear viscosity along the central plane of the contraction, that is $\eta \cong 1$for $|y |\le 0.1$, the standard Carreau GNF model, where the ‘shear rate’ is calculated as the second invariant of the rate-of-deformation tensor, thus incorporating extraneous tensile strain rate components, shows a viscosity decay rate followed by a quick recovery along the centreline. Those features are more clearly visualised in a graph of viscosity along the line $y = 0$, as shown in figure 16.

Figure 15. Viscosity fields for the GNF Carreau model with $n = 0.5$: (a) current GNF-like model; (b) standard GNF (contours values 0(0.1)1).

Figure 16. Longitudinal variations of (a) viscosity and (b) pressure, along the central line ( $y = 0$), for a GNF inelastic case: $Tr = 4$, $n = 0.5$. Results for the anisotropic model ($\eta = {\eta _S}(\dot{\gamma })$), the standard GNF model ($\eta = \eta ({\dot{\gamma }_D})$) and the Newtonian model ($\eta = {\eta _0}$) are compared.

We now examine the axial variation of viscosity and pressure along the central line (figure 16). In figure 16(a) we see that the standard GNF model based on the Carreau viscosity function expressed in terms of the second invariant of $\boldsymbol{D}$ (${\dot{\gamma }_D}$), predicts an unexpected decrease of the shear viscosity along the central plane of the contraction as a consequence of the fact that, inside the expression for ${\dot{\gamma }_D}$, there is an elongational contribution $\partial u/\partial x$ which should be irrelevant for a true shear-viscosity evaluation (the anisotropic model has $\eta $ almost constant at 1) but still it is captured by any standard GNF. In fact, for the present 2-D flows it is straightforward to show that the expression of the second invariant simplifies to

(4.4)\begin{equation}{\dot{\gamma }_D} = \sqrt {2(D_{xx}^2 + D_{yy}^2) + 4D_{xy}^2} = \sqrt {4{{(\partial u/\partial x)}^2} + {{(\partial u/\partial y + \partial v/\partial x)}^2}} , \end{equation}

and in the central line of the contraction, due to symmetry ($\partial u/\partial y = 0$ and $v = 0 \Rightarrow \partial v/\partial x = 0$), we get

(4.5)\begin{equation}{\dot{\gamma }_D} = 2\left|{\frac{{\partial u}}{{\partial x}}} \right|.\end{equation}

This corresponds to an extension-related tensile strain rate which should not be part of a generalised rate of deformation used to determine a shear viscosity. Hodgkinson et al. (Reference Hodgkinson, Chaffin, Zimmerman, Holland and Howse2022) have also raised similar criticisms in a recent work dealing with flows having mixed kinematics where they try to prove that the apparent shear viscosity in those complex flows is affected by the existence of simultaneous shear and extensional flows, with the latter occurring along directions either parallel or perpendicular to the predominant shear axis.

Anyway, (4.5) clearly implies that using $\eta ({\dot{\gamma }_D})$ leads to a different evaluation of the shear viscosity compared with $\eta (\dot{\gamma })$, resulting in smaller pressure drops, as seen in figure 16(b) where the standard GNF shows a bulged longitudinal variation of pressure ($p(x)$), thus giving a smaller loss coefficient (it is as if the standard GNF model had an ‘elastic’ pressure recovery). So, while the pressure drop over the whole of the contraction inlet and outlet channels is smaller for a GNF fluid compared with the Newtonian fluid ($\varDelta p = 10.239$ and 18.281, respectively) the local loss coefficient is larger, being ${C_I} = 0.862$ for the anisotropic model and ${C_I} = 0.785$ for the standard Carreau model. The value of ${C_I}$ is then obtained from $\varDelta {p_I}$ by normalising with ${\tau _w}$, which is smaller for the shear-thinning fluid. The Newtonian case has ${C_I} = 0.484$. To finalise the analysis of GNF fluid predictions, we look into the effect of varying the power-law index of the Carreau model at constant flow rate.

Figure 17 shows the vortex size versus n on the left y-axis, as black round symbols, and the vortex intensity versus n on the right y-axis, as red square symbols; for the two sets of data the closed symbols are for the anisotropic model and the open symbols for the standard model. From the results plotted in this figure we see that the present anisotropic model, with viscosity depending on the local shear rate, predicts that both the vortex size and its recirculating intensity increase as the power-law index is reduced from the Newtonian value of unity down to a small value of 0.1, whereas the standard GNF, with viscosity depending on the second invariant of rate of deformation, the opposite trend is observed. Physically, the trend with the new model is to be expected, since shear-thinning effects tend to increase as n is decreased and in the regions of high shear rate, typically close to the re-entrant corners, viscosity will be significantly reduced leading to increased velocity in the flow layers adjacent to the corner vortices. Thus, we expect the vortex intensity to augment considerably, as the recirculating flow is dragged by the larger velocities in the flow core, whereas the vortex size might also be augmented to accommodate that increased activity in the recirculating flow, but not as much as its intensity. On the other hand, the results of the standard GNF are more typical of a viscoelastic model for a constant-viscosity fluid: reduction of vortex size and intensity as n decreases. Here, n decreasing is synonymous with larger tensile strain rate along the midplane (the term given by (4.5)), leading to a more intense reduction of viscosity than that shown in figure 16(a), thus inducing flow along the central region of the contraction geometry; this should be responsible for the reduction of ${X_R}$ and ${\psi _R}$ seen in figure 17, and also the relative reduction of the pressure loss shown in the next figure.

Figure 17. Variation of the vortex size (${X_R}$, left) and intensity (${\psi _R}$, right) as a function of power-law index n for inelastic fluid: anisotropic model (filled symbols); standard GNF model (open symbols).

The decision on which model is giving the correct trend in figure 17 requires experimental measurements using non-Newtonian liquids with very small elasticity and, as far as we are aware, such measurements are unavailable at present.

Figure 18 depicts the normalised loss coefficient when the power-law index varies. It is better to analyse these results starting from $n = 1$ and consider that n is systematically reduced, thus increasing the amount of thinning in shear viscosity. Both models show that the loss coefficient is larger for shear-thinning fluids compared with the Newtonian case; note, however, that the overall pressure drop $\varDelta p$ is smaller for GNF fluids, as expected, and so the increase of ${C_I}$ is due to a proportionally larger reduction of ${\tau _w}$ (cf. 4.1). The fact that the standard GNF Carreau model has progressively smaller loss coefficients as n is reduced compared with the anisotropic model, in which the viscosity is solely based on the actual local shear rates, can only be explained by the sort of ‘elastic’ push along the central $y = 0$ plane provided by the tensile strain rate already alluded to above. Clearly, such an effect should not be accounted for by a truly inelastic shear-rate-dependent model. The relative difference between the predicted ${C_I}$ from the two models reaches 15 % at low values of n, thus representing a potentially measurable discrepancy.

Figure 18. Relative loss coefficient as a function of power-law index.

4.2. Confined cylinder

We consider now the viscoelastic flow around a confined cylinder with a blockage ratio of 2:1 (channel half-width divided by cylinder radius, $\beta = H/R = 2$). This is another of the most widely used test problems in computational rheology, see Alves et al. (Reference Alves, Oliveira and Pinho2021) for a review of existing works. The cylinder is placed transversally and symmetrically in the central line of the channel, at a distance of ${L_1} = 20$ from the channel inlet and ${L_2} = 60$ from the outlet. At the inlet a parabolic velocity profile is prescribed with average velocity U and at the cylinder surface and channel walls the no-slip condition is applied. The problem and geometry are as described in a previous study by Oliveira & Miranda (Reference Oliveira and Miranda2005) and the mesh is also similar to their mesh M30, with 11,040 cells and non-uniform spacing. Typical experiments with polymeric liquids involve small Reynolds numbers, and here we set $Re = \rho UR/{\eta _0} = 1$.

In figure 19 the present numerical predictions for the drag coefficient on the cylinder (${C_D} = F/({\eta _0}U)L$) normalised with the corresponding Newtonian value (${C_{D,N}} = 133.09$) are compared with the experimental data of Verhelst & Nieuwstadt (Reference Verhelst and Nieuwstadt2004). This is one of the few data sets for drag on a confined cylinder with a non-Newtonian elastic liquid, even if we look into the literature for inelastic shear-thinning fluids. Those authors used a Boger fluid with an almost constant shear viscosity, produced by dissolving 150 wppm partially hydrolised PAA in a glucose syrup solvent having a large viscosity.

Figure 19. Normalised drag coefficient as a function of an elasticity number for flow around a confined cylinder with blockage ratio 2:1. Measurements by Verhelst & Nieuwstadt (Reference Verhelst and Nieuwstadt2004), round symbols; present numerical results with $Tr = 10$ and 20, triangular symbols; and some viscoelastic model predictions (Alves et al. Reference Alves, Pinho and Oliveira2001; Oliveira & Miranda Reference Oliveira, Pinho and Pinto2005), crosses and stars.

Our predictions with a Trouton parameter of $Tr = 20$ closely match, both qualitatively and quantitatively, the measurements of the force on the cylinder as the Weissenberg number ($Wi = \lambda U/R$), a non-dimensional group measuring the fluid elasticity, is raised. In the experiments, $\lambda $ is the measured relaxation time of the PAA solution and U and R are the average velocity in the channel and the cylinder radius, so that ${\dot{\gamma }_c} = U/R$ is a typical shear rate; in our predictions, $\lambda = {\lambda _e}$ is the time parameter of the elongational viscosity function (3.4). Standard viscoelastic models fail badly, as shown by the numerical results of Oliveira & Miranda (Reference Oliveira and Miranda2005) using the FENE-CR model, and those of Alves et al. (Reference Alves, Pinho and Oliveira2001) which, with the Oldroyd-B model, are considered benchmark quality predictions. Both these differential viscoelastic models give a constant viscosity in a simple shearing flow, as it is the case of the Boger fluid of the experiments, and are strain hardening in extension, giving elongational viscosities that rise quickly with elongation rate, going unphysically to infinity when $\lambda \dot{\varepsilon } = 0.5$ for the Oldroyd-B model, but remaining bounded with the FENE-CR model and depicting a qualitative trend very similar to the elongational viscosity function used here. Still, they predict a reduction of the drag, compared with the Newtonian fluid, while the present simple anisotropic GNF-like model demonstrates quite plainly something that was expected and has been a continued argument for a long time (see e.g. White, Gotsis & Baird Reference White, Gotsis and Baird1987 and references therein): it is the elongational viscosity (when coupled to the right elongational rate-of-deformation tensor, we would add) that is responsible for the substantial increase in pressure drop or drag observed by most experimental works.

In figure 20 we compare the predicted streamlines around the cylinder for a case without shear thinning ($n = 1$) and with an elongational viscosity having $Tr = 40$, ${\lambda _e}U/R = 4$. We see that the streamlines bulge away from the cylinder, compared with the Newtonian streamlines shown as red dashed lines. There is an upstream shift of the streamlines in the incoming flow of the fluid possessing a relatively large elongational viscosity, and a downstream shift as the flow goes past the cylinder. Because of this change in flow pattern, the drag on the cylinder rises considerably, compared with a Newtonian flow (see previous figure). Such flow modifications have been documented by James & Acosta (Reference James and Acosta1970) for the related unconfined flow case, to be considered in the next section, but have never been predicted by conventional viscoelastic models with single mode differential equations: in general, these predict a downstream shift in the incoming flow which is usually attributed to a convective effect, and upstream shift in the outgoing flow, with only some downstream shift of streamlines quite far away from the back of the cylinder and at some distance along the central symmetry plane (see Alves et al. Reference Alves, Pinho and Oliveira2001). It is emphasised that, although the differences in flow patterns seen in figure 20 are relatively slight, they have an important outcome on the corresponding predicted drag coefficients. This is why often the velocity fields are reasonably well predicted by common constitutive models, but the forces on immersed bodies or the pressure drop are badly underpredicted or not shown at all.

Figure 20. Comparison of streamlines for a flow with important elongational effects, $Tr = 40$, ${\lambda _e}U/R = 4$, black lines, and the corresponding Newtonian flow, dashed red lines. Streamfunction values: 0, ±0.01, 0.1, 0.5(0.5)2.

Figure 21 displays predicted contours of the additional elongational viscosity (${\tilde{\eta }_E}$) for the case $Tr = 20$, ${\lambda _e}U/R = 4$, as computed on a smoothed mesh designed to avoid discontinuities along the lines at ${\pm} 45^\circ $typical of computational meshes generated for flow about a confined cylinder. Outside the outer diamond-shape region, ${\tilde{\eta }_E}$ drops quickly to zero (meaning that the elongational viscosity becomes equal to the shear viscosity, ${\tilde{\eta }_E} = {\eta _E} - {\eta _S} = 0$, which in this case is constant); it is also zero in the two zones above and below the cylinder, attached to its surface. There the flow is essentially either simple shear or a mix of shear and solid-body rotation. As the figure shows, ${\tilde{\eta }_E}$ attains its maximum value of 4 (${\tilde{\eta }_{E,max}} = (Tr - 4)/4$) in the frontal regions upstream and downstream of the cylinder, as expected since the central line is a line of pure planar elongational flow, and also in the regions of constricted flow in between the cylinder surface and the channel walls. This map of elongational viscosity corresponds to the point of large ${C_D}$ in figure 19, for $Tr = 20$ at $Wi = \lambda U/R = 4$. It is typical of the other elastic cases (${\lambda _e} > 0$, $Tr > 4$) and indicates that the enhanced drag on the cylinder results from distortion of the pressure field due to the zones of large elongational viscosity component around the cylinder.

Figure 21. Contour plot of the additional elongational viscosity ${\tilde{\eta }_E}$ in flow around confined 2:1 cylinder for the case $Tr = 20$ and ${\lambda _e}U/R = 4$. Viscosity values: 1(0.5)4.

Also noteworthy is that contours of additional elongational viscosity in figure 21 change smoothly from zero (outside the region shown) to 1 (the first contour line shown) and then increase steadily to 4 (we only show the line at 3.99 otherwise the contour would be limited to a single point). Since ${\tilde{\eta }_E}$ only depends on $\dot{\varepsilon }$ it should be apparent that the field of elongation rate is smooth on the domain of the flow.

We look now to the results of the confined-cylinder flow, at the same blockage ratio $\beta = 2$ and Reynolds number $Re = 1$, for the inelastic shear-thinning cases obtained by setting $Tr = 4$ and varying the power-law exponent n of the Carreau viscosity model. The other non-dimensional parameters of the Carreau model are the non-dimensional time constant ${\lambda _s}U/R = 2$ and the infinite-shear-rate viscosity set at ${\eta _\infty }/{\eta _0} = 0.001$. Figure 22 shows the decay of the drag coefficient normalised with the corresponding Newtonian value as the index n is reduced and serves to demonstrate two points.

Figure 22. Variation of the normalised drag coefficient with the power-law index for inelastic shear-thinning flow cases: new anisotropic GNF-like model, round symbols; standard GNF model, triangular symbols. For $n < 0.4$ the flow becomes unsteady with the new model (closed round symbols).

First, drag is slightly higher for the present anisotropic GNF model where viscosity is computed with the actual local shear rate as $\eta (\dot{\gamma })$ compared with the standard GNF Carreau model where the second invariant of $\boldsymbol{D}$ is used, $\eta ({\dot{\gamma }_D})$. This effect may be explained by the fact the standard GNF introduces extensional components of the velocity gradient into the calculation of ${\dot{\gamma }_D}$ which give rise to a sort of elastic recovery and lower drag coefficients, as already seen for the contraction flow (cf. figure 18). We hope that future experimental measurements might clarify the discrepancy seen in figure 22 between the round symbols and the triangular red symbols for the usual GNF, which amounts to approximately 22 % when $n = 0.4$.

Second, the new model predicts that the flow becomes unsteady and sinusoidally periodic, when n goes from $n = 0.4$ to $n = 0.3$, and more random in time at lower values of n. A standard GNF gives steady flows for arbitrary small n. Now, this type of unsteadiness has been observed experimentally by Ribeiro et al. (Reference Ribeiro, Coelho, Pinho and Alves2014) for the flow around a cylinder with $\beta = 2$, as in our case, of a 1000 ppm PAA solution in water at $Re = 0.034$ and low elasticity $Wi = \lambda U/R = 0.06$ (their figure 7); the fluid was shear thinning with $n = 0.38$, exactly in between the values of 0.4 and 0.3 seen in figure 22. Similar experiments documented by Ribeiro et al. (Reference Ribeiro, Coelho, Pinho and Alves2014) with other constant-viscosity PAA solutions did not show the same type of instability and the flow remained steady (their figures 18 and 19 with 85 % glycerin/14 % water solutions of PAA at 200 and 400 ppm). In fact, earlier experiments by McKinley, Armstrong & Brown (Reference McKinley, Armstrong and Brown1993) using a Boger fluid composed by 0.31 % polyisobutylene dissolved in a mixture of 95 % polybutene and 4 % tetradecane, and techniques such as flow visualisation and laser doppler anemometry (LDA) measurements, did not reveal any unsteadiness in front of the confined cylinder – they did capture an instability downstream of the cylinder most probably due to the curved streamlines coupled with normal stresses, a well-known mechanism for producing instability in viscoelastic fluid flows with curvature (Larson et al. Reference Larson, Shaqfeh and Muller1990; Pakdel & McKinley Reference Pakdel and McKinley1996). Ribeiro et al. attributed the upstream unsteadiness, seen as the dividing stagnation streamline ending at a point on the cylinder surface slightly above or below the middle symmetry line of the geometry, to an elastic effect (starting at a critical $W{i_c} \approx 0.04$, a rather low value) but in our case the present anisotropic GNF model applied to a totally inelastic fluid gives rise to a very similar behaviour.

The mechanism for the instability is illustrated by contour plots of viscosity in figure 23, where the left figure in the upper row (panel a) shows a steady case for $n = 0.4$ and the right figure (panel b) is an unsteady oscillating flow case, at a certain time instant of its period, for $n = 0.3$. As the power-law index is reduced, a very narrow zone of constant high viscosity ($\eta = 1$) is formed along the symmetry line (since in this line $y = 0$ we have $\dot{\gamma } = 0$) which is surrounded by low-viscosity fluid ($\eta $ quickly drops from 1 to approximately 0.5). Such a viscosity distribution generates an instability on the impinging fluid stream seen in successive viscosity contour plots as a pulsating flow pattern with lateral displacements of fluid to the lower-viscosity regions at the sides. With the standard GNF model the contribution of a varying $\partial u/\partial x$ to ${\dot{\gamma }_D}$ along the line $y = 0$ induces a reduction of the viscosity, thus creating layers of decreasing viscosity around the cylinder (figure 23c) without the formation of the thin high-viscosity streams seen above. With the index $n = 0.3$ just below a threshold for the instability (somewhere in between $n = 0.4$ and $n = 0.3$) the drag coefficient on the cylinder (here computed as ${C_D} = {F_x}/({\eta _0}UL)$ where ${F_x}/L$ is the $x$-component of the drag force per unit length) has a perfectly sinusoidal variation with time, as seen in figure 23(d), with a period of $T \cong 2.6 \times R/U$. The results of figure 23 are for $Re = 1$ but similar behaviour was predicted for lower inertia, $Re = 0.01$. A more detailed analysis of this phenomenon, in particular to see if curvature of the impinging surface is a requirement for the instability, goes beyond the scope of the present study and must be left for future research.

Figure 23. Shear-viscosity maps for three shear-thinning non-strain-hardening cases: (a) anisotropic model with $n = 0.4$ – steady flow; (b) anisotropic model with $n = 0.3$ – unsteady periodic flow; (c) standard GNF model with $n = 0.3$ – steady flow. (d) Drag coefficient vs. time for case (b). Viscosity values: 0.1(0.1)0.9.

4.3. Unconfined cylinder

In the case of flow around an unconfined cylinder, early experiments such as those by James & Acosta (Reference James and Acosta1970) for a single cylinder in a viscoelastic liquid, and later those by Talwar & Khomami (Reference Talwar and Khomami1995) for the flow around an array of cylinders, have shown a large increase in pressure drop and consequently on the drag on a single cylinder which have never been even approximately predicted by existing viscoelastic models. Again we shall consider low, or moderate, values of the Reynolds number (here defined as $Re = \rho UD/{\eta _0}$) and this requires quite large lateral dimensions of the computational domain relative to the cylinder diameter to avoid interference of the imposed boundary conditions at the top and bottom planes delimiting the flow domain ( $y ={\pm} Y/2$) upon the flow close to the cylinder. If the size of the domain is denoted $X \times Y$, with an inlet at $x ={-} X/2$, where $u(y) = U$, $v(y) = 0$, an outlet at $x ={+} X/2$, where $\partial u/\partial x = \partial v/\partial x = 0$ with forced overall mass balance, and symmetry conditions imposed at $y ={\pm} Y/2$ (a moving no-slip wall has also been tried with almost identical predictions), then the present results were obtained on a mesh having $X \times Y = 240 \times 240$, a total of 54 400 cells with minimum cell spacings near the cylinder of $\varDelta r = \varDelta s \cong 0.01$ along the radial and tangential directions.

Figure 24 compares the present predictions of the drag coefficient on a single cylinder ${C_D} = F/{\textstyle{1 \over 2}}\rho {U^2}D$ with the measurement of James & Acosta (Reference James and Acosta1970) for a Newtonian liquid and for a non-Newtonian polyethylene oxide (PEO) aqueous solution having 30 ppm of PEO. In the definition of ${C_D}$, F is the drag force component aligned with the velocity direction per unit length on the cylinder surface, $D = 2R$ is the cylinder diameter and U is the unperturbed uniform velocity far from the cylinder, which was prescribed at the inlet of the computational domain. For this case we have used two values of the Trouton parameter, a lower one $Tr = 20$ to assess the effect of varying this parameter, and a larger value equal to $Tr = 30$ (the largest value of Tr used in these simulations; a value in relative agreement with the measurements of Kim & Lee Reference Kim and Lee2019, see below) and a ratio of Weissenberg ($Wi = {\lambda _e}U/D$) to Reynolds numbers, defining the so-called elasticity number ($El = Wi/Re$), which is independent of the flow conditions since $El = {\lambda _e}\rho /{\eta _0}{D^2}$, equal to $El = 2$. In a typical experimental program, with a given viscoelastic liquid, elasticity as measured by $Wi$ is raised by increasing the imposed flow rate, that is U, and so $Re$ also increases in direct proportion to $Wi$ but $El$ remains constant. This is why the results of figure 24 are the only results in the present paper related to moderate Reynolds numbers; for the Newtonian fluid it is known that, at $Re \approx 6$, a standing recirculating eddy is formed behind the cylinder, that it grows almost linearly with $Re$, and that, at $Re \approx 50$, the flow becomes unsteady and periodic, showing the well-known vortex street pattern (Batchelor Reference Batchelor1967, p. 257). In figure 24 we stopped increasing the Reynolds number at $Re = 40$, before periodic unsteadiness set in, and it may be observed that the agreement with the Newtonian drag coefficient data of James & Acosta scanned directly from their figure 8 is quite good, while for the viscoelastic dilute PEO solution the agreement with $Tr = 30$ is not as good but still quantitatively fair (clearly smaller values of Tr should not be used as shown by the results for Tr = 20, especially at higher Re). The departure of the measured data from the Newtonian ${C_D}$ vs. $Re$ line appears to occur later than what is shown by our predictions, but the lack of data at lower $Re$ does not allow a clear assessment, together with absence of the elongational characterisation of the PEO solution (although the results of Kim & Lee Reference Kim and Lee2019 for PEO solutions show that $Tr = 30$ is a plausible value; they give a ${T_r}(\dot{\varepsilon } \to \infty ) \approx 41$ for a dilute 0.2 % solution).

Figure 24. Drag coefficient as a function of Reynolds number for Newtonian and viscoelastic fluid in flow around an unconfined cylinder. Experiments, James & Acosta (Reference James and Acosta1970), red open symbols; Present numerical calculations with anisotropic GNF model, closed symbols.

A direct illustration of the effect of the strain-hardening elongational viscosity on the flow field is provided by figure 25, where streamlines for an elastic case, $Tr = 30$, $Re = 5$ and $Wi = {\lambda _e}U/D = 10$, shown by solid black lines, are plotted together with streamlines for the corresponding Newtonian case, shown by dashed red lines. This figure should be compared with the visualisation photographs given by James & Acosta in their figure 9 (in particular, in panels a and e); a considerable amount of the ‘outward stretching of the flow field’ mentioned by these authors is clearly observed from the results of our simulations in figure 25. It is as if the cylinder in the viscoelastic flow had a diameter larger than it actually has. Elongational viscosity increases the extent of the region surrounding the cylinder where the velocity field is affected by its presence; we note that the region shown in this figure is a zoom in on the range $- 10 \le x \le + 10$, $- 5 \le y \le + 5$. Also, the usual discussion about whether the streamlines are shifted upstream or downstream (e.g. Manero & Mena Reference Manero and Mena1981) does not seem to be well put; the streamlines are shifted away from the cylinder, upstream on the upstream side of the flow and downstream on the downstream side.

Figure 25. Comparison of streamlines displacement for the unconfined cylinder at Re = 5: continuous lines – Wi = 10, Tr = 30, n = 1; dashed red lines – Newtonian fluid. Streamline values: 0, ±0.001, 0.01, 0.1(0.1)0.5, 1, 2.

While in the previous comparison the Reynolds and Weissenberg numbers were increased simultaneously, as would occur in an experiment when the liquid flow rate is progressively augmented, figure 26 displays numerical results only and it is straightforward to keep the Reynolds number constant (here we use $Re = 1$ representative of low-inertia conditions found in most practical applications with high-viscosity liquids) and control the amount of elasticity by increasing the Weissenberg number ($Wi = \lambda U/D$, with $\lambda $ the relaxation time of the quasi-linear differential models or ${\lambda _e}$ for our anisotropic GNF approach). The closed square symbols are the present predictions calculated with an elongational viscosity defined with a Trouton parameter of $Tr = 30$ for a non-shear-thinning liquid ($n = 1$), and for comparison we show numerical results of Huang & Feng (Reference Huang and Feng1995) with the Oldroyd-B model and Oliveira, Pinho & Pinto (Reference Oliveira, Pinho and Pinto1998) with the UCM model. With the drag force represented in this way it becomes quite clear that even the most ‘elastic’ of the differential constitutive equations, since both the Oldroyd-B and UCM models give a quadratic first normal stress difference in shear and a steady elongational viscosity going to infinity at a finite elongation rate, are unable to predict the level of drag increase predicted by the present anisotropic model which, as the previous comparison showed (figure 24), gives drag values close to those actually measured.

Figure 26. Drag variation with Weissenberg number for the unconfined-cylinder case: comparison of the present predictions with the anisotropic GNF model against predictions with viscoelastic models by Oliveira et al. (Reference Oliveira and Miranda1998) (UCM model) and Huang & Feng (Reference Huang and Feng1995) (Oldroyd-B model).

5. Conclusions

Based on a shear and elongational decomposition approach of the rate-of-deformation tensor, following the method of Kolar (Reference Kolar2007), an anisotropic class of GNF-type model is proposed which is the simplest to cater for differing shear and elongational responses typical of non-Newtonian liquids such as polymer melts and solutions. It is based on two functions of the local shear rate and the local elongation rate for the corresponding shear and elongational viscosity components which, in the spirit of the GNF approach, are related directly to separated rate-of-strain–stress responses in terms of shear and elongational stress components, namely ${\boldsymbol{\tau }_S} = 2{\eta _S}(\dot{\gamma }){\boldsymbol{D}_S}$ and ${\boldsymbol{\tau }_E} = 2{\eta _E}(\dot{\varepsilon }){\boldsymbol{D}_E}$. These two stress tensors ($\boldsymbol{\tau } = {\boldsymbol{\tau }_S} + {\boldsymbol{\tau }_E}$) are first evaluated in a special reference frame, the pure-shear frame (of Kolar Reference Kolar2007; see also Batchelor Reference Batchelor1967), are then transformed back to the original fixed frame where they are written in a Cartesian coordinate system as usual stress-divergence terms in the Navier–Stokes equations having a variable viscosity (that of the shear component), plus extra terms related to the additional elongational viscosity ($\boldsymbol{\tau } = 2{\eta _S}(\dot{\gamma })\boldsymbol{D} + 2{\tilde{\eta }_E}(\dot{\varepsilon }){\boldsymbol{D}_E}$).

We show that this approach is able to predict large vortex sizes as well as enhanced localised pressure drops in contraction flows, especially planar contractions which are problematic because the only non-zero invariant of the rate-of-deformation tensor is then just the second invariant ${\dot{\gamma }_D}$. Both these effects are observed in experiments with complex polymer fluids but are seldom predicted in numerical works with either standard GNF models or even with differential viscoelastic constitutive equations, such as the well-known Oldroyd-B, FENE-P, PTT models and other models. Only very sophisticated viscoelastic models with ad hoc adjustment of the parameters in the time-rate stress equations (e.g. López-Aguilar et al. Reference López-Aguilar, Tamaddon-Jahromi, Webster and Walters2016) seem to be able to give the kind of results we highlight here, where we use a very simple model, without fluid memory and without normal stress effects in shear but accounting for normal stress effects in extension.

We also show that a strain-hardening elongational viscosity, with a constant shear viscosity, causes drag enhancement in confined and unconfined flows around a cylinder, and the predictions of drag coefficient vs. elasticity parameter obtained with the present approach compared reasonably well with measured data, contrary to most numerical results in the literature.

When the model is used as a purely viscous constitutive equation, by switching off the additional elongational viscosity (putting $Tr = 4$), the predictions are close to those of standard GNF models (we used the Carreau model) but different by a margin that might be measured experimentally. For the contraction flow problem, in particular, the trend of variation of vortex size and intensity versus power-law exponent is opposite of that found with the standard GNF. In addition, for the cylinder problem we predict an instability in the front stagnation point of the cylinder, which is due to the steep circumferential gradient of shear viscosity, along the stagnation line, making it fluctuate up and down the midline of the cylinder. This flow instability occurs when the power-law index is small ($n < 0.4$ for the confined case, $\beta = H/R = 2$) even at very low Reynolds number ($Re \approx 0.01$). We suspect this instability is the same as that reported by Ribeiro et al (Reference Ribeiro, Coelho, Pinho and Alves2014) in an experimental work; however, they attributed it to elasticity effects.

If our approach is correct, we believe it can be beneficially extended to the kind of viscoelastic differential models just mentioned by adopting at least two modes in the constitutive equations, one with a low relaxation time, related to the shear component of the flow ($\eta (\dot{\gamma })$, ${\psi _1}(\dot{\gamma })$), and the other with an appropriate finite relaxation time dealing with the elongational aspects of the flow. Multimode models are typical in viscoelastic flow simulations and so this procedure is relatively simple to implement. Anyway, our method should provide useful information about the reasons underlying the failure of common constitutive models in predicting the correct pressure drop for viscoelastic flows. Extension of the present model to 3-D flow depends crucially on a methodology to extract the local shear and elongation rates. We commented at beginning of § 2 that such generalisation would be straightforward but obviously increased algebraic complications are to be expected. Kolar's (Reference Kolar2007) method requires a lengthy iterative procedure (the local frame needs to be rotated degree by degree until the maximum shear rate is obtained) which makes it unfeasible for a method like the one here proposed, where shear and elongation rates need to be evaluated at every point of the computational mesh, at every iteration or time step of the time-marching procedure used to solve the equations of motion. Alternative methods of kinematic identification in three dimensions need to be investigated for this purpose, such as the vortex-vector method developed by Liu and co-workers (see e.g. Tian et al. Reference Tian, Gao, Dong and Liu2018) which has gained some notoriety as a vortex identification scheme. Another promising method is based on the use of a real Schur form for representing the velocity gradient tensor, as recently explained by Kronborg & Hoffman (Reference Kronborg and Hoffman2023); it remains to be seen if the results of this method are compatible with the results of Kolar's search for the BRF. Again, we stress that these vortex schemes are post-processing algorithms while what we need is a scheme that works effectively within the flow solution algorithm itself.

On the numerical side, the present approach is not without some drawbacks. While in the test cases shown we could attain values of the Trouton parameter as high as 50, which was sufficient to demonstrate the ability of the model in predicting the large pressure drops and vortex sizes seen in experiments, we found that iterative convergence of the flow solver deteriorates as $Tr$ increases. Our solver is a finite-volume time-marching algorithm and for larger $Tr$ the solution starts oscillating in time, without ever converging in an iterative sense but also without suddenly diverging. Our impression is that this behaviour is due to a ‘switching’ instability which occurs on the boundary separating regions where the elongation rate goes from being finite to suddenly becoming zero. For the Newtonian case the boundary is the cusped-shape line seen in figure 3(a) where the contours of $\dot{\varepsilon }$ are concentrated, dividing the strong elongational flow upstream from the pure-shear channel flow downstream. If the numerical algorithm, at a certain time step, identifies the mesh point adjacent to that line as belonging to a straining flow ($\dot{\varepsilon } \ne 0$) and, in the next time step, it so happens that the same point is predicted to be on the rotational flow region on the other side of the line ($\dot{\varepsilon } = 0$), a situation may occur where the algorithm jumps forever between these two configurations. This issue must be addressed in future research.

Other than these numerical issues, including the implementation of our approach in axisymmetric geometries, two avenues for future work may be easily identified which we think should be the first to be addressed. The first is to include first normal stresses in shearing flow and see how the results compare with the standard differential viscoelastic constitutive equations. For this, it suffices to include in the calculation of the stress field the ${\psi _1}(\dot{\gamma })$-term of the CEF equation (1.7b), since the terms involving ${\psi _2}(\dot{\gamma })$ in that equation and ${h_2}(\dot{\varepsilon })$ in the Coleman–Noll model (1.8) turn out to be irrelevant in 2-D flows. The second is to apply the decomposition method at a postprocessing level (and this can be done in three dimensions) as a tool for analysis of non-Newtonian flows since we now have the possibility of obtaining the ‘effective’ rates of shear, elongation and, if need be, of rotation. It is appropriate to cite here Varchanis et al (Reference Varchanis, Tsamopoulos, Shen and Haward2022) who, in several parts of their paper, used arguments that require the knowledge of those deformation rates along a streamline. That led us wondering about these issues and prompted an immediate question: Could we travel along with a fluid particle and know the local values of $\dot{\gamma }$ and $\dot{\varepsilon }$ that the particle ‘sees’? We hope the present contribution goes some extent towards answering this question.

Acknowledgements

I would like to thank Professor C. Silva (IST, Univ. Lisbon) for bringing into my attention the important paper of Kolar (Reference Kolar2007), and Professor R. Poole (Univ. Liverpool) for many elucidating and helpful discussions.

Funding

This work was partly supported by Fundação para a Ciência e a Tecnologia (FCT, Portugal) and research unit C-MAST (projects UIDB/00151/2020 and UIDP/00151/2020).

Declaration of interests

The author reports no conflict of interest.

Appendix A. The equations of motion in Cartesian coordinates

In this appendix the equations of motion resulting from the present model in its 2-D version are given explicitly in full so that it may be possible to compare them against a standard GNF model (i.e. the Navier–Stokes equations with a variable viscosity). Generally, equations for momentum and mass conservation are written as

(A1)\begin{gather}\rho \frac{{\textrm{D}\boldsymbol{u}}}{{\textrm{D}t}} ={-} \boldsymbol{\nabla }p + \boldsymbol{\nabla }\boldsymbol{\cdot }{\boldsymbol{\tau }_S} + \boldsymbol{\nabla }\boldsymbol{\cdot }{\boldsymbol{\tau }_E},\end{gather}
(A2)\begin{gather}\boldsymbol{\nabla }\boldsymbol{\cdot }\boldsymbol{u} = 0,\end{gather}

with the stress tensors for the shear and elongational components given by ${\boldsymbol{\tau }_S} = 2{\eta _S}(\dot{\gamma }){\boldsymbol{D}_S}$ and ${\boldsymbol{\tau }_E} = 2{\eta _E}(\dot{\varepsilon }){\boldsymbol{D}_E}$. As explained in the main text, it is better to work with a shear stress tensor related to the total rate-of-deformation tensor, so we define ${\tilde{\boldsymbol{\tau }}_S} \equiv 2{\eta _S}(\dot{\gamma })\boldsymbol{D}$ and the additional stress related to extensional flow only is ${\tilde{\boldsymbol{\tau }}_E} \equiv 2({\eta _E} - {\eta _S}){\boldsymbol{D}_E} \equiv 2{\tilde{\eta }_E}{\boldsymbol{D}_E}$ (defining both ${\tilde{\boldsymbol{\tau }}_E}$ and ${\tilde{\eta }_E}$). The equation of motion becomes then

(A3)\begin{equation}\underbrace{{\rho \frac{{\textrm{D}\boldsymbol{u}}}{{\textrm{D}t}} ={-} \boldsymbol{\nabla }p + \boldsymbol{\nabla }\boldsymbol{\cdot }{{\tilde{\boldsymbol{\tau }}}_S}}}_{{GNF}} + \underbrace{{\boldsymbol{\nabla }\boldsymbol{\cdot }{{\tilde{\boldsymbol{\tau }}}_E}}}_{{Additional}}.\end{equation}

The first three terms in this equation are typical of a GNF model, the only difference being that the viscosity is a function of the actual local shear rate ($\dot{\gamma }$) and not a shear rate obtained from the second invariant of $\boldsymbol{D}$ (${\dot{\gamma }_D}$), while the last ‘additional’ term results from the elongational-flow component and is formed by sub-terms which cannot all be identified as a viscosity multiplied by velocity gradients. Numerically, the best option is to treat those first three ‘GNF’ terms in the standard way, with diffusion based on the shear viscosity handled as implicitly as possible, while the last term is added as calculated from the previous iteration values.

However, in order to promote numerical stability some of the constituents of the term labelled ‘additional’ in the equation above may be treated implicitly, namely

(A4) \begin{align} \rho \left[ {\dfrac{{\partial u}}{{\partial t}} + u\dfrac{{\partial u}}{{\partial x}} + v\dfrac{{\partial u}}{{\partial y}}} \right] & ={-} \dfrac{{\partial p}}{{\partial x}} + \dfrac{\partial }{{\partial x}}\left[ {2({\eta_S} + \eta_{E,ef}^n)\dfrac{{\partial u}}{{\partial x}}} \right]\nonumber\\ &\quad + \dfrac{\partial }{{\partial y}}\left[ {({\eta_S} + \eta_{E,ef}^t)\left( {\dfrac{{\partial u}}{{\partial y}} + \dfrac{{\partial v}}{{\partial x}}} \right)} \right] \nonumber\\ & \quad + \dfrac{\partial }{{\partial x}}\left\{ {2{{\tilde{\eta }}_E}({c^2} - {s^2})\left[ {\left( {cs - \dfrac{1}{2}} \right)\dfrac{{\partial u}}{{\partial y}} + \left( {cs + \dfrac{1}{2}} \right)\dfrac{{\partial v}}{{\partial x}}} \right]} \right\}\nonumber\\ & \quad + \dfrac{\partial }{{\partial y}}\left\{ {2{{\tilde{\eta }}_E}(2cs)\left[ {({c^2} - {s^2})\dfrac{{\partial u}}{{\partial x}} - \dfrac{{\partial u}}{{\partial y}} + \dfrac{{\partial v}}{{\partial x}}} \right]} \right\}, \end{align}
(A5) \begin{align} \rho \left[ {\dfrac{{\partial v}}{{\partial t}} + u\dfrac{{\partial v}}{{\partial x}} + v\dfrac{{\partial v}}{{\partial y}}} \right] & ={-} \dfrac{{\partial p}}{{\partial y}} + \dfrac{\partial }{{\partial y}}\left[ {2({\eta_S} + \eta_{E,ef}^n)\dfrac{{\partial v}}{{\partial y}}} \right]\nonumber\\ &\quad + \dfrac{\partial }{{\partial x}}\left[ {({\eta_S} + \eta_{E,ef}^t)\left( {\dfrac{{\partial u}}{{\partial y}} + \dfrac{{\partial v}}{{\partial x}}} \right)} \right]\nonumber\\ & \quad + \dfrac{\partial }{{\partial x}}\left\{ {2{{\tilde{\eta }}_E}(2cs)\left[ {({c^2} - {s^2})\dfrac{{\partial u}}{{\partial x}} - \dfrac{{\partial u}}{{\partial y}} + \dfrac{{\partial v}}{{\partial x}}} \right]} \right\}\nonumber\\ & \quad + \dfrac{\partial }{{\partial y}}\left\{ {2{{\tilde{\eta }}_E}({c^2} - {s^2})\left[ {\left( {\dfrac{1}{2} - cs} \right)\dfrac{{\partial u}}{{\partial y}} - \left( {\dfrac{1}{2} + cs} \right)\dfrac{{\partial v}}{{\partial x}}} \right]} \right\}, \end{align}

with

(A6)\begin{equation}\begin{array}{l} \eta _{E,ef}^n = {{\tilde{\eta }}_E}{({c^2} - {s^2})^2} \ge 0\quad (\textrm{effective}\;\textrm{normal}\;\textrm{elongational}\;\textrm{viscosity}),\\ \eta _{E,ef}^t = {{\tilde{\eta }}_E}{(2cs)^2} \ge 0\quad (\textrm{effective}\;\textrm{tangential}\;\textrm{elongational}\;\textrm{viscosity}), \end{array}\end{equation}

and

(A7)\begin{equation}{\tilde{\eta }_E} = ({\eta _E} - {\eta _S}) \ge 0.\end{equation}

It is assumed that the continuity constraint is satisfied

(A8)\begin{equation}\frac{{\partial u}}{{\partial x}} + \frac{{\partial v}}{{\partial y}} = 0.\end{equation}

We recall that $c \equiv \textrm{cos}\,{\theta _p}$, $s \equiv \textrm{sin}\,{\theta _p}$ and the principal angle is ${\theta _p} = {\textstyle{1 \over 2}}\textrm{arctan}({D_{xy}}/{D_{xx}})$ where ${D_{xy}} = (\partial u/\partial y + \partial v/\partial x)/2$ and ${D_{xx}} = (\partial u/\partial x)$. The first lines of (A4) and (A5) correspond to standard convection/diffusion equations with an anisotropic diffusion coefficient (the elongational viscosity component is different for the normal and tangential terms, which are denoted by $\eta _E^n$ and $\eta _E^t$, respectively). The lower part of the equations in curled brackets are additional terms which need to be addressed as given source terms (numerically, these are treated explicitly with values of the unknowns obtained from the previous iterations).

References

Alam, M.I., Raj, A., Khan, P.M., Kumar, S. & Roy, S. 2021 Numerical simulation of flow of a shear-thinning Carreau fluid over a transversely oscillating cylinder. J. Fluid Mech. 921, A23.CrossRefGoogle Scholar
Alves, M.A., Oliveira, P.J. & Pinho, F.T. 2003 Benchmark solutions for the flow of Oldroyd-B and PTT fluids in planar contractions. J. Non-Newtonian Fluid Mech. 110, 4575.CrossRefGoogle Scholar
Alves, M.A., Oliveira, P.J. & Pinho, F.T. 2004 On the effect of contraction ratio in viscoelastic flow through abrupt contractions. J. Non-Newtonian Fluid Mech. 122, 117130.CrossRefGoogle Scholar
Alves, M.A., Oliveira, P.J. & Pinho, F.T. 2021 Numerical methods for viscoelastic fluid flows. Annu. Rev. Fluid Mech. 53, 509-541.CrossRefGoogle Scholar
Alves, M.A., Pinho, F.T. & Oliveira, P.J. 2001 The flow of viscoelastic fluids past a cylinder: finite-volume high-resolution methods. J. Non-Newtonian Fluid Mech. 97, 207232.CrossRefGoogle Scholar
Batchelor, G.K. 1967 An Introduction to Fluid Dynamics. Cambridge University Press.Google Scholar
Binding, D.M. & Walters, K. 1988 On the use of flow through a contraction in estimating the extensional viscosity of mobile polymer solutions. J. Non-Newtonian Fluid Mech. 30, 233250.CrossRefGoogle Scholar
Bird, R.B., Armstrong, R.C., Hassager, O. 1987 Dynamics of Polymeric Liquids, Volume I: Fluid Mechanics, 2nd edn. Wiley.Google Scholar
Boyko, E. & Stone, H.A. 2021 Flow rate – pressure drop relations for shear-thinning fluids in narrow channels: approximate solutions and comparison with experiments. J. Fluid Mech. 923, R5.CrossRefGoogle Scholar
Boyko, E. & Stone, H.A. 2022 Pressure driven flow of the viscoelastic Oldroyd-B fluid in narrow geometries: analytical results and comparison with simulations. J. Fluid Mech. 936, A23.CrossRefGoogle Scholar
Chilcott, M.D. & Rallison, J.M. 1988 Creeping flow of dilute polymer solutions past cylinders and spheres. J. Non-Newtonian Fluid Mech. 29, 381432.CrossRefGoogle Scholar
Coleman, B.D. & Noll, W. 1961 Foundations of linear viscoelasticity. Rev. Mod. Phy. 33, 239249.CrossRefGoogle Scholar
Coleman, B.D. & Noll, W. 1962 Steady extension of incompressible simple fluids. Phy Fluids 5, 840843.CrossRefGoogle Scholar
Criminale, W.O., Ericksen, J.L. & Filbey, G.L. 1958 Steady shear flow of non-Newtonian fluids, Arch. Rat. Mech. Anal. 1, 410-417.CrossRefGoogle Scholar
Debbaut, B. & Crochet, M.J. 1988 Extensional effects in complex flows. J. Non-Newtonian Fluid Mech. 30, 169184.CrossRefGoogle Scholar
Evans, R.E. & Walters, K. 1986 Flow characteristics associated with abrupt changes in geometry in the case of highly elastic liquids. J. Non-Newt. Fluid Mech. 20, 11-29.CrossRefGoogle Scholar
Haller, G. 2021 Can vortex criteria be objectivized? J. Fluid Mech. 908, A25.CrossRefGoogle Scholar
Haward, S.J., Varchanis, S., McKinley, G.H., Alves, M.A. & Shen, A.Q. 2023, Extensional rheometry of mobile fluids. Part II. Comparison between the uniaxial, planar, and biaxial extensional rheology of dilute polymer solutions using numerically optimized stagnation point microfluidic devices. J. Rheol. 67(5), 1011-1030.CrossRefGoogle Scholar
Hodgkinson, R., Chaffin, C.T., Zimmerman, W.B.J., Holland, C. & Howse, J.R. 2022, Extensional flow affecting shear viscosity: experimental evidence and comparison with models. J. Rheol. 66(4), 793-809.CrossRefGoogle Scholar
Huang, P.Y., & Feng, J. 1995 Wall effects on the flow of viscoelastic fluids around a circular cylinder. J. Non-Newtonian Fluid Mech. 60, 179198.CrossRefGoogle Scholar
James, D.F. & Acosta, A.J. 1970 The laminar flow of dilute polymer solutions around circular cylinders. J. Fluid Mech. 42, 269288.CrossRefGoogle Scholar
Jones, D.M., Walters, K. & Williams, P.R. 1987 On the extensional viscosity of mobile polymer solutions. Rheol. Acta 26, 2030.CrossRefGoogle Scholar
Kim, S.G. & Lee, H.S. 2019 Concentration dependence of the extensional relaxation time and finite extensibility in dilute and semidilute polymer solutions using a microfluidic rheometer. Macromolecules 52, 95859593.CrossRefGoogle Scholar
Kolar, V. 2007 Vortex identification: new requirements and limitations. Intl J. Heat Fluid Flow 28, 638-652.CrossRefGoogle Scholar
Koppol, A.P., Sureshkumar, R., Abedijaberi, A. & Khomami, B. 2009 Anomalous pressure drop behaviour of mixed kinematics flows of viscoelastic polymer solutions: a multiscale simulation approach. J. Fluid Mech. 631, 231253.CrossRefGoogle Scholar
Kronborg, J. & Hoffman, J. 2023 The triple decomposition of the velocity gradient tensor as a standardized real Schur form. Phys. Fluids 35, 031703.CrossRefGoogle Scholar
Larson, R.G. 1988 Constitutive Equations for Polymer Melts and Solutions. Butterworths.Google Scholar
Larson, R.G., Shaqfeh, E.S.G. & Muller, S.J. 1990 A purely elastic instability in Taylor–Couette flow. J. Fluid Mech. 218, 573-600.CrossRefGoogle Scholar
Leigh, D.C. 1968 Nonlinear Continuum Mechanics. McGraw-Hill.Google Scholar
López-Aguilar, J.E., Tamaddon-Jahromi, H.R., Webster, M.F. & Walters, K. 2016 Numerical vs experimental pressure drops for Boger fluids in sharp-corner contraction flows. Phys. Fluids 28, 103104.CrossRefGoogle Scholar
Manero, O. & Mena, B. 1981 On the slow flow of viscoelastic liquids past a circular cylinder. J. Non-Newtonian Fluid Mech. 9, 379387.CrossRefGoogle Scholar
McKinley, G.H., Armstrong, R.C. & Brown, R.A. 1993 The wake instability in viscoelastic flow past confined circular cylinders. Phil. Trans. R. Soc. Lond. A 344, 265304.Google Scholar
McKinley, G.H. & Sridhar, T. 2002 Filament-stretching rheometry of complex fluids. Annu. Rev. Fluid Mech. 34, 375-415.CrossRefGoogle Scholar
Moffatt, H.K. 1964 Viscous and resistive eddies near a sharp corner. J. Fluid Mech. 18, 1-18.CrossRefGoogle Scholar
Nigen, S. & Walters, K. 2002 Viscoelastic contraction flows: comparison of axisymmetric and planar configurations. J. Non-Newtonian Fluid Mech. 102, 343359.CrossRefGoogle Scholar
Oldroyd, J.G. 1950 On the formulation of rheological equations of state. Proc. R. Soc. A 200, 523-541.Google Scholar
Oliveira, M.S.N., Oliveira, P.J., Pinho, F.T. & Alves, M.A. 2007 Effect of contraction ratio upon viscoelastic flow in contractions: the axisymmetric case. J. Non-Newtonian Fluid Mech. 147, 92108.CrossRefGoogle Scholar
Oliveira, P.J. & Miranda, A.I.P. 2005 A numerical study of steady and unsteady viscoelastic flow past bounded cylinders. J. Non-Newtonian Fluid Mech. 127, 5166.CrossRefGoogle Scholar
Oliveira, P.J., Pinho, F.T. & Pinto, G.A. 1998 Numerical simulation of non-linear elastic flows with a general collocated finite-volume method. J. Non-Newtonian Fluid Mech. 79, 143.CrossRefGoogle Scholar
Pakdel, P. & McKinley, G.H. 1996 Elastic instability and curved streamlines, Phys. Rev. Lett. 77 (12), 24592462.CrossRefGoogle ScholarPubMed
Petrie, C.J.S. 2006 Extensional viscosity: a critical discussion. J. Non-Newtonian Fluid Mech. 137, 1523.CrossRefGoogle Scholar
Poole, R.J. 2023 Inelastic and flow-type parameter models for non-Newtonian fluids. J. Non-Newtonian Fluid Mech. 320, 105106.CrossRefGoogle Scholar
Poole, R.J. 2024 On the use of the Astarita flow field for viscoelastic fluids to develop a generalised Newtonian fluid model incorporating flow type (GNFFTy). J. Fluid Mech. 987, A2.CrossRefGoogle Scholar
Reiner, M. 1945 A mathematical theory of dilatancy. Am. J. Maths 67, 350362.CrossRefGoogle Scholar
Ribeiro, V.M., Coelho, P.M., Pinho, F.T. & Alves, M.A. 2014 Viscoelastic fluid flow past a confined cylinder: three-dimensional effects and stability. Chem. Engng Sci. 111 (2014) 364-380.CrossRefGoogle Scholar
Rivlin, R.S. 1948 The hydrodynamics of non-Newtonian fluids I. Proc. R. Soc. Lond. A 193, 260281.Google Scholar
Rodd, L.E., Cooper-White, J.J., Boger, D.V. & McKinley, G.H. 2007 Role of the elasticity number in the entry flow of dilute polymer solutions in micro-fabricated contraction geometries. J. Non-Newtonian Fluid Mech. 143, 170191.CrossRefGoogle Scholar
Rodd, L.E., Scott, T.P., Boger, D.V., Cooper-White, J.J. & McKinley, G.H. 2005 The inertio-elastic planar entry flow of low-viscosity elastic fluids in micro-fabricated geometries. J. Non-Newtonian Fluid Mech. 129, 122.CrossRefGoogle Scholar
Rothstein, J.P. & McKinley, G.H. 1999 Extensional flow of a polystyrene Boger fluid through a 4:1:4 axisymmetric contraction/expansion. J. Non-Newtonian Fluid Mech. 86, 6188.CrossRefGoogle Scholar
Rothstein, J.P. & McKinley, G.H. 2001 The axisymmetric contraction – expansion: the role of extensional rheology on vortex growth dynamics and the enhanced pressure drop, J. Non-Newtonian Fluid Mech. 98, 3363.CrossRefGoogle Scholar
Solomon, M.J. & Muller, S.J. 1996 Flow past a sphere in polystyrene-based Boger fluids: the effect on the drag coefficient of finite extensibility, solvent quality and polymer molecular weight. J. Non-Newtonian Fluid Mech. 62, 8194.CrossRefGoogle Scholar
Talwar, K.K., & Khomami, B. 1995 Flow of viscoelastic fluids past periodic square arrays of cylinders: inertial and shear-thinning viscosity and elasticity effects. J. Non-Newtonian Fluid Mech. 57, 177202.CrossRefGoogle Scholar
Tanner, R.I. 1988 Engineering Rheology, rev. edn. Oxford University Press.Google Scholar
Tian, S., Gao, Y., Dong, X. & Liu, C. 2018 Definitions of vortex vector and vortex. J. Fluid Mech. 849, 312-339.CrossRefGoogle Scholar
Tseng, H.-C. 2020 A revisitation of generalized Newtonian fluids. J. Rheol. 64, 493504.CrossRefGoogle Scholar
Varchanis, S., Tsamopoulos, J., Shen, A.Q. & Haward, S.J. 2022 Reduced and increased flow resistance in shear-dominated flows of Oldroyd-B fluids. J. Non-Newtonian Fluid Mech. 300, 104698.CrossRefGoogle Scholar
Verhelst, J.M. & Nieuwstadt, F.T.M. 2004 Visco-elastic flow past cylinders mounted in a channel: experimental measurements of velocity and drag. J. Non-Newtonian Fluid Mech. 116, 301328.CrossRefGoogle Scholar
Walters, K., Webster, M.F. & Tamaddon-Jahromi, H.R. 2009 The numerical simulation of some contraction flows of highly elastic liquids and their impact on the relevance of the Couette correction in extensional rheology. Chem. Engng Sci. 64, 46324639.CrossRefGoogle Scholar
White, S.A., Gotsis, A.D. & Baird, D.G. 1987 Review of the entry flow problem: experimental and numerical. J. Non-Newtonian Fluid Mech. 24, 121160.CrossRefGoogle Scholar
Zografos, K., Afonso, A.M. & Poole, RJ. 2022 Viscoelastic simulations using the closed-form Adaptive Length Scale (ALS-C) model. J. Non-Newtonian Fluid Mech. 304, 104776.CrossRefGoogle Scholar
Figure 0

Figure 1. Functions used in the present work for the shear viscosity (a) and the additional elongational viscosity (b).

Figure 1

Figure 2. Comparison of the fields of (a) shear rate ($\dot{\gamma }$) and (b) second invariant of D (${\dot{\gamma }_D} = \sqrt {2\boldsymbol{D}:\boldsymbol{D}} $) for the Newtonian case. Contour values 0, ±0.1, 0.5, 1(1)3.

Figure 2

Figure 3. Fields of (a) strain rate $\dot{\varepsilon }$ and (b) rotation rate $\dot{\omega }$ for the Newtonian case. Just upstream of the contraction plane ${\dot{\varepsilon }_{max}} \approx 0.5$; in that zone the contours are for $\dot{\varepsilon } = 0.01$, 0.05, 0.1(0.1)0.5. Same values (±) for $\dot{\omega }$ plus ±0.001.

Figure 3

Figure 4. Pressure variation along the central plane for the Newtonian fluid and three strain-hardening cases ($Tr = 30$, ${\lambda _e}U/H = 2$, 6 and 10, $n = 1$). The dashed (magenta) line on the upper part of the graph indicates the fully developed pressure decay in the inlet channel.

Figure 4

Figure 5. Pressure loss coefficient normalised with the Newtonian value for flow in a 4:1 contraction and comparison with experimental data of Rothstein & McKinley (1999).

Figure 5

Figure 6. Entry pressure drop data of Binding & Walters (1988): (a) raw data with power-law fits through the Newtonian data; (b) normalised pressure drop versus rescaled volumetric flow rate.

Figure 6

Figure 7. Pressure loss coefficient $K = \Delta {p_I}/\Delta {p_{I,N}}$ versus elasticity parameter in planar contractions: comparison of our numerical predictions ($n = 1$, $Tr = 50$; cross symbols) with the measurements of Binding & Walters (1988) (circular symbols for two solvent viscosity ratios, ${\beta _s} = {\eta _s}/{\eta _0}$). Predictions by Zografos et al. (2022) with the FENE-P and the ALS models are also shown (star symbols).

Figure 7

Figure 8. Streamlines for the Newtonian case and three strain-hardening cases with constant shear viscosity ($n = 1$, ${\lambda _e}U/H = 5$): (a) $Tr = 4$; (b) $Tr = 10$; (c) $Tr = 20$; (d) $Tr = 30$ (streamfunction values: 0(0.1)1 including 0.05 and 0.95; in recirculation $\delta \psi = {10^{ - 3}}$).

Figure 8

Figure 9. Effect of time parameter (or Weissenberg number) on the corner vortices at $Tr = 30$: (a) ${\lambda _e}U/H = 2$; (b) ${\lambda _e}U/H = 20$ (streamfunction values: 0(0.1)1 including 0.05 and 0.95; in recirculation, $\delta \psi = 2 \times {10^{ - 3}}$).

Figure 9

Figure 10. Vortex size as a function of elasticity parameter. Comparison of predictions using the anisotropic model ($n = 1$, $Tr = 40$, round symbols) with experimental data of Rothstein & McKinley (1999) (triangular symbols). Some numerical results for classical viscoelastic models are also shown (continuous, Alves et al. 2003, and dashed, Oliveira et al. 2007, lines without symbols).

Figure 10

Figure 11. Influence of parameter ${\lambda _e}U/H$ on the longitudinal variation along the centreline ( $y = 0$) of (a) elongation strain rate and (b) effective elongational component of viscosity, for a Trouton parameter of $Tr = 30$.

Figure 11

Figure 12. Influence of Trouton number parameter of the elongational viscosity model on the (a) intensity and (b) size of the corner vortex, with two time-constant parameters.

Figure 12

Figure 13. Normalised irreversible loss coefficient for the cases ${\lambda _e}U/H = 2$ and 5 as a function of Trouton number parameter.

Figure 13

Figure 14. Vortex size ${X_R}$ (right) and recirculating strength ${\psi _R}$ (left) as a function of dimensionless time constant, at $Tr = 40$.

Figure 14

Figure 15. Viscosity fields for the GNF Carreau model with $n = 0.5$: (a) current GNF-like model; (b) standard GNF (contours values 0(0.1)1).

Figure 15

Figure 16. Longitudinal variations of (a) viscosity and (b) pressure, along the central line ( $y = 0$), for a GNF inelastic case: $Tr = 4$, $n = 0.5$. Results for the anisotropic model ($\eta = {\eta _S}(\dot{\gamma })$), the standard GNF model ($\eta = \eta ({\dot{\gamma }_D})$) and the Newtonian model ($\eta = {\eta _0}$) are compared.

Figure 16

Figure 17. Variation of the vortex size (${X_R}$, left) and intensity (${\psi _R}$, right) as a function of power-law index n for inelastic fluid: anisotropic model (filled symbols); standard GNF model (open symbols).

Figure 17

Figure 18. Relative loss coefficient as a function of power-law index.

Figure 18

Figure 19. Normalised drag coefficient as a function of an elasticity number for flow around a confined cylinder with blockage ratio 2:1. Measurements by Verhelst & Nieuwstadt (2004), round symbols; present numerical results with $Tr = 10$ and 20, triangular symbols; and some viscoelastic model predictions (Alves et al. 2001; Oliveira & Miranda 2005), crosses and stars.

Figure 19

Figure 20. Comparison of streamlines for a flow with important elongational effects, $Tr = 40$, ${\lambda _e}U/R = 4$, black lines, and the corresponding Newtonian flow, dashed red lines. Streamfunction values: 0, ±0.01, 0.1, 0.5(0.5)2.

Figure 20

Figure 21. Contour plot of the additional elongational viscosity ${\tilde{\eta }_E}$ in flow around confined 2:1 cylinder for the case $Tr = 20$ and ${\lambda _e}U/R = 4$. Viscosity values: 1(0.5)4.

Figure 21

Figure 22. Variation of the normalised drag coefficient with the power-law index for inelastic shear-thinning flow cases: new anisotropic GNF-like model, round symbols; standard GNF model, triangular symbols. For $n < 0.4$ the flow becomes unsteady with the new model (closed round symbols).

Figure 22

Figure 23. Shear-viscosity maps for three shear-thinning non-strain-hardening cases: (a) anisotropic model with $n = 0.4$ – steady flow; (b) anisotropic model with $n = 0.3$ – unsteady periodic flow; (c) standard GNF model with $n = 0.3$ – steady flow. (d) Drag coefficient vs. time for case (b). Viscosity values: 0.1(0.1)0.9.

Figure 23

Figure 24. Drag coefficient as a function of Reynolds number for Newtonian and viscoelastic fluid in flow around an unconfined cylinder. Experiments, James & Acosta (1970), red open symbols; Present numerical calculations with anisotropic GNF model, closed symbols.

Figure 24

Figure 25. Comparison of streamlines displacement for the unconfined cylinder at Re = 5: continuous lines – Wi = 10, Tr = 30, n = 1; dashed red lines – Newtonian fluid. Streamline values: 0, ±0.001, 0.01, 0.1(0.1)0.5, 1, 2.

Figure 25

Figure 26. Drag variation with Weissenberg number for the unconfined-cylinder case: comparison of the present predictions with the anisotropic GNF model against predictions with viscoelastic models by Oliveira et al. (1998) (UCM model) and Huang & Feng (1995) (Oldroyd-B model).