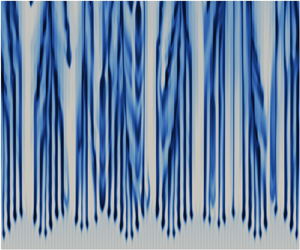
Hostname: page-component-745bb68f8f-s22k5 Total loading time: 0 Render date: 2025-01-11T07:07:03.220Z Has data issue: false hasContentIssue false

A pore-scale resolved direct numerical simulation study for scaling analysis of the solutal convection in porous media

Published online by Cambridge University Press:  25 November 2024

Yan Jin*
Affiliation:
Institute of Multiphase Flows, Hamburg University of Technology, 21073 Hamburg, Germany
*
Email address for correspondence: yan.jin@tuhh.de

Abstract

Understanding the solutal convection is a crucial step towards accurate prediction of CO$_2$ sequestration in deep saline aquifers. In this study, pore-scale resolved direct numerical simulations (DNS) are performed to analyse the scaling laws of the solutal convection in porous media. The porous media studied are composed of uniformly distributed square or circular elements. The Rayleigh numbers in the range $426 \le Ra \le 80\,000$, the Darcy numbers in the range $1.7\times 10^{-8} \le Da \le 8.8\times 10^{-6}$ and the Schmidt numbers in the range $250 \le Sc \le 10^4$ are considered in the DNS. The main time, length and velocity scales affecting the solutal convection are classified as the diffusive scales ($t_I$, $l_I$ and $u_I$), the convective scales ($t_{II}$, $l_{II}$ and $u_{II}$) and the shut-down scales ($t_{III}$, $l_{III}$ and $u_{III}$). These scales determine the pore-scale Rayleigh number $Ra_K$ and the Rayleigh number $Ra$. Based on the DNS results, the scaling laws for the transient dissolution flux are proposed in the different regimes of convection. It is found that the onset time of convection ($t_{oc}$) and the period of the flux-growth regime ($\Delta t_{fg}$) vary linearly with the convective time scale $t_{II}$. The merging of the original plumes and the re-initiation of the new plumes start in the same period, resulting in the merging re-initiation regime. Horizontal dispersion plays an important role in plume merging. The dissolution flux $F$ and the time since the onset of convection $t^{\ast }$ have an $F / u_{II} \sim (t^{\ast }/ t_{II})^{-0.2}$ scaling in the later stage of the merging re-initiation regime. This scaling is caused by the merging of the low-wavenumber plumes. It becomes more pronounced with decreasing porosity and leads to the nonlinear relationship between the Sherwood number $Sh$ and $Ra$ when the domain is not high enough for the plumes to fully develop. According to the DNS results, a regime is expected that is independent of both $Ra$ and $Ra_K$, while the dimensionless constant flux $F_{cf}/u_{II}$ in this regime decreases with decreasing porosity. When the mean solute concentration reaches approximately 30 %, convection enters the shut-down regime. For large $Ra$, the dimensionless flux in the shut-down regime follows the scaling law $F/u_{III}\sim (t/t_{III})^{-1.2}$ at large porosity ($\phi =0.56$) and $F/u_{III}\sim (t/t_{III})^{-1.5}$ at small porosity ($\phi =0.36$ or $0.32$). The study shows the significant pore-scale effect on the convection. The DNS cases in this study are mainly for simplified geometries and large $Ra_K$. This can lead to uncertainties of the obtained scaling coefficients. It is important to determine the scaling coefficients for real geological formations to predict a real CO$_2$ sequestration process.

Type
JFM Papers
Copyright
© The Author(s), 2024. Published by Cambridge University Press

1. Introduction

Natural convection in porous media is important in many engineering applications, including geothermal energy extraction (Ghoreishi-Madiseh et al. Reference Ghoreishi-Madiseh, Hassani, Mohammadian and Radziszewski2013; Böttcher et al. Reference Böttcher, Watanabe, Görke and Kolditz2016), contaminant transport in groundwater (Patil & Chore Reference Patil and Chore2014) and enhanced oil/gas recovery (Gbadamosi et al. Reference Gbadamosi, Junin, Manan, Agi and Yusuff2019). It has received particular attention in recent years due to the growing demand for a better understanding of CO$_2$ sequestration in deep saline aquifers, which is the key to long-term CO$_2$ storage and greenhouse gas reduction.

Natural convection is usually driven by density variations, which can be temperature dependent (thermal convection) or species concentration dependent. A typical example of convection driven by species concentration variation is solutal convection in porous media, which is a classic fundamental problem for understanding the CO$_2$ sequestration process. There is a similarity between thermal convection and solutal convection in porous media, due to the similarity between heat transfer and mass transfer problems. Therefore, the knowledge gained from thermal convection studies is also useful for understanding solutal convection. However, thermal convection problems traditionally have two impermeable boundaries with prescribed temperature values, while the porous matrix is permeable to heat fluxes. People are more interested in the statistically steady state of the thermal convection (Otero et al. Reference Otero, Dontcheva, Johnston, Worthing, Kurganov, Petrova and Doering2004; Hewitt, Neufeld & Lister Reference Hewitt, Neufeld and Lister2012, Reference Hewitt, Neufeld and Lister2014; Wen, Corson & Chini Reference Wen, Corson and Chini2015; de Paoli, Zonta & Soldati Reference de Paoli, Zonta and Soldati2016; Pirozzoli et al. Reference Pirozzoli, de Paoli, Zonta and Soldati2021). In contrast, in solutal convection the solute concentration is given at only one (upper) boundary, while the solute cannot penetrate the lower boundary and the surfaces of the porous matrix. As a result, transient behaviour plays an important role in solutal convection. To some extent, accurate prediction of these transient behaviours is more challenging than prediction of the mean quantities in the statistically steady state.

Extensive experimental and numerical studies have been carried out in recent years to understand the mechanism of the solutal convection in porous media. Two different approaches can be found in the experimental studies. One method is to mimic the CO$_2$ dissolution and convection with the flow in a Hele-Shaw cell (MacMinn & Juanes Reference MacMinn and Juanes2013; Letelier et al. Reference Letelier, Herrera, Mujica and Ortega2016; Alipour, de Paoli & Soldati Reference Alipour, de Paoli and Soldati2020; de Paoli, Alipour & Soldati Reference de Paoli, Alipour and Soldati2020; de Paoli et al. Reference de Paoli, Perissutti, Marchioli and Soldati2022). The second approach is to experimentally measure the convection in real porous media made of beads or sands (Neufeld et al. Reference Neufeld, Hesse, Riay, Hallworth, Tchelepi and Huppert2010; Wang et al. Reference Wang, Nakanishi, Hyodo and Suekane2016; Guo et al. Reference Guo, Sun, Zhao, Li, Liu and Chen2021). In addition to the experimental methods, macroscopic simulation, in which the volume-averaged transport equations are solved, is also often used to understand the solutal convection; see Hidalgo et al. (Reference Hidalgo, Fe, Cueto-Felgueroso and Juanes2012), Hewitt, Neufeld & Lister (Reference Hewitt, Neufeld and Lister2013) and Slim (Reference Slim2014) as examples.

Based on the completed experimental and numerical studies, Slim et al. (Reference Slim, Bandi, Miller and Mahadevan2013) and Slim (Reference Slim2014) proposed the six regimes of the transient solutal convection in porous media: the diffusive regime where diffusion dominates the solute transport (Elder Reference Elder1968); the linear-growth regime where perturbations amplify (Elder Reference Elder1968; Riaz et al. Reference Riaz, Hesse, Tchelepi and Orr2006); the flux-growth regime where convective fingers accelerate (Hassanzadeh, Pooladi-Darvish & Keith Reference Hassanzadeh, Pooladi-Darvish and Keith2007; Rapaka et al. Reference Rapaka, Chen, Pawar, Stauffer and Zhang2008; Xie, Simmons & Werner Reference Xie, Simmons and Werner2011; Elenius & Johannsen Reference Elenius and Johannsen2012); the merging regime where convective figures interact and merge (Riaz et al. Reference Riaz, Hesse, Tchelepi and Orr2006; Pau et al. Reference Pau, Bell, Pruess, Almgren, Lijewski and Zhang2010; Backhaus, Turitsyn & Ecke Reference Backhaus, Turitsyn and Ecke2011); the re-initiation regime where new plumes form (Pau et al. Reference Pau, Bell, Pruess, Almgren, Lijewski and Zhang2010; Slim et al. Reference Slim, Bandi, Miller and Mahadevan2013); and the shut-down regime where convection is affected by the lower boundary (Hewitt et al. Reference Hewitt, Neufeld and Lister2013; Slim et al. Reference Slim, Bandi, Miller and Mahadevan2013). Alternatively, de Paoli et al. (Reference de Paoli, Howland, Verzicco and Lohse2023) classify the solutal convection into the diffusive regime, the convective regime and the shut-down regime. Besides these regimes, a constant-flux regime that lies between the re-initiation and shut-down regimes has also been discussed intensively in previous studies (Hidalgo et al. Reference Hidalgo, Fe, Cueto-Felgueroso and Juanes2012; Slim Reference Slim2014).

An essential question related to these regimes of solutal convection is how to determine the dissolution flux in them. To answer this question, it is necessary to find the scaling law that links the dimensionless flux, or the Sherwood number $Sh$, and the Rayleigh number $Ra$. The $Sh$$Ra$ scaling in the constant-flux regime has been studied particularly intensively because of its important role in solutal convection. Most numerical studies suggest a nearly linear relationship between $Sh$ and $Ra$; see Pau et al. (Reference Pau, Bell, Pruess, Almgren, Lijewski and Zhang2010), Slim (Reference Slim2014) and Amooie, Soltanian & Moortgat (Reference Amooie, Soltanian and Moortgat2018) as examples. Some experimental studies confirm the nearly linear relationship at medium Rayleigh numbers. For example, the experiment by Guo et al. (Reference Guo, Sun, Zhao, Li, Liu and Chen2021) shows the sub-linear scaling $Sh \sim Ra^{0.95}$ for two-dimensional porous media with $400 \le Ra \le 8000$. Wang et al. (Reference Wang, Nakanishi, Hyodo and Suekane2016) shows the scaling $Sh \sim Ra^{0.93}$ for $2600 \le Ra \le 16\,000$. The scaling coefficients obtained from these studies are close to 1.

However, some experimental results differ significantly from the linear scaling. For example, the experiment by Neufeld et al. (Reference Neufeld, Hesse, Riay, Hallworth, Tchelepi and Huppert2010) suggests the nonlinear scaling $Sh \sim Ra^{0.84}$ for $1000 \le Ra \le 5.9\times 10^5$. The experiment by Backhaus et al. (Reference Backhaus, Turitsyn and Ecke2011) in a Hele-Shaw cell suggests the scaling $Sh \sim Ra^{0.76}$ for $6000 \le Ra \le 9\times 10^4$. Slim (Reference Slim2014) indicates that there is still disagreement over the value of the dissolution flux and whether it is layer-depth dependent. In recent studies, Letelier, Mujica & Oortega (Reference Letelier, Mujica and Oortega2019) and de Paoli et al. (Reference de Paoli, Alipour and Soldati2020) suggest that the discrepancy in the obtained scaling laws is related to the different boundary conditions used in the studies and the three-dimensional effect in the Hele-Shaw experiment. In another recent numerical study, Letelier et al. (Reference Letelier, Ulloa, Leyrer and Ortega2023) give the scaling law $Sh \sim Ra\,\vartheta _{s}$ for a Hele-Shaw model, where $\vartheta _{s}$ is the mean concentration dissipation rate.

Besides the scaling law in the constant-flux regime, some other studies have been carried out to predict the dissolution flux in the shut-down regime (Hewitt et al. Reference Hewitt, Neufeld and Lister2013; Slim et al. Reference Slim, Bandi, Miller and Mahadevan2013; Slim Reference Slim2014). In these studies, a box model is proposed that provides a good description of the dissolution flux. In addition, some studies focus on the onset time of convection (Ennis-King, Preston & Paterson Reference Ennis-King, Preston and Paterson2005; Riaz et al. Reference Riaz, Hesse, Tchelepi and Orr2006; Slim & Ramakrishnan Reference Slim and Ramakrishnan2010; Elenius & Johannsen Reference Elenius and Johannsen2012). These studies have significantly improved the understanding of the solutal convection in porous media.

Despite the progress made in recent years, a number of key questions about solutal convection remain to be answered. For example, there are still few data for the merging and re-initiation regimes, while in the Hele-Shaw experiments, the re-initiation regime was not observed (Slim Reference Slim2014). de Paoli (Reference de Paoli2023) suggest that the effect of anisotropic and heterogeneous porous media, real fluid properties and ambient flow conditions should be considered in the study. Another important issue is that it is still unclear whether and how the pore-scale geometry affects the solutal convection. Although the pore-scale effect has been considered in some experiments using real porous media instead of Hele-Shaw cells, it is difficult to measure the pore-scale flow details due to the technical difficulties. Most numerical studies of the solutal convection in porous media are macroscopic simulations that do not take the pore-scale effect into account. Liang et al. (Reference Liang, Wen, Hesse and DiCarlo2018), Wen, Chang & Hesse (Reference Wen, Chang and Hesse2018), Zech et al. (Reference Zech, Attinger, Bellin, Cvetkovic, Dietrich, Fiori, Teutsch and Dagan2019) and de Paoli (Reference de Paoli2021) show that the dispersion due to the pore-scale effect can have a significant effect on solutal convection. However, additional assumptions are required to model the pore-scale dispersion in macroscopic simulations, which introduces new uncertainties in the numerical results.

Chen & Zhang (Reference Chen and Zhang2010) performed an early pore-scale resolved direct numerical simulations (DNS) study of density-driven convection in fractured porous media during geological CO$_2$ sequestration. The study demonstrates the potential of using DNS to understand the mechanism of solutal convection. Later, based on the DNS results, Gasow et al. (Reference Gasow, Lin, Zhang, Kuznetsov, Avila and Jin2020, Reference Gasow, Kuznetsov, Avila and Jin2021) and Gasow, Kuznetsov & Jin (Reference Gasow, Kuznetsov and Jin2022) showed that the pore-scale geometry has a non-negligible effect on the convection in porous media. However, these studies are carried out for the convection in a statistically steady state. It is impossible to study the six regimes of transient solutal convection using these DNS results. It is also impossible to determine the time and length scales in the different regimes of convection, and to propose the scaling laws for calculating the dissolution flux.

The aim of the present study is to better understand the length, time and velocity scales in transient solutal convection. Based on the analysis, the scaling laws for the calculation of the dissolution flux in the different convective regimes should be determined. For this purpose, pore-scale resolved DNS of the solutal convection in porous media with different Rayleigh numbers, Darcy numbers, Schmidt numbers and pore-scale geometries are performed. Convection in different regimes of the convection is analysed based on the DNS results. The corresponding scaling laws for the dimensionless dissolution flux are determined.

The paper is structured as follows. The problem studied and the mathematical equations used in the simulation are introduced in § 2. The test cases are described in § 3. The DNS results are discussed in § 4, which focuses on the scaling laws for the dissolution flux in different regimes of the solutal convection. In § 5, the obtained scaling laws are applied to estimate the dissolution flux of CO$_2$ in an idealized sequestration site. Finally, the conclusions are given in § 6.

2. Statement of problem and mathematical equations

2.1. Statement of problem

Natural convection in a chamber filled with a porous matrix is considered in this study; see figure 1. The chamber has height $H$ and width $L$. The porous matrix is made of square or circular elements with size $d$ and spacing $s$. A representative elementary element (REV) consists of one square or circular porous element. The gravitational force $\boldsymbol {g}=(0,-g)$ is given in the vertical ($-x_2$) direction. A constant solute concentration $c_0$ is prescribed at the upper boundary, while a no-flux condition ($\partial c / \partial x_2 =0$) is used at the lower boundary and the surfaces of the porous matrix. Both boundaries are assumed to be impermeable to the fluid. Similar to the studies by Slim (Reference Slim2014), Hewitt et al. (Reference Hewitt, Neufeld and Lister2013) and Letelier et al. (Reference Letelier, Ulloa, Leyrer and Ortega2023), a slip condition is used at the upper wall. A no-slip condition is used at the lower boundary and the surfaces of the porous matrix; $u_i=0$ and $c=0$ are used as the initial conditions. There is no artificial disturbance in the initial field. The problem studied follows the canonical model proposed by Hidalgo et al. (Reference Hidalgo, Fe, Cueto-Felgueroso and Juanes2012).

Figure 1. Computational domain occupied by a porous matrix made of uniformly distributed square or circular elements (only part of the porous matrix is shown). The upper boundary has a constant solute concentration $c_{0}$ and is impermeable to fluid. The lower boundary is impermeable to both fluid and solute. A periodic boundary condition is used in the horizontal direction.

2.2. Governing equations

The governing equations are the Navier–Stokes equations for incompressible flows – with the buoyancy force modelled with the Boussinesq approximation – and the species transport equation. They are expressed as

(2.1)\begin{gather} \frac{\partial u_i}{\partial x_i}=0, \end{gather}
(2.2)\begin{gather} \frac{\partial u_i}{\partial t}+\frac{\partial (u_j u_i)}{\partial x_j}={-}\frac{\partial p}{\partial x_i}+\nu\,\frac{\partial ^2 u_i}{\partial x^2_j}+\beta c g_i, \end{gather}
(2.3)\begin{gather} \frac{\partial c}{\partial t}+\frac{\partial (u_i c)}{\partial x_i}= D\,\frac{\partial ^2 c}{\partial x^2_i}, \end{gather}

where $u_i$, $p$, $g_i$, $c$, $\nu$, $\beta$ and $D$ are the velocity component, pressure, gravitational acceleration rate component, solute concentration, kinematic viscosity, concentration expansion coefficient and molecular diffusivity, respectively.

Normalizing (2.1)–(2.3) with the characteristic length $H$, velocity $u_m=\beta c_0 g K/\nu$ and solute concentration $c_0$, where $K$ is the permeability of the porous medium, we obtain the following dimensionless equations:

(2.4)\begin{gather} \frac{\partial \tilde{u}_i}{\partial \tilde{x}_i}=0, \end{gather}
(2.5)\begin{gather} \frac{\partial \tilde{u}_i}{\partial \tilde{t}}+\frac{\partial (\tilde{u}_j \tilde{u}_i)}{\partial \tilde{x}_j}={-}\frac{\partial \tilde{p}}{\partial \tilde{x}_i}+\frac{Sc}{\gamma_m\,Ra}\,\frac{\partial ^2 \tilde{u}_i}{\partial \tilde{x}^2_j}-\frac{Sc}{\gamma_m\,Ra\,Da}\,z_i\tilde{c}, \end{gather}
(2.6)\begin{gather} \frac{\partial \tilde{c}}{\partial \tilde{t}}+\frac{\partial (\tilde{u}_i \tilde{c})}{\partial \tilde{x}_i}= \frac{1}{\gamma_m\,Ra}\,\frac{\partial ^2 \tilde{c}}{\partial \tilde{x}^2_i}, \end{gather}

where $z_i$ in (2.5) is the directional vector component of axis $x_2$, with the value $z_i=\delta _{i2}$. The dimensionless and dimensional variables have the relationships

(2.7ae)\begin{equation} \tilde{u}_i=\frac{u_i}{u_m}, \quad \tilde{c} =\frac{c}{c_0}, \quad \tilde{x}_i=\frac{x_i}{H}, \quad \tilde{t}=\frac{u_mt}{H}, \quad \tilde{p}=\frac{p}{u_m^2}. \end{equation}

The Rayleigh number in (2.5)–(2.6) is also called the Rayleigh–Darcy number, defined as

(2.8)\begin{equation} Ra\equiv \frac{u_m H}{D_e}=\frac{H\beta c_0 g K}{D_e\nu}. \end{equation}

The Darcy number is defined as

(2.9)\begin{equation} Da \equiv \frac{K}{H^2}. \end{equation}

The Schmidt number is defined as

(2.10)\begin{equation} Sc \equiv \frac{\nu}{D}. \end{equation}

The ratio of the effective diffusivity $D_e$ to the molecular viscosity is defined as

(2.11)\begin{equation} \gamma_m \equiv \frac{D_e}{D}. \end{equation}

Here, $\gamma _m$ is a geometric parameter that relates only to the geometry of the porous media, and $Ra$ and $\gamma _m$ can be combined in (2.4)–(2.6). However, $\gamma _m$ is treated as an independent dimensionless group in the analysis to characterize the pore-scale geometry, which is not reflected in the governing equations. Besides $\gamma _m$, the porosity $\phi$ is another dimensionless parameter characterizing the pore-scale geometry. Parameters $K$, $D_e$ and $\gamma _m$ must be determined before running the DNS. More details about their definitions and how to determine them for a specific pore-scale geometry are introduced in Appendix A.

2.3. Characteristic scales

It is possible to construct different length, time and velocity scales with the different combinations of geometric parameters and fluid properties. Table 1 shows three sets of scales that are expected to affect convection in porous media significantly. They are termed the diffusive scales, the convective scales and the shut-down scales. The diffusive scales $l_{I}$, $u_{I}$ and $t_{I}$ are dominant in the diffusive regime. The convective scales $l_{II}$, $u_{II}$ and $t_{II}$ characterize the convection before the lower boundary affects the convection. This set of scales is also used by Slim (Reference Slim2014) to analyse the macroscopic simulation results. The shut-down scales $l_{III}$, $u_{III}$ and $t_{III}$ characterize the convection after the convection is affected by the lower boundary. The shut-down velocity scale $u_{III}$ has the same definition as $u_{II}$; it is used to obtain the dimensionless governing equations (2.4)–(2.6).

Table 1. Length, time and velocity scales for the solutal convection in porous media.

The scales in table 1 determine two dimensionless groups, namely the Rayleigh number $Ra$ and the pore-scale Rayleigh number $Ra_K$. Defined in (2.8), $Ra$ is determined by the ratios of the shut-down scales and the convective scales ($l_{III}/l_{II}$ or $t_{III}/t_{II}$). The pore-scale Rayleigh number $Ra_K$ is defined by the ratios of the diffusive scales and the convective scales, expressed as

(2.12)\begin{equation} Ra_K \equiv \sqrt{Da}\,Ra = \frac{l_I}{l_{II}} = \frac{u_{II}}{u_I} =\left(\frac{t_I}{t_{II}}\right)^{1/2} =\frac{\beta c_0 g K^{3/2}}{D_e\nu}. \end{equation}

Also, $Ra$ and $Ra_K$ are linked by the Darcy number $Da$, expressed as

(2.13)\begin{equation} Da = \left(\frac{Ra_K}{Ra}\right)^2. \end{equation}

In addition to the scales listed in table 1, further scales can be defined by combining the current scales with $Sc$, $\gamma _m$ or $\phi$. These scales will be discussed when they are used in the analysis.

An important quantity about the solutal convection is the instantaneous dissolution flux $F$, which is defined as

(2.14)\begin{equation} F = \frac{D}{A_w} \int_w \frac{\partial c}{\partial x_2} \,{\rm d}A, \end{equation}

where $A_w$ is the surface area of the upper boundary. Normalizing $F$ with $c_0D_e/H$ gives the Sherwood number, expressed as

(2.15)\begin{equation} Sh = \frac{H \displaystyle\int_w \dfrac{\partial c}{\partial x_2} \,{\rm d}A}{\gamma_m A_w c_0}, \end{equation}

where $w$ denotes the upper boundary surface.

Flux $F$ can also be normalized using the velocity scales in table 1. Neglecting the effect of $Sc$ and considering a specific pore-scale geometry, the convection depends only on $Ra$ and $Ra_K$, which are determined by the scales in table 1. Therefore, it is expected that the dimensionless flux $F/u_{II}$ can be expressed by a universal function about $t/t_{II}$, $Ra$ and $Ra_K$, expressed as

(2.16)\begin{equation} \frac{F}{u_{II}} = \varPhi\left(\frac{t}{t_{II}}, Ra_K, Ra\right). \end{equation}

Since the lower boundary does not affect the convection before the plumes reach the wall, (2.16) can be simplified as

(2.17)\begin{equation} \frac{F}{u_{II}} = \varPhi_1\left(\frac{t}{t_{II}}, Ra_K\right) \end{equation}

in the early stages of the convection. This regime of solutal convection is termed the $Ra$-independent regime (including the diffusive, linear-growth, flux-growth, merging and re-initiation regimes). The effect of pore-scale diffusion gradually disappears in later stages of convection, leading to the $Ra_K$-independent regime. Equation (2.16) in the $Ra_K$-independent regime can be simplified as

(2.18)\begin{equation} \frac{F}{u_{II}} = \varPhi_2\left(\frac{t}{t_{II}}, Ra\right). \end{equation}

When the Darcy number (or $Ra_K/Ra$) is small enough, there is expected to be an overlap regime where neither $Ra$ nor $Ra_K$ affects the convection. The dimensionless dissolution flux in the overlap regime can be expressed as

(2.19)\begin{equation} \frac{F}{u_{II}} = \varPhi_0\left(\frac{t}{t_{II}}\right). \end{equation}

The function $\varPhi$ should be determined based on the DNS results.

2.4. Numerical methods

A finite volume method is used for the simulation. The solver is developed based on the open-source code package OpenFOAM. A second-order central difference scheme is used for the spatial discretization. The second-order implicit backward scheme is used for time discretization. The pressure-implicit scheme with splitting of operators (PISO) algorithm is used to correct and couple the pressure and velocity fields. More details about the DNS solver are given in Appendix B. The solver has been validated extensively in our previous studies, including the DNS study of the statistically steady convection in porous media (Gasow et al. Reference Gasow, Lin, Zhang, Kuznetsov, Avila and Jin2020, Reference Gasow, Kuznetsov, Avila and Jin2021, Reference Gasow, Kuznetsov and Jin2022). The DNS results for the mean Sherwood number have also been compared with the other studies in the review paper by de Paoli et al. (Reference de Paoli, Howland, Verzicco and Lohse2023).

3. Description of test cases

The dimensional analysis in § 2.2 suggests that the solutal convection in porous media is affected by the Rayleigh number $Ra$, the Schmidt number $Sc$, the scale ratio $H/s$ (which determines the Darcy number $Da$ when the pore-scale geometry is specified) and the pore-scale geometry (characterized by $\phi$ and $\gamma _m$). These parameters are varied in the DNS cases to study their effects. The detailed information about the main cases studied is shown in table 2. The letters ‘G’, ‘R’, ‘S’ and ‘H’ in the case IDs denote the pore-scale geometry, the Rayleigh number $Ra$, the Schmidt number $Sc$, and the scale ratio $H/s$. The numbers following the letters denote the indices of the varied parameters. For example, case G1R1S1H2 (i.e. S6) denotes the case of the first pore-scale geometry, the first Rayleigh number ($Ra=20\,000$), the first Schmidt number ($Sc=250$), and the second scale ratio ($H{/s}=50$). The pore-scale geometry in this study is chosen to meet the following criteria: the pore-scale geometry should be simple enough to produce a high-quality body-fitted mesh; the porous matrix should consist of sufficient number of REVs to analyse the REV-averaged results; the macroscopic properties of the porous media should be homogeneous and isotropic. To meet these criteria, the porous matrices used in the study consist of REVs made of square elements with $\phi =0.56$ (G1), square elements with $\phi =0.36$ (G2), and circular elements with $\phi =0.32$ (G3). The geometric parameters $\phi$, $K$ and $\gamma _m$ for these REVs must be determined before running the DNS. Details of their determination are given in Appendix A. Besides the cases in the table, more calculations for low $Ra_K$ have been carried out up to the flux-growth regime to determine the onset time of convection.

Table 2. Main DNS cases calculated in the study. The cases with $^{a}$ have been calculated up to the constant-flux regime. The case with $^{b}$ has been calculated up to the merging re-initiation regime. The other cases have been calculated up to the shut-down regime. Besides the listed cases, some other cases have been calculated for smaller $Ra_K$ up to the flux-growth regime to determine the onset time of convection.

The governing equations for the DNS are expected to be accurate, as they have been developed from well-established theory. As the solver has also undergone extensive validation, it is important in this study to ensure that sufficient mesh resolutions are used in the DNS. The same mesh resolution, 3600 mesh cells per REV (mesh A), is used in all DNS cases. Case G1R1S1H5, whose porous matrix consists of 40 000 ($400\times 100$) REVs, has the largest number of mesh cells ($1.44\times 10^8$). The maximum Courant number $Co_{max}$, which determines the time step, is set to 0.8. The same mesh resolution and $Co_{max}$ are used in Gasow et al. (Reference Gasow, Lin, Zhang, Kuznetsov, Avila and Jin2020, Reference Gasow, Kuznetsov, Avila and Jin2021, Reference Gasow, Kuznetsov and Jin2022) to calculate the statistically steady convection in porous media. Due to the similarity of the problems, it is expected that the mesh resolution and time step used in this study are also sufficient to calculate the transient solutal convection. However, the mesh resolution and time step may affect the convection in the early stage due to the gap between the initial concentration field $c=0$ and the concentration at the upper boundary $c=c_0$. To assess this effect, case G1R1S1H1 is computed with a higher mesh resolution using 6400 mesh cells per REV (mesh B). The time step is also reduced with increasing mesh resolution since $Co_{max}$ is fixed. The transient Sherwood numbers from the results of two mesh resolutions are shown in figure 2. The mesh resolution and the time step affect the evolution of the Sherwood number slightly in the very early stage of the diffusive regime. In addition, the mesh resolution and the time step also affect the onset time of convection $t_{oc}$, which is very sensitive to the flow conditions. This will be discussed in more detail in § 4. After the onset of convection, the calculated transient Sherwood numbers from different mesh resolutions become almost identical.

Figure 2. Transient Sherwood number $Sh$ versus dimensionless time $t/t_I$ calculated from mesh A (3600 mesh cells per REV) and mesh B (6400 mesh cells per REV), case G1R1S1H1 (S1).

Some cases with high Schmidt numbers ($Sc=10^3$ and $10^4$) are calculated to investigate whether the dissolution flux is affected by the Schmidt number. It can be seen in the momentum and species transport equations (2.5)–(2.6) that the dimensionless groups ${Sc}/{\gamma _m\,Ra}$ and ${1}/{\gamma _m\,Ra}$ in the diffusion terms do not decrease with increasing $Sc$. This means that the smallest flow and species transport length scales of the high Schmidt number cases are not smaller than those of $Sc=250$ when $Ra$ and $\gamma$ are fixed (here, $Ra=20\,000$ and $\gamma _m=0.38$). Therefore, the mesh resolution used for $Sc=250$ is expected to be sufficient also for the high Schmidt number cases.

4. Results and discussion

Using case G1R1S1H2 (S6) as an example, figure 3 shows the time evolution of the Sherwood number in different regimes of the solutal convection. The diffusive (D), flux-growth (FG), merging re-initiation (MR), constant-flux (CF) and shut-down (S) regimes are shown in the figure. The linear-growth regime cannot be clearly identified by the Sherwood number evolution. Figure 3 also shows the $Ra$-independent regime, during which the convection is not affected by the bottom boundary, and the $Ra_K$-independent regime, during which the pore-scale diffusion has negligible effect. They overlap in the $Ra$$Ra_K$-independent regime, which is identical to the constant-flux regime when the domain is high enough for convection to fully develop. These regimes will be discussed in the subsections below.

Figure 3. Regimes of the solutal convection indicated by the time evolution of the Sherwood number $Sh$, case G1R1S1H2 (S6).

4.1. The diffusive and linear-growth regimes

The diffusive and linear-growth regimes are analysed together because they have similar length and time scales. The dissolution flux $F$ decays with $t^{1/2}$ in the diffusive regime (Ennis-King et al. Reference Ennis-King, Preston and Paterson2005; Slim Reference Slim2014). When $F$ and $t$ are normalized with the diffusive scales $u_I$ and $l_I$, their relation can be expressed theoretically as

(4.1)\begin{equation} F/u_I=1/\sqrt{{\rm \pi} t/t_I}. \end{equation}

Equation (4.1) indicates that the relationship between $F/u_I$ and $t/t_I$ is independent of $Ra$, $Sc$, $H/s$ and the pore-scale geometry in the diffusive regime (the dimensional dissolution flux $F$ still depends on these dimensionless parameters). This is confirmed by figure 4(a), where $F/u_I$ for different values of $Ra$, $Sc$ and $H/s$ are compared. However, the collapsed profiles deviate from the theoretical equation (4.1). The reason for this is that the effective diffusivity $D_e$, which is used to calculate $u_I$ and $t_I$, is obtained when the diffusion in the porous medium reaches the equilibrium state. However, this equilibrium state is not reached when the diffusion starts. The effective diffusivity should be close to the molecular diffusion $D$ before the diffusion is affected by the porous elements. If $D$ is used instead of $D_e$ to calculate the diffusive scales, then the modified velocity and time scales become $u_I/\gamma _m$ and $\gamma _m t_I$, respectively. Normalized with the modified diffusive scales, the profiles become identical to those of the theoretical equation in the early stage of diffusion; see figure 4(b). The pore scale starts to affect the diffusion when the solute reaches the porous elements. As a result, $\gamma _m F/u_I$ becomes lower than the theoretical solution. As an approximation, $u_I$ and $t_I$ (instead of $u_I/\gamma _m$ and $\gamma _m t_I$) are still used in (4.1) to calculate the dissolution flux in the diffusive regime. In addition, figure 4 shows that the Schmidt number has very little effect on convection when $Sc>250$.

Figure 4. Dimensionless dissolution flux versus dimensionless time; $Sc$, $Ra$ and $H/s$ are varied. (a) The diffusive scales $u_I$ and $t_I$ are used to normalize $F$ and $t$. (b) The modified diffusive scales $u_I/\gamma _m$ and $\gamma _m t_I$ are used to normalize $F$ and $t$.

Figure 5 shows the time evolution of $\gamma _m F/u_I$ for typical cases of different pore-scale geometries. Again, the DNS results are almost identical to the theoretical solution in the early stage of diffusion. The results from the different pore-scale geometries deviate after the porous matrix affects the diffusion; they also deviate from the theoretical solution. Note that $\gamma _m F/u_I$ for case G3R1S1H1 (S15) is even higher than the analytical solution during the period $10 \le t/(\gamma _m t_I) \le 40$. This indicates the significant pore-scale effect in the diffusive regime.

Figure 5. Dimensionless dissolution flux versus dimensionless time. The pore-scale geometry is varied. The modified diffusive scales $u_I/\gamma _m$ and $\gamma _m t_I$ are used to normalize $F$ and $t$.

As the solute accumulates near the upper boundary, some perturbations appear in the concentration field, leading to the linear-growth regime. The linear-growth regime cannot be evidently identified in the $F\unicode{x2013}t$ profiles. However, it can be visualized in the concentration field; see figure 6. A slight perturbation can be found at location $A$ at $t/t_I=10.2$ in figure 6(a), where the solute is transported more slowly than in the neighbouring REVs. This perturbation expands and amplifies as the boundary layer reaches the second row of the porous elements adjacent to the wall. Figure 6(b) shows that the solute is transported slower at location $A$ and faster at location $B$. This leads to instability of the flow and the onset of convection.

Figure 6. Solute concentration fields during the linear-growth regime, case G1R1S1H1 (S1), for (a) $t/t_I=10.2$, (b) $t/t_I=12$. The light curves indicate the isosurfaces of $\tilde {c}=0.01$.

4.2. The onset of convection and the flux-growth regime

The thickness of the solute boundary layer increases with time in the diffusive regime. Convection begins when the porous matrix can no longer hold the heavy fluid in the boundary layer. Figure 7 shows the time evolution of the concentration field at the interface of the first and second REVs near the upper boundary ($x_2=-s$), which is indicated in figure 6(a). The results of $\tilde {c}(x_1, t)$ are shown in a two-dimensional colour map. The horizontal coordinate $x_1$ is normalized with the pore size $s$, so that $x_1/s$ ranges from 0 to 100 in case G1R1S1H2 (S6), which has 100 REVs in the horizontal ($x_1$) direction. The onset of convection in this test case occurs at $t_{oc}/t_I=22.4$. Weak vertical stripes with spacing $s$ can be found before the onset of convection. These stripes are caused by the different diffusion velocities in the pores. Perturbations with low wavenumbers $\kappa ={\rm \pi} L/l=7{\rm \pi}$ and $3.5{\rm \pi}$, where $l$ is the wavelength, can be observed before the onset of convection. They correspond to the wavelengths $l=L/7$ and $2L/7$. The low-wavenumber fluctuation is enhanced after the onset of convection. In addition, strong high-wavenumber fluctuations are also observed, represented by the vertical stripes with spacing $2s$.

Figure 7. Time evolution of the concentration field at the interface between the first and second REV rows ($x_2=-s$) near the onset of convection ($20\le t/t_I \le 28.5$), case G1R1S1H2 (S6).

The high-wavenumber stripes correspond to the convective figures (original plumes) generated after the onset of convection. Figure 8 confirms that the spacing of the convective figures is approximately $2s$. The convection causes the fast transport of the solute in the vertical ($x_2$) direction in the flux-growth regime, while the dispersion in the horizontal direction has no significant effect. Note that the high-wavenumber original plumes cannot be captured in a macroscopic simulation without modelling the pore-scale motions.

Figure 8. Solute concentration field during the flux-growth regime, case G1R1S1H1 (S1).

The dimensional analysis in § 2.2 shows that the dissolution process is determined by the dimensionless parameters $Ra_K$, $Da$, $Sc$ and the pore-scale geometry (characterized by $\phi$ and $\gamma _m$). Neglecting the effect of $Sc$ and considering a specified pore-scale geometry, it can be found that the dissolution process is determined only by $Ra_K$ before the plumes reach the bottom wall. Considering the relationship $Ra_K=(t_I/t_{II})^{1/2}$, it can be expected that the onset time of convection $t_{oc}$ is related only to the diffusive and convective time scales $t_I$ and $t_{II}$. The relationship is expressed as

(4.2)\begin{equation} t_{oc}=A_1 t_I^{1-\alpha_1} t_{II}^{\alpha_1}, \end{equation}

where $A_1$ and $\alpha _1$ are the scaling coefficients. Considering $Ra_K=({t_I}/t_{II})^{1/2}$, the dimensionless onset time $t_{oc}/t_I$ has the scaling $t_{oc}/t_I \sim Ra_K^{-2\alpha _1}$. According to (4.1), the dissolution flux at the onset of convection has the scaling $F_{oc}/u_I \sim Ra_K^{\alpha _1}$. In the constant-flux regime, the constant flux $F_{cf}$ has the scaling $F_{cf} / u_I \sim Ra_K$, which is equivalent to $F_{cf} / u_{II} = const$. For low $Ra_K$, $\alpha _1$ should have the value $\alpha _1=1$ to ensure that $F_{oc}/u_I$ varies with $Ra_K$ at the same rate as $F_{cf}/u_I$. This is in accordance with the study by Riaz et al. (Reference Riaz, Hesse, Tchelepi and Orr2006), who propose the onset time of convection to be $t_{oc}=146t_{II}$, and the study by Slim & Ramakrishnan (Reference Slim and Ramakrishnan2010), who propose the earliest possible onset time to be $t_{oc}=47.9t_{II}$.

Figure 9 shows the dimensionless onset time of convection $t_{oc} / t_I$ for different values of $Ra_K$. In addition to the cases listed in table 2, some other DNS cases have been calculated to study the onset time of convection for small pore-scale Rayleigh numbers (up to $Ra_K =0.01$). It can be observed that $t_{oc}$ from the DNS results is higher than the theoretical values suggested by Riaz et al. (Reference Riaz, Hesse, Tchelepi and Orr2006) and Slim & Ramakrishnan (Reference Slim and Ramakrishnan2010). This difference is due to the fact that $t_{oc}$ is defined as the start time of the flux-growth regime in this study, whereas the correlation in Slim & Ramakrishnan (Reference Slim and Ramakrishnan2010) is proposed for the earliest possible onset time (the start time of the linear-growth regime). The DNS results show that $t_{oc}$ is very sensitive to perturbations in the flow field at large $Ra_K$. However, it is still possible to estimate $t_{oc}$ from the DNS results at low $Ra_K$ ($Ra_K \le 1$), which gives the scaling coefficient $\alpha _1=1$ in (4.2). The present DNS results show the same scaling coefficient $\alpha _1$ as those of Riaz et al. (Reference Riaz, Hesse, Tchelepi and Orr2006) and Slim & Ramakrishnan (Reference Slim and Ramakrishnan2010). The other coefficient $A_1$ increases from 1200 to 3000 as the porosity increases from $0.32$ to $0.56$. Note that the DNS results show that $\alpha _1$ is less than 1 at large $Ra_K$. Therefore, (4.2) with the given coefficients may under-predict the onset time of convection at large $Ra_K$.

Figure 9. Dimensionless time for the onset of convection $t_{oc}/t_I$. The DNS results are compared with the correlation equations.

The convection enters the flux-growth regime after the onset of the convection. In this regime, the dissolution flux grows rapidly until it reaches its maximum value $F_{fg}$. Figure 10 shows that the dimensionless period of the flux-growth regime $\Delta t_{fg}/t_I$ increases with increasing $t_{oc}/t_I$. Using a linear approximation, the relationship between $\Delta t_{fg}$ and $t_{oc}$ is expressed as

(4.3)\begin{equation} \Delta t_{fg}=A_2t_{oc}. \end{equation}

The scaling coefficient $A_2$ is close to $0.5$ at small $Ra_K$.

Figure 10. Time evolution of the dimensionless concentration flux at the upper boundary $F/u_I$, where $Ra$ and $H/s$ are varied: (a) geometry G1 (square elements with $\phi =0.56$); (b) geometries G2 (square elements with $\phi =0.36$) and G3 (circular elements with $\phi =0.32$).

To ensure that $F_{fg}/u_I$ varies at the same rate as $F_{cf}/u_I$ with $Ra_K$, there should be the scaling law

(4.4)\begin{equation} F_{fg} / {u_I} = A_3 Ra_K, \end{equation}

which is equivalent to $F_{fg} / u_{II} = A_3$. Considering that the time to reach the maximum flux $t_{fg}$ has the scaling law $t_{fg} / {t_I} \sim Ra_K^{-2\alpha _1}$, $F_{fg} / {u_I}$ should also have the scaling law

(4.5)\begin{equation} F_{fg} / {u_I} \sim \left(t_{fg} / t_I\right)^{{-}1/(2\alpha_1)}. \end{equation}

This means that $F_{fg} / {u_I}$ decreases with the scaling $(t_{fg} / t_I)^{-1/2}$ for small $Ra_K$, while it decreases faster for large $Ra_K$. This is confirmed by the DNS results in figure 10, which shows that $F_{fg} / {u_I}$ decreases with the scaling $(t_{fg} / t_I)^{-0.7}$ for large $Ra_K$. The DNS show that the scaling coefficient $A_3$ depends on the pore-scale geometry. It takes value $0.04$ for geometry G1, and $0.026$ for geometries G2 and G3.

Using a linear approximation, the dimensionless dissolution flux in the flux-growth regime can be calculated as

(4.6)\begin{equation} F = F_{oc}+(t-t_{oc})\,\frac{F_{fg}-F_{oc}}{\Delta t_{fg}}. \end{equation}

The onset dissolution flux $F_{oc}$ can be calculated using the diffusion equation (4.1) with $t=t_{oc}$.

4.3. The merging re-initiation regime

The dissolution flux decreases after reaching its maximum value, and the convection thereafter enters the merging re-initiation regime. Figure 11 shows the time evolution of the concentration field on the line $x_2=-s$ during the merging re-initiation regime. Typical events of re-initiation and merging are indicated by ${R_i}$ and ${M_i}$ in the figure, where the subscript ${i}$ denotes the index of an event. It can be seen that the plume merging and re-initiation occur in the same period; see ${R_1}$ and ${M_1}$ in figure 11. Therefore, in this study, the merging and re-initiation regimes are combined into the merging re-initiation regime. The original plumes that have spacing $2s$ are identified by the straight vertical stripes in the figure. These vertical stripes decay rapidly due to the pore-scale dispersion. Both symmetric (${R_1}$, ${R_2}$ and ${R_3}$) and asymmetric (${R_4}$) structures of plume re-initiation can be found in the figure. This means that the new plumes can spread in both ($x_1$ and $x_2$) directions or in a single direction. Dispersion plays an important role in plume dynamics. Horizontal dispersion causes the original plumes (convective figures) to merge (${M}_1$ and ${M}_2$). It also causes an original plume to merge with a new plume (${M}_3$).

Figure 11. Time evolution of the concentration field at the interface between the first and second REV rows ($x_2=-s$) near the upper boundary during the merging re-initiation regime ($28.5\le t/t_I \le 71.3$), case G1R1S1H2 (S6). Typical events of re-initiation (${R_1}$${R_4}$) and merging (${M_1}$${M_3}$) are indicated.

Figure 12 shows the instantaneous REV-averaged concentration fields in the merging re-initiation regime for the cases with different scale ratios and Rayleigh numbers. The convective fingers extended in the vertical direction can be clearly observed in all cases. The plume merging and re-initiation cannot be clearly observed since they occur only near the upper boundary. Figures 12(ac) have the same Rayleigh number $Ra=20\,000$. As the scale ratio $H/s$ increases from 50 to 200, the corresponding $Ra_K$ value decreases from 23.7 to 6. Discontinuity of the convective fingers is observed in figure 12(c) ($Ra_K=6$). This phenomenon is due to the intermittent eruption of the convection (not only at the top boundary, but also near the porous elements). When the solute accumulates in a REV, the eruption of convection occurs when the porous matrix can no longer hold the heavy fluid. This is similar to the onset of convection at the upper boundary. It can be seen in figure 9 that the onset time of convection has significant uncertainties at high $\phi$ and $Ra_K$ values. These uncertainties are expected to cause the discontinuity of the plumes. At low $Ra_K$ (figure 12e), strong plume instability is still observed near the upper boundary, causing the plume re-initiation. Compared to high-$Ra_K$ convection, the diffusion has a more significant effect at low $Ra_K$. This is in accordance with the study in Gasow et al. (Reference Gasow, Kuznetsov, Avila and Jin2021), which suggests that the macroscopic diffusion cannot be neglected at low Darcy numbers.

Figure 12. The REV-averaged solute concentration $\langle \tilde {c}\rangle$ fields during the merging re-initiation regime: (a) $Ra=20\,000$, $H/s=50$, case G1R1S1H2 (S6); (b) $Ra=20\,000$, $H/s=100$, case G1R1S1H3 (S7); (c) $Ra=20\,000$, $H/s=200$, case G1R1S1H4 (S8); (d) $Ra=80\,000$, $H/s=400$, case G1R1S1H5 (S9); (e) $Ra=1600$, $H/s=200$, case G2R4S1H3 (S14). Part of the computational domain near the upper boundary is shown.

Figure 13 shows the power spectra of the dimensionless concentration $E_c$ on the line $x_2=-s$ at typical times. Some low-wavenumber fluctuations ($0.05 \le \kappa /\kappa _p \le 0.07$) can be found in the merging re-initiation regime (the solid lines), where $\kappa _p={\rm \pi} L/s$ is the wavenumber for the pore size $s$. However, the high-wavenumber fluctuations ($0.44\le \kappa /\kappa _p \le 0.56$) are dominant at this time. These high-wavenumber fluctuations decay rapidly, while the low-wavenumber fluctuations gradually dominate. Note that some high-wavenumber fluctuations can still be observed even after the merging re-initiation regime.

Figure 13. Power spectra of the solute concentration $\tilde {c}$ at the interface between the first and second REV rows ($x_2=-s$) for cases with different pore-scale geometries: (a) case G1R1S1H2 (S6), (b) case G3R1S1H2 (S19).

Figure 14 shows the relationship between $F/u_{II}$ and $t/t^{\ast }_{II}$, where $t^{\ast }=t-t_{oc}$ is the time since the onset of convection. It can be seen in the figure that $F/u_{II}$ decreases rapidly at the beginning of the merging re-initiation regime, corresponding to the merging of the original plumes with high wavenumbers. The decrease slows down as the low-wavenumber plumes dominate. The dissolution flux during this period follows the scaling law

(4.7)\begin{equation} F/u_{II} = A_4 (t^{{\ast}}/t_{II})^{a_1}, \end{equation}

where the scaling coefficient can be approximated as $a_1=-0.2$. If $t^{\ast }$ is scaled with $t^{\ast }_{mr}$, which is the time when the $t^{\ast -0.2}$ scaling starts, then the profiles in figure 14 will collapse in the period of the $t^{\ast -0.2}$ scaling.

Figure 14. Time evolution of the dimensionless concentration flux at the upper boundary $F/u_{II}$ during the merging re-initiation regime, where $Ra$ and $H/s$ are varied: (a) geometry G1 (square elements with $\phi =0.56$); (b) geometry G2 (square elements with $\phi =0.36$); (c) geometry G3 (circular elements with $\phi =0.32$). The macroscopic simulation results are extracted and reproduced from the corresponding figure in Slim (Reference Slim2014).

The wavenumber of the original plumes decreases with decreasing $Ra_K$. For low $Ra_K$, high-wavenumber pore-scale dispersion is expected to be negligible in the merging re-initiation regime, so that $t^{\ast }_{mr}$ is identical to $t^{\ast }_{fg}$. This is confirmed by the results for $Ra=1600$ ($Ra_K=0.21$, case S14) in figure 14(b), and $Ra=427$ ($Ra_K=0.097$, case S18) in figure 14(c). The computational domain in case S18 is not high enough for the the plumes to fully develop. Case S14 is calculated until the dissolution flux increases again due to the plume re-initiation, which occurs at approximately $t^{\ast }/t_{II}=3000$ ($F/u_{II}=0.015$). The constant flux has not yet been reached. Both cases show that the dimensionless maximum flux $F_{fg}/u_{II}$ for low $Ra_K$ is almost identical to $F_{mr}/u_{II}$ in the cases of large $Ra_K$, where $F_{mr}$ is the flux as the $t^{\ast -0.2}$ scaling starts. Therefore, the scaling coefficient $A_4$ can be determined by substituting $F=F_{fg}$ and $t^{\ast }=\Delta t_{fg}$ into (4.7).

The DNS results are compared with the macroscopic simulation results in Slim (Reference Slim2014). A $t^{\ast -0.2}$ scaling is also observed after the time adjustment of the macroscopic simulation results. The deviations between the DNS and macroscopic simulation results indicate the significant pore-scale effect. Note that the dissolution flux decays faster than the $t^{\ast -0.2}$ scaling in the low-$Ra_K$ cases. A possible reason for this is that the domain size in this study is still not large enough for the full development of the plumes. This may hinder the instability of the convection. Another possible reason is that the diffusion has a stronger effect at lower $Ra_K$. The convection at high $Ra$ and low $Ra_K$ still needs to be more deeply investigated.

The $(t^{\ast }/t_{II})^{-0.2}$ scaling holds until the convection reaches the constant-flux regime. If the domain is not high enough for the convection to fully develop (to reach the $Ra$-independent constant-flux regime), then the constant flux $F_{cf}$ is determined by (4.7) when the plume tips reach the bottom boundary. Figure 15 shows the time evolution of the dimensionless location of the plume tips $x_2^{\ast }/l_{II}$, where $x_2^{\ast }$ is defined as the smallest $x_2$ for $\langle \tilde {c}\rangle \ge 0.01$. The operator $\langle \rangle$ denotes the REV averaging. The DNS results show that the dimensionless velocity of the plume tips ($u_{pt}/u_{II}$) is in the range $0.3\unicode{x2013}0.6$ for the cases studied. If $u_{pt}/u_{II}$ is assumed to be a constant, then the time for the plume tips to reach the lower boundary $\Delta t^{\ast }$ has the scaling $\Delta t^{\ast } \sim H /u_{II}$. Substituting this scaling into (4.7) and considering the relationship $Sh = F/u_{II}\,Ra$, we can obtain the scaling law

(4.8)\begin{equation} Sh \sim Ra^{0.8}. \end{equation}

This scaling law is close to the experimental result $Sh \sim Ra^{0.84}$ and the analytical solution $Sh \sim Ra^{4/5}$ obtained in Neufeld et al. (Reference Neufeld, Hesse, Riay, Hallworth, Tchelepi and Huppert2010) for the constant-flux regime.

Figure 15. Dimensionless location of the plume tips $x_2^{\ast }/l_{II}$ versus dimensionless time $t/t_{II}$.

4.4. The constant-flux regime

The high-wavenumber plumes are significantly weakened after the merging re-initiation regime. A constant-flux regime is reached when the re-initiation and merging of the new plumes are in equilibrium. Figure 16 shows the time evolution of the concentration field at the interface $x_2=-s$ in the constant-flux regime. The straight stripes that characterize the original high-wavenumber plumes are barely visible in the figure. Instead, the merging and re-initiation of the low-wavenumber new plumes dominate. Correspondingly, $E_c$ at high wavenumbers ($\kappa /\kappa _p \approx 0.5$) decreases significantly after the merging re-initiation regime; see figure 13.

Figure 16. Time evolution of the concentration field at the interface between the first and second REV rows near the upper boundary ($x_2=-s$) during the constant-flux regime ($105.5\le t/t_I \le 148.3$), case G1R1S1H2 (S6).

Figure 17 shows the new plumes in the constant-flux regime for different scale ratios and Rayleigh numbers. Compared to the original plumes shown in figure 12, the new plumes have smoother shapes, due to the effect of dispersion. The intermittent eruption of the convective figures found in the case of low $Ra_K$ (figure 12c) does not occur in the new plumes. It can be observed in figure 17(c) that the new plumes are continuously spreading and covering the original plumes. The instantaneous dimensionless velocity components during the merging re-initiation regime and the constant-flux regime are compared at the horizontal line $x_2=-s$; see figure 18. The horizontal dispersion for the studied porous medium is much stronger than the vertical dispersion. The amplitude of the $u_1$ fluctuation is approximately one order higher than that of the $u_2$ fluctuation. It is still not clear how the arrangement of the porous elements affects the dispersion. During the constant-flux regime, $u_1$ is not obviously different from that during the merging re-initiation regime. The main difference is in the distribution of $u_2$: during the merging re-initiation regime, the direction of the plumes changes alternately with the length scale $2s$, which corresponds to the peaks of the concentration spectra at high wavenumbers; see figure 13(a). In contrast, the lower-wavenumber motions become more important after the new plumes have fully developed. Figure 18(b) shows that $u_2$ has the same direction in three neighbouring channels, corresponding to the low-wavenumber peaks in figure 13(a).

Figure 17. The REV-averaged solute concentration $\langle \tilde {c}\rangle$ fields during the constant-flux regime: (a) $Ra=20\,000$, $H/s=50$, case G1R1S1H2 (S6); (b) $Ra=20\,000$, $H/s=100$, case G1R1S1H3 (S7); (c) $Ra=20\,000$, $H/s=200$, case G1R1S1H4 (S8); (d) $Ra=80\,000$, $H/s=400$, case G1R1S1H5 (S9). Part of the computational domain near the upper boundary is shown.

Figure 18. Dimensionless horizontal and vertical velocity components (a) $u_1/u_I$ and (b) $u_2/u_I$ at the interface between the first and second REV rows near the upper boundary ($x_2=-s$), case G1R1S1H4 (S8). The results in the merging re-initiation and constant-flux regimes are compared.

The equilibrium between the merging and re-initiation of the plumes leads to the constant-flux regime. The dimensionless constant flux is given by

(4.9)\begin{equation} F_{cf}/u_{II}=A_5. \end{equation}

Figure 19 shows the dimensionless constant fluxes $F_{cf}/u_{II}$ computed from DNS. It is not necessary for the convection to be $Ra$$Ra_K$-independent in the constant-flux regime. A short constant-flux regime exists even when the scale ratio $H/s$ has a small value ($H/s=20$). However, $F/u_{II}$ is under-predicted at high porosity and over-predicted at low porosity when the scale ratio $H/s$ is not large enough for the new plumes to fully develop before they reach the lower boundary. In this study, the constant flux in the $Ra$$Ra_K$-independent regime is approximated by the constant flux $F_{cf}$ in the cases $H/s \ge 50$. According to the DNS results, $A_5$ decreases from $0.032$ for high porosity ($\phi =0.56$) to $0.016$ for low porosity ($\phi =0.32$). Note that $A_5$ obtained from DNS for low porosity ($\phi =0.32$ or $0.36$) is very close to the constant value 0.017 obtained from the macroscopic simulation by Slim (Reference Slim2014).

Figure 19. Dimensionless constant flux at the upper boundary $F_{cf}/u_{II}$ versus pore-scale Rayleigh number $Ra_K$.

4.5. The shut-down regime

The constant-flux regime lasts for a period $\Delta t_{cf}$ until the plumes near the upper boundary are affected by the lower boundary. Near the end of the constant-flux regime, some bright zones can still be observed near the upper boundary (figure 20a) as dissolved solutes accumulate near the lower boundary, while the concentration near the upper boundary is not affected by the increased solute. These bright zones disappear when the convection enters the shut-down regime (figure 20b).

Figure 20. The REV-averaged solute concentration $\langle \tilde {c}\rangle$ fields (a) near the end of the constant-flux regime ($t/T_I=221$), and (b) in the shut-down regime ($t/T_I=257$), for $Ra=20\,000$, $H/s=50$, case G1R1S1H2 (S6).

Figure 21 shows the $x_1$- and REV-averaged concentration $\langle \tilde {c}\rangle _{x1}$ at different times. The DNS results indicate that $\langle \tilde {c}\rangle _{x1}$ is almost constant for the first three REVs next to the upper boundary during the constant-flux regime. At the end of the constant-flux regime, the solute concentration $\langle \tilde {c}\rangle _{x1}$ becomes generally uniformly distributed, with $\langle \tilde {c}\rangle _{x1}=A_6=0.3$ except for the first three REVs near the upper boundary. This means that the shut-down regime starts when the storage capacity of the porous medium is charged to approximately $30\,\%$ (the mean solute concentration in the porous medium reaches approximately 30 %). The pore-scale geometry has very little effect on the value of $A_6$. For large Rayleigh number convection, where the constant-flux regime is much longer than the preceding regimes, $\Delta t_{cf}$ can be estimated as

(4.10)\begin{equation} \Delta t_{cf} = A_6 \phi H / F_{cf}. \end{equation}

By normalizing (4.10) with the shut-down scales, the following relationship can be obtained:

(4.11)\begin{equation} \Delta t_{cf}/t_{III} = A_6\phi / \left(F_{cf}/u_{III}\right). \end{equation}

With $A_6=0.3$ and $F_{cf}/u_{III}$ given by (4.9) (note that $u_{III}$ is identical to $u_{II}$), $\Delta t_{cf}/t_{III}$ can be calculated. It has value 5.3 for geometry G1, 5.7 for geometry G2, and 6.0 for geometry G3. These estimated values are validated with the DNS results in figure 22. The gap between the predicted starting time of the shut-down regime and the DNS results is due to the uncertainty in the model coefficient $A_6$ and the dissolution process prior to the constant-flux regime.

Figure 21. The REV- and $x_1$-line-averaged solute concentration $\langle \tilde {c}\rangle _{x1}$ during the constant-flux and shut-down regimes for cases (a) G1R1S1H2 (S6), (b) G2R1S1H2 (S13) and (c) G3R1S1H2 (S19).

Figure 22. Time evolution of the dimensionless dissolution flux at the upper boundary $F/u_{III}$ during the shut-down regime, where $Ra$ and $H/s$ are varied: (a) geometry G1 (square elements with $\phi =0.56$); (b) geometry G2 (square elements with $\phi =0.36$); (c) geometry G3 (circular elements with $\phi =0.32$).

Hewitt et al. (Reference Hewitt, Neufeld and Lister2013) and Slim (Reference Slim2014) suggest that a box model can be used to estimate the dissolution flux in the shut-down regime. Similar to the box model, the dimensionless flux can be calculated as

(4.12)\begin{equation} F/u_{III} = A_7 \left(t/t_{III}\right)^{a_2}. \end{equation}

Here, the time offset is neglected with the assumption of large $Ra$. The DNS results can be well fitted by (4.12) with $A_7$ in the range $0.24\unicode{x2013}0.26$ and $a_2$ from $-1.2$ for high porosity (geometry G1) to $-1.5$ for low porosity (geometries G2 and G3). The pore-scale geometry may affect the scaling coefficients through the effective viscosity suggested by Gasow et al. (Reference Gasow, Kuznetsov, Avila and Jin2021). How to quantify this effect is still an open question, which deserves further studies. The scaling coefficient $a_2$ for low porosity (geometries G2 and G3) has a similar value to the coefficient $a_2=-2$ suggested by Hewitt et al. (Reference Hewitt, Neufeld and Lister2013) and Slim (Reference Slim2014).

5. Application of the scaling laws

According to the analysis in § 4, the effect of the diffusive scales on convection is limited in the diffusive regime when $Ra_K$ is small. Thus at high $Ra$ ($Ra > 5000$) and low $Ra_K$ ($Ra_K \ll 1$), the scaling laws for the dissolution flux can be summarized as

(5.1)\begin{align} \varPhi(\hat{t}, Ra)= \left\{ \begin{array}{@{}ll} \displaystyle \dfrac{1}{\sqrt{{\rm \pi} \hat{t}}}, & \hat{t} \le A_1,\\ \displaystyle \dfrac{1}{\sqrt{{\rm \pi} A_1}}+\dfrac{\hat{t}-A_1}{A_1A_2}\left(A_3-\dfrac{1}{\sqrt{{\rm \pi} A_1}}\right), & A_1< \hat{t} \le A_1+A_1A_2,\\ \displaystyle A_4\left(\hat{t}-A_1\right)^{a_1}, & \displaystyle A_1+A_1A_2 < \hat{t} \le A_1+\left(\dfrac{A_5}{A_4}\right)^{1/a_1},\\ \displaystyle A_5, & \displaystyle A_1+\left(\dfrac{A_5}{A_4}\right)^{1/a_1} < \hat{t} \le \dfrac{A_6\phi\, Ra}{A_5},\\ \displaystyle A_7\left(\dfrac{\hat{t}}{Ra}\right)^{a_2}, & \displaystyle \hat{t} > \dfrac{A_6\phi\,Ra}{A_5},\\ \end{array}\right. \end{align}

where $\varPhi (\hat {t}, Ra)=F/u_{II}$ and $\hat {t}=t/t_{II}$ are the dissolution flux and the time normalized with the convective scales. Table 3 shows the scaling coefficients estimated from the DNS results. However, these coefficients can have uncertainties due to the simplified pore-scale geometry and relatively large $Ra_K$ in this study.

Table 3. The scaling coefficients in (5.1) for different pore-scale geometries.

The example studied in Neufeld et al. (Reference Neufeld, Hesse, Riay, Hallworth, Tchelepi and Huppert2010) is used to demonstrate the application of the proposed scaling laws. The dissolution flux of CO$_2$ in an idealized sequestration site is to be estimated in this example. The properties of the fluid and the porous medium are given in table 4. It is assumed that the pore-scale properties of the studied porous medium are the same as those of geometry G2, which has a porosity ($\phi =0.36$) similar to that of the example ($\phi =0.375$). The diffusive, convective and shut-down scales for this test case are given in table 5.

Table 4. The fluid and porous medium properties for CO$_2$ dissolution in an idealized sequestration site, taken from Neufeld et al. (Reference Neufeld, Hesse, Riay, Hallworth, Tchelepi and Huppert2010). Equivalent to (2.8) and (2.12), the Rayleigh numbers are calculated as $Ra={H\,\Delta \rho \,g K}/{D_e\mu }$ and $Ra_K={\Delta \rho \,g K^{3/2}}/{D_e\mu }$. The effective diffusivity is approximated as $D_e=\phi D$.

Table 5. Length, time and velocity scales for the test case.

Using (5.1) with the scaling coefficients for $\phi =0.36$, it can be estimated that the onset time of convection is $72$ days, while it takes approximately $36 \ \mathrm {days}$ for the dissolution flux to reach the maximum value $F_{fg} =0.36\,{\rm m}\,{\rm y}^{-1}$. The constant flux is $F_{cf} =0.26\,{\rm m}\,{\rm y}^{-1}$. The estimated constant flux is mildly lower than the value calculated using the scaling law ($Sh=0.19\,Ra^{0.8}$) proposed by Neufeld et al. (Reference Neufeld, Hesse, Riay, Hallworth, Tchelepi and Huppert2010), which is approximately $0.40\,{\rm m}\,{\rm y}^{-1}$. One reason for this deviation is that the pore-scale geometry has a significant effect on the scaling coefficients, while the scaling coefficients in this study are obtained for simplified pore-scale geometries made of square or circular elements. In addition, the Darcy number in Neufeld et al. (Reference Neufeld, Hesse, Riay, Hallworth, Tchelepi and Huppert2010) is $5.87\times 10^{-15}$, which is much smaller than $2.8 \times 10^{-7}$, which is used to obtain the scaling coefficients. Figure 23 shows the calculated time evolution of the dissolution flux $F$ and the sequestration progress $G$, which is defined as

(5.2)\begin{equation} G(t) = \frac{1}{\phi H} \int_t F \,{\rm d}t^{\prime}. \end{equation}

The value of $G$ becomes 1 when the entire porous medium is filled with saturated CO$_2$. According to the scaling laws obtained, it takes approximately 10 years to use up the $30\,\%$ storage capacity of the porous medium, while it takes approximately 100 years for $G$ to reach $70\,\%$.

Figure 23. Time evolution of the dissolution flux $F$ and the progress of sequestration $G$. The dissolution flux $F$ is in ${\rm m}\,{\rm y}^{-1}$, which is $m^3$ of dissolved CO$_2$ per unit of surface area ($m^2$) and time (year).

6. Conclusions

A pore-scale resolved DNS study has been carried out to analyse the scaling laws for the solutal convection in porous media. The study focuses on the effect of the diffusive scales ($l_I$, $t_I$ and $u_I$), the convective scales ($l_{II}$, $t_{II}$ and $u_{II}$) and the shut-down scales ($l_{III}$, $t_{III}$ and $u_{III}$) on the convection. Two dimensionless groups, $Ra_K$ and $Ra$, are determined by these scales. According to the dimensional analysis, besides $Ra_K$ and $Ra$, the convection is also influenced by $Sc$ and the pore-scale geometry. However, the DNS results show that the effect of $Sc$ can be neglected when $Sc \ge 250$.

Based on the DNS results, the scaling laws for the transient dissolution flux are proposed in the different regimes of convection. It is found that the onset time of convection $t_{oc}$ has the scaling $t_{oc} \sim t_{II}$ at low $Ra_K$. This is in accordance with the studies by Riaz et al. (Reference Riaz, Hesse, Tchelepi and Orr2006) and Slim & Ramakrishnan (Reference Slim and Ramakrishnan2010). The dimensionless onset time $t_{oc} / t_{II}$ increases with increasing porosity. In addition, the DNS suggests that the period of the flux-growth regime $\Delta t_{fg}$ is also determined by the convective time scale, with the scaling $\Delta t_{fg} \sim t_{II}$.

The DNS results show that the merging of the original plumes and the re-initiation of the new plumes occur in the same period. This differs from previous macroscopic simulation studies. The dispersion plays an important role in the merging re-initiation regime. It leads to the merging of both original and new plumes. When $Ra_K$ is large, the dissolution flux decreases sharply during the early stage of the merging re-initiation regime. This is due to the merging of the original high-wavenumber plumes. The sharp decrease in flux does not occur when $Ra_K$ is small. The low-wavenumber plumes merge more slowly, resulting in the $F/u_{II} \sim (t^{\ast }/t_{II})^{-0.2}$ scaling. The $F/u_{II} \sim (t^{\ast }/t_{II})^{-0.2}$ scaling becomes more pronounced as the porosity decreases.

After the merging and re-initiation of the new plumes reach equilibrium, and before the lower boundary affects the flux, the convection reaches a constant-flux regime. If the domain is not high enough for the new plumes to fully develop, then a short constant-flux regime can still be reached when the plume tips reach the lower boundary. However, the constant flux $F_{cf}$ under this situation is affected by the domain height $H$. Assuming that the velocity of the plume tips is constant, the $F/u_{II} \sim (t^{\ast }/t_{II})^{-0.2}$ scaling leads to the nonlinear scaling $Sh \sim Ra^{-0.8}$. This is in accordance with the nonlinear scaling law for the Sherwood number that was obtained in the previous experiments.

The constant fluxes obtained in the cases $H/s \ge 50$ are used to approximate the constant flux $F_{cf}$ in the $Ra$$Ra_K$-independent regime. It is still impossible to exclude the possibility that the flux will continue to change as $H/s$ increases. However, the DNS results show that the new plumes are generally fully developed before the plumes reach the bottom boundary. This makes the DNS results a reasonable approximation of $F_{cf}$.

The shut-down regime starts when the storage capacity of the porous medium is charged to $30\,\%$. With this value and the constant flux, it is possible to predict the period of the constant-flux regime. For large $Ra$, the dimensionless flux in the shut-down regime decays with the scaling laws $F/u_{III} \sim (t/t_{III})^{-1.2}$ at large porosity ($\phi =0.56$) and $F/u_{III} \sim (t/t_{III})^{-1.5}$ at low porosity ($\phi =0.32$ or $0.36$).

The pore-scale resolved DNS provides a useful tool for understanding the solutal convection in porous media. However, the convection calculated in this study has relatively high $Ra_K / Ra$ ratios (or Darcy numbers). Calculations of convection with lower Darcy numbers are needed in the future to obtain a more distinct $Ra$$Ra_K$-independent regime. In addition, the DNS results show that the pore-scale geometry has a significant effect on the scaling coefficients. The scaling coefficients are obtained from the DNS with simplified pore-scale geometries made of square or circular elements in this study. This may lead to the deviation between the predicted dissolution flux and that of a real CO$_2$ sequestration process. It is important to determine the scaling coefficients for real geological formations to predict a real CO$_2$ sequestration process.

Funding

The authors gratefully acknowledge the support of this study by the Deutsche Forschungsgemeinschaft (408356608 and 552151258). The computations were performed at the computing centre of Hamburg University of Technology (RZ-TUHH) and the Germany-wide National High Performance Computing Alliance (NHR@ZIB and NHR@Göttingen).

Declaration of interests

The author reports no conflict of interest.

Data availability statement

The data are available through direct contact with the author.

Appendix A. Geometric parameters

For a specified pore-scale geometry, $\phi$ can be calculated directly. For the porous media consisting of square elements, $\phi$ is calculated as

(A1)\begin{equation} \phi = 1-\frac{d^2}{s^2}, \end{equation}

where $d$ and $s$ are the size and spacing of the porous elements, respectively. For the porous media consisting of circular elements, $\phi$ is calculated as

(A2)\begin{equation} \phi = 1-\frac{{\rm \pi} d^2}{4s^2}. \end{equation}

To determine the permeability $K$, it is necessary to calculate the flow in a porous medium consisting of the same REVs. The set-up of the calculation is shown in figure 24(a). A gravitational force $\boldsymbol {g}=(g,0)$ is prescribed to drive the fluid to flow. Periodic boundary conditions are given in both the streamwise and spanwise directions. Then $K$ is obtained by fitting the linear relationship between $g$ and the superficial velocity component in the streamwise direction $u_D$, expressed as

(A3)\begin{equation} \frac{\nu}{K}\,u_D=g. \end{equation}

Figure 24. The test cases for determining (a) the permeability $K$ and (b) the diffusivity ratio $\gamma _m$.

Ghanbarian et al. (Reference Ghanbarian, Hunt, Ewing and Sahimi2013) suggest using $1/\gamma _m$ as the diffusive tortuosity, which is related only to the pore-scale geometry in the studied problem. To determine the value of $\gamma _m$, the species transfer in the porous medium bounded by two patches with different species concentrations $c_1$ and $c_0$ ($c_1>c_0$) is calculated; see figure 24(b). The velocity is set to zero. A periodic boundary condition in the horizontal direction is given for the concentration $c$ field. The flux of $c$ at the upper (or lower) boundary $F$ is determined by the numerical results. The diffusivity ratio $\gamma _m$ can be calculated as

(A4)\begin{equation} \gamma_m=\frac{F}{F_f}, \end{equation}

where $F_f=D(c_1-c_0)/H$ is the flux without the porous medium in the chamber, and $H$ is the height of the chamber. Due to the resistance of the porous matrix to the species transfer, $F$ is always less than $F_f$. Therefore, the values of $\gamma _m$ in table 2 are all less than 1. Note that $\gamma _m$ is approximated by $\phi$ in some studies. However, table 2 shows that $\gamma _m$ is less than $\phi$ for the pore-scale geometries studied.

The relations of the geometric parameters $\phi$, $K/d_0^2$ and $\gamma _m$ are shown in figure 25, where $d_0$ is the equivalent diameter of a porous element. For a two-dimensional porous medium, $d_0$ is the diameter of a circle that has the same area as the porous element. The results for $K/d_0^2$ are compared with the Carman–Kozeny equation (Kozeny Reference Kozeny1927; Carman Reference Carman1956), which is expressed as

(A5)\begin{equation} K=\frac{d_0^2\phi^3}{180(1-\phi)^2}. \end{equation}

Figure 25. Relations of the geometric parameters (a) $K/d_0^2$ versus $\phi$ and (b) $\gamma _m$ versus $\phi$. The values of the parameters are according to Gasow et al. (Reference Gasow, Kuznetsov and Jin2022).

Figure 25 shows that the pore-scale geometry has a more significant effect on the porous medium properties at low porosity. This means that it is necessary to describe the effect of pore-scale geometry using multiple parameters at low porosity.

Appendix B. The DNS solver algorithms

A finite volume method is used in the DNS solver. Integrating (2.2)–(2.3) over a mesh cell $\varOmega$ with the volume $V$ and using Gauss’ integral theorem, we have

(B1)\begin{gather} \frac{\partial \int_\varOmega u_i \,{\rm d}V'}{\partial t} +\sum_f(\boldsymbol{s}_{f} \boldsymbol{\cdot} \boldsymbol{u}_{f})u_{if} ={-}\int_\varOmega{\frac{\partial p}{\partial x_i}}\,{\rm d}V' +\nu \sum_f\left(\boldsymbol{s}_{f} \boldsymbol{\cdot} \left(\boldsymbol{\nabla} u_i\right)_f \right) +\beta g_i \int_\varOmega c \,{\rm d}V', \end{gather}
(B2)\begin{gather} \frac{\partial \int_\varOmega c\,{\rm d}V'}{\partial t} +\sum_f(\boldsymbol{s}_{f} \boldsymbol{\cdot} \boldsymbol{u}_{f})c_{f} = D \sum_f\left(\boldsymbol{s}_{f} \boldsymbol{\cdot} \left(\boldsymbol{\nabla} c\right)_f \right), \end{gather}

where $\boldsymbol {s}_f$ is a surface vector at the boundary of the mesh cell.

Using the backward scheme, the time derivative term can be calculated as

(B3)\begin{equation} \frac{\partial \int_\varOmega \varphi \,{\rm d}V'}{\partial t} =\frac{3\varphi_P^{(n)}-4\varphi_P^{(n-1)}+\varphi_P^{(n-2)}}{\Delta t}, \end{equation}

where $\varphi _P^{(n)}$ is the volume-averaged value of $\varphi$ in cell $P$ at the current time step ($n$). Here, $\varphi$ can be $u_i$ or $c$. The superscripts $(n-1)$ and $(n-2)$ denote the values at the previous one or two time steps.

Using a central difference scheme, $\varphi$ at a surface is calculated as

(B4)\begin{equation} \varphi_f=f_x\varphi_P+\left(1-f_x\right)\varphi_N, \end{equation}

where the subscript $N$ denotes a neighbouring cell. The factor $f_x$ is defined as $f_x\equiv \overline {fN} / \overline {PN}$, where $\overline {fN}$ is the distance between the interface $f$ and the cell $N$, and $\overline {PN}$ is the distance between cells $N$ and $P$.

In the Laplacian term, $\boldsymbol {s}_{f} \boldsymbol {\cdot } (\boldsymbol {\nabla } \varphi )_f$ is calculated as

(B5)\begin{equation} \boldsymbol{s}_{f} \boldsymbol{\cdot} \left(\boldsymbol{\nabla} \varphi \right)_f = \left|\boldsymbol{S}_f \right|\frac{\varphi_N-\varphi_P}{\overline{PN}}. \end{equation}

Substituting (B3)–(B5) into (B1)–(B2), we obtain the linear equations for each mesh cell in a vector form,

(B6)\begin{gather} \left(A_1 + H_1^{\prime}\right)U_i={-}\frac{\partial P}{\partial x_i}+R_{1i}+\beta g_i C, \end{gather}
(B7)\begin{gather} \left(A_2 + H_2^{\prime}\right) C = R_2, \end{gather}

where $U_i$, $P$ and $C$ are the vectors of $u_i$, $p$ and $c$ for all mesh cells, $A_1$ and $A_2$ are the diagonal matrices, $H_1^\prime$ and $H_2^\prime$ are the off-diagonal matrices, and $R_{1i}$ and $R_{2}$ are the explicit source terms. Equations (B6) and (B7) are solved using a preconditioned bi-conjugate gradient solver for asymmetric matrices (PBICG); see Moukalled, Mangani & Darwish (Reference Moukalled, Mangani and Darwish2016).

Taking the divergence of (B6) and considering the continuity (2.1), we have

(B8)\begin{equation} \frac{\partial}{\partial x_i}\left(A_1^{{-}1}\,\frac{\partial P}{\partial x_i}\right) = \frac{\partial}{\partial x_i} \left(A_1^{{-}1}R_{1i}+A_1^{{-}1}\beta g_i C-A_1^{{-}1}H_1^{\prime}U_i\right). \end{equation}

The pressure is corrected by solving (B8) using the generalized geometric–algebraic multi-grid solver (GAMG); see Moukalled et al. (Reference Moukalled, Mangani and Darwish2016). The velocity field is corrected with

(B9)\begin{equation} U_i^\ast{=}{-}A_1^{{-}1} \left(\frac{\partial P}{\partial x_i}+R_{1i}+\beta g_i C - H_1^\prime U_i\right). \end{equation}

References

Alipour, M., de Paoli, M. & Soldati, A. 2020 Concentration-based velocity reconstruction in convective Hele-Shaw flows. Exp. Fluids 61 (9), 195.CrossRefGoogle Scholar
Amooie, M.A., Soltanian, M.R. & Moortgat, J. 2018 Solutal convection in porous media: comparison between boundary conditions of constant concentration and constant flux. Phys. Rev. E 98 (3), 033118.CrossRefGoogle Scholar
Backhaus, S., Turitsyn, K. & Ecke, R.E. 2011 Convective instability and mass transport of diffusion layers in a Hele-Shaw geometry. Phys. Rev. Lett. 106 (10), 104501.CrossRefGoogle Scholar
Böttcher, N., Watanabe, N., Görke, U.-J. & Kolditz, O. 2016 Geoenergy Modeling I. Springer.CrossRefGoogle Scholar
Carman, P.C. 1956 Flow of Gases Through Porous Media. Butterworths.Google Scholar
Chen, C. & Zhang, D. 2010 Pore-scale simulation of density-driven convection in fractured porous media during geological CO$_2$ sequestration. Water Res. Res. 46 (11), W11527.CrossRefGoogle Scholar
Elder, J.W. 1968 The unstable thermal interface. J. Fluid Mech. 32, 6996.CrossRefGoogle Scholar
Elenius, M.T. & Johannsen, K. 2012 On the time scales of nonlinear instability in miscible displacement porous media flow. Comput. Geosci. 16 (4), 901911.CrossRefGoogle Scholar
Ennis-King, J., Preston, I. & Paterson, L. 2005 Onset of convection in anisotropic porous media subject to a rapid change in boundary conditions. Phys. Fluids 17, 084107.CrossRefGoogle Scholar
Gasow, S., Kuznetsov, A.V., Avila, M. & Jin, Y. 2021 A macroscopic two-length-scale model for natural convection in porous media driven by a species-concentration gradient. J. Fluid Mech. 926, A8.CrossRefGoogle Scholar
Gasow, S., Kuznetsov, A.V. & Jin, Y. 2022 Prediction of pore-scale-property dependent natural convection in porous media at high Rayleigh numbers. Intl J. Therm. Sci. 179, 107635.CrossRefGoogle Scholar
Gasow, S., Lin, Z., Zhang, H.C., Kuznetsov, A.V., Avila, M. & Jin, Y. 2020 Effects of pore scale on the macroscopic properties of natural convection in porous media. J. Fluid Mech. 891, A25.CrossRefGoogle Scholar
Gbadamosi, A.O., Junin, R., Manan, M.A., Agi, A. & Yusuff, A.S. 2019 An overview of chemical enhanced oil recovery: recent advances and prospects. Intl Nano Lett. 9 (3), 171202.CrossRefGoogle Scholar
Ghanbarian, B., Hunt, A., Ewing, R.P. & Sahimi, M. 2013 Tortuosity in porous media: a critical review. Soil Sci. Soc. Am. J. 77, 14611477.CrossRefGoogle Scholar
Ghoreishi-Madiseh, S.A., Hassani, F.P., Mohammadian, A. & Radziszewski, P.H. 2013 A transient natural convection heat transfer model for geothermal borehole heat exchangers. J. Renew. Sustain. Energy 5 (4), 043104.CrossRefGoogle Scholar
Guo, R., Sun, H., Zhao, Q., Li, Z., Liu, Y. & Chen, C. 2021 A novel experimental study on density-driven instability and convective dissolution in porous media. Geophys. Res. Lett. 48 (23), e2021GL095619.CrossRefGoogle Scholar
Hassanzadeh, H., Pooladi-Darvish, M. & Keith, D.W. 2007 Scaling behaviour of convective mixing, with application to geological storage of CO$_2$. AIChE J. 53 (5), 11211131.CrossRefGoogle Scholar
Hewitt, D.R., Neufeld, J.A. & Lister, J.R. 2012 Ultimate regime of high Rayleigh number convection in a porous medium. Phys. Rev. Lett. 108 (22), 224503.CrossRefGoogle Scholar
Hewitt, D.R., Neufeld, J.A. & Lister, J.R. 2013 Convective shutdown in a porous medium at high Rayleigh number. J. Fluid Mech. 719, 551586.CrossRefGoogle Scholar
Hewitt, D.R., Neufeld, J.A. & Lister, J.R. 2014 High Rayleigh number convection in a three-dimensional porous medium. J. Fluid Mech. 748, 879895.CrossRefGoogle Scholar
Hidalgo, J.J., Fe, J., Cueto-Felgueroso, L. & Juanes, R. 2012 Scaling of convective mixing in porous media. Phys. Rev. Lett. 109 (26), 264503.CrossRefGoogle ScholarPubMed
Kozeny, J. 1927 Ueber kapillare leitung des wassers im boden. Sitzb. Akad. Wiss. Wien. Math. naturw. Klasse. 136 (2a), 271306.Google Scholar
Letelier, J.A., Herrera, P., Mujica, N. & Ortega, J.H. 2016 Enhancement of synthetic schlieren image resolution using total variation optical flow: application to thermal experiments in a Hele-Shaw cell. Exp. Fluids 57 (2), 18.CrossRefGoogle Scholar
Letelier, J.A., Mujica, N. & Oortega, J.H. 2019 Perturbative corrections for the scaling of heat transport in a Hele-Shaw geometry and its application to geological vertical fractures. J. Fluid Mech. 864, 746767.CrossRefGoogle Scholar
Letelier, J.A., Ulloa, H.N., Leyrer, J. & Ortega, J.H. 2023 Scaling CO$_2$–brine mixing in permeable media via analogue models. J. Fluid Mech. 962, A8.CrossRefGoogle Scholar
Liang, Y., Wen, B., Hesse, M.A. & DiCarlo, D. 2018 Effect of dispersion on solutal convection in porous media. Geophys. Res. Lett. 45, 96909698.CrossRefGoogle Scholar
MacMinn, C.W. & Juanes, R. 2013 Buoyant currents arrested by convective dissolution. Geophys. Res. Lett. 40 (10), 20172022.CrossRefGoogle Scholar
Moukalled, F., Mangani, L. & Darwish, M. 2016 The Finite Volume Method in Computational Fluid Dynamics. Springer.CrossRefGoogle Scholar
Neufeld, J.A., Hesse, M.A., Riay, A., Hallworth, M.A., Tchelepi, H.A. & Huppert, H.E. 2010 Convective dissolution of carbon dioxide in saline aquifers. Geophys. Res. Lett. 37 (22), L22404.CrossRefGoogle Scholar
Otero, J., Dontcheva, L.A., Johnston, H., Worthing, R.A., Kurganov, A., Petrova, G. & Doering, C.R. 2004 High-Rayleigh-number convection in a fluid-saturated porous layer. J. Fluid Mech. 500, 263281.CrossRefGoogle Scholar
de Paoli, M. 2021 Influence of reservoir properties on the dynamics of a migrating current of carbon dioxide. Phys. Fluids 33 (1), 016602.CrossRefGoogle Scholar
de Paoli, M. 2023 Convective mixing in porous media: a review of Darcy, pore-scale and Hele-Shaw studies. Eur. Phys. J. E 46, 129.CrossRefGoogle ScholarPubMed
de Paoli, M., Alipour, M. & Soldati, A. 2020 How non-Darcy effects influence scaling laws in Hele-Shaw convection experiments. J. Fluid Mech. 892, A41.CrossRefGoogle Scholar
de Paoli, M., Howland, C.J., Verzicco, R. & Lohse, L. 2023 Convective dissolution in confined porous media. J. Fluid Mech. (submitted). arXiv:2310.04068v1.Google Scholar
de Paoli, M., Perissutti, D., Marchioli, C. & Soldati, A. 2022 Experimental assessment of mixing layer scaling laws in Rayleigh–Taylor instability. Phys. Rev. Fluids 7 (9), 093503.CrossRefGoogle Scholar
de Paoli, M., Zonta, F. & Soldati, A. 2016 Influence of anisotropic permeability on convection in porous media: implications for geological CO$_2$ sequestration. Phys. Fluids 28, 056601.CrossRefGoogle Scholar
Patil, S.B. & Chore, H.S. 2014 Contaminant transport through porous media: an overview of experimental and numerical studies. Adv. Environ. Res. 3 (1), 4569.CrossRefGoogle Scholar
Pau, G.S.H., Bell, J.B., Pruess, K., Almgren, A.S., Lijewski, M.J. & Zhang, K. 2010 High-resolution simulation and characterization of density-driven flow in CO$_2$ storage in saline aquifers. Adv. Water Resour. 33 (4), 443455.CrossRefGoogle Scholar
Pirozzoli, S., de Paoli, M., Zonta, F. & Soldati, A. 2021 Towards the ultimate regime in Rayleigh–Darcy convection. J. Fluid Mech. 911, R4.CrossRefGoogle Scholar
Rapaka, S., Chen, S., Pawar, R.J., Stauffer, P.H. & Zhang, D. 2008 Non-modal growth of perturbations in density-driven convection in porous media. J. Fluid Mech. 609, 285–30.CrossRefGoogle Scholar
Riaz, A., Hesse, M., Tchelepi, H.A. & Orr, F.M. 2006 Onset of convection in a gravitationally unstable diffusive boundary layer in porous media. J. Fluid Mech. 548, 87111.CrossRefGoogle Scholar
Slim, A.C. 2014 Solutal-convection regimes in a two-dimensional porous medium. J. Fluid Mech. 741, 461491.CrossRefGoogle Scholar
Slim, A.C., Bandi, M.M., Miller, J.C. & Mahadevan, L. 2013 Dissolution-driven convection in a Hele-Shaw cell. Phys. Fluids 25, 024101.CrossRefGoogle Scholar
Slim, A.C. & Ramakrishnan, T.S. 2010 Onset and cessation of time-dependent, dissolution-driven convection in porous media. Phys. Fluids 22, 124103.CrossRefGoogle Scholar
Wang, L., Nakanishi, Y., Hyodo, A. & Suekane, T. 2016 Three-dimensional structure of natural convection in a porous medium: effect of dispersion on finger structure. Intl J. Greenh. Gas Control 53, 274283.CrossRefGoogle Scholar
Wen, B., Chang, K.W. & Hesse, M.A. 2018 Convection in porous media with dispersion. Phys. Rev. Fluids 3, 123801.CrossRefGoogle Scholar
Wen, B., Corson, L.T. & Chini, G.P. 2015 Structure and stability of steady porous medium convection at large Rayleigh number. J. Fluid Mech. 772, 197224.CrossRefGoogle Scholar
Xie, Y., Simmons, C.T. & Werner, A.D. 2011 Speed of free convective fingering in porous media. Water Resour. Res. 47 (11), W11501.CrossRefGoogle Scholar
Zech, A., Attinger, S., Bellin, A., Cvetkovic, V., Dietrich, P., Fiori, A., Teutsch, G. & Dagan, G. 2019 A critical analysis of transverse dispersivity field data. Groundwater 57 (4), 632639.CrossRefGoogle ScholarPubMed
Figure 0

Figure 1. Computational domain occupied by a porous matrix made of uniformly distributed square or circular elements (only part of the porous matrix is shown). The upper boundary has a constant solute concentration $c_{0}$ and is impermeable to fluid. The lower boundary is impermeable to both fluid and solute. A periodic boundary condition is used in the horizontal direction.

Figure 1

Table 1. Length, time and velocity scales for the solutal convection in porous media.

Figure 2

Table 2. Main DNS cases calculated in the study. The cases with $^{a}$ have been calculated up to the constant-flux regime. The case with $^{b}$ has been calculated up to the merging re-initiation regime. The other cases have been calculated up to the shut-down regime. Besides the listed cases, some other cases have been calculated for smaller $Ra_K$ up to the flux-growth regime to determine the onset time of convection.

Figure 3

Figure 2. Transient Sherwood number $Sh$ versus dimensionless time $t/t_I$ calculated from mesh A (3600 mesh cells per REV) and mesh B (6400 mesh cells per REV), case G1R1S1H1 (S1).

Figure 4

Figure 3. Regimes of the solutal convection indicated by the time evolution of the Sherwood number $Sh$, case G1R1S1H2 (S6).

Figure 5

Figure 4. Dimensionless dissolution flux versus dimensionless time; $Sc$, $Ra$ and $H/s$ are varied. (a) The diffusive scales $u_I$ and $t_I$ are used to normalize $F$ and $t$. (b) The modified diffusive scales $u_I/\gamma _m$ and $\gamma _m t_I$ are used to normalize $F$ and $t$.

Figure 6

Figure 5. Dimensionless dissolution flux versus dimensionless time. The pore-scale geometry is varied. The modified diffusive scales $u_I/\gamma _m$ and $\gamma _m t_I$ are used to normalize $F$ and $t$.

Figure 7

Figure 6. Solute concentration fields during the linear-growth regime, case G1R1S1H1 (S1), for (a) $t/t_I=10.2$, (b) $t/t_I=12$. The light curves indicate the isosurfaces of $\tilde {c}=0.01$.

Figure 8

Figure 7. Time evolution of the concentration field at the interface between the first and second REV rows ($x_2=-s$) near the onset of convection ($20\le t/t_I \le 28.5$), case G1R1S1H2 (S6).

Figure 9

Figure 8. Solute concentration field during the flux-growth regime, case G1R1S1H1 (S1).

Figure 10

Figure 9. Dimensionless time for the onset of convection $t_{oc}/t_I$. The DNS results are compared with the correlation equations.

Figure 11

Figure 10. Time evolution of the dimensionless concentration flux at the upper boundary $F/u_I$, where $Ra$ and $H/s$ are varied: (a) geometry G1 (square elements with $\phi =0.56$); (b) geometries G2 (square elements with $\phi =0.36$) and G3 (circular elements with $\phi =0.32$).

Figure 12

Figure 11. Time evolution of the concentration field at the interface between the first and second REV rows ($x_2=-s$) near the upper boundary during the merging re-initiation regime ($28.5\le t/t_I \le 71.3$), case G1R1S1H2 (S6). Typical events of re-initiation (${R_1}$${R_4}$) and merging (${M_1}$${M_3}$) are indicated.

Figure 13

Figure 12. The REV-averaged solute concentration $\langle \tilde {c}\rangle$ fields during the merging re-initiation regime: (a) $Ra=20\,000$, $H/s=50$, case G1R1S1H2 (S6); (b) $Ra=20\,000$, $H/s=100$, case G1R1S1H3 (S7); (c) $Ra=20\,000$, $H/s=200$, case G1R1S1H4 (S8); (d) $Ra=80\,000$, $H/s=400$, case G1R1S1H5 (S9); (e) $Ra=1600$, $H/s=200$, case G2R4S1H3 (S14). Part of the computational domain near the upper boundary is shown.

Figure 14

Figure 13. Power spectra of the solute concentration $\tilde {c}$ at the interface between the first and second REV rows ($x_2=-s$) for cases with different pore-scale geometries: (a) case G1R1S1H2 (S6), (b) case G3R1S1H2 (S19).

Figure 15

Figure 14. Time evolution of the dimensionless concentration flux at the upper boundary $F/u_{II}$ during the merging re-initiation regime, where $Ra$ and $H/s$ are varied: (a) geometry G1 (square elements with $\phi =0.56$); (b) geometry G2 (square elements with $\phi =0.36$); (c) geometry G3 (circular elements with $\phi =0.32$). The macroscopic simulation results are extracted and reproduced from the corresponding figure in Slim (2014).

Figure 16

Figure 15. Dimensionless location of the plume tips $x_2^{\ast }/l_{II}$ versus dimensionless time $t/t_{II}$.

Figure 17

Figure 16. Time evolution of the concentration field at the interface between the first and second REV rows near the upper boundary ($x_2=-s$) during the constant-flux regime ($105.5\le t/t_I \le 148.3$), case G1R1S1H2 (S6).

Figure 18

Figure 17. The REV-averaged solute concentration $\langle \tilde {c}\rangle$ fields during the constant-flux regime: (a) $Ra=20\,000$, $H/s=50$, case G1R1S1H2 (S6); (b) $Ra=20\,000$, $H/s=100$, case G1R1S1H3 (S7); (c) $Ra=20\,000$, $H/s=200$, case G1R1S1H4 (S8); (d) $Ra=80\,000$, $H/s=400$, case G1R1S1H5 (S9). Part of the computational domain near the upper boundary is shown.

Figure 19

Figure 18. Dimensionless horizontal and vertical velocity components (a) $u_1/u_I$ and (b) $u_2/u_I$ at the interface between the first and second REV rows near the upper boundary ($x_2=-s$), case G1R1S1H4 (S8). The results in the merging re-initiation and constant-flux regimes are compared.

Figure 20

Figure 19. Dimensionless constant flux at the upper boundary $F_{cf}/u_{II}$ versus pore-scale Rayleigh number $Ra_K$.

Figure 21

Figure 20. The REV-averaged solute concentration $\langle \tilde {c}\rangle$ fields (a) near the end of the constant-flux regime ($t/T_I=221$), and (b) in the shut-down regime ($t/T_I=257$), for $Ra=20\,000$, $H/s=50$, case G1R1S1H2 (S6).

Figure 22

Figure 21. The REV- and $x_1$-line-averaged solute concentration $\langle \tilde {c}\rangle _{x1}$ during the constant-flux and shut-down regimes for cases (a) G1R1S1H2 (S6), (b) G2R1S1H2 (S13) and (c) G3R1S1H2 (S19).

Figure 23

Figure 22. Time evolution of the dimensionless dissolution flux at the upper boundary $F/u_{III}$ during the shut-down regime, where $Ra$ and $H/s$ are varied: (a) geometry G1 (square elements with $\phi =0.56$); (b) geometry G2 (square elements with $\phi =0.36$); (c) geometry G3 (circular elements with $\phi =0.32$).

Figure 24

Table 3. The scaling coefficients in (5.1) for different pore-scale geometries.

Figure 25

Table 4. The fluid and porous medium properties for CO$_2$ dissolution in an idealized sequestration site, taken from Neufeld et al. (2010). Equivalent to (2.8) and (2.12), the Rayleigh numbers are calculated as $Ra={H\,\Delta \rho \,g K}/{D_e\mu }$ and $Ra_K={\Delta \rho \,g K^{3/2}}/{D_e\mu }$. The effective diffusivity is approximated as $D_e=\phi D$.

Figure 26

Table 5. Length, time and velocity scales for the test case.

Figure 27

Figure 23. Time evolution of the dissolution flux $F$ and the progress of sequestration $G$. The dissolution flux $F$ is in ${\rm m}\,{\rm y}^{-1}$, which is $m^3$ of dissolved CO$_2$ per unit of surface area ($m^2$) and time (year).

Figure 28

Figure 24. The test cases for determining (a) the permeability $K$ and (b) the diffusivity ratio $\gamma _m$.

Figure 29

Figure 25. Relations of the geometric parameters (a) $K/d_0^2$ versus $\phi$ and (b) $\gamma _m$ versus $\phi$. The values of the parameters are according to Gasow et al. (2022).