Hostname: page-component-745bb68f8f-l4dxg Total loading time: 0 Render date: 2025-01-26T22:44:20.837Z Has data issue: false hasContentIssue false

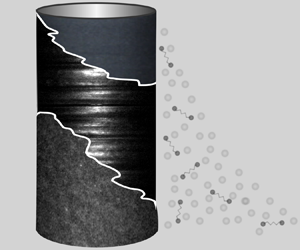
Elasto-inertial dissipation in particle-laden viscoelastic Taylor–Couette flow

Published online by Cambridge University Press:  10 October 2024

Charles Carré
Affiliation:
IMT Nord Europe, Institut Mines Télécom, Univ. Lille, Center for Energy and Environment, F-59000 Lille, France
Masoud Moazzen
Affiliation:
IMT Nord Europe, Institut Mines Télécom, Univ. Lille, Center for Energy and Environment, F-59000 Lille, France
Tom Lacassagne
Affiliation:
IMT Nord Europe, Institut Mines Télécom, Univ. Lille, Center for Energy and Environment, F-59000 Lille, France
S. Amir Bahrani*
Affiliation:
IMT Nord Europe, Institut Mines Télécom, Univ. Lille, Center for Energy and Environment, F-59000 Lille, France School of Physics, Institute for Research in Fundamental Sciences (IPM), Tehran 19395-5531, Iran
*
Email address for correspondence: amir.bahrani@imt-nord-europe.fr

Abstract

Many natural and industrial processes involve the flow of fluids made of solid particles suspended in non-Newtonian liquid matrices, which are challenging to control due to the fluid's nonlinear rheology. In the present work, a Taylor–Couette canonical system is used to investigate the flow of dilute to semi-dilute suspensions of neutrally buoyant spherical particles in highly elastic base polymer solutions. Friction measurement synchronized with direct flow visualization are combined to characterize the critical conditions for the onset of elasto-inertial instabilities, expected here as a direct transition to elasto-inertial turbulence (EIT). Adding a low particle volume fraction (${\leq }2\,\%$, dilute regime) does not affect the nature of the primary transition and reduces the critical Weissenberg number for the onset of EIT, despite a significant decrease in the apparent fluid elasticity. However, for particle volume fractions ${\geq }6\,\%$ (semi-dilute regime), EIT is no longer observed in the explored Reynolds range, suggesting an apparent relaminarization with yet not further decrease in fluid elasticity. Instead, a new regime, termed here elasto-inertial dissipative (EID), was uncovered. It originates from particle–particle interactions altering particle–polymer interactions and occurring under elasto-inertial conditions comparable to those of EIT. Increasing particle volume fraction in the semi-dilute regime and, in so, the particle contribution to the overall viscosity, delays the onset of EID similarly to what was observed previously for EIT in lower elasticity fluids. After this onset, a decrease in the pseudo-Nusselt number observed with increasing inertia and particle-to-polymer concentration ratio confirms a particle-induced alteration of energy transfer in the flow.

Type
JFM Papers
Copyright
© The Author(s), 2024. Published by Cambridge University Press

1. Introduction

Suspensions of solid particles in a Newtonian or non-Newtonian liquid matrix are frequently encountered in nature and industrial applications (cement, toothpaste, three-dimensional printing material, avalanches, blood flow, to name a few). When flowing at various scales, such fluids demonstrate a wide variety of nonlinear dynamic behaviours, arising from inertia, complex rheology of the suspending liquid phase, fluid–particle interactions or particle–particle interactions. They induce a dynamic complexity of the flow, making it difficult to control its stability, mixing and heat transfer efficiency as well as to predict overall process performance. Despite recent studies (Tanner Reference Tanner2020; Baroudi et al. Reference Baroudi, Majji, Peluso and Morris2023; Boulafentis et al. Reference Boulafentis, Lacassagne, Cagney and Balabani2023; Zhang & Shaqfeh Reference Zhang and Shaqfeh2023; Boulafentis et al. Reference Boulafentis, Lacassagne, Cagney and Balabani2024), experimental data are still needed to better understand the hydrodynamic behaviour of complex suspensions and confront numerical models (Kang & Mirbod Reference Kang and Mirbod2021; Song et al. Reference Song, Wan, Liu, Lu and Khomami2021; Lin et al. Reference Lin, Song, Zhao, Liu, Lu and Khomami2023; Kang, Schatz & Mirbod Reference Kang, Schatz and Mirbod2024; Lin et al. Reference Lin, Song, Liu, Wan, Lu and Khomami2024).

To gather experimental data and deepen understanding on complex fluid flows, it is convenient to consider well-studied canonical flows. In the present work, the canonical Taylor–Couette flow (TCF) is used (Andereck, Liu & Swinney Reference Andereck, Liu and Swinney1986; Taylor Reference Taylor1922; Fardin, Perge & Taberlet Reference Fardin, Perge and Taberlet2014). It consists in two concentric cylinders of radii $r_i$ and $r_e$ (with $r_e>r_i$, see figure 1) and height $h$. Here the case considered is that where only the inner cylinder is rotated at rotation speed $\varOmega$ and the outer cylinder is fixed. The fluid entrapped in the gap $\delta =r_e-r_i$ is subjected to a shear rate $\dot {\gamma }={\varOmega r_i}/{\delta }$. This configuration has been widely used in the recent literature to characterize instabilities and transition to chaos in a wide range of complex fluids (Fardin et al. Reference Fardin, Perge and Taberlet2014; Boulafentis et al. Reference Boulafentis, Lacassagne, Cagney and Balabani2023). In that context, it was for example found that the presence of non-colloidal neutrally buoyant particles in a viscous Newtonian base fluid alters the nature and onset of the primary bifurcation (Majji, Banerjee & Morris Reference Majji, Banerjee and Morris2018; Ramesh, Bharadwaj & Alam Reference Ramesh, Bharadwaj and Alam2019), as well as the friction dynamics, as evidenced by the evolution of the torque exerted on the inner cylinder $\tau$ as a function of the Reynolds number $\mathcal {R}$ (Dash, Anantharaman & Poelma Reference Dash, Anantharaman and Poelma2020; Kang & Mirbod Reference Kang and Mirbod2021; Moazzen et al. Reference Moazzen, Lacassagne, Thomy and Bahrani2022):

(1.1)\begin{equation} \mathcal{R} =\frac{\rho r_i \varOmega \delta}{\mu} = \frac{\rho \dot{\gamma} \delta^2}{\mu}, \end{equation}

where $\mathcal {R}$ is the non-dimensional flow control parameter characterizing the onset of inertial instabilities (see (1.1)) (with $\rho$ is the fluid density and $\mu$ is the suspension dynamic viscosity). However, particle-free viscoelastic fluids exhibit their own rich set of specific dynamics: low $\mathcal {R}$ transitions to modes that are not evidenced in Newtonian fluids (Boulafentis et al. Reference Boulafentis, Lacassagne, Cagney and Balabani2023), transitions to well-known modes but triggered by elastic or elasto-inertial mechanisms (Larson, Shaqfeh & Muller Reference Larson, Shaqfeh and Muller1990) or ultimately transitions to a form of chaos resembling turbulence at much lower (Dutcher & Muller Reference Dutcher and Muller2013; Boulafentis et al. Reference Boulafentis, Lacassagne, Cagney and Balabani2023) or even negligible inertia (elastic turbulence, Groisman & Steinberg Reference Groisman and Steinberg1998Reference Groisman and Steinberg2000Reference Groisman and Steinberg2004). The flow control parameter for such behaviours is the Weissenberg number $\mathcal {W}=\lambda \dot {\gamma }$, with $\lambda$ the relaxation time of the viscoelastic solution. Here, $\mathcal {W}$ compares elastic to viscous forces. Additionally, it is worth defining the elastic number $\mathcal {E}$, which quantifies the importance of the elastic behaviour in the given Taylor–Couette geometry:

(1.2) \begin{equation} \mathcal{E}=\frac{\mathcal{W}}{\mathcal{R}}=\frac{\lambda \mu}{\rho \delta^{2}} \end{equation}

In this work, emphasis is placed on fluids of moderate to high elasticity ($\mathcal {E}\gg 10^{-2}$, Dutcher & Muller Reference Dutcher and Muller2013) flowing at commensurate inertia for which viscoelastic properties give rise to elasto-inertial transitions: instabilities that are either due to elastic mechanisms but arising at non-negligible $\mathcal {R}$ values or inertial but modified by elasticity. There, transition to a chaotic flow state labelled elasto-inertial turbulence (EIT) is observed (Groisman & Steinberg Reference Groisman and Steinberg1996; Boulafentis et al. Reference Boulafentis, Lacassagne, Cagney and Balabani2023; Lin et al. Reference Lin, Song, Zhao, Liu, Lu and Khomami2023). The onset and the pathway towards EIT, as well as its final structure, have been found to depend on various parameters, among which the nature, conformation and concentration of the additives (most of the time polymers) confer viscoelastic properties to the fluid. In particular, the dynamic properties of EIT differ from those of inertial turbulence both in terms of friction scaling and spectral distribution (Boulafentis et al. Reference Boulafentis, Lacassagne, Cagney and Balabani2023Reference Boulafentis, Lacassagne, Cagney and Balabani2024; Moazzen et al. Reference Moazzen, Lacassagne, Thomy and Bahrani2023).

Figure 1. (a) Taylor–Couette cell mounted on an MCR102 Anton Paar rheometer with geometrical parameters symbols and illustration of the imaging system (see details in Moazzen et al. Reference Moazzen, Lacassagne, Thomy and Bahrani2022Reference Moazzen, Lacassagne, Thomy and Bahrani2023) and quasi-steady inner cylinder ramp-up protocol. (b) Geometrical cell parameters values.

The aim of the present paper is to investigate the behaviour of fluids combining both complex features, particles and elasticity, and to characterize elasto-inertial transitions in such systems. A first experimental study on this topic in a Taylor–Couette configuration (Lacassagne et al. Reference Lacassagne, Boulafentis, Cagney and Balabani2021) indicated that a low particle volume fraction may promote faster transition to EIT in terms of $\mathcal {R}$, whereas higher particle volume fractions (more than 5 %) were found to delay transition to EIT. This former study employed visualization to detect transitions and characterize EIT properties for a single moderately elastic base fluid ($\mathcal {E}=O(10^{-1})$, one polymer concentration) and four particle volume fractions. The present work sets at pushing the investigation further and unravel physical mechanisms by: (1) coupling flow visualization with torque measurements to get information on the friction dynamics during transitions and flow states; (2) extending the approach to more elastic base fluids ($\mathcal {E}=O(10^1)$) for which direct transition from the base laminar state to fully chaotic EIT is evidenced (Groisman & Steinberg Reference Groisman and Steinberg1996; Moazzen et al. Reference Moazzen, Lacassagne, Thomy and Bahrani2023); and (3) covering a wider range of particle concentrations ($\varPhi = 0, 2, 6, 10, 14\,\%$).

2. Materials and methods

2.1. Experimental set-up

The experimental set-up is similar to that used by Moazzen et al. (Reference Moazzen, Lacassagne, Thomy and Bahrani2022Reference Moazzen, Lacassagne, Thomy and Bahrani2023), and its geometrical parameters are represented in figure 1.

With the outer cylinder was kept at rest, the inner cylinder was rotated with angular velocity $\varOmega$, controlled by the rheometer's motor. The maximum inner cylinder rotation frequency achievable bounded the maximum respective $\mathcal {R}$ and $\mathcal {W}$ experimentally accessible to values $\mathcal {R}_{max}$ and $\mathcal {W}_{max}$ reported in table 1, depending on each working fluid viscosity and elasticity. Experiments were performed using slow acceleration (or ramp-up) protocol (see figure 1). The difference maximum shear rate was kept constant at $\dot {\gamma }_{total} = 750\ {\rm s}^{-1}$ and $\dot {\gamma }$ was increased in steps of $2\ {\rm s}^{-1}$. At each step, the shear rate was held constant for a period of $t = 30\ {\rm s}$. This resulted in non-dimensional acceleration rates of order ($10^{-4}$) at most, well into the quasi-steady assumption (Dutcher & Muller Reference Dutcher and Muller2013; Boulafentis et al. Reference Boulafentis, Lacassagne, Cagney and Balabani2023).

Table 1. Rheological viscoelastic suspensions properties and associated dimensionless numbers. $\mathcal {W}_c=\lambda _{N_1}\times \dot {\gamma }_c$, $\mathcal {R}_c=\rho \delta ^2\dot {\gamma }_c/\mu$ and $\dot {\gamma }_c$ are the respective critical Wiessenberg number, Reynolds number and shear-rate for the onset of EIT for $\varPhi =0$ or $2\,\%$, or new elasto-inertial dissipative (EID) mechanisms (in italics, for $\varPhi \geq 6\,\%$). Superscript 0 indicates quantities computed using the base fluid relaxation time $\lambda ^0=\lambda _{N_1}(\varPhi =0\,\%)$. Apparent relaxation time scales $\lambda =\lambda _{N_1}(\varPhi,\tilde {C})$ are used otherwise. The maximum particle Reynolds number is $\mathcal {R}_p^{max} = {\rho \dot {\gamma }_{max}\,{\rm d}p^2}/{4\mu }$.

Experiments were conducted with viscoelastic base fluids made of HPAM (partially hydrolized polyacrylamide; molecular weight $M_w = 15 - 20\times 10^6\ {\rm g}\ {\rm mol}^{-1}$) at concentrations of $\tilde {C} = 300, 400, 500 \ {\rm ppm}$, dissolved in a solution of distilled water ($31\,\%$ in volume), glycerol ($69\,\%$ in volume) and sodium chloride ($2\,\%$ in mass), and loaded with mono-disperse spherical PMMA (polymethyl methacrylate) particles of diameter of $d_p=50\ \mathrm {\mu }{\rm m}$ at volume fractions $\varPhi = 0, 2, 6, 10, 14\,\%$. The particle Reynolds number $\mathcal {R}_p = {\rho \dot {\gamma }\,{\rm d}p^2}/{4\mu }$ was such that $\mathcal {R}_p < 0.02$ for all fluids and experiments. The density of solid particles and viscoelastic base fluid were matched ($\rho =1192\ {\rm kg}\ {\rm m}^{-3}$), resulting in neutrally buoyant particle suspensions.

2.2. Rheological characterization

The shear-viscosity of the working fluids was measured as a function of the shear rate $\dot {\gamma }$, using an MCR302 Anton Paar rheometer with a 50 mm diameter parallel-plate geometry (chosen over the conventional cone-plate one to limit inertial and centrifugal effects on particle loaded samples) at a 0.5 mm gap. Measurements confirmed that the working fluids could be considered as Boger fluids (Boger Reference Boger1977; James Reference James2009), their viscosity being shear-rate independent in the considered range (almost two order of magnitudes of $\dot {\gamma }$). This implies that the Reynolds number increased linearly as a function of the applied shear-rate in the Taylor–Couette set-up. Averaged viscosity values are reported in figure 2(a) and in table 1. As expected, the apparent viscosity of the fluid increased with increasing polymer concentration, but most importantly with particle volume fraction (Zhang & Shaqfeh Reference Zhang and Shaqfeh2023).

Figure 2. (a) Constant shear viscosity (averaged on a 10–100 s$^{-1}$ shear-rate range) for all polymer and particle concentrations. An MCR302 rheometer with parallel-plate 50 mm geometry with a 0.5 mm gap was used. (b) Elastic time scale $\lambda$ for all fluid samples, normalized by the particle-free measured value, obtained from first normal stress differences (empty markers, same rheometer) or extensional measurements (full markers – bespoke extensional rheometer set-up).

The elasticity of the working fluids was measured using first normal stress differences $N_1$ (Lin, Phan-Thien & Cheong Khoo Reference Lin, Phan-Thien and Cheong Khoo2014; Schäfer, Morozov & Wagner Reference Schäfer, Morozov and Wagner2018; Moazzen et al. Reference Moazzen, Lacassagne, Thomy and Bahrani2023), with the same parallel-plate geometry. For a Boger fluid, it is known that

(2.1)\begin{equation} N_1=2\mu_p\lambda_{N_1}\dot{\gamma}^2 \end{equation}

with $\mu _p$ the polymer viscosity contribution ($\mu _p = \mu - \mu _{sol}$, with $\mu _{sol} = 33.3$ mPa.s the solvent viscosity), and $\lambda _{N_1}$ the relaxation time. Here, $\lambda _{N_1}$ was estimated for all fluids inverting the previous equation and averaging on the range of $\dot {\gamma }$ over which the power 2 scaling is valid. The nominal elastic number of each base working fluid $\mathcal {E}^0$ was computed using the apparent overall suspension viscosity $\mu$ (reported in table 1) and the elastic time scale of the corresponding particle-free fluid (each fluid at the same polymer concentration displays the same $\mathcal {E}^0$, reported in table 1, regardless of particle addition). Apparent elastic number values $\mathcal {E}$ were computed for each fluid using directly measured $\lambda _{N_1}$ and $\mu$. Additionally, measurements of apparent extensional time scales $\lambda _e$ were performed using a slow retraction capillary thinning protocol (Campo-Deaño & Clasen Reference Campo-Deaño and Clasen2010) on a bespoke set-up (analogue to Boulafentis et al. Reference Boulafentis, Lacassagne, Cagney and Balabani2024). Thread thinning dynamics of a fluid filament created between two plates slowly separating was fitted in the exponential-thinning regime such that

(2.2)\begin{equation} \lambda_e = \frac{-t}{3 \ln{\left(\dfrac{d}{d_{max}}\right)}} \end{equation}

with $d(t)$ the filament diameter evolving with time $(t)$ and $d_{max}$ the maximum (initial) diameter. All rheological data (shear and extension) were consolidated by averaging over at least three and up to six repeated tests. The evolution of apparent time scale normalized by that of particle-free samples for both normal stress and extensional methods is plotted as a function of $\varPhi$ in figure 2.

2.3. Measurement techniques

2.3.1. Flow visualization

The flow behaviour was probed using a coupling of direct visualization an torque measurement on the inner cylinder (using the built-in torque sensor of the rheometer). Flow visualization was achieved by seeding the flow with anisotropic reflective mica flakes, which enable the monitoring of the flow spatial structure (Boulafentis et al. Reference Boulafentis, Lacassagne, Cagney and Balabani2023). The light reflected by the mica flakes was recorded using a camera at a frame rate of 70 images per second (see figure 1). From the reflected light signal along a vertical column of the test section, two types of visualization tools were constructed. First, space–time diagrams were built by stacking the intensity signal obtained for this vertical at various inner cylinder rotation speeds and thus $\mathcal {R}$ values. The change in flow structure, due for example to a transition to EIT, (see figure 3 and also represented in the supplementary movie) is clearly visible on such graph: the laminar base flow, called circular Couette flow (CCF), is expressed by a uniform grey colour while EIT regime's signature is a highly chaotic spatial signal. Second, the temporal fast Fourier transform (FFT) of intensity signals was computed according to a protocol detailed by Lacassagne et al. (Reference Lacassagne, Boulafentis, Cagney and Balabani2021) and Moazzen et al. (Reference Moazzen, Lacassagne, Thomy and Bahrani2023), and resulting spectra were stacked vertically as a function of control parameters (frequency map). This allows to distinguish between stationary flow states with no specific spectral signatures (such as CCF) and a flow state with characteristic frequencies or energy spectra, such as EIT, and thus detect the onset of the latter in an even more accurate way (see figure 3). In such figures, the straight darker lines correspond to the inner cylinder rotation frequency, which is captured by the method. Frequency axes are scaled by the maximal inner cylinder frequency $f_{max} = {2 {\rm \pi}}/{\varOmega _{max}}$.

Figure 3. Coupling of flow visualization with (a,d) space–time diagrams, (b,e) frequency maps where $f_{max} = {2 {\rm \pi}}/{\varOmega _{max}}$ correspond to maximal inner cylinder frequency and (c,f) torque measurements, applied to samples with $\tilde {C}=300$ ppm, (ac) $\varPhi =2\,\%$ and (df) $\varPhi =6\,\%$. Vertical dashed red lines indicate the critical $\mathcal {R}_{c}$ value for the onset of EIT when this flow state is evidenced in panels (ac), or a new regime discussed hereinafter in panels (df), also indicated by a red circle. Linear ridges visible in frequency maps in panels (b,e) correspond to the rotation frequency of the inner cylinder detected by the method.

2.3.2. Torque measurement

Simultaneously, the rheometer allowed to measure the torque needed to rotate the inner cylinder (Dash et al. Reference Dash, Anantharaman and Poelma2020; Moazzen et al. Reference Moazzen, Lacassagne, Thomy and Bahrani2022Reference Moazzen, Lacassagne, Thomy and Bahrani2023), providing insight into the friction dynamics and making it possible to evidence transitions to other friction regime, independently of any visual signature. This is further illustrated in figure 4. In the CCF (laminar) regime, the torque is expected to increase linearly with $\mathcal {R}$ with a slope proportional to the fluid viscosity (Couette Reference Couette1890; Dubrulle et al. Reference Dubrulle, Dauchot, Daviaud, Longaretti, Richard and Zahn2005; Eckhardt, Grossmann & Lohse Reference Eckhardt, Grossmann and Lohse2007). Any departure of the torque measurements (figure 4 full lines) from this linear trend (figure 4 dotted lines), which becomes even more visible when plotting the difference between the laminar prediction and the torque measurement (figure 4 dashed lines), indicates a change in the friction regime.

Figure 4. Detection of critical conditions (here $\dot {\gamma }_c$) for the transition to non-laminar friction regimes, for $\tilde {C}=300$ ppm and $\varPhi = 0, 6 \text { and } 14\,\%$. Full line curves are measured torque signals, dotted lines are laminar trends and dashed lines are the norm of the difference between measured torque and laminar trend. All values are scaled by the maximum torque measured at the end of the run $\tau _{max}$. Black circles and vertical dashed lines represent detected critical $\dot {\gamma }$ where laminar trend and torque curve diverge. The colour scheme for particle concentrations is the same as in figure 2. (a) $\varPhi = 0\,\%$, (b) $\varPhi = 6\,\%$, (c) $\varPhi = 14\,\%$.

For EIT, this corresponds to a sudden jump in measured torque (Martínez-Arias & Peixinho Reference Martínez-Arias and Peixinho2017; Moazzen et al. Reference Moazzen, Lacassagne, Thomy and Bahrani2023), followed by a gradual convergence towards a similar laminar-like torque–$\mathcal {R}$ slope, yet shifted upwards (Moazzen et al. Reference Moazzen, Lacassagne, Thomy and Bahrani2023, figure 3c, figure 4a). The coupling of all three indicators (space–time diagram, frequency map, torque dynamics) allows to detect the critical $\mathcal {R}$ value for the onset of EIT when it arises, labelled $\mathcal {R}_{c}$, as illustrated in figure 3(ac), with a high degree of accuracy (less than $0.5\,\%$ of variation on $\mathcal {R}_{c}$ obtained with the three methods, on all used fluids).

When no EIT is detected, no jump is reported. Yet, a change in trend is still observed. This takes the form of a decrease in the slope of the measured torque–$\mathcal {R}$ curve at a given critical $\mathcal {R}$ value (circle in figure 3f) or shear rate (circles in figure 4b,c), corresponding to a continuous increase in the measurement-to-laminar prediction difference (figure 4 dashed lines).

It is remarkable that in pure Newtonian or particle loaded Newtonian fluids, primary and higher order bifurcations are always accompanied by secondary flows and lead to an increase in the torque–$\mathcal {R}$ curve slope (Ramesh et al. Reference Ramesh, Bharadwaj and Alam2019; Dash et al. Reference Dash, Anantharaman and Poelma2020; Kang & Mirbod Reference Kang and Mirbod2021; Moazzen et al. Reference Moazzen, Lacassagne, Thomy and Bahrani2022). Here, the milder slope suggests that additional energy dissipation may occur elsewhere in the flow reducing the friction dissipation at the inner cylinder as compared to the laminar trend, as will be discussed later.

3. Results and discussions

Figure 3 illustrates the two types of results encountered. For particle-free fluids, the direct transition from CCF to EIT as depicted by Groisman & Steinberg (Reference Groisman and Steinberg1996), Moazzen et al. (Reference Moazzen, Lacassagne, Thomy and Bahrani2023) and expected in this set-up from our previous study (Moazzen et al. Reference Moazzen, Lacassagne, Thomy and Bahrani2023) is indeed evidenced. A similar transition is also found in low particle volume fraction fluids ($2\,\%$), as illustrated in figure 3(ac) ($\tilde {C} = 300$ ppm, $\varPhi =2\,\%$). However, for all higher particle volume fractions, no such transition is observed in the investigated $\mathcal {R}$ range, as illustrated in figure 3(df) ($\tilde {C} = 300$ ppm, $\varPhi =6\,\%$): the space–time diagram displays no clear sign of chaotic behaviour, the frequency maps no clear change in spectral signature and the torque measurement no clear jump. The two types of behaviour will be discussed separately in what follows.

3.1. Particle-free and dilute cases: EIT

For all fluids where EIT has been evidenced (all polymer concentrations at $\varPhi = 0\,\%$ and $\varPhi = 2\,\%$), $\mathcal {R}_{c}$ values for the onset of EIT are represented in figure 5(a) as a function of the base fluid $\mathcal {E}^0$ value. The $\mathcal {E}^0$ values are much higher than those reported in previous literature for elasto-inertial TCF of particle loaded viscoelastic fluids (Lacassagne et al. Reference Lacassagne, Boulafentis, Cagney and Balabani2021) and also significantly higher than our previous work (Moazzen et al. Reference Moazzen, Lacassagne, Thomy and Bahrani2023) (mostly owing to the difference in working fluids: increased solvent viscosity, high polymer molecular weight, high polymer concentrations – see figure 5b). A reduction in $\mathcal {R}_{c}$ with increasing $\mathcal {E}^0$ could have been expected from previous studies (Groisman & Steinberg Reference Groisman and Steinberg1996; Moazzen et al. Reference Moazzen, Lacassagne, Thomy and Bahrani2023). It here appears that in the particle-free ($\varPhi =0\,\%$) case, increasing $\mathcal {E}^0$ (through an increase in polymer concentration) only leads to a weak reduction of $\mathcal {R}_{c}$ (figure 5, full markers). From figure 5(c), it can clearly be seen that the onset of EIT (square symbols) occurs at critical $\mathcal {W}_c$ values much higher than what would have been expected from the Pakdel–McKinley criterion (plus symbols) for the onset of purely elastic instability in curved streamline flows (Pakdel & McKinley Reference Pakdel and McKinley1996; Schäfer et al. Reference Schäfer, Morozov and Wagner2018). This criterion is expressed as

(3.1)\begin{equation} \mathcal{W}_c^{{PMcK}} = \frac{M_{{crit}}}{\sqrt{2(1-\beta)}}\times \frac{1}{\sqrt{\epsilon}}, \end{equation}

where $M_{{crit}}=1.8$, $\beta = {\mu _s}/{\mu }$ with $\mu _s$ is the solvent viscosity and $\epsilon = {\delta }/{r_i}$ (Pakdel & McKinley Reference Pakdel and McKinley1996). Thus, the chaotic behaviour is confirmed to be elasto-inertial (and not purely elastic) in nature, requiring both non-negligible inertia and elasticity to develop, even at such high $\mathcal {E}^0$ values.

Figure 5. (a) Critical value $\mathcal {R}_{c}$ for the onset of EIT as a function of the base fluid elastic number $\mathcal {E}^0$ compared with (b) previous literature data. The horizontal dashed line in panel (a) represents the critical Reynolds number $\mathcal {R}_c^N$ for the onset of the primary instability in a Newtonian fluid in the same Couette geometry (Moazzen et al. Reference Moazzen, Lacassagne, Thomy and Bahrani2022). Errors bars are derived from uncertainty propagation from viscosity (dominant) and detection (negligible) uncertainties. (c) Critical $\mathcal {W}_c$ for the onset of EIT (squares) compared with the purely elastic instability threshold computed with the Pakdel–McKinely criterion adapted to the Taylor–Couette geometry (plus signs, see (3.1) proposed by Schäfer et al. Reference Schäfer, Morozov and Wagner2018). Empty squares are present work values for $\varPhi = 0\,\%$ and full ones for $\varPhi = 2\,\%$.

When considering dilute ($\varPhi = 0 \text { and } 2\,\%$ here) particle loaded fluids for which EIT is observed in the experimental range, it appears that this monotonic decrease in $\mathcal {R}_{c}$ with $\mathcal {E}$ is no longer observed, confirming that particles do mitigate the transition to EIT (figure 5, empty markers), as expected from Lacassagne et al. (Reference Lacassagne, Boulafentis, Cagney and Balabani2021). The $\mathcal {R}_{c}$ values are essentially identical for the $\varPhi = 0\,\%$ and $\varPhi = 2\,\%$ cases for all three polymer concentrations, with possibly a slight decrease of $\mathcal {R}_{c}$ upon particle addition for the two lower $\mathcal {E}$ values ($\tilde {C} = 300$ and $\tilde {C} = 400$ ppm fluids), but a slightly delayed transition at $\varPhi = 2\,\%$ in the higher $\mathcal {E}$ case. The $2\,\%$ particle addition yet causes a significant decrease of the critical $\mathcal {W}$ values, as illustrated in figure 6(c), (still much higher than the purely elastic instability threshold) which matches the trend observed when revisiting data from Lacassagne et al. (Reference Lacassagne, Boulafentis, Cagney and Balabani2021). It thus implies that in the dilute $\varPhi$ limit, the effect of particle addition is mostly to promote elasto-inertial instabilities by reducing the amount of elasticity ($\mathcal {W}$) needed at a given inertia ($\mathcal {R}$) for EIT to arise.

Figure 6. (a) Torque measured on the inner cylinder as a function of $\mathcal {W}=\dot {\gamma } \lambda _{N_1}$. Vertical dashed lines indicate the $\mathcal {W}_c$ values for trend change. Dashed black linear trends correspond to the laminar flow state. Panels (b i) and (b ii) are $\mathcal {R}_c$ as a function of $\varPhi$, and $\mathcal {W}_c$ as a function of $\mathcal {E}$, respectively, with squares reporting the onset of EIT and crosses the onset of EID, at approximately constant $\mathcal {R}_c$ values for each regime, indicated by dashed lines. (c) Values of $\mathcal {W}_c$ (same symbols) scaled by the zero-particle value $\mathcal {W}_c (\varPhi = 0\,\%)$, as a function of the particle-related viscosity increase ($\mu _{\varPhi } / \mu$). The grey area corresponds to EIT data points and the vertical dashed black line a $\mu _{\varPhi } / \mu =0.1$ limit from dilute to semi-dilute concentration regime.

3.2. Absence of EIT in the semi-diulte regime

A striking result though is that for particle volume fractions higher than $2\,\%$, in what can be referred to as a semi-dilute particle concentration regime (Moazzen et al. Reference Moazzen, Lacassagne, Thomy and Bahrani2022), no transition to EIT is observed in the investigated $\mathcal {R}$ range (see figure 3df). The rheometer limit is reached when $\dot {\gamma } = 1405\ {\rm s}^{-1}$ for each sample, which, since viscosity increase with particles concentration, leads to a decrease in the maximum attainable value $\mathcal {R}_{max}$ and $\mathcal {W}_{max}$. EIT not being observed here thus implies that it has been either delayed beyond $\mathcal {R}_{max}$ or $\mathcal {W}_{max}$, or completely suppressed, in such semi-dilute suspensions. The question naturally arising is then: Could the effect of particle addition simply be to globally reduce the fluid's elasticity, resulting in apparent $\mathcal {E}$ values low enough for elasto-inertial instabilities no longer to be expected? At this point, it is thus worth focusing on the effect of particle addition on the apparent viscoelastic time scales of particle loaded fluids. Those are measured by two protocols, as detailed in § 2.3: normal stress differences and elongational experiments. Results are reported in figure 2(b) (scaled by the $\varPhi =0\,\%$ value, $\lambda ^0$) and in table 1. As a reminder, the apparent elastic numbers $\mathcal {E}$ are computed for each fluid from $\lambda _{N1}$ values and also reported in table 1. It appears that $2\,\%$ particle addition leads to a steep decrease of $\lambda$ and thus of $\mathcal {E}$. Although the elastic time scale keeps a weakly decreasing trend with particle addition beyond $2\,\%$ (confirmed by both measurement techniques), the simultaneous increase in fluid viscosity makes it so that $\mathcal {E}$ remains in the same range on the whole set of $\varPhi$ investigated. It means that all fluids are still in the high elasticity regime ($\mathcal {E}\sim O(10^0)$), where direct transition from CCF to EIT would be expected (Groisman & Steinberg Reference Groisman and Steinberg1996; Moazzen et al. Reference Moazzen, Lacassagne, Thomy and Bahrani2023). Thus, the suppression or delay of EIT upon particle addition beyond $6\,\%$ cannot solely be explained by an apparent reduction of the fluid overall elasticity. Moreover, should that be the case, the difference in behaviour would be expected between the $0\,\%$ and $2\,\%$ cases for which the decrease in $\mathcal {E}$ is the more evident, and not between the $2\,\%$ and $6\,\%$ cases for which $\mathcal {E}$ stay equivalent or even increase. The change in behaviour between $2\,\%$ and 6 $\%$ has to be understood in light of local flow dynamics and fluid particle interactions, and in that context, torque measurements provide insightful information.

Figure 6(a) displays the evolution of the torque measured as a function of $\mathcal {W}=\lambda _{N_1}\dot {\gamma }$ for the example of the $\tilde {C} = 300$ ppm ($\mathcal {E}^0 = 2.07$) fluid in one dilute case where EIT is observed ($2\,\%$, $\mathcal {E}=0.62$) and two semi-dilute cases for which it is not reported ($6\,\%$$\mathcal {E}=1.06$ and $10\,\%$$\mathcal {E}=0.46$). As a confirmation of the above statement on the elasticity levels remaining high, it can be seen that the $\mathcal {W}$ range covered is similar in all three cases. The transition to EIT in the dilute $2\,\%$ case is evidenced by a clear jump in torque values (Martínez-Arias & Peixinho Reference Martínez-Arias and Peixinho2017; Moazzen et al. Reference Moazzen, Lacassagne, Thomy and Bahrani2023). No such behaviour is observed for the two other cases. However, as mentioned in § 2.3, close inspection of the torque curves reveals a change in slope at $\mathcal {W}$ values (reported in table 1) close to the critical one for the onset of EIT in the $2\,\%$ case, where the torque–$\mathcal {R}$ curve is found to depart from its laminar, CCF trend (see figures 3f and 4b,c). Thus, although there is neither visual nor dynamic (torque) evidence of EIT, the torque measurement suggests that there is indeed a modification of the dynamics, in terms of friction. The latter observation supports the assumption that EIT is not only delayed, but rather replaced by another mechanism qualified here as EID, which, to the best of the authors knowledge, has never been reported before. EID is not associated with observable flow structures and thus contributes to an apparent relaminarization of the flow by suppression of the large-scale chaotic patterns, but still corresponds to different friction dynamics than the initial laminar CCF. Indeed, the fact that the torque increases with increasing inertia is milder than the laminar prediction supports the hypothesis that additional energy dissipation is occurring in the flow, reducing friction at the inner cylinder, hence the term ‘dissipative regime’. It is expected that particle–particle and particle–polymer interactions are at the root of such a mechanism, considering that EIT can only be observed in the semi-dilute range ($\varPhi > 6\,\%$). This assumption will be discussed further. It should here be recalled that EIT is instead characterized by a torque increase ( jump) and then convergence towards a linear trend with similar slope as that found in CCF (see figure 3c) corresponding to a saturation in the EIT dynamics as reported by Moazzen et al. (Reference Moazzen, Lacassagne, Thomy and Bahrani2023, figure 6). This is thus a first fundamental difference between EIT and EID.

3.3. Onset of EID and EIT

Further information can be gained on this new transition by plotting the evolution of all $\mathcal {R}_c$ and $\mathcal {W}_c$ values (for the onset of EIT with squares or EID with crosses) as a function of $\varPhi$ and $\mathcal {E}$ in figures 6(b i) and 6(b ii), respectively. This shows that $\mathcal {R}_c$ is both quasi $\varPhi$-independent and $\mathcal {E}$-independent, although slightly lower for the onset of EID than for EIT, suggesting that the EID mechanism is actually occurring sooner (in terms of $\mathcal {R}$ during the ramp-up protocol) than EIT in semi-dilute particle loaded fluids, replacing it under comparable elasto-inertial conditions. Figure 6(c) compiles the previous results by plotting all $\mathcal {W}_c$ (EIT or EID) normalized by the $\varPhi =0\,\%$ pure viscoelastic fluid value, as a function of the relative particle contribution to the overall viscosity $\mu _{\varPhi }/\mu =(\mu -\mu (\varPhi =0))/\mu$. The graph splits up into two distinct regions. On the left-hand side, the viscosity increase upon particle addition remains negligible ($\mu _{\varPhi }/\mu <0.1$) and EIT is promoted, as discussed earlier, with $\mathcal {W}_c<\mathcal {W}_c(\varPhi =0)$. On the right-hand side, particles significantly increase the overall viscosity ($\mu _{\varPhi }/\mu >0.1$) and, in the present work, EIT is replaced by EID. In this second range, it appears that the critical $\mathcal {W}$ values for the onset of EID increase with increasing $\varPhi$ (and thus increasing $\mu _{\varPhi }/\mu$). The effect of particle addition in the semi-dilute regime can thus be understood as follows. First, the significant increase in overall viscosity $\mu$ leads to a stronger viscous dissipation mechanism, as illustrated by the steeper torque slopes in the laminar regime in figure 6(a) and in figure 4. Further increasing the inner cylinder rotational speed leads to an increase in $\mathcal {W}$ and $\mathcal {R}$ until the required elasto-inertial conditions for the onset of EID are reached and, in particular, the constant critical $\mathcal {R}$ number. However, this requires higher $\dot {\gamma }$ and thus higher $\mathcal {W}$ in the most particle loaded fluids, where the apparent increased viscosity promotes viscous dissipation and delays the onset of EID. Interestingly, Lacassagne et al. (Reference Lacassagne, Boulafentis, Cagney and Balabani2021) observed the same trend in the same $\mu _{\varPhi }/\mu >0.1$ range for the delay of the EIT onset in non-dilute particle suspensions (see figure 6c, diamonds).

Connection can be made with the recent work of Zhang & Shaqfeh (Reference Zhang and Shaqfeh2023), who used numerical simulations to show that under conditions of $\beta = {\mu _s}/{\mu }\lesssim 0.5$ and $\mathcal {W}\gg 1$ similar to that of the present work, particle–particle interactions significantly affect the viscoelastic stress hardening mechanisms known to arise in such suspensions by altering the particle-induced fluid stresses, leading to an increased stresslet. Interestingly, this effect was evidenced for $\varPhi$ values of $2.5\,\%$ or $5\,\%$ quite close to the critical concentration value reported here for the EIT–EID shift, suggesting a possible connection between this semi-dilute mechanism and the observation of EID.

3.4. Pseudo-Nusselt number in EID

Additional insight into the EID regime developing after the transition can here only be brought by the torque information, as no flow perturbation is observed from the outer-cylinder perspective of flow visualization. It is yet worth mentioning that the direct visualization method employed here only gives access to flow properties visible from the flow periphery and the outer cylinder, while torque measurements probe the flow behaviour closer to the inner cylinder. This suggests that the origin of EID could be spatially localized either in the bulk of the flow or close to the inner cylinder with yet no associated large-scale secondary flow structures, since they cause no apparent outer flow disturbance and no increase in apparent torque on the inner cylinder as would many well-known inertial, elastic or elasto-inertial Taylor–Couette instabilities (Moazzen et al. Reference Moazzen, Lacassagne, Thomy and Bahrani2022Reference Moazzen, Lacassagne, Thomy and Bahrani2023).

A relevant parameter to infer radial energy transfer properties from torque measurements is the pseudo-Nusselt number $\mathcal {N}$ as defined by Eckhardt, Grossmann & Lohse (Reference Eckhardt, Grossmann and Lohse2000) and used for example by Moazzen et al. (Reference Moazzen, Lacassagne, Thomy and Bahrani2022Reference Moazzen, Lacassagne, Thomy and Bahrani2023):

(3.2)\begin{equation} \mathcal{N}=\frac{J}{J_{lam}}=\frac{\dfrac{\tau}{2 {\rm \pi}\rho h}}{2 \nu r_o^2 r_i^2 \dfrac{\varOmega}{r_o^2-r_i^2}}. \end{equation}

This quantity represents the flow capacity to transfer momentum in the radial direction, $J$ being the momentum transport term and $J_{lam}$ its value in the laminar CCF state.

For all experiments in the EID regime, the critical pseudo-Nusselt value $\mathcal {N}_c = \mathcal {N}(\dot {\gamma }_c)$ is defined at the onset of EID, and the quantity $\Delta \mathcal {N}=\mathcal {N}-\mathcal {N}_c$ is plotted as a function of $\Delta \mathcal {R}=\mathcal {R}-\mathcal {R}_c$. The example of the $\tilde {C}=300$ ppm base fluid is illustrated in figure 7(a). This represents the variations of radial momentum transfer from the laminar reference within the EID regime, upon increasing inertia.

Figure 7. (a) $\Delta \mathcal {N} =\mathcal {N}-\mathcal {N}_c$ as a function of $\Delta \mathcal {R}= \mathcal {R}-\mathcal {R}_c$ in the EID regime for a 300 ppm fluids with $\varPhi = 6, 10, 14\,\%$. (b) Mean of the slope calculated as ${\partial \Delta \mathcal {N}}/{\partial \Delta \mathcal {R}}$ for all experiments where EID was reported. Markers and colours are similar to those used in figures 2, 5 and 6.

In most particle-loaded Newtonian fluids, this pseudo-Nusselt number is increased compared with the laminar case by secondary flows at the primary bifurcation, showing an improved radial momentum transfer ability (Ramesh et al. Reference Ramesh, Bharadwaj and Alam2019; Dash et al. Reference Dash, Anantharaman and Poelma2020; Kang & Mirbod Reference Kang and Mirbod2021; Moazzen et al. Reference Moazzen, Lacassagne, Thomy and Bahrani2022). In EIT, one would also report $\Delta \mathcal {N}>0$ and a $\Delta \mathcal {N}$ increase with increasing $\Delta \mathcal {R}$ (not shown here for the sake of plots’ clarity) consistent with the observations of Moazzen et al. (Reference Moazzen, Lacassagne, Thomy and Bahrani2023). However, from $\varPhi = 6\,\%$, this quantity decreases with increasing $\Delta \mathcal {R}$, showing an opposite $\mathcal {N}$ behaviour between EIT and EID, and supporting the fact that momentum radial transfer is reduced with EID. Figure 7(a) also suggests that increasing $\varPhi$ leads to an even steeper decrease of $\Delta \mathcal {N}$.

To investigate this point, the slope $({\partial \Delta \mathcal {N}}/{\partial \Delta \mathcal {R}})(\Delta \mathcal {R})$ is locally computed for all fluids (those represented in figure 7a and all the 400 and 500 ppm cases) and average values over the full $\Delta \mathcal {R}$ range are represented in figure 7(b) (with the error bars obtained from the standard deviation on the same range), as a function of the particle-to-polymer concentration ratio $\varPhi /\tilde {C}$. A good collapse on a clear monotonic trend is observed positioning the particle-to-polymer concentration ratio as a key parameter of the EID behaviour. This is yet another indication of the possible connection to the mechanisms reported by Zhang & Shaqfeh (Reference Zhang and Shaqfeh2023). The more particles and subsequent particle–particle interactions for a given number of polymer chains, the larger the stresslet increase and the stress hardening effects on a limited number of polymer chains, and thus the stronger the resulting local energy dissipation, reducing the radial momentum transfer towards the outer cylinder.

4. Conclusion

This study aimed at describing the influence of particle addition on the transition to EIT in high elasticity base fluids. Spherical particles were added in concentration regimes ranging from dilute to semi-dilute, in base fluids with high $\mathcal {E}$ values for which direct transition from CCF to EIT upon $\mathcal {R}$ increase would be expected. Transitions were monitored using a coupling of flow visualization and inner-cylinder torque measurements. Transition to EIT in particle-free Boger fluids was indeed retrieved, at lower $\mathcal {R}_c$ and milder $\mathcal {E}^0$ dependency than in previous studies (Groisman & Steinberg Reference Groisman and Steinberg1996; Moazzen et al. Reference Moazzen, Lacassagne, Thomy and Bahrani2023), but still with a clear elasto-inertial nature. The addition particles at a low volume fraction ($\varPhi = 2\,\%$) led to an earlier onset of EIT in terms of $\mathcal {W}_c$ (but not obvious in terms of $\mathcal {R}_c$). However, the most striking result was that particle addition at higher volume fractions ($\varPhi \geq 6\,\%$, semi-dilute regime) led to EIT being no longer observed in the $\mathcal {R}$ and $\mathcal {W}$ range investigated, suggesting an apparent relaminarization of the flow with either a delay or a replacement of EIT, which could not be ascribed to a reduction in apparent fluid elasticity. Instead, a new dissipative mechanism, termed here elasto-inertial dissipative (EID), was identified from the torque curves and friction properties. The critical conditions for the onset of EID also seem elasto-inertial and quite similar to those for the onset of EIT in pure fluids or dilute suspensions. It appears that the relative increase of fluid viscosity upon particle addition is a key parameter in the onset of EIT or EID, as confirmed by compiling results from the present work and Lacassagne et al. (Reference Lacassagne, Boulafentis, Cagney and Balabani2021): the dilute regime at $\varPhi \leq 5\,\%$ corresponds to a minor increase in viscous dissipation ($\mu _{\varPhi }/\mu \leq 0.1$) and earlier onset of EIT, while increasing $\varPhi$ in the semi-dilute regime sees significant increase in viscous dissipation upon particle addition ($\mu _{\varPhi }/\mu >0.1$) and a delay in EIT or delayed onset of EID. The evolution of the pseudo-Nusselt number in the EID regime shows that particle addition reduces radial momentum transfers, commensurate with the $\varPhi / \tilde {C}$ ratio. In summary, EID is thus expected to be: (1) a local mechanism; (2) elasto-inertial in that it requires non negligible values of both $\mathcal {R}$ and $\mathcal {W}$; and (3) driven by polymer–particle interactions as it arises only in the semi-dilute regime. The accurate determination of the critical conditions for the onset of EID ($\varPhi,\mathcal {W},\mathcal {R}$ and geometrical parameters) could be the object of a future study. More generally, future studies should aim at providing local quantitative information on flow velocity fields (Boulafentis et al. Reference Boulafentis, Lacassagne, Cagney and Balabani2024) and possible particle migration phenomena. This would allow to investigate local particle–polymer interaction mechanisms and their effect on polymeric stress field in a semi-dilute context (Zhang & Shaqfeh Reference Zhang and Shaqfeh2023), which would be of great interest to unravel the mechanisms behind delayed EIT or EID in the Taylor–Couette flow of particle-loaded viscoelastic fluids.

Supplementary movie

Supplementary movie is available at https://doi.org/10.1017/jfm.2024.781.

Funding

This work was partially funded by the French National Research Agency (ANR-22-CE05-0017-01). Financial support from Region Hauts de France is also gratefully acknowledged.

Declaration of interests

The authors report no conflict of interest.

References

Andereck, C.D., Liu, S.S. & Swinney, H.L. 1986 Flow regimes in a circular Couette system with independently rotating cylinders. J. Fluid Mech. 164, 155183.CrossRefGoogle Scholar
Baroudi, L., Majji, M.V., Peluso, S. & Morris, J.F. 2023 Taylor–Couette flow of hard-sphere suspensions: overview of current understanding. Phil. Trans. R. Soc. A 381, 120.CrossRefGoogle ScholarPubMed
Boger, D.V. 1977 Demonstration of upper and lower Newtonian fluid behaviour in a pseudoplastic fluid. Nature 265, 8791.CrossRefGoogle Scholar
Boulafentis, T., Lacassagne, T., Cagney, N. & Balabani, S. 2023 Experimental insights into elasto-inertial transitions in Taylor–Couette flows. Phil. Trans. R. Soc. A 381 (2243), 20220131.CrossRefGoogle Scholar
Boulafentis, T., Lacassagne, T., Cagney, N. & Balabani, S. 2024 Coherent structures of elasto-inertial instabilities in Taylor–Couette flows. J. Fluid Mech. 986, A27.CrossRefGoogle Scholar
Campo-Deaño, L. & Clasen, C. 2010 The slow retraction method (SRM) for the determination of ultra-short relaxation times in capillary breakup extensional rheometry experiments. J. Non-Newtonian Fluid Mech. 165 (23), 16881699.CrossRefGoogle Scholar
Couette, M. 1890 Distinction de deux régimes dans le mouvement des fluides. J. Phys. Theor. Appl. 9, 414424.CrossRefGoogle Scholar
Dash, A., Anantharaman, A. & Poelma, C. 2020 Particle-laden Taylor–Couette flows: higher-order transitions and evidence for azimuthally localized wavy vortices. J. Fluid Mech. 903, A20.CrossRefGoogle Scholar
Dubrulle, B., Dauchot, O., Daviaud, F., Longaretti, P.-Y., Richard, D. & Zahn, J.-P. 2005 Stability and turbulent transport in Taylor–Couette flow from analysis of experimental data. Phys. Fluids 17, 095103.CrossRefGoogle Scholar
Dutcher, C.S. & Muller, S.J. 2013 Effects of moderate elasticity on the stability of co- and counter-rotating Taylor–Couette flows. J. Rheol. 57 (3), 791812.CrossRefGoogle Scholar
Eckhardt, B., Grossmann, S. & Lohse, D. 2000 Scaling of global momentum transport in Taylor–Couette and pipe flow. Eur. Phys. J. B 18, 541544.CrossRefGoogle Scholar
Eckhardt, B., Grossmann, S. & Lohse, D. 2007 Torque scaling in turbulent Taylor–Couette flow between independently rotating cylinders. J. Fluid Mech. 581, 221250.CrossRefGoogle Scholar
Fardin, M.A., Perge, C. & Taberlet, N. 2014 “The hydrogen atom of fluid dynamics” – introduction to the Taylor–Couette flow for soft matter scientists. Soft Matt. 10 (20), 3523.CrossRefGoogle Scholar
Groisman, A. & Steinberg, V. 1996 Couette–Taylor flow in a dilute polymer solution. Phys. Rev. Lett. 77, 14801483.CrossRefGoogle Scholar
Groisman, A. & Steinberg, V. 1998 Mechanism of elastic instability in Couette flow of polymer solutions: experiment. Phys. Fluids 10 (10), 24512463.CrossRefGoogle Scholar
Groisman, A. & Steinberg, V. 2000 Elastic turbulence in a polymer solution flow. Nature 405, 5355.CrossRefGoogle Scholar
Groisman, A. & Steinberg, V. 2004 Elastic turbulence in curvilinear flows of polymer solutions. New J. Phys. 6, 147.CrossRefGoogle Scholar
James, D.F. 2009 Boger fluids. Annu. Rev. Fluid Mech. 41 (1), 129142.CrossRefGoogle Scholar
Kang, C. & Mirbod, P. 2021 Flow instability and transitions in Taylor–Couette flow of a semidilute non-colloidal suspension. J. Fluid Mech. 916, A12.CrossRefGoogle Scholar
Kang, C., Schatz, M.F. & Mirbod, P. 2024 Hysteresis and ribbons in Taylor–Couette flow of a semidilute non-colloidal suspension. Phys. Rev. Fluids 9 (2), 023901.CrossRefGoogle Scholar
Lacassagne, T., Boulafentis, T., Cagney, N. & Balabani, S. 2021 Modulation of elasto-inertial transitions in Taylor–Couette flow by small particles. J. Fluid Mech. 929, 1–12.CrossRefGoogle Scholar
Larson, R.G., Shaqfeh, E.S.G. & Muller, S.J. 1990 A purely elastic instability in Taylor–Couette flow. J. Fluid Mech. 218, 573.CrossRefGoogle Scholar
Lin, F., Song, J., Liu, N., Wan, Z., Lu, X.-Y. & Khomami, B. 2024 Maximum drag enhancement asymptote in turbulent Taylor–Couette flow of dilute polymeric solutions. J. Non-Newtonian Fluid Mech. 323, 105172.CrossRefGoogle Scholar
Lin, F., Song, J., Zhao, Z., Liu, N., Lu, X.-Y. & Khomami, B. 2023 A novel transition route to elastically dominated turbulence in viscoelastic Taylor–Couette flow. J. Non-Newtonian Fluid Mech. 312, 104968.CrossRefGoogle Scholar
Lin, Y., Phan-Thien, N. & Cheong Khoo, B. 2014 Normal stress differences behavior of polymeric particle suspension in shear flow. J. Rheol. 58 (4), 223–235.CrossRefGoogle Scholar
Majji, M.V., Banerjee, S. & Morris, J.F. 2018 Inertial flow transitions of a suspension in Taylor–Couette geometry. J. Fluid Mech. 835, 936969.CrossRefGoogle Scholar
Martínez-Arias, B. & Peixinho, J. 2017 Torque in Taylor–Couette flow of viscoelastic polymer solutions. J. Non-Newtonian Fluid Mech. 247, 221228.CrossRefGoogle Scholar
Moazzen, M., Lacassagne, T., Thomy, V. & Bahrani, S.A. 2022 Torque scaling at primary and secondary bifurcations in a Taylor–Couette flow of suspensions. J. Fluid Mech. 937, 1–31.CrossRefGoogle Scholar
Moazzen, M., Lacassagne, T., Thomy, V. & Bahrani, S.A. 2023 Friction dynamics of elasto-inertial turbulence in Taylor–Couette flow of viscoelastic fluids. Phil. Trans. R. Soc. A 381 (2246), 20220300.CrossRefGoogle ScholarPubMed
Pakdel, P. & McKinley, G.H. 1996 Elastic instability and curved streamlines. Phys. Rev. Lett. 77 (12), 24592462.CrossRefGoogle Scholar
Ramesh, P., Bharadwaj, S. & Alam, M. 2019 Suspension Taylor–Couette flow: co-existence of stationary and travelling waves, and the characteristics of Taylor vortices and spirals. J. Fluid Mech. 870, 901940.CrossRefGoogle Scholar
Schäfer, C., Morozov, A. & Wagner, C. 2018 Geometric scaling of elastic instabilities in the Taylor–Couette geometry: a theoretical, experimental and numerical study. J. Non-Newtonian Fluid Mech. 259, 7890.CrossRefGoogle Scholar
Song, J., Wan, Z.-H., Liu, N., Lu, X.-Y. & Khomami, B. 2021 A reverse transition route from inertial to elasticity-dominated turbulence in viscoelastic Taylor–Couette flow. J. Fluid Mech. 927, A10.CrossRefGoogle Scholar
Tanner, R.I. 2020 Computation and experiment in non-colloidal suspension rheology. J. Non-Newtonian Fluid Mech. 281, 104282.CrossRefGoogle Scholar
Taylor, G.I. 1922 Stability of a viscous liquid contained between two rotating cylinders, pp. 289343. The Royal Society.Google Scholar
Zhang, A. & Shaqfeh, E.S.G. 2023 Rheology of non-Brownian particle suspensions in viscoelastic solutions. Part 1. Effect of the polymer concentration. J. Rheol. 67 (2), 499516.CrossRefGoogle Scholar
Figure 0

Figure 1. (a) Taylor–Couette cell mounted on an MCR102 Anton Paar rheometer with geometrical parameters symbols and illustration of the imaging system (see details in Moazzen et al.2022, 2023) and quasi-steady inner cylinder ramp-up protocol. (b) Geometrical cell parameters values.

Figure 1

Table 1. Rheological viscoelastic suspensions properties and associated dimensionless numbers. $\mathcal {W}_c=\lambda _{N_1}\times \dot {\gamma }_c$, $\mathcal {R}_c=\rho \delta ^2\dot {\gamma }_c/\mu$ and $\dot {\gamma }_c$ are the respective critical Wiessenberg number, Reynolds number and shear-rate for the onset of EIT for $\varPhi =0$ or $2\,\%$, or new elasto-inertial dissipative (EID) mechanisms (in italics, for $\varPhi \geq 6\,\%$). Superscript 0 indicates quantities computed using the base fluid relaxation time $\lambda ^0=\lambda _{N_1}(\varPhi =0\,\%)$. Apparent relaxation time scales $\lambda =\lambda _{N_1}(\varPhi,\tilde {C})$ are used otherwise. The maximum particle Reynolds number is $\mathcal {R}_p^{max} = {\rho \dot {\gamma }_{max}\,{\rm d}p^2}/{4\mu }$.

Figure 2

Figure 2. (a) Constant shear viscosity (averaged on a 10–100 s$^{-1}$ shear-rate range) for all polymer and particle concentrations. An MCR302 rheometer with parallel-plate 50 mm geometry with a 0.5 mm gap was used. (b) Elastic time scale $\lambda$ for all fluid samples, normalized by the particle-free measured value, obtained from first normal stress differences (empty markers, same rheometer) or extensional measurements (full markers – bespoke extensional rheometer set-up).

Figure 3

Figure 3. Coupling of flow visualization with (a,d) space–time diagrams, (b,e) frequency maps where $f_{max} = {2 {\rm \pi}}/{\varOmega _{max}}$ correspond to maximal inner cylinder frequency and (c,f) torque measurements, applied to samples with $\tilde {C}=300$ ppm, (ac) $\varPhi =2\,\%$ and (df) $\varPhi =6\,\%$. Vertical dashed red lines indicate the critical $\mathcal {R}_{c}$ value for the onset of EIT when this flow state is evidenced in panels (ac), or a new regime discussed hereinafter in panels (df), also indicated by a red circle. Linear ridges visible in frequency maps in panels (b,e) correspond to the rotation frequency of the inner cylinder detected by the method.

Figure 4

Figure 4. Detection of critical conditions (here $\dot {\gamma }_c$) for the transition to non-laminar friction regimes, for $\tilde {C}=300$ ppm and $\varPhi = 0, 6 \text { and } 14\,\%$. Full line curves are measured torque signals, dotted lines are laminar trends and dashed lines are the norm of the difference between measured torque and laminar trend. All values are scaled by the maximum torque measured at the end of the run $\tau _{max}$. Black circles and vertical dashed lines represent detected critical $\dot {\gamma }$ where laminar trend and torque curve diverge. The colour scheme for particle concentrations is the same as in figure 2. (a) $\varPhi = 0\,\%$, (b) $\varPhi = 6\,\%$, (c) $\varPhi = 14\,\%$.

Figure 5

Figure 5. (a) Critical value $\mathcal {R}_{c}$ for the onset of EIT as a function of the base fluid elastic number $\mathcal {E}^0$ compared with (b) previous literature data. The horizontal dashed line in panel (a) represents the critical Reynolds number $\mathcal {R}_c^N$ for the onset of the primary instability in a Newtonian fluid in the same Couette geometry (Moazzen et al.2022). Errors bars are derived from uncertainty propagation from viscosity (dominant) and detection (negligible) uncertainties. (c) Critical $\mathcal {W}_c$ for the onset of EIT (squares) compared with the purely elastic instability threshold computed with the Pakdel–McKinely criterion adapted to the Taylor–Couette geometry (plus signs, see (3.1) proposed by Schäfer et al.2018). Empty squares are present work values for $\varPhi = 0\,\%$ and full ones for $\varPhi = 2\,\%$.

Figure 6

Figure 6. (a) Torque measured on the inner cylinder as a function of $\mathcal {W}=\dot {\gamma } \lambda _{N_1}$. Vertical dashed lines indicate the $\mathcal {W}_c$ values for trend change. Dashed black linear trends correspond to the laminar flow state. Panels (b i) and (b ii) are $\mathcal {R}_c$ as a function of $\varPhi$, and $\mathcal {W}_c$ as a function of $\mathcal {E}$, respectively, with squares reporting the onset of EIT and crosses the onset of EID, at approximately constant $\mathcal {R}_c$ values for each regime, indicated by dashed lines. (c) Values of $\mathcal {W}_c$ (same symbols) scaled by the zero-particle value $\mathcal {W}_c (\varPhi = 0\,\%)$, as a function of the particle-related viscosity increase ($\mu _{\varPhi } / \mu$). The grey area corresponds to EIT data points and the vertical dashed black line a $\mu _{\varPhi } / \mu =0.1$ limit from dilute to semi-dilute concentration regime.

Figure 7

Figure 7. (a) $\Delta \mathcal {N} =\mathcal {N}-\mathcal {N}_c$ as a function of $\Delta \mathcal {R}= \mathcal {R}-\mathcal {R}_c$ in the EID regime for a 300 ppm fluids with $\varPhi = 6, 10, 14\,\%$. (b) Mean of the slope calculated as ${\partial \Delta \mathcal {N}}/{\partial \Delta \mathcal {R}}$ for all experiments where EID was reported. Markers and colours are similar to those used in figures 2, 5 and 6.

Supplementary material: File

Carré et al. supplementary movie

Visualisation of the flow structure (left) for 2% (bottom) and 6% (top) particle concentration, as the inner cylinder rotation speed is progressively increased, and corresponding torque measured by the rheometer (right).
Download Carré et al. supplementary movie(File)
File 3.3 MB