


The characteristics of milk play a crucial role in determining the quality of cheese. The composition, quality, and treatment of milk can significantly impact the flavour, texture and overall characteristics of the final cheese product (Bittante et al., Reference Bittante, Amalfitano, Bergamaschi, Patel, Haddi, Benabid, Pazzola, Vacca, Tagliapietra and Schiavon2022). For instance, the fat content in milk contributes to the flavour, mouthfeel and creaminess of the cheese. Different cheese varieties may require varying levels of fat for the desired characteristics (Laursen et al., Reference Laursen, Rovers, Ipsen and Ahrné2022). In addition, the balance of casein and whey proteins in milk affects the cheese's texture and structure. Casein is essential for curd formation, which is crucial in the cheese-making process (Lara-Castellanos et al., Reference Lara-Castellanos, Azuara, Jimenez-Fernandez, Luna-Solano and Jimenez2021). Moreover, lactose is converted into lactic acid during fermentation by lactic acid bacteria, a key step in cheese production. The lactose content can influence the final taste of the cheese (López Ruiz et al., Reference López Ruiz, Ruiz Morales, Ruiz Pérez-Cacho and Galán-Soldevilla2023). Calcium is essential for the coagulation of milk proteins, contributing to the formation and structure of the curd during cheese-making. Different cheeses also have varying moisture requirements. The microbial content of milk, including natural bacteria and enzymes, can affect the fermentation process and the development of flavour in the cheese (Zheng et al., Reference Zheng, Ge, Lin, Zhang, Chen, Xiao, Wang and Shi2021). In the same concept, the heat treatment of milk (pasteurization or raw milk) can influence the flavour and texture of the cheese. Raw milk cheeses may have distinct flavours due to the presence of native microflora (Laursen et al., Reference Laursen, Rovers, Ipsen and Ahrné2022). Furthermore, homogenization breaks down fat globules in milk, affecting the texture and melting properties of the cheese (Shao et al., Reference Shao, Yuan, Xi, Zhao and Ai2023). Lastly, the diet of animals and, therefore, pasture may influence milk quality. Thus, milk composition can vary seasonally based on dietary factors such as variations in pasture, hay, or supplementary feeds. This can also impact the flavour profile of the cheese (Davis et al., Reference Davis, Chatzidimitriou, Leifert and Butler2020).
Nowadays, spectroscopy is a promising technology with many applications in dairy science (Loudiyi et al., Reference Loudiyi, Temiz, Sahar, Haseeb Ahmad, Boukria, Hassoun and Aït-Kaddour2022). Both near (NIR) and middle infrared (MIR) are used to study milk quality. NIR is effective for assessing moisture, protein and fat content, while MIR provides detailed information about molecular structures. Both techniques offer non-destructive and rapid analysis, making them valuable tools in dairy industry research and quality control (Coppa et al., Reference Coppa, Martin, Hulin, Guillemin, Gauzentes, Pecou and Andueza2021; Grelet et al., Reference Grelet, Dardenne, Soyeurt, Fernandez, Vanlierde, Stevens, Gengler and Dehareng2021; Yakubu et al., Reference Yakubu, Kovacs, Toth and Bazar2022). MIR spectra in foods and beverages usually have the wide bands at 3386, 3390, and 3336 cm−1 arise from the O–H and N–H stretching vibrations from polysaccharides and proteins, while the bands at 2927 and 2935 cm−1 correspond to CH2 asymmetric or symmetric stretch. The bands at 1650–1628 and 1543 cm−1 result from stretching or bending vibrations of the bonds which may be derived from proteins. Absorption bands at 1435, 1404, and 1346 cm−1 correspond to CH2 bending vibrations, rocking vibrations of C–H bonds, and bending vibrations of CH3 groups, respectively. The most important area in the spectrum for distinguishing the origin of the samples is the region 4000–2500 cm−1, which contains mainly the bands of proteins, polysaccharides, unsaturated lipids and carbohydrates (Christou et al., Reference Christou, Agapiou and Kokkinofta2018; Tarapoulouzi et al., Reference Tarapoulouzi, Kokkinofta and Theocharis2020). Furthermore, multivariate data analysis (MVDA) or chemometrics plays a crucial role in dairy analysis, especially when dealing with complex datasets generated from techniques like NIR and MIR spectroscopy. Chemometric methods, supervised and unsupervised, help extract meaningful information from multivariate datasets, enabling researchers to identify patterns, correlations and trends in various parameters like fat, protein and moisture content. This facilitates accurate prediction, quality control and overall optimization of dairy production processes (Tarapoulouzi et al., Reference Tarapoulouzi, Kokkinofta and Theocharis2020; Grassi et al., Reference Grassi, Tarapoulouzi, D'Alessandro, Agriopoulou, Strani and Varzakas2022; Frizzarin et al., Reference Frizzarin, Visentin, Ferragina, Hayes, Bevilacqua, Dhariyal, Domijan, Khan, Ifrim, Le Nguyen and Le Nguyen2023).
Furthermore, chemometrics and discriminant analysis play crucial roles in spectroscopic studies in dairy science (Grassi et al., Reference Grassi, Tarapoulouzi, D'Alessandro, Agriopoulou, Strani and Varzakas2022; Hayes et al., Reference Hayes, Greene, O'Donnell, O'Shea and Fenelon2023; Smaoui et al., Reference Smaoui, Tarapoulouzi, Agriopoulou, D'Amore and Varzakas2023). In the context of milk analysis, spectroscopy can be used to study the composition of milk, including its fat content, protein content and other constituents (Alami et al., Reference Alami, El Orche, Otmani, Elhamdaoui and Bouatia2023). Raw spectral data obtained from instruments may contain noise and unwanted variations. Chemometric techniques, such as baseline correction, normalization and smoothing, can be applied to preprocess the data and enhance its quality (Kharbach et al., Reference Kharbach, Alaoui Mansouri, Taabouz and Yu2023). Chemometrics involves the application of multivariate statistical methods to analyse complex data sets. Principal component analysis (PCA) is commonly used in spectroscopic studies to reduce the dimensionality of the data and identify the major sources of variation. Discriminant analysis, on the other hand, is employed to differentiate between different groups or classes. In the context of seasonal variations in milk, discriminant analysis can be used to classify samples into groups corresponding to different seasons. In terms of variable selection, chemometrics can aid in selecting the most relevant spectral features that contribute to the discrimination between different seasons. This helps in identifying the key components responsible for the observed variations in milk. Understanding the results of discriminant analysis is essential. Chemometric techniques allow for the interpretation of the loadings and scores obtained from the analysis, helping to identify which spectral regions or compounds are responsible for the observed seasonal differences. Discriminant analysis also helps in pattern recognition, allowing researchers to discern patterns in the spectroscopic data that correspond to different seasons. This can provide insights into how seasonal variations affect the composition of milk. In addition, by applying chemometric techniques to spectroscopic data collected over multiple seasons, it becomes possible to monitor changes in milk composition over time. This information is valuable for quality control and understanding the impact of environmental factors on milk characteristics. The integration of chemometrics and discriminant analysis in spectroscopical studies enables researchers to extract meaningful information from complex data sets, facilitating the characterization of dairy products and beverages (Grassi et al., Reference Grassi, Tarapoulouzi, D'Alessandro, Agriopoulou, Strani and Varzakas2022; Hayes et al., Reference Hayes, Greene, O'Donnell, O'Shea and Fenelon2023; Ye et al., Reference Ye, Yang, Xiao, Zhao, Li, Bai, Zeng and Dong2023).
This study addresses the hypothesis of whether the combination of MIR and chemometrics can determine different feeding regimes in milk. The same methodology will be applied by using cheese in future studies, to test this capability further. Protected designation of origin (PDO) cheeses where free-range is obligatory in the product specification could utilize results of this study on milk. Halloumi, a traditional cheese from Cyprus, has recently gained PDO status, thus, it is important to study this product's quality characteristics and enhance the official quality controls. The combination of MIR and chemometrics may be a promising tool for rapid, non-destructive, ease of use and cost-effective evaluation of milk quality regarding feeding regimes. Especially, minimizing sample preparation is also a very important parameter in the dairy production chain. Lastly, the generation of a robust and accurate chemometric model could serve as a database for future predictions.
Material and methods
Sampling and pre-treatment
A total of 65 milk samples, approximately 200 ml each, were collected during Spring time (March 2023 to May 2023) from the same dairy farm in Choulou, Paphos, Cyprus. Of these, 34 were from free-range (extensive) feeding goats and 31 from intensive feeding goats, thus forming two study groups. Breed (cross of Damascus and Machairas goats) and stage of lactation were the same for both groups. All samples were freeze-dried (Zirbus, Germany), for 24 h before spectroscopic analysis.
Feeding regimes
The free-range group were left to graze for approximately 12 h during the day. The plants that comprise the general grazing vegetation of the sampling area include aromatic herbs (Thymus capitatus, Satureja thymbra, Cistus creticus), vegetation (Malva sylvestris, Sinapis arvensis, Trifolium pamphylicum, Onopordum cyprium, Helichrysum siculum) and bushes/trees (Pistacia terebinthus, Olea europaea, Ceratonia siliqua).
The intensive farming group was fed indoors with a diet consisting of concentrates in the form of pellets (18% protein, 8% fibre, 7.5% ash, 2.5% fats/oils, vitamins) and fodder in the form of hay.
FTIR measurements
The transmittance spectra were obtained under controlled environmental conditions on a Shimadzu IR Prestige-21 FTIR spectrophotometer as a pressed KBr pellet. The spectra were recorded in duplicate in the wavelength region of MIR, 4000–400 cm−1 with 20 scans and an 8 cm−1 resolution. A background was collected before measuring each sample and then subtracted automatically from the sample spectra before further analysis. In addition, the subregion between 2700 and 2000 cm−1 was removed as it did not contain any important information. The double peak near 2300 cm−1 which corresponds to CO2 is included in this spectroscopic region, thus it was also removed from all the samples to avoid any interruption of the data analysis.
Spectral data were tested (using chemometrics) in several forms: after baseline correction, and after the first or second derivative of the spectra using the Savitzky–Golay method. The baseline correction was performed to improve the eventual drift of the spectrometric signal. Finally, the first derivatives were used for the recorded transmittance spectra.
Data analysis
The data were subjected to multivariate statistical analysis using SIMCA software (version 17.0, Umetrics, Sweden) to evaluate the possibility of differentiating milk regarding the feeding regimes. The data were treated with Pareto scaling, and the models were extracted at a confidence level of 95%. Initial variables were 3995 in total.
OPLS-DA was performed to evaluate whether the discrimination of samples based on the production regimen could be based on the determined spectral profile and to verify which subregion influences such a classification. By using the variable importance in projection (VIP) plot, we selected the most significant variables. The data referred to the VIP values was compressed, and the procedure generated a set of principal components as discriminant parameters based on the selected variables that provide the best discrimination between the groups.
The success of the discrimination was measured by the proportion of cases correctly classified based on the calculations of the misclassification table. Permutation tests evaluated the robustness of the models. Permutation testing serves as a statistical measure of significance for predictive power in cross-validation. In this process, the X-data remains unaltered, while the Y-data undergoes random permutation to assume a different sequence. Subsequently, the model is fitted to the permuted Y-data, and cross-validation metrics R2Y and Q2Y are calculated to assess the effectiveness of the derived model (Eriksson et al., Reference Eriksson, Trygg and Wold2014).
Discriminant models need to be trained and this is usually based on a common approach of splitting the data into training and validation sets. Therefore, a subset of the data was created, and their performance was validated on an independent set to ensure robustness and reliability.
Results and discussion
FTIR spectra
Goat milk samples were studied between March and May, a period important in animal nutrition due to the flowering of wild plants and shrubs. This allowed us to investigate how free grazing affects the quality of milk. Initially, the spectra were recorded in the whole wavelength range of 4000–400 cm−1 as shown in Figure 1, and then studied for specific ranges of wavenumbers to assess which is the most useful that provides better discrimination in terms of the goals of this study.
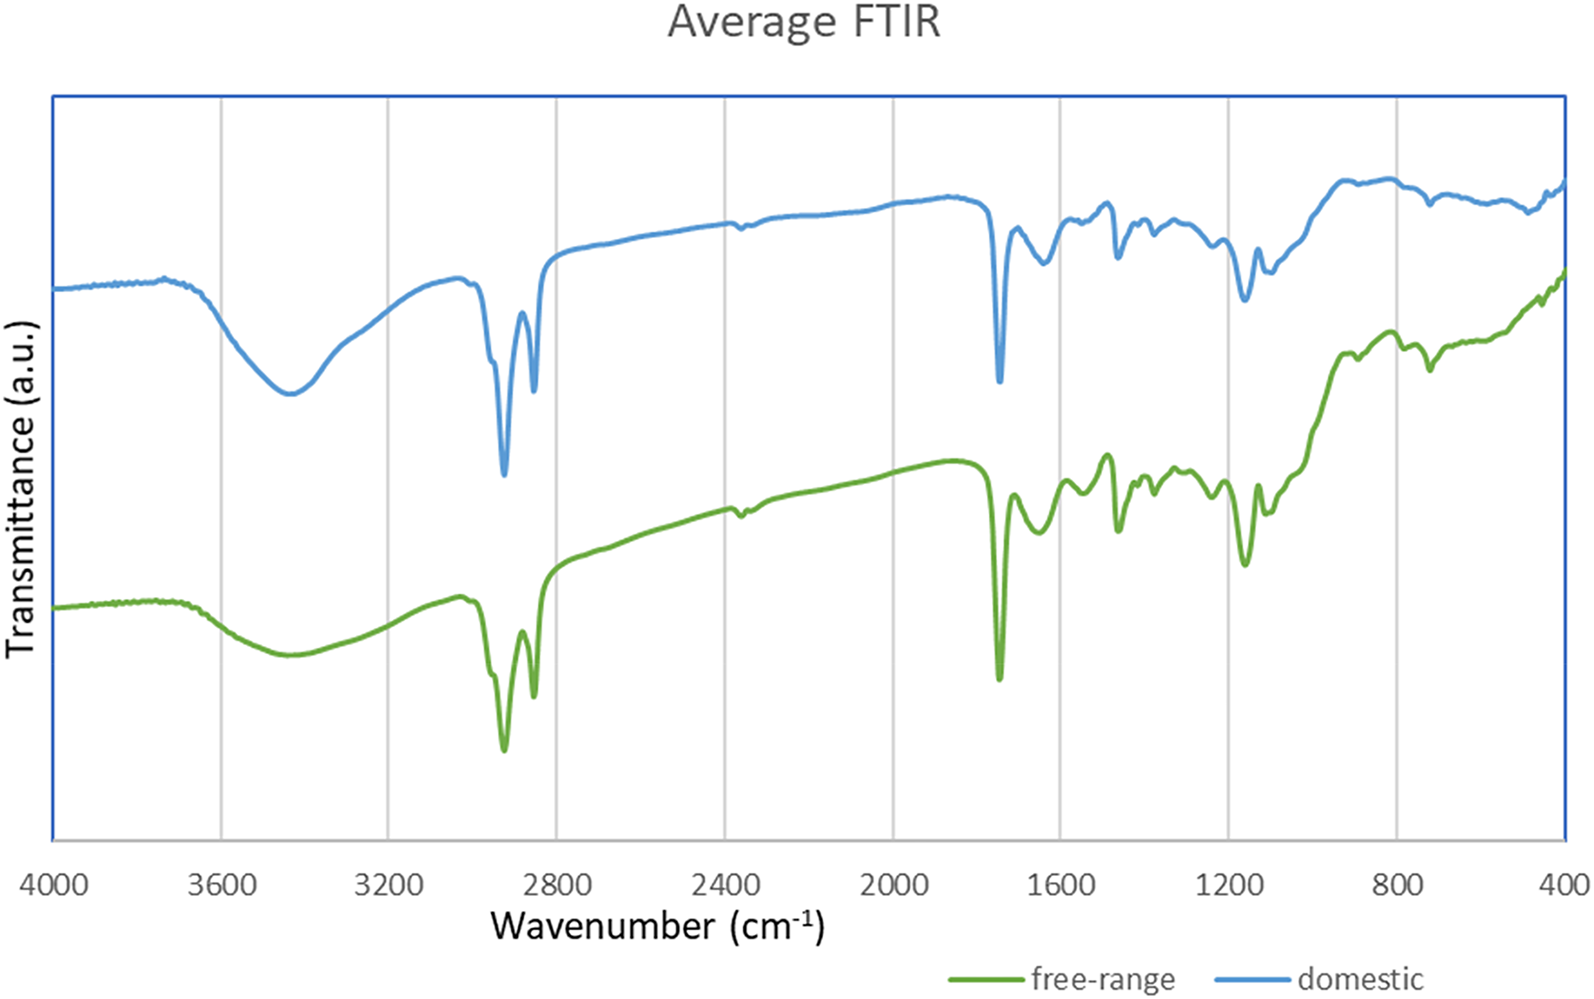
Figure 1. Average FTIR spectrum for the two milk types, free range (green) and domestic (blue) ones.
Regarding band assignments in the IR region of spectra (as presented in Fig. 1), hydroxyl and phenolic functional groups were most closely correlated with antioxidant capacity and terpenes found in plants consumed by goats. Menthol, thymol and borneol are terpene alcohols and exhibited an O–H stretching vibration at 3300–3400 cm−1. Camphor displayed a strong absorption band at 1739 cm−1, which is a characteristic of ketones having a C = O stretching vibration. Furthermore, symmetrical and asymmetrical –CH2 stretching vibrations correspond to the bands at 2958 and 2867 cm−1, respectively. These bands are superimposed upon the O–H stretching. These terpene molecules present a hydrogen bond between the oxygen atoms and the hydroxyl groups. Moreover, the inclusion of fresh plants in the diet is known to increase the level of unsaturation of milk fat. In addition, lactose is a significant parameter affected by nutrition. Thus, the detection seems to take place based on bands around 1150–1750 cm−1 and the region 2800–3000 cm−1 and they were the most important subregions for the correct classification of the samples based on feeding regime. The last regions and the bands around 1175 cm−1 and 1740–1750 cm−1 are attributed to the absorption by milk fat and antioxidants.
Data analysis
Using the variable importance in projection (VIP) parameter (not shown here) we selected the most significant variables (those with VIP >1, since 1.16 was the maximum obtained value) to exclude redundant variables from the model. Variables with VIP values between 1 and 1.06 were tested to check if they should be kept in. Therefore, it was observed that they were not affecting positively the OPLS-DA model, and they were excluded. Subsequently, based on the VIP outcome, only variables with VIP values greater than 1.06 were kept for the OPLS-DA model, comprising 351 variables out of 3995. The spectroscopic data of ranges 1071–1233, 1734–1752, 2754–3080, 3312–3505 cm−1 was compressed, which generated a set of principal components as discriminant parameters based on the selected variables that provide the best discrimination between the groups.
The above spectroscopic subregions highlighted by the VIP plot confirm the findings of characterization presented in the previous part, entitled FTIR spectra. Therefore, 1071–1233 cm−1 is assigned to lactose and milk fat, 1734–1752 cm−1 refers to antioxidants and camphor, 2754–3080 cm−1 is accredited to lactose and camphor, as well as 3312–3505 cm−1 includes the vibrations of the terpene alcohols. The feeding regime of goats was obvious in the goat-origin samples, as the samples were discriminated in domestic and free-range feeding regimes after interpretation by multivariate data analysis (chemometrics). Overall, in comparison with the MIR regions corresponding to the absorption of fats, lactose, terpenes and antioxidants, the spectral subregions related to the absorption of proteins were found to contribute less to the extracted model.
Subsequently, the chemometrics application underlined the significance of the results, in two ways; (1) by producing and validating a model based on a discriminant analysis method (as shown in Fig. 2A–D), and (2) by extracting the most significant spectral regions based on which the model was built (as described above). Figure 2 presents the validation results, therefore the score plot for the OPLS-DA training set in Figure 2A, as well as the misclassification table for the OPLS-DA training set in 2B, the score plot for the OPLS-DA test set in 2C, as well as the misclassification table for the OPLS-DA test set in 2D. Correct classification of samples were 95.56 and 100% for the training and test sets, respectively.

Figure 2. Validation results, (A) score plot for the OPLS-DA training set, (B) misclassification table for the OPLS-DA training set, (C) score plot for the OPLS-DA test set, and (D) misclassification table for the OPLS-DA test set.
Figure 3A&B show the overall model and clear discrimination of the samples in two groups is shown in the plane. R2X(cum) = 0.968, R2Y(cum) = 0.913, and Q2(cum) = 0.735 have been calculated for the model. In addition, Table 1 summarizes the correct classification rates for all samples (overall and validated model) by using the PCs of 1st derivatives in 2500–4000 cm−1.
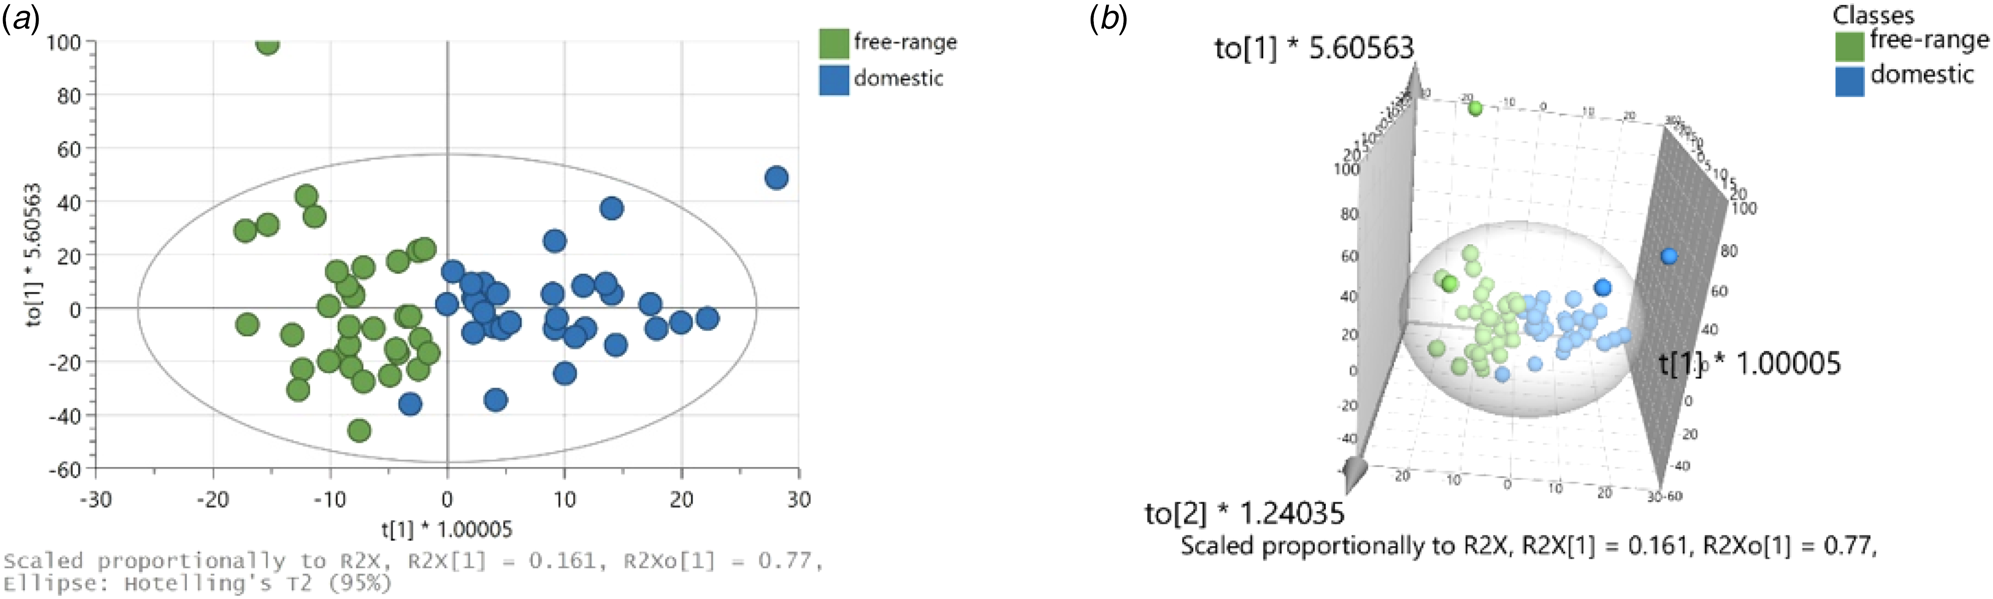
Figure 3. OPLS-DA scatter plots (R2X(cum) = 0.968, R2Y(cum) = 0.913, and Q2(cum) = 0.735); (A) 2D plot, and (B) 3D plot.
Table 1. Misclassification table for all samples (overall, validated model)
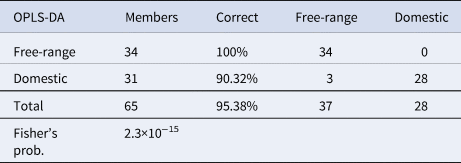
Figure 4 shows a random permutation test with 200 permutations used for the validation of goodness of fit and the predictability of these results. The R2Y values of all permuted models were lower than the original model's R2Y value (0.735); most of the Q2 regression lines showed negative intercepts (0.0, −0.311).
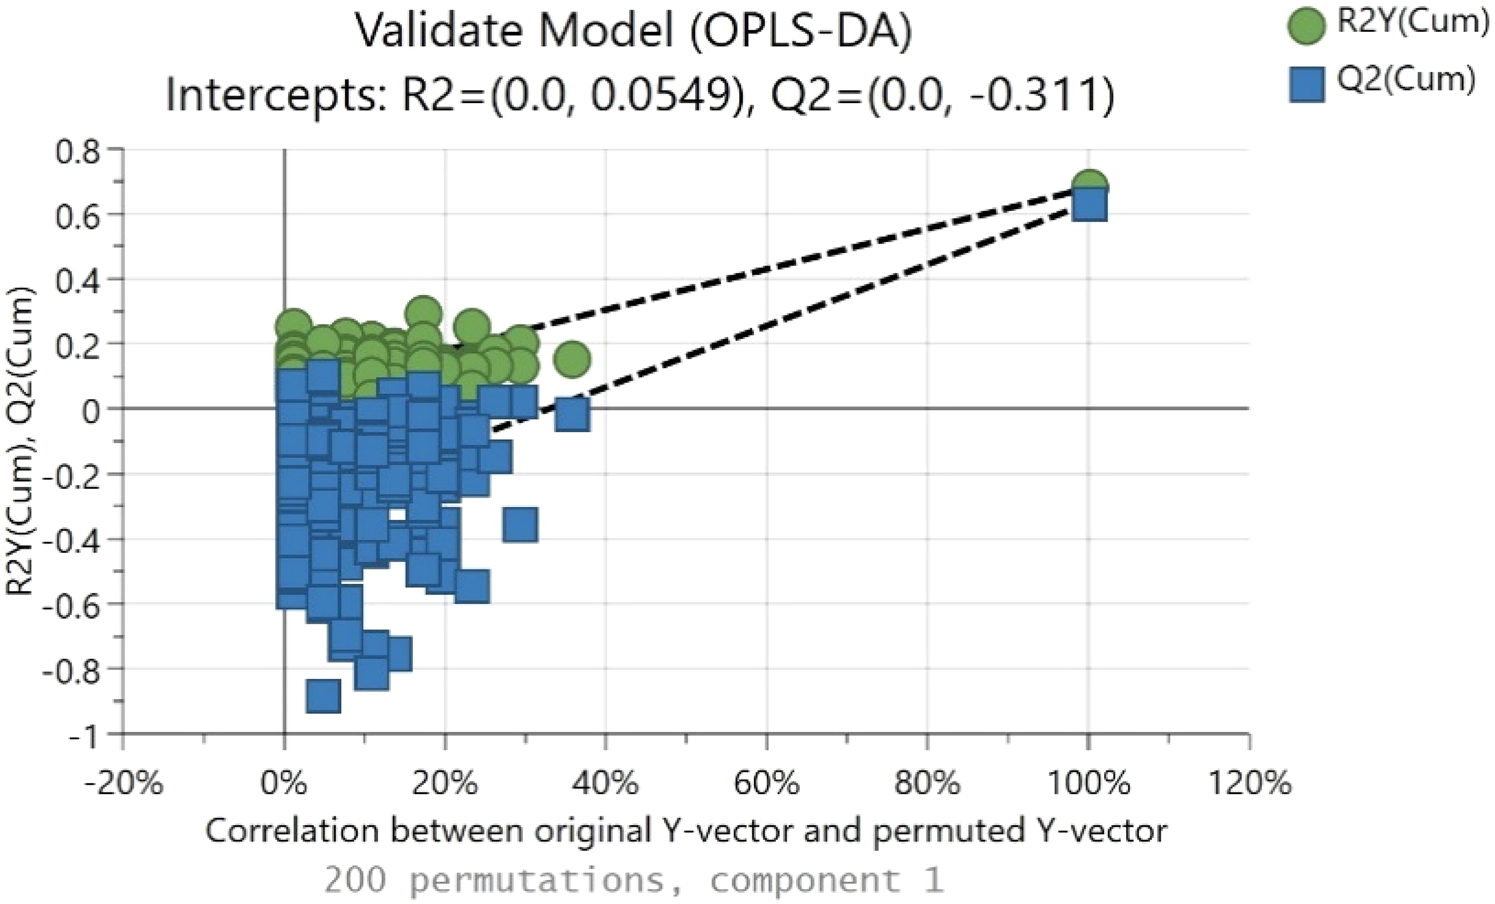
Figure 4. Permutation test took place based on 200 permutations, where both R2 (original model) and Q2 (predictive model) located at right, and permutated R2 (original model) and Q2 (predictive model) located at left.
It is well-known that plants accumulate minerals and metals essential for their growth from the environment. Auerswald et al. (Reference Auerswald, Schäufele and Bellof2015) observed seasonal variation in long-chain fatty acids in cow milk. This indicated a bypass of long-chain fatty acids from fresh grass to milk. Feeding regimes consisted of conserved grass and pasture with and without concentrate to total mixed rations with up to 60% of maize. They considered parameters such as altitude above sea level, annual precipitation, arable land within a farm, number of cows, stocking rate, average lactation yield, breeds and, of course, feeding and livestock-keeping regimes. The model considered dietary contributions of C3 and C4 plants, contribution of concentrates, altitude, seasonal variation in 12/13CO2, Suess's effect, and diet-milk discrimination. In addition, Osorio et al. (Reference Osorio, Koidis and Papademas2015) detected Li, Ca, Mn, Zn, and Sr at significantly different concentrations according to the production areas of goat milk in Cyprus. The higher concentrations of some of the minerals could be explained by the different diets (primarily different types of grazing plants). In more detail, the mean concentrations of 17 major and trace elements have been found to show significant differences between different plants due to a variety of environmental, biological and agronomical parameters. Goats from Paphos graze for prolonged periods of the year outdoors. Regarding geographical location, wide plant diversity exists in the highlands of Paphos (Osorio et al., Reference Osorio, Koidis and Papademas2015).
Another very interesting study of Zacometti et al. (Reference Zacometti, Tata, Massaro, Riuzzi, Bragolusi, Cozzi, Piro, Khazzar, Gerardi, Gottardo and Segato2023) measured volatile organic compounds (VOCs) in cow milk over two production seasons (winter and summer). They tested three indoor food systems (silage, silage/forage and dried forage). FTIR was used to determine protein, casein, fat, lactose, urea, pH and others, and VOCs were extracted by applying headspace coupled to solid-phase microextraction (HS-SPME) and measured on a GC-FID. The milk from the two ensiled feeding methods showed reduced protein and casein levels compared to milk from dried forage. The transition from winter to summer influenced milk composition across all feeding systems, resulting in decreased protein, casein and fat levels in summer milk. Furthermore, summer milk exhibited notably higher pH and urea values compared to winter milk. Moreover, a notable seasonal impact on the volatile organic compound (VOC) profile of milk was observed independent of the feeding system. Winter milk exhibited elevated levels of carboxylic acids, whereas summer milk showed enrichment in 2-pentanol and reduced presence of methyl ketones. Specific branched aldehydes played a crucial role in distinguishing the VOC profiles of summer milks.
The above results indicate that differences in several milk constituents due to different feeding regimes could be reflected in spectral data obtained by FTIR. These could be used either to elucidate the possible differences in spectral data or serve as supplementary analysis in distinguishing animal feeding regimes. Nevertheless, it should clearly be mentioned that in order to fully test the above hypothesis a much more robust model is needed to be built. Therefore, a more complex sampling set must be designed including samples from different animal species/breeds, seasons, geographical regions and lactation stages.
In conclusion, we focused on spectral data obtained by FTIR in the range of 4000–400 cm−1 in freeze-dried milk samples. Existing knowledge on the detection of markers in milk, mainly terpenes and antioxidants as well as fatty acids (present in milk and directly affected by plant-based feeding regimes) was utilized. The generated chemometric model gave a 95.4% success rate of correct classification of the samples in terms of animal nutrition (free-range vs. intensive indoor). Future determinations of unknown samples can easily occur based on the model depicted here. In order to make the model more robust, larger sample sets would be needed. Our findings are promising in determining characteristics and important markers in Cyprus goat milk with a main target to secure product quality and authenticity.
Acknowledgements
The research was supported by the INNOVOUCHER/1022/0063 funded by the Research and Innovation Foundation (RIF), Cyprus. Special thanks to J. Fkiaras of Mersini Goat Farm for providing milk samples and valuable information regarding the flora of the grazing area.


 Open access