


1. Introduction
Empirical evidence suggests that buyers value livestock based on animal traits and value-added management practices (Rogers et al., Reference Rogers, Schroeder, Tonsor and Coffey2023; Schroeder, Coffey and Tonsor, Reference Schroeder, Coffey and Tonsor2023). Desirable cattle traits are associated with price premiums, while inferior features are discounted in the market. Hedonic analysis is the standard approach for unraveling the role that attribute variations play on the price of heterogeneous goods such as cattle auction prices (Rogers et al., Reference Rogers, Schroeder, Tonsor and Coffey2023).
Sale prices are assumed to be a function of the characteristics of the product (Rosen, Reference Rosen1974). Hence, price variations are attributed to heterogeneous combinations of attribute levels. An intuitive, but largely ignored, application of hedonic price analysis to cattle marketing is to use the underlying price function to estimate cattle market efficiencies. Efficiency, in this context, represents the divergence between the observed sale price and its corresponding maximum feasible value. By contrasting existing attributes with their best possible combination, producers selling their animals can directly quantify potential price increases and identify the management practices necessary to attain the highest feasible prices.Footnote 1
Despite the popularity of hedonic analysis, little is known about the proportion of cattle transactions that fetch the best price possible, and the discounts received by producers for not bringing to market animals with the most desirable combination of feasible attributes. The main objectives of this paper are to assess the relative price efficiency of the cattle market, and to identify viable changes to current management practices that could result in higher prices and profit margins.
Prior work has concentrated on understanding the fundamental structure of cattle prices (Calil et al., Reference Calil, Ribera, Anderson and Koury Filho2022; Coatney, Menkhaus, and Schmitz, Reference Coatney, Menkhaus and Schmitz1996; Mathews et al., Reference Mathews, Anderson, Capps and Sawyer2007; Schroeder et al., Reference Schroeder, Mintert, Brazle and Grunewald1988; Schulz et al., Reference Schulz, Dhuyvetter and Doran2015; Zimmerman et al., Reference Zimmerman, Schroeder, Dhuyvetter, Olson, Stokka, Seeger and Grotelueschen2012). Limited empirical and theoretical studies have quantified the magnitude of actual cattle market efficiencies (Verteramo Chiu, Tauer, and Gröhn, Reference Verteramo Chiu, Tauer and Gröhn2022). Therefore, current price analysis focuses on identifying the effect of animal characteristics on cattle sale prices, and not on how to quantify and improve the efficiency of the market. Additionally, preceding efforts have omitted the associated costs of altering the array of observed attributes, resulting in potential cost-ineffective marketing propositions.
This study represents one of the first to evaluate the effect of cattle attributes on price and profit efficiencies. We introduce a nonparametric benchmarking framework to identify the optimal array of cattle characteristics and related adjustments based on peer comparisons. Results provide a clear depiction of the efficiency of the cattle market and a set of feasible and tailored interventions to improve it. The proposed methods are used to analyze cattle auction prices in Texas. However, the methods can naturally be adapted to other cattle-producing regions or to analyze the market efficiency of a wide range of heterogeneous products. The evaluation framework is extended by incorporating the cost of production as a function of cattle characteristics. Hence, compared to previous work, transaction efficiencies are evaluated at both the price and profit levels.
In the next sections, we contrast the parametric and non-parametric approaches used in the estimation of hedonic price frontiers, present our benchmarking framework to assess both the price and profit market efficiencies, describe the data collection process, and the endogenous and exogenous factors considered in the analysis. We conclude by presenting the distribution of market efficiencies and suggested data-driven marketing implications.
2. Hedonic price frontier
Lucas (Reference Lucas1975) derived the concept of a hedonic price frontier based upon the outcomes of the utility maximization theory for heterogeneous goods proposed by Lancaster (Reference Lancaster1966). This frontier represents the optimal attainable price given a set of technical and resource constraints. Deviations from the price frontier or price inefficiencies are conceived as valuation discrepancies between buyers and sellers caused by diverse tastes and technologies (Rosen, Reference Rosen2002) and imperfect market information (Kumbhakar and Parmeter, Reference Kumbhakar and Parmeter2010). Therefore, the highest possible price achievable is a function of both the attributes of the product and the heterogeneity of agents. There is no universal maximum benchmark price. Instead, each transaction is compared to a unique target price associated with a comparable set of attributes. In practice, a relative degree of efficiency is estimated by controlling for observable product characteristics and market factors.
Price inefficiencies can be formulated and estimated using parametric and nonparametric methods. Price efficiency in the context of this study refers to the technical efficiency of heterogeneous goods and not to the capital efficiency stated by the efficient market hypothesis (Malkiel, Reference Malkiel1989). Most parametric empirical applications rely on a stochastic frontier approach and nonparametric applications are based on Data Envelopment Analysis (DEA) efficiency principles. Under the parametric specification, the hedonic price frontier consists of a deterministic aggregated effect given by the observed attributes plus inherent individual random disturbances, which indicate the degree of inefficiency (Arrondo, Garcia, and Gonzalez, Reference Arrondo, Garcia and Gonzalez2018; Bonanno et al., Reference Bonanno, Bimbo, Costanigro, Lansink and Viscecchia2019; Kumbhakar and Parmeter, Reference Kumbhakar and Parmeter2010; Samaha and Kamura, Reference Samaha and Kamura2008; Seifert, Kahle, and Hüttel, Reference Seifert, Kahle and Hüttel2020). In this case, price inefficiencies represent expected losses for sellers and added costs for buyers due to lack of adequate market information (Verteramo Chiu, Tauer, and Gröhn, Reference Verteramo Chiu, Tauer and Gröhn2022). A practical limitation of the stochastic frontier approach to identify value-added management practices is that price efficiency and potential price improvements are measured relative to the original array of characteristics. Namely, the parametric hedonic price frontier analysis identifies the best feasible price given a set of predefined attributes and it provides no specific recommendations in terms of feasible changes to the original attribute levels. Using the estimated marginal price effects to derive viable adjustments to existing attributes may be problematic because the deterministic component of the price frontier does not account for potential unobserved, exogenous factors that prevent the realization of specific combinations of the characteristics. While the representativeness of the sample helps to identify the space of feasible attributes, it may still not be possible to assemble or even observe an array of all premium-yielding attributes. In general, parametric price efficiencies evaluate the marketing ability of buyers and sellers to market a product with a given set of attributes, and the resulting technical and managerial recommendations may not be widely applicable.
On the other hand, by using a data-driven approach, viable and observable peer comparisons can be performed. The nonparametric approach seeks to assess individual price efficiencies by comparing actual prices and product characteristics to a piecewise price frontier of comparable transactions. As a result, specific changes to current attribute levels needed to reach the price frontier are derived and the magnitude of the potential price adjustment is estimated. Nonparametric price inefficiencies incorporate both the deficient selection of product attributes and agent heterogeneity. Different DEA model specifications have been proposed to analyze market inefficiencies (Chumpitaz et al., Reference Chumpitaz, Kerstens, Paparoidamis and Staat2010; Fernandez-Castro and Smith, Reference Fernandez-Castro and Smith2002; Førsund and Zanola, Reference Førsund and Zanola2006; González, Arrondo, and Carcaba, Reference González, Arrondo and Carcaba2017; González, Carcaba, and Ventura, Reference González, Carcaba and Ventura2015; Kamakura, Ratchford, and Agrawal, Reference Kamakura, Ratchford and Agrawal1988 ; Lakhdar et al., Reference Lakhdar, leleu, Vaillant and Wolff2009; Lee et al., Reference Lee, Repkine, Hwang and Kim2004; Lee, Hwang, and Kim, Reference Lee, Hwang and Kim2005; Lins, Novaes, and Legey, Reference Lins, Novaes and Legey2005; Oh, Lee, and Hwang, Reference Oh, Lee, Hwang and Heshmati2010; Ward, Reference Ward2015; Wolff, Reference Wolff2016). A general drawback of the nonparametric approach is that it implicitly assumes that all unobserved factors that affect price are controllable. Thus, even after controlling for observed exogenous market factors or agent heterogeneity, the remaining differences in price of seemingly comparable goods are attributed to avoidable inefficient marketing practices (caused by the lack of proper market information) and are penalized with lower efficiency scores.
Compared to the typical production input-output settings and existing quality-price frontiers analyzed in DEA, we propose a unique set of optimization constraints to accommodate a broad range of cattle attribute variations. Additionally, to the best of our knowledge, very few studies have estimated hedonic price frontiers for heterogeneous, agriculture-related products such as cattle (Verteramo Chiu, Tauer, and Gröhn, Reference Verteramo Chiu, Tauer and Gröhn2022), wine (Fried and Tauer, Reference Fried and Tauer2019), yogurt (Bonanno et al., Reference Bonanno, Bimbo, Costanigro, Lansink and Viscecchia2019), and farmland (Seifert, Kahle, and Hüttel, Reference Seifert, Kahle and Hüttel2020), and none of them have analyzed sales efficiencies using nonparametric price frontier methods. Furthermore, the cost-benefit of modifying the actual set of attributes for more desired and feasible ones has not been addressed in the existing price efficiency literature.
The proposed nonparametric price efficiency analysis is also envisioned to complement the standard hedonic regression analysis (and stochastic frontier models) to examine cattle prices. While hedonic regression focuses on understanding the role of livestock characteristics on the sale price, the proposed price analysis concentrates on assessing the degree of efficiency of a market. However, both methods can be used together to derive valid management and marketing recommendations to improve sales performance. In hedonic price analysis, the underlying relationship between attributes and prices is commonly modeled using a linear functional form. Misspecification of the true model could affect the validity of the estimated coefficients or marginal effects to identify attributes associated with price premiums. On the other hand, the proposed price efficiency analysis does not impose an a priori structure on the relationship between sales prices and animal characteristics. In fact, this association is estimated for each animal under evaluation based on actual recorded transactions. The data-driven alterations identified in the price efficiency analysis to transform inefficient animals into efficient ones can be used to validate the selection of the functional form used in the price hedonic analysis and to define the domain of feasible and economically viable interventions.
3. Price efficiency
The proposed efficiency analysis assumes that a higher price could be achieved by modifying some of the characteristics of the animal. Particularly, the sale price (p) is conceived as a function of the characteristics of the product ( Z ) (Rosen, Reference Rosen1974):
 $$p=f(\boldsymbol{Z}).$$
The nature of cattle attributes must be considered to make valid inferences about the efficiency of the observed transactions. For instance, some cattle attributes can be modified through appropriate management practices, while others are out of the control of farmers and are considered given. Observed characteristics are also divided into continuous and discrete attributes. Hence, the array of animal attributes ( Z ) consists of m continuous controllable characteristics ( z a ), k continuous non-controllable characteristics ( z b ), h discrete controllable attributes ( z c ), and q discrete non-controllable attributes ( z d ).
A higher price and, thus, a higher efficiency can be achieved by allowing the original controllable attributes to vary within a feasible range for continuous characteristics or take an alternative level for categorical attributes. On the other hand, uncontrollable factors can condition the price received by producers. For example, animals with equal or comparable characteristics could be sold at different prices based on the relative level of certain exogenous characteristics such as prevailing livestock and feedstuff market prices. Additionally, some cattle attributes such as hide color or breed cannot be changed in the short-run and should be viewed as non-controllable characteristics.
Fixed continuous characteristics are further classified into k′ price-advantageous factors and k − k′ price-unfavorable factors to account for the fact that incremental changes in some exogenous characteristics support higher prices, while others are associated with lower prices. In the case of categorical characteristics (i.e.,
z
c
and
z
d
), each of the S
j
attribute levels are transformed into an indicator variable $v_{ij}^{s}$
, so that
$v_{ij}^{s}$
, so that $v_{ij}^{s}$
= 1 if the jth attribute for the ith observation takes the sth level, and
$v_{ij}^{s}$
= 1 if the jth attribute for the ith observation takes the sth level, and $v_{ij}^{s}$
= 0 otherwise.
$v_{ij}^{s}$
= 0 otherwise.
A DEA framework is proposed to assess the relative efficiency of cattle auction sales, in which price efficiency is defined as:
 $$\varepsilon ={f(\boldsymbol{Z}) \over f(\boldsymbol{Z}^{{\bf *}})},$$
where ${\bf Z}^{\boldsymbol{*}}$
is the optimal array of attributes and f(
${\bf Z}^{\boldsymbol{*}}$
is the optimal array of attributes and f( ${\bf Z}^{\boldsymbol{*}}$
) = p* is the corresponding projected sale price of an animal with
${\bf Z}^{\boldsymbol{*}}$
) = p* is the corresponding projected sale price of an animal with ${\bf Z}^{\boldsymbol{*}}$
attributes. The highest achievable price and resulting price efficiency is found by identifying the optimal feasible combination of cattle characteristics among peer transactions. Note that maximizing the potential price in equation (2) is equivalent to minimizing ϵ. Given a sample of N observed prices and corresponding cattle attribute arrays, the relative price efficiency of the i
0th transaction {p
i
0
,
Z
i
0
} and its optimal combination of attributes are obtained by solving the following mixed-integer mathematical linear programming problem:
${\bf Z}^{\boldsymbol{*}}$
attributes. The highest achievable price and resulting price efficiency is found by identifying the optimal feasible combination of cattle characteristics among peer transactions. Note that maximizing the potential price in equation (2) is equivalent to minimizing ϵ. Given a sample of N observed prices and corresponding cattle attribute arrays, the relative price efficiency of the i
0th transaction {p
i
0
,
Z
i
0
} and its optimal combination of attributes are obtained by solving the following mixed-integer mathematical linear programming problem:
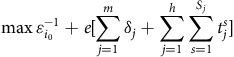 $$\max \varepsilon _{i_{0}}^{-1}+e[\sum _{j=1}^{m}\delta _{j}+\sum _{j=1}^{h}\sum _{s=1}^{S_{j}}t_{j}^{s}]$$
subject to:
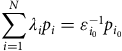 $$\sum _{i=1}^{N}\lambda _{i}p_{i}=\varepsilon _{i_{0}}^{-1}p_{{i_{0}}}$$
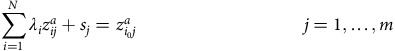 $$\sum _{i=1}^{N}\lambda _{i}z_{ij}^{a}+s_{j}=z_{i_{0}j}^{a} \quad\quad\quad\quad\quad\quad\quad\quad\,\quad j=1,\ldots, m$$
 $$s_{j}+2d_{j}\omega _{j}^{U}\geq \delta _{j} \quad\quad\quad\quad\quad\quad\quad\quad\quad\quad\, j=1,\ldots, m$$
 $${s}_{{j}}+2({d}_{{j}}-1)\omega _{{j}}^{{L}}\leq -\delta _{{j}} \quad\quad\quad\quad\quad\quad\quad {j}=1,\ldots, {m}$$
 $${s}_{{j}}\leq \delta _{{j}} \quad\quad\quad\quad\quad\quad\quad\quad\quad\quad\quad\quad\quad\;\;\; {j}=1,\ldots, {m}$$
 $$-{s}_{{j}}\leq \delta _{{j}} \quad\quad\quad\quad\quad\quad\quad\quad\quad\quad\quad\quad\quad {j}=1,\ldots, {m}$$
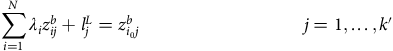 $$\sum _{{i}=1}^{{N}}\lambda _{{i}}{z}_{{ij}}^{{b}}+{l}_{{j}}^{{L}}={z}_{{i}_{0}{j}}^{{b}} \quad\quad\quad\quad\quad\quad\quad\quad\quad {j}=1,\ldots, {k'}$$
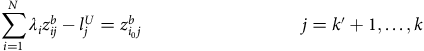 $$\sum _{{i}=1}^{{N}}\lambda _{{i}}{z}_{{ij}}^{{b}}-{l}_{{j}}^{{U}}={z}_{{i}_{0}{j}}^{{b}} \quad\quad\quad\quad\quad\quad\quad\quad\;\;\;{j}={k'}+1,\ldots, {k}\!\!\!\!\!\!\!\!\!\!$$
 $$\sum _{{i}=1}^{{N}}\lambda _{{i}}(1-{v}_{{i}_{0}{j}}^{{s}}){v}_{{ij}}^{{s}}-{t}_{{j}}^{{s}}=0 \quad\quad\quad\quad\quad\;\;\;\;{s}=1,\ldots, {S}_{{j}}\colon {j}=1,\ldots, {h}\!\!\!\!\!\!\!\!\!\!\!\!\!\!\!\!\!\!\!\!\!\!\!\!\!\!\!\!$$
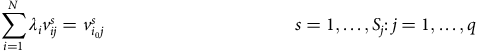 $$\sum _{{i}=1}^{{N}}\lambda _{{i}}{v}_{{ij}}^{{s}}={v}_{{i}_{0}{j}}^{{s}} \;\;\;\;\;\;\;\;\;\;\;\;\;\;\;\;\;\;\;\;\;\;\;\;\;\;\;\;\;\;\,\;\;\;\;\;\;\;{s}=1,\ldots, {S}_{{j}}\colon {j}=1,\ldots, {q}\!\!\!\!\!\!\!\!\!\!\!\!\!\!\!\!\!\!\!\!\!\!\!\!\!\!\!\!$$
 $$\sum _{{i}=1}^{{N}}\lambda _{{i}}=1$$
 $${s}_{{j}}\in [-\omega _{{j}}^{{L}}, \omega _{{j}}^{{U}}] ; \delta _{{j}},\; \omega _{{j}}^{{U}},\; \omega _{{j}}^{{L}}, \;{l}_{{j}}^{{U}},\;{l}_{{j}}^{{L}},\;\lambda _{{i}},\;\varepsilon _{0}\geq 0,$$
where d
j
and $t_{j}^{s}$
are 0-1 integers;
$t_{j}^{s}$
are 0-1 integers; $w_{j}^{U}$
and
$w_{j}^{U}$
and $w_{j}^{L}$
are the maximum permitted increase and decrease of the jth continuous controllable attribute, respectively; and e is a small positive number, typically set to be 10−6. Hereafter, asterisks denote the optimal level of the model parameters.
$w_{j}^{L}$
are the maximum permitted increase and decrease of the jth continuous controllable attribute, respectively; and e is a small positive number, typically set to be 10−6. Hereafter, asterisks denote the optimal level of the model parameters.
Decision variables δ
j
and $t_{j}^{s}$
are included in the objective function (3) to identify potential price efficiency gains associated with modifying the set of controllable attributes. Note that the benchmarking model is formulated to find the optimal, feasible, convex linear combination of observed attributes (5a–9) that results in the highest possible price (4). The best possible combination of the reference set (i.e., observations which
$t_{j}^{s}$
are included in the objective function (3) to identify potential price efficiency gains associated with modifying the set of controllable attributes. Note that the benchmarking model is formulated to find the optimal, feasible, convex linear combination of observed attributes (5a–9) that results in the highest possible price (4). The best possible combination of the reference set (i.e., observations which $\lambda_{i}^{*}$
> 0) is referred to as the Composite Efficient Unit (CEU). Specific restrictions are considered to form the CEU for each inefficient transaction. Particularly, the set of constraints in (5b–e) limits the magnitude of the change the jth continuous controllable characteristic can undergo (i.e., s
j
in 5a), so that its optimal level
$\lambda_{i}^{*}$
> 0) is referred to as the Composite Efficient Unit (CEU). Specific restrictions are considered to form the CEU for each inefficient transaction. Particularly, the set of constraints in (5b–e) limits the magnitude of the change the jth continuous controllable characteristic can undergo (i.e., s
j
in 5a), so that its optimal level $z_{i_{0}j}^{a*}=\sum _{i=1}^{N}\lambda _{i}^{*}z_{ij}^{a}$
is enclosed by [
$z_{i_{0}j}^{a*}=\sum _{i=1}^{N}\lambda _{i}^{*}z_{ij}^{a}$
is enclosed by [ $z_{i_{0}j}^{a}$
−
$z_{i_{0}j}^{a}$
− $w_{j}^{L}$
,
$w_{j}^{L}$
, $z_{i_{0}j}^{a}$
+
$z_{i_{0}j}^{a}$
+ $w_{j}^{U}$
]. Similarly, constraints (6a–b) assure that the resulting CEU has the same or worse level for all exogenously fixed continuous conditions. Hence, the CEU represents a potential transaction traded under equal or less favorable exogenous conditions. Alternatively, the
$w_{j}^{U}$
]. Similarly, constraints (6a–b) assure that the resulting CEU has the same or worse level for all exogenously fixed continuous conditions. Hence, the CEU represents a potential transaction traded under equal or less favorable exogenous conditions. Alternatively, the $\lambda_{i}$
’s can be set as 0-1 integers to relax the convexity assumption, limiting the CEU to a single observed transaction.
$\lambda_{i}$
’s can be set as 0-1 integers to relax the convexity assumption, limiting the CEU to a single observed transaction.
In terms of discrete attributes, because the relative weights assigned to each observation add up to 1 (9), guarantees that the resulting optimal category level v
i
0
j
s* be the same across all observations in the reference set. Particularly, the variable $t_{j}^{s}$
in (7) takes the value of 1 if the original level for the jth discrete controllable characteristic is substituted by the sth alternative option. Conversely,
$t_{j}^{s}$
in (7) takes the value of 1 if the original level for the jth discrete controllable characteristic is substituted by the sth alternative option. Conversely, $t_{j}^{s}$
= 0 if the original level remains the best option or if the optimal level is different from the sth level. In the case of fixed categorical characteristics, the final attribute level remains at its original level (v
i
0
j
s
) for all the noncontrollable characteristics considered (8). Therefore, only transactions with the same noncontrollable discrete attributes are considered in the reference set. Alternative set of constraints for ordinal categorical variables have been proposed by Banker and Morey (Reference Banker and Morey1986) and Kamakura (Reference Kamakura1988).
$t_{j}^{s}$
= 0 if the original level remains the best option or if the optimal level is different from the sth level. In the case of fixed categorical characteristics, the final attribute level remains at its original level (v
i
0
j
s
) for all the noncontrollable characteristics considered (8). Therefore, only transactions with the same noncontrollable discrete attributes are considered in the reference set. Alternative set of constraints for ordinal categorical variables have been proposed by Banker and Morey (Reference Banker and Morey1986) and Kamakura (Reference Kamakura1988).
In the short run, the heterogeneity of agents can limit the set of achievable prices if technical barriers prevent sellers from reaching certain sectors of the market. Specific market circumstances can be incorporated into the proposed price efficiency framework by conditioning the estimated price efficiencies on observable characteristics of buyers and sellers. Similar to the treatment of animal attributes and market conditions (constraints 5a–8), it is possible to control for exogenous and endogenous characteristics of agents when the maximum feasible reference price is identified. Therefore, peer comparisons can be restricted to sellers or buyers with similar observable features.
4. Profit efficiency
The price efficiency framework discussed above does not consider the inherent changes in costs associated with adjusting some of the endogenous characteristics. For some heterogeneous goods, the cost of production (c i ) is similar among the different presentations of the product, and differences in attributes are mainly driven by marketing or esthetic reasons. In the case of cattle, modifying the array of attributes could also result in substantial cost differences, which can affect profit margins and efficiency. Similar to prices, profit efficiency represents the ratio between observed profits and the maximum attainable profit level.
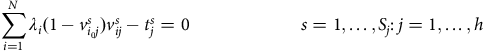
Compared to observed prices that tend to be positive, estimated profits (i.e., π i = p i − c i ) can take both negative and positive values. Hence, the profit efficiency of the i 0th recorded transaction is represented as:
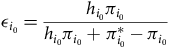 $$\epsilon _{{i_{0}}}={h_{{i_{0}}}\pi _{{i_{0}}} \over h_{{i_{0}}}\pi _{{i_{0}}}+\pi _{i_{0}}^{*}-\pi _{{i_{0}}}}$$
to account for efficiency improvements on the negative range of profits. In (11), the observed profit of the i
0th transaction is denoted by π
i
0
, h
i
0
= 1 if π
i
0
≥ 0, and equal to −1 otherwise, and $\pi_{i_{0}}^{*}$
is the maximum achievable profit obtained by modifying the attributes of the i
0th animal. Like the highest achievable price,
$\pi_{i_{0}}^{*}$
is the maximum achievable profit obtained by modifying the attributes of the i
0th animal. Like the highest achievable price, $\pi_{i_{0}}^{*}$
represents a convex linear combination of recorded transactions (i.e.,
$\pi_{i_{0}}^{*}$
represents a convex linear combination of recorded transactions (i.e., $\sum _{i=1}^{N}\lambda _{i}\pi _{i}$
). The profit associated with each transaction was calculated as the difference between the sale price and the estimated cost of the animal, which is a function of its characteristics (13). Optimal levels of endogenous attributes are identified by combining animals comparable to the reference transaction in terms of non-controllable characteristics and sold under similar market conditions.
$\sum _{i=1}^{N}\lambda _{i}\pi _{i}$
). The profit associated with each transaction was calculated as the difference between the sale price and the estimated cost of the animal, which is a function of its characteristics (13). Optimal levels of endogenous attributes are identified by combining animals comparable to the reference transaction in terms of non-controllable characteristics and sold under similar market conditions.
The linear programming formulation in (3) –(10) is modified to account for profit differentials. Specifically, the price efficiency constraint (4) is replaced by a constraint of the formFootnote 2 :
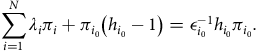 $$\sum _{i=1}^{N}\lambda _{i}\pi _{i}+\pi _{{i_{0}}}\left(h_{{i_{0}}}-1\right)=\epsilon _{i_{0}}^{-1}h_{{i_{0}}}\pi _{{i_{0}}}.$$
Also, $\epsilon_{i_{0}}^{-1}$
replaces
$\epsilon_{i_{0}}^{-1}$
replaces $\varepsilon_{i_{0}}^{-1}$
in the original objective function (3) to be maximized.
$\varepsilon_{i_{0}}^{-1}$
in the original objective function (3) to be maximized.
Alternatively, an additional cost constraint could be added to the price efficiency formulation to seek for potential price increments given a maximum production cost level (e.g., original observed cost). However, this formulation is more restrictive in the sense that the search space is limited only to CEUs with equal or higher selling prices and the same or lower production costs, excluding potential profit gains associated with relatively higher prices and costs.
Overall, the efficiency concepts, principles, and motivations considered in this study in the context of the cattle industry are also pertinent for other heterogeneous products. For instance, sellers of these differentiated products are expected to have common goals, such as improving their revenues and profit margins by better aligning their offering with buyers’ valuations. Therefore, we consider that, in general, the proposed efficiency evaluation framework can be applied to other products and industries. Special attention should be paid to incorporating relevant supply and demand factors into the efficiency analysis to adequately represent the specific market context of each product under evaluation. Fortunately, the proposed price efficiency analysis is flexible enough to consider a wide range of considerations to make valid peer comparisons. Without losing the original scope of the analysis, the proposed objective functions and optimization constraints can be altered or replaced to model the effect of particular exogenous and endogenous factors on transaction efficiencies.
5. Data
The dataset used to analyze cattle price efficiencies consists of 6,087 individual sale transactionsFootnote 3 collected at 12 livestock auction facilities across Southeast Texas during 2014–2019. Cattle production is an important economic sector in the region with an estimated annual production value of $2,162 million (Beck and Robinson, Reference Beck and Robinson2022). Surveyed livestock sale barns were classified into South (Alice, Bee, Jim Hogg, Live Oak, Start, and Uvalde counties) and East (Austin, Houston, Leon, Liberty, McLennan, and Navarro counties) locations based on the county in which they are located. These sale barns were surveyed based on regular operation dates, although not all functioned on the same schedule during the study. In some instances, data collection was paused due to operational limitations and the availability of local County Extension Agents, who collected the data. However, potential detrimental effects caused by disparities in the data entry are expected to be mitigated by the regional scope of the study, which provides greater uniformity in terms of prices, animals, intended uses, and market conditions across livestock sale barns.
Auctioned animals were randomly selected by Texas A&M AgriLife County Extension Agents during local sale events. To gather a representative sample, animals were chosen uniformly throughout the entire sale without implementing any stratified sampling approach (no specific animals or characteristics were targeted). A minimum of 30 transactions were recorded each auction day, which represented between 5% and 15% of the total number of animals commonly traded on each auction date. Though, on average, 55 animals were documented per sale date. Prior to the study, County Extension Agents participated in a training session to standardize the data collection process.
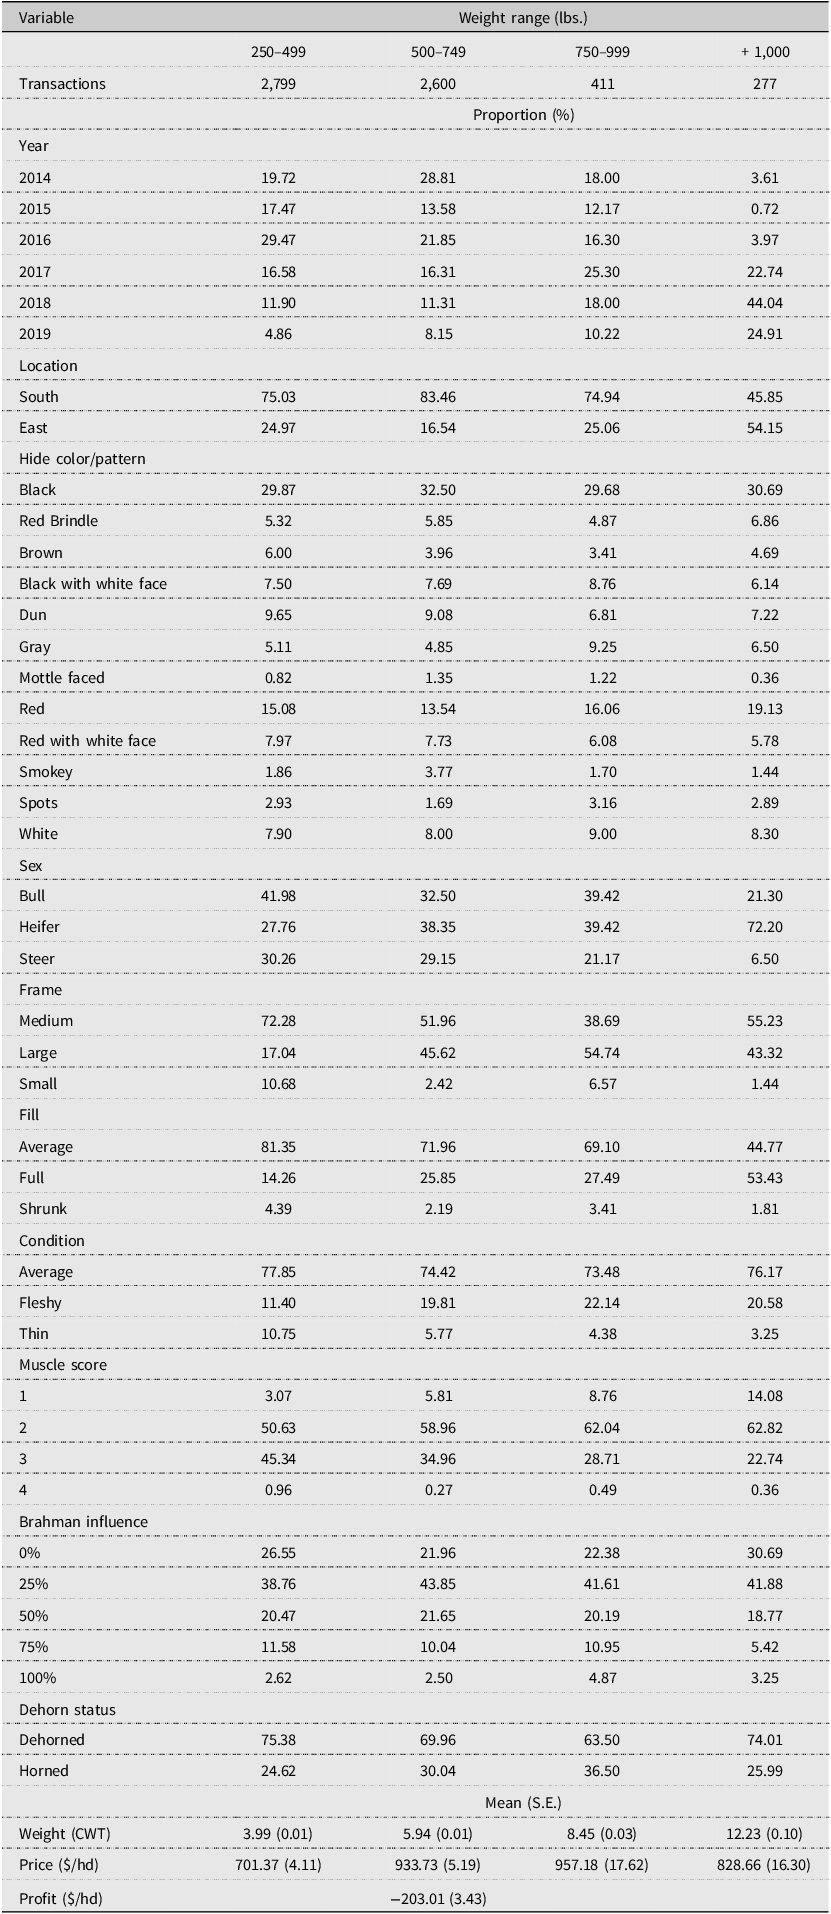
Gathered information included sale price and observable physical characteristics such as hide color or pattern, sex, frame size, fill, body condition, muscle score, Brahman influence, dehorn status, and weight. The sample used in the study is summarized in Table 1 and the cattle auction prices ($/CWT) recorded are presented in Figure 1. Sampled transactions were grouped into four weight categories: 250–499 lbs., 500–749 lbs., 750–999 lbs., and over 1,000 lbs. to represent different segments of the cattle supply chain. In the efficiency analysis, the reference set of each transaction considered only observations within its weight group. Schroeder et al. (Reference Schroeder, Mintert, Brazle and Grunewald1988) used a similar classification scheme based on the idea that demand-driven differences in the attributes of the animals are expected across weight ranges. Also, stratifying the observations by weight allowed us to compare sales efficiencies along the supply chain.
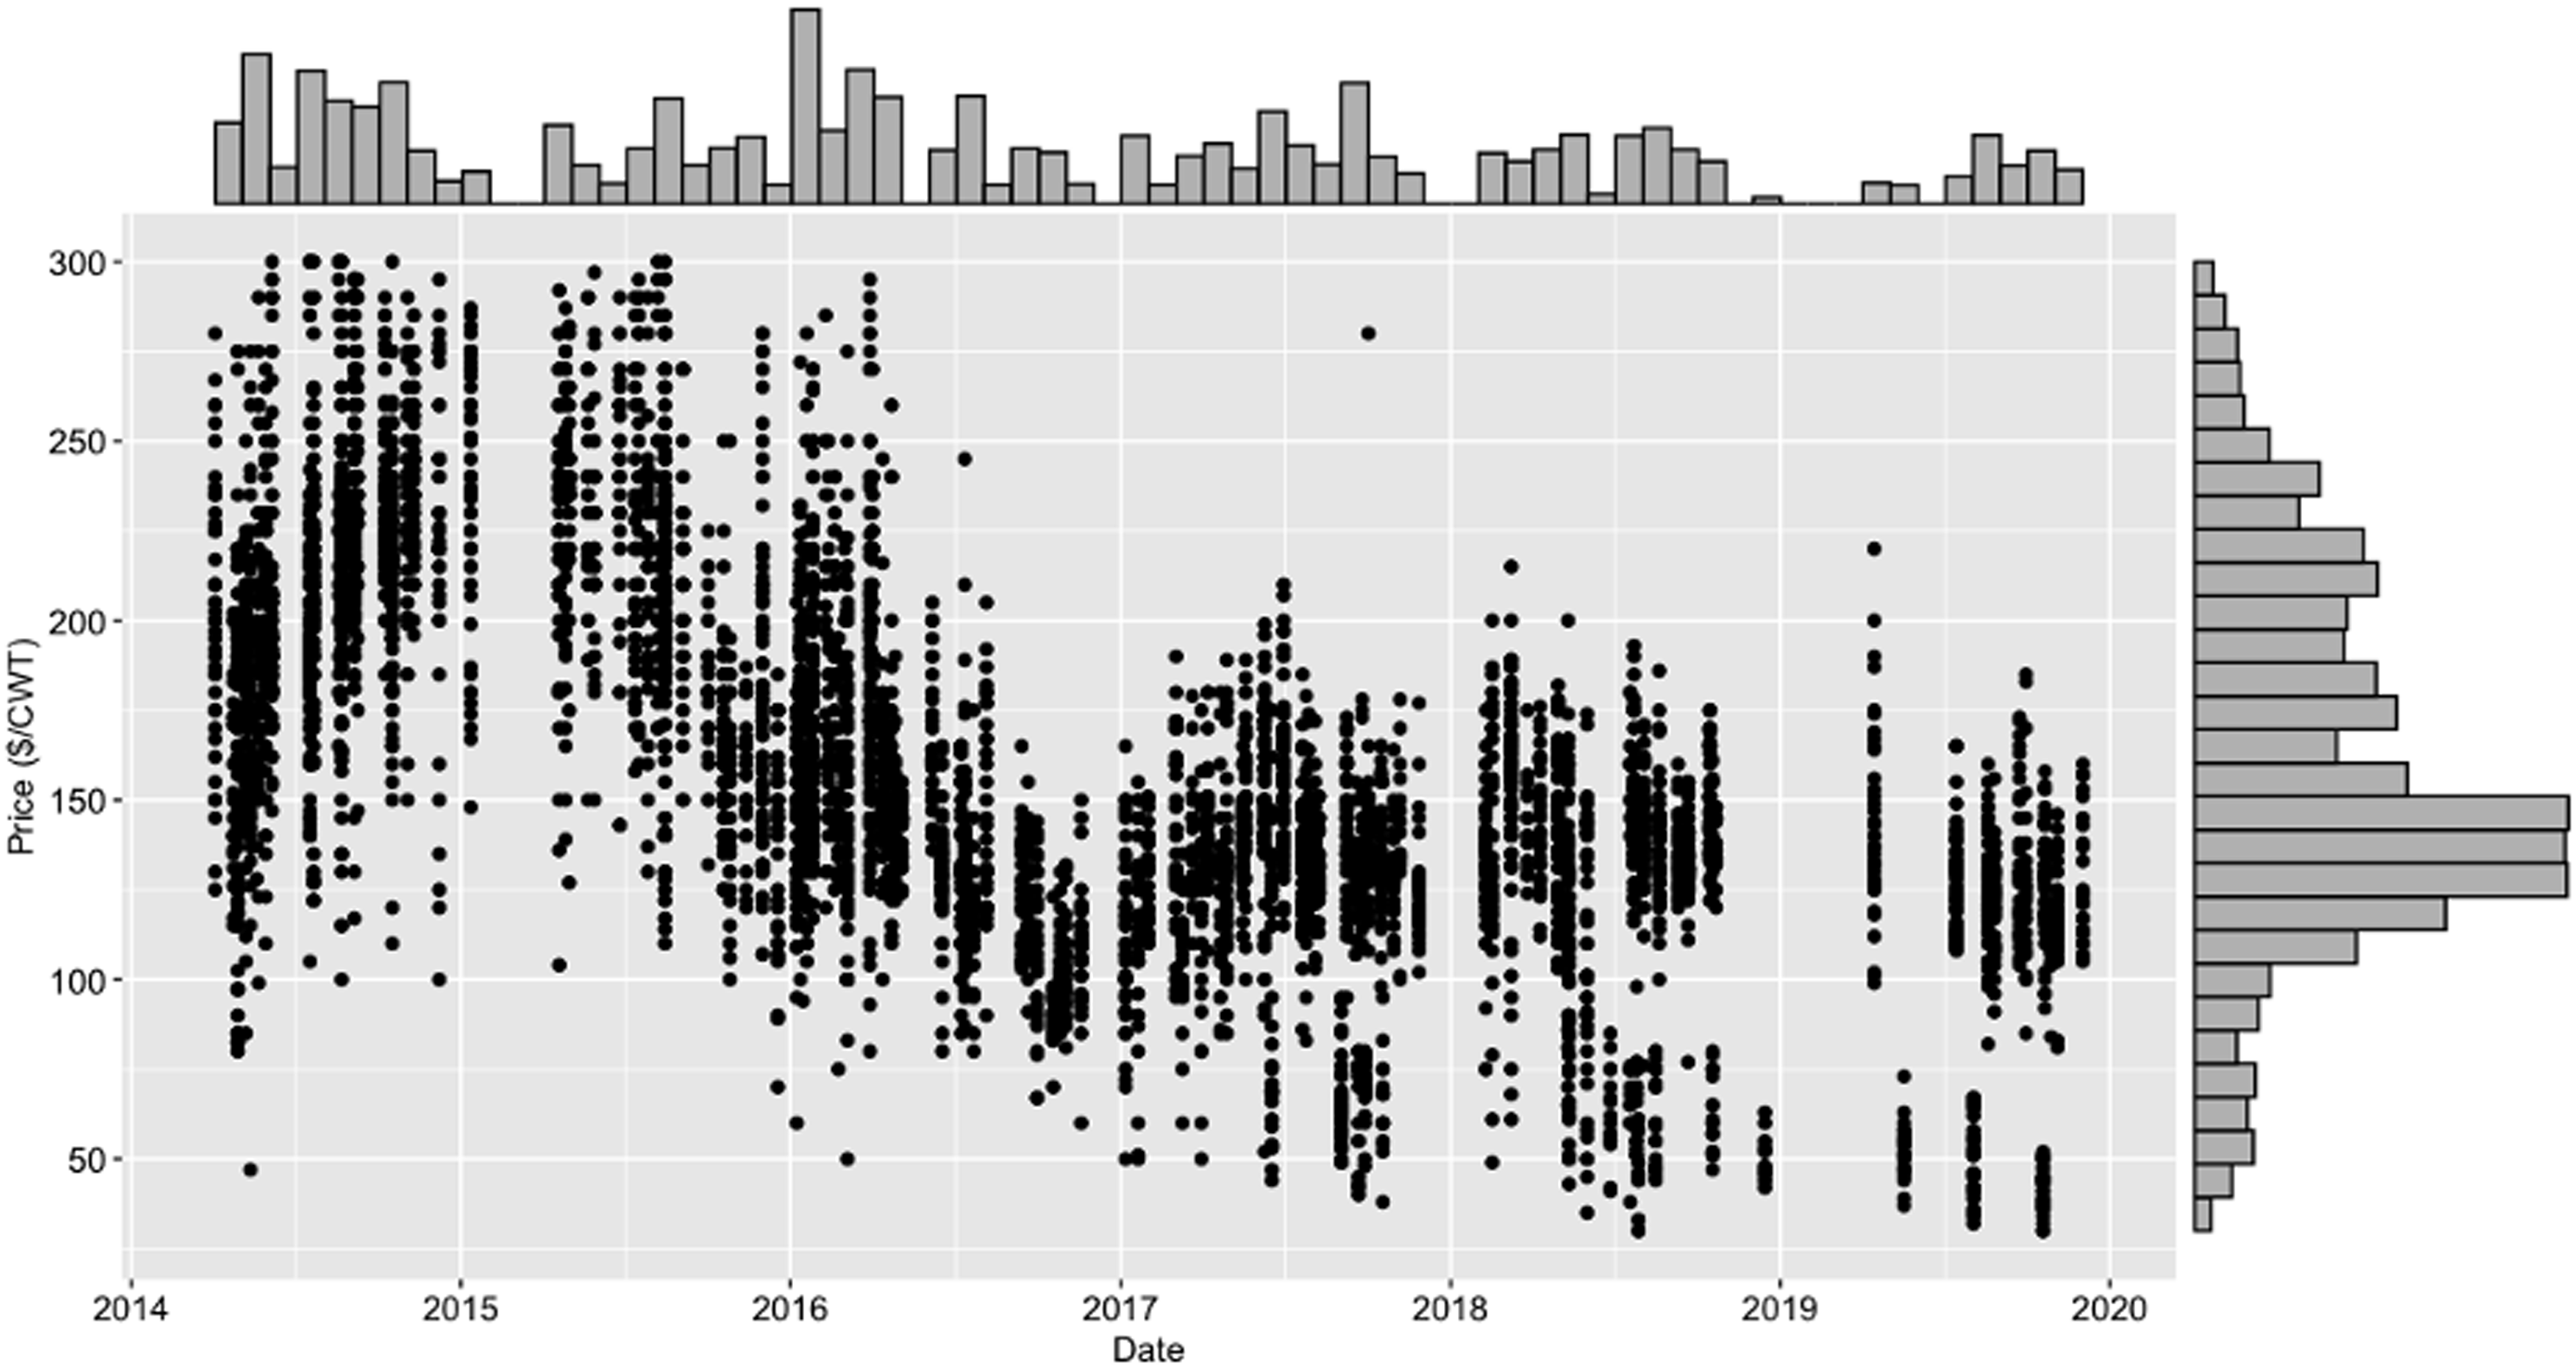
Figure 1. Recorded cattle auction prices ($/CWT).
Table 1. Summary statistics of recorded transactions
The characteristics of buyers and sellers were not recorded. However, relatively homogeneous buyers and sellers are expected given the high concentration of the U.S. cattle slaughter industry and the similarities among producers who auction their animals at small local sale barns in Southeast Texas. Therefore, agent heterogeneity is not expected to impose structural differences in sales prices. Furthermore, regardless of buyers’ valuation and intended use, the seller’s goal is the same: to achieve the highest possible return by bringing to market animals with the most desirable combination of feasible attributes. Since comparable animals were traded under similar conditions (e.g., location, market cattle prices, feedstuff costs, and same pool of buyers), the most efficient sellers are expected to be those who produced what buyers were looking for.
For analysis purposes, the continuous attribute weight at sale and the discrete characteristics fill, body condition, dehorn status and bull-steer binary sex categories were considered controllable attributes that could be adjusted before the auction. Although the magnitude of the change in weight can be restricted as described in constraints (5a–e), no bounds were imposed, and the optimal weight of the animal was permitted to vary within the corresponding weight range. On the other hand, market conditions, frame size, muscle score, Brahman influence, hide color, sex (i.e., heifer), and auction location were considered fixed attributes.
Livestock buyers incorporate both current and expected market conditions into their price bids (Peel et al., Reference Peel, Anderson, Anderson, Bastian, Brown, Koontz and Maples2020). Anecdotal evidence suggests that most local cattle feeders keep purchased animals for a period of up to 150 days. Therefore, expected market conditions during this period are incorporated into the efficiency analysis. Feeder cattle and corn futures prices served as a proxy for exogenous livestock market conditions during and after the auction days. Particularly, closing prices of the nearest futures contracts with an expiration date greater than 5 months from the day of the sale were recorded. Feeder cattle futures prices are intended to provide market insights about current and prospective cattle prices, while corn futures prices reflect overall feedstuff costs. A Pearson’s correlation coefficient of 0.27 was estimated between the prices of the futures contract used in the analysis. To remove the effect of external market factors, peer comparisons are intended to find higher prices or profits under the same or worse market conditions. Thus, from the cattle producer perspective (seller), higher livestock futures prices and lower feedstuff costs are considered beneficial market movements, and vice versa. Alternatively, most recent spot prices or the prices of the nearest futures contracts could be used to control for exogenous market effects. Additionally, the timing of the sale was assumed to be an endogenous decision of the sellers. In this sense, we consider that more efficient agents better understand the seasonality of livestock prices and use this information to choose when to trade their animals. Nonetheless, the futures prices in question follow the temporal market conditions associated with fluctuations in supply and demand. Therefore, we implicitly incorporated some of the seasonality of livestock prices into the analysis.
Recorded transactions in the 500–749 lbs. weight range were used to analyze profit-oriented efficiencies (Table 1). This is the common stocker cattle weight range in Texas. Regional stocker cattle enterprise budgets and existing literature about beef cattle feed conversion rates were compiled to estimate a cost function in terms of the physical characteristics of the animal. It was assumed that the unobserved, underlying cost of production of the ith animal is equal to:
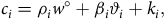 $$c_{i}=\rho _{i}w^{\circ}+\beta _{i}\vartheta _{i}+k_{i},$$
where ρi is the market price per unit of weight, w
∘ is an arbitrary initial weight of the animal, βi is the average daily grazing cost, ϑ
i
is the number of grazing days, and k
i
represents all other costs. Moreover, the grazing period $\vartheta _{i}={w_{i}-w^{\circ} \over \alpha _{i}}$
is a function of the initial base weight, sales weight (w
i
), and average daily gain (α
i
). It was further assumed that average daily gain, stocker value, grazing cost, and other production costs differ based on some of the characteristics of the animals (Table 2).
$\vartheta _{i}={w_{i}-w^{\circ} \over \alpha _{i}}$
is a function of the initial base weight, sales weight (w
i
), and average daily gain (α
i
). It was further assumed that average daily gain, stocker value, grazing cost, and other production costs differ based on some of the characteristics of the animals (Table 2).
Table 2. Cost function parameters

1 The baseline represents a steer, medium frame size, light color, average body condition, with horns and sold in 2019.
Baseline costs were calculated using Texas A&M AgriLife Extension (2019) livestock budgets for South Texas. This baseline represents the estimated local cost in 2019 of a light colored, horned steer with a medium frame and an average body condition. In the cost function, hide colors white, dun and gray were classified as light hide color, while all other recorded hide colors and patterns were considered dark hides. A regional average daily gain of 1.22 lbs. per day was considered (Texas A&M AgriLife Extension, 2019). Initial weight (w ∘) was set to 450 lb. for all animals in the profit efficiency analysis and the corresponding unit price was calculated using annual Texas cattle auction prices (USDA AMS, 2020). Additionally, based on Texas A&M AgriLife Extension (2019) stocker cattle production costs for South Texas, reference average grazing cost per head and other production costs were equal to $0.50/day and $253.58, respectively.
Baseline cost of production parameters were then adjusted to reflect expected variations caused by some cattle characteristics. It was assumed that average daily gain is affected by sex, frame size, hide color and body condition (Finch, Bennett, and Holmes, Reference Finch, Bennett and Holmes1984; Loy and Rouse, Reference Loy and Rouse1998; Ott, Reference Ott2016; Reuter et al., Reference Reuter, M.D.Childs, Belk, Machado and Biermacher2011). Similarly, the initial unit price paid for the animal is a function of its sex and the year that they were purchased (USDA AMS, 2020). Body condition also affects grazing costs due to different energy intake levels (Loy and Rouse, Reference Loy and Rouse1998), and dehorning an animal represents an additional cost (Thompson et al., Reference Thompson, Widmar, Schutz, Cole and Wolf2017). Year-to-year fluctuations in the average grazing cost and all other related costs were estimated using the Prices Paid Index for Commodities and Services, Interest, Taxes, and Farm Wage Rates (USDA ESMIS, 2020). Cost of production parameters associated with other attribute combinations different than the baseline array were calculated proportionally to the observed counterpart effects reported in the supporting literature. Potential attribute effect interactions, as well as indirect effects of modifying some characteristics, were omitted due to the lack of available primary and secondary data, which could lead to suboptimal decisions. In particular, per head and herd-based profit-maximizing decisions may differ if indirect costs are not considered in the per head analysis. For example, selling heavier animals means keeping them longer, which can be detrimental to the availability and quality of pasture in the following cycle. These induced effects can be added to the direct costs to represent the true marginal cost of modifying each attribute. The estimated cost differentials are presented in Table 2.
6. Results and discussion
6.1 Price efficiencies
Overall, 46.94% of the transactions recorded were price inefficient. Therefore, for about half of the auctioned animals, higher prices could be obtained by modifying some of the attributes of the animals before the sale day. Estimated price efficiency scores of the inefficient transactions ranged between 0.17 and 0.99, with a pooled mean of 0.83 and a standard deviation of 0.12. Price efficiency scores provide insights about the magnitude of potential price improvements. For instance, by bringing inefficient transactions to the price frontier we can identify the specific management interventions and estimate expected price gains for each animal. On average, the optimal array of attributes could yield 23.48% higher prices compared to the original set of cattle traitsFootnote 4 . Table 3 summaries the estimated price-inefficient transactions.
Table 3. Summary statistics of price-inefficient transactions by weight group
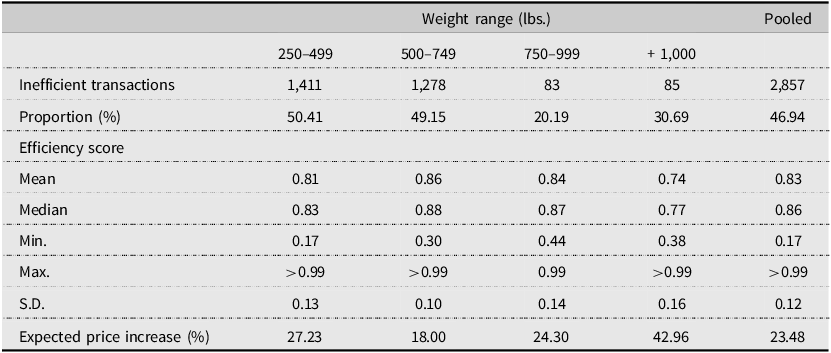
Price efficiencies were estimated and grouped by weight range. The highest percentage of inefficient transactions were observed in the 250–499 lbs. group (50.41%), followed by the 500–749 lbs. (49.15%), over 1,000 lbs. (30.69%), and 750–999 lbs. (20.19%) cohorts. Similarly, lowest mean and median efficiency scores were obtained for the 250–499 lbs. and 1,000 lbs. groups, reaching their maximum at intermediate weight ranges. The increasing proportion of price-inefficient transactions in lighter and heavier weight groups, as well as their lower efficiency scores, indicate the supply of more homogenous and desired animals at intermediate weight ranges.
Price efficiency scores also imply that different degrees of price improvements could be attained by modifying the existing characteristics of the animals. Particularly, inefficient transactions in the lighter group (250–499 lbs.), on average, could increase their sale price by 27.23%, inefficient animals in the 500–749 lbs. category by 18%, for those in the 750–999 lbs. group, their price could be improved by 24.30%, and 42.96% higher prices could be achieved for heavier inefficient animals.
The estimated distribution of cattle price efficiencies by weight group provides empirical support for a strategy used by many cattle producers of buying lightweight cattle at reduced prices, feeding them, and implementing an animal health program to improve their condition, then selling these animals at a heavier feeder cattle weight. This backgrounding system has become more important in overall cattle production (Close, Reference Close2019). Beyond per head value increases due to weight gains, these results document price efficiency gains in moving from lightweight to heavier weight feeder cattle.
6.2 Profit efficiency
The profit-oriented analysis was conducted only for the transactions in the 500–749 lbs. group. This is a common weight range for stocker cattle in the region with similar production practices that facilitate the recovery of its cost of production. Compared to the corresponding price-oriented results, a similar proportion of profit inefficient observations was found in this cohort, but profit inefficient sales tended to be further away from the efficient frontier. It was estimated that 50.23% of the cattle transactions analyzed were inefficient in terms of profits.
The mean and median efficiency of profit-inefficient transactions were both equal to 0.62. Profit efficiency scores had a wider range, stretching between 0.001 and 0.99 with a standard deviation of 0.22. Compared to potential price amendments, profits could be increased, on average, by 266.24% if feasible, cost-effective attribute changes are implemented. The magnitude of potential better profit margins correlates with the existence of relatively more inefficient transactions. When the top 5% and 1% of the profit-inefficient observations are excluded, potential profit improvements reduced to 74.30% and 103.04%, respectively.
While some animals sold at the various sale barns surveyed in this study are expected to undergo a standard preconditioning program, this information was not validated during the data collection process. Therefore, we may have overestimated profit margins, creating a potential bias in our profit efficiency estimates for some animals. To assess the magnitude of the bias, we assumed that all dehorned steers were preconditioned before sale, as these are required conditions for bulls placed on a health protocol (Verteramo Chiu et al., Reference Verteramo Chiu, Tauer, Kaniyamattam, Lhermie and Gröhn2022). In the 500–749 lbs. group considered in the profit efficiency analysis, there were 1,603 bulls and steers of which 702 (35.25%) were dehorned steers. Profit efficiency scores for all bulls and steers in this subgroup were re-estimated using added preconditioning expenses of $20.60/head (Verteramo Chiu et al., Reference Verteramo Chiu, Tauer, Kaniyamattam, Lhermie and Gröhn2022). The revised average profit efficiency score of inefficient transactions in this subset was 0.66, compared to the original estimate of 0.65. Therefore, there may be a negligible bias in our estimates, since the proportion of preconditioned animals used in the hypothetical scenario represents an upper-bound estimate of the actual number.
By contrasting the estimated price and profit efficiencies, it was found that 45.62% of the observations were both price and profit efficient, 4.15% were profit efficient but price inefficient, 5.23% were only price efficient, and 45.00% were neither profit nor price efficient. Price and profit efficiency scores for animals in the 500–749 lbs. weight range are illustrated in Figure 2.
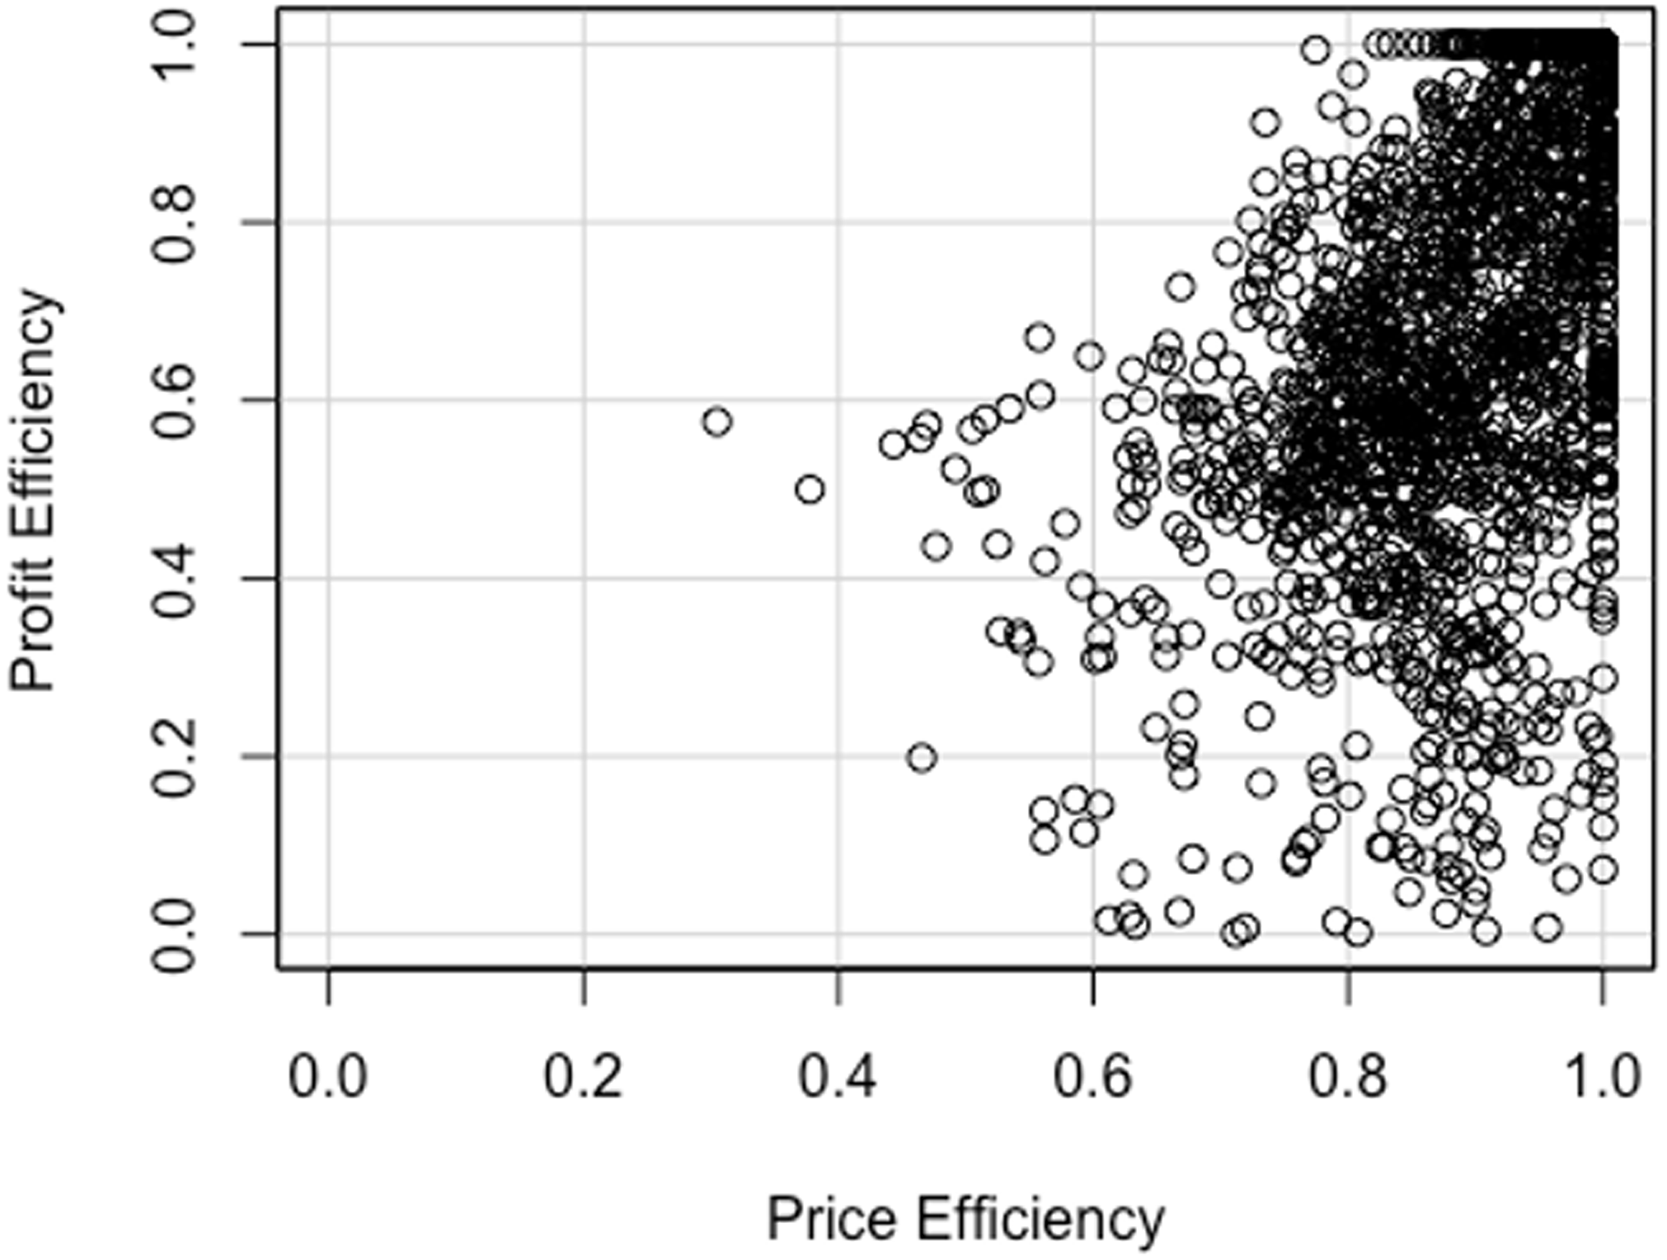
Figure 2. Profit and price efficiency scores, 500–749 lbs.
The Pearson’s correlation coefficient between profit and price efficiencies was equal to 0.67. Although a positive relationship exists between profit- and price-oriented efficiencies, the observed distribution of efficiencies between the two classes highlighted the importance of incorporating profit margins into cattle marketing decisions. For instance, by focusing only on achieving higher prices, producers might disregard potential profit opportunities. As shown in Figure 2, 78.41% of the profit-inefficient observations are within the top 20th percentile of the price efficiency scores. Estimated sales inefficiencies may also support the notion that some cattle producers are not exclusively revenue or profit seekers, and that ranching consumptive amenities could also influence their management decisions (Torell et al., Reference Torell, Rimbey, Tanaka and Bailey2001, Reference Torell, Rimbey, Ramírez and McCollum2005). Furthermore, additional biological, environmental, and management factors not considered in the analysis could also have limited producers’ ability to modify the characteristics of their cattle before sale. Therefore, the estimated efficiencies are conditioned on the defined search space.
6.3 Composite Efficient Units (CEU)
Efficient transactions (i.e., ϵ
i
= 1 or $\epsilon_{i}$
= 1) characterize optimal combinations of exogenous and endogenous characteristics. These efficient transactions represent the maximum achievable price or profit given observed fixed attributes and exogenous market conditions. In the analysis, efficient transactions serve as the reference set to construct a Composite Efficient Unit (CEU) for each inefficient transaction. The estimated CEUs provide data-driven insights on how to improve price and profit efficiencies by modifying current controllable attribute levels. The corresponding price- and profit-oriented CEUs are summarized in Table 4. Given that inefficient transactions and CEUs represent the same observations below and at the hedonic efficient frontier, McNemar’s chi-squared test for categorical characteristics and paired t-test for continuous attributes were used to compare both subsets. The comparison for heavier animals (i.e., over 1,000 lbs.) is omitted due to data limitations and the fact that most production enterprises in the region target lighter animals.
$\epsilon_{i}$
= 1) characterize optimal combinations of exogenous and endogenous characteristics. These efficient transactions represent the maximum achievable price or profit given observed fixed attributes and exogenous market conditions. In the analysis, efficient transactions serve as the reference set to construct a Composite Efficient Unit (CEU) for each inefficient transaction. The estimated CEUs provide data-driven insights on how to improve price and profit efficiencies by modifying current controllable attribute levels. The corresponding price- and profit-oriented CEUs are summarized in Table 4. Given that inefficient transactions and CEUs represent the same observations below and at the hedonic efficient frontier, McNemar’s chi-squared test for categorical characteristics and paired t-test for continuous attributes were used to compare both subsets. The comparison for heavier animals (i.e., over 1,000 lbs.) is omitted due to data limitations and the fact that most production enterprises in the region target lighter animals.
Table 4. Contrast of inefficient transactions and composite efficient units (CEU)
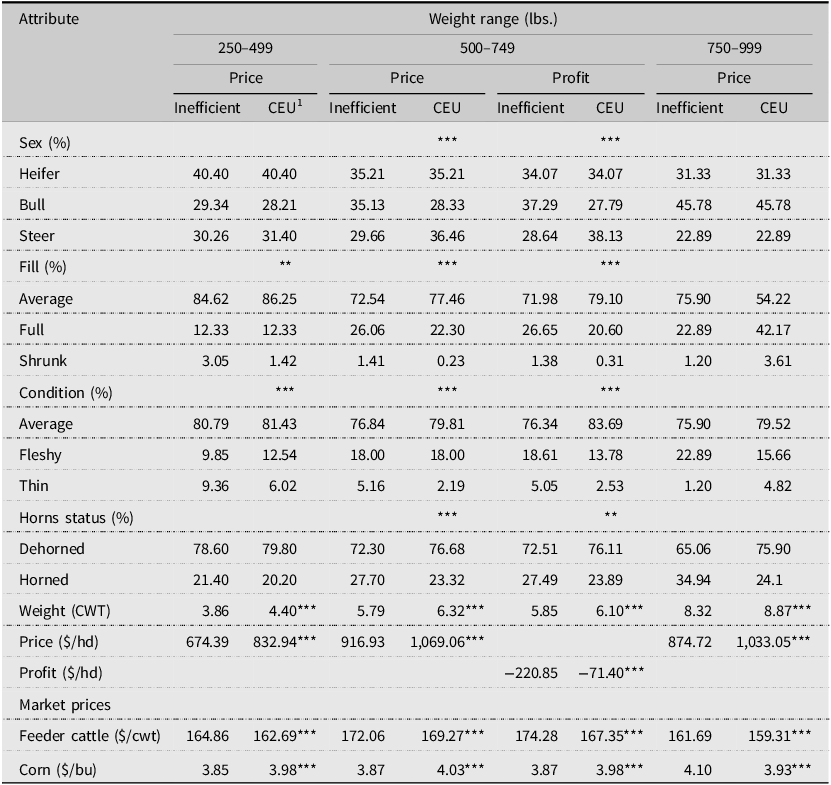
1 McNemar’s chi-squared and paired two-sided t tests were used to compare categorical and continuous attributes between inefficient transactions and ECUs.
Significance levels of 0.01, 0.05, and 0.10 are indicated by ***, ** and *, respectively.
Estimated CEUs suggested that average sale price of inefficient transactions in the 250–499 lbs. weight range can be increased by $158.55, for inefficient sales in the 500–749 lbs. category price could rise by $152.13, and a $158.33 price increase is implied for inefficient transactions in the 750–999 lbs. weight cohort. In the case of profits, by modifying the original set of endogenous attributes, average profit losses of inefficient transactions could be reduced by $152.35.
CEUs and inefficient transactions also differed in terms of the levels of their controllable characteristics. For all three weight groups considered, better prices were associated with weight gains. Namely, to reach the price efficiency frontier, weight at sale of inefficient animals need to increase, on average, by 13.99%, 9.15%, and 6.61% for those in the 250–499 lbs., 500–749 lbs., and 750–999 lbs. categories, respectively. Additionally, significant differences in the proportions of bulls and steers were found in the 500–749 lbs. weight group, in which the percentage of steers increased from 29.66% in the inefficient sales to 36.46% in their corresponding CEUs. Differences in fill and body condition levels were also found between inefficient transactions and CEUs in the 250–499 lbs. and 500–749 lbs. cohorts. Particularly, a smaller proportion of animals with shrunk fill (1.42% and 0.23%) and thin condition (6.02% and 2.19%) is suggested. A higher proportion of dehorned animals (76.68%) was also observed in the CEUs of the 500-749 lbs. category.
Similar results were obtained in the profit-oriented CEUs in terms of suggested characteristic changes (Table 4). Profit improvements were associated with 4.27% heavier animals, a smaller proportion of shrunk fill (0.31%) and thin body condition (2.53%), and an increase in the proportion of steers (38.13%) and dehorned (76.11%) animals. For both price- and profit-oriented analyses, it was possible to improve the value of inefficient transactions under lower cattle market prices and higher feed costs.
Overall, efficiency results indicate that cattle producers can attain higher prices and profits by implementing value-added management practices. For instance, identifying the optimal selling weight is essential to achieving higher returns and profits. Unfortunately, empirical results suggest that local producers tend to bring underweighted animals to market. Additional market premiums and profit margins can be obtained by carrying out cost-effective interventions during the backgrounding period, such as timely castration, dehorning, and conditioning of animals. Also, before and during auction, producers must ensure adequate access to water and feed to give their animals a healthy and vigorous appearance.
Suggested attribute modifications to reach the hedonic price and profit frontiers can be used to validate and contrast the counterpart recommendations from parametric hedonic analysis. For instance, the cost-effective interventions derived from the price efficiency analysis are based on actual sales or interpolation of recorded transactions. On the other hand, the set of marginal effects estimated in the price hedonic analysis could be used to extrapolate the effect of management and marketing practices outside the observed realm. Therefore, the proposed efficiency framework can be used to tune and evaluate the feasibility of such propositions.
7. Summary and conclusions
This study provides some insights into how cattle producers could reach higher prices and profits by delivering animals with the set of attributes desired by buyers. Data Envelopment Analysis techniques are introduced to estimate market efficiencies and to derive data-driven marketing and management strategies. Compared to the conventional hedonic price analysis, our method controls for unfeasible attribute combinations, offers cost-effective interventions, and it provides insights about the degree of existing market inefficiencies. Furthermore, the proposed efficiency framework can assist researchers select and validate the parametric form of the hedonic price function.
Although we focused on cattle market efficiencies in Texas, our approach is flexible enough to evaluate sales efficiencies for a wide range of goods and services. The proposed objective functions and model constraints can be used as they stand or adapted to accommodate intrinsic product and market characteristics of other heterogeneous products. Furthermore, given current market concentration in the cattle industry, the findings of this study may represent similar market demands that can be widely used by cattle producers to improve their sale prices and profit margins.
Recorded transactions were stratified by weight to analyze price efficiencies along the cattle supply chain. In the case of the profits, a subset of observations consisting of transactions within the typical feeder cattle weight range (i.e., 500–749 lbs.) were evaluated. It was found that about 47% of the recorded sales were inefficient and that the implementation of market-oriented management practices could increase sale prices by 23%. The lowest price efficiency scores were estimated in light (i.e., 250–499 lbs.) and heavier animals (i.e., over 1,000 lbs.).
Compared to prices, profit-inefficient sales tended to be further away from the efficient frontier. Efficiency results suggested that profits could be increased by 74%, although most of the estimated and projected profits were in the negative range. Observed divergences in price and profit efficiency scores highlight the need to evaluate the tradeoffs between targeting higher sale prices and the corresponding added costs.
Potential price and profits gains were mainly associated with weight increments, higher proportion of steers, and fewer animals with horns, shrunk fill and thin body condition. Educational programs can be built around the findings and methods of this study to communicate to producers about the marketing implications associated with value-added management practices.
Data availability statement
The data that support the findings of this study were collected by the authors and are available from the corresponding author, upon reasonable request.
Acknowledgements
We gratefully acknowledge the assistance of current and former Texas A&M AgriLife Extension
Service personnel during the design, collection, and compilation of the data used in this study.
We also thank the anonymous reviewers for their insightful comments and suggestions.
Author contribution
Conceptualization, S.D.Z and D.A; Methodology, S.D.Z and D.A; Formal Analysis, S.D.Z and D.A; Data Curation, S.D.Z.; Writing – Original Draft, S.D.Z and D.A, Writing – Review and Editing, S.D.Z and D.A.; Supervision, S.D.Z..; Funding Acquisition, S.D.Z.
Financial support
This research received no specific grant from any funding agency, commercial or not-for-profit sectors.
Competing interests
Samuel Zapata and David Anderson declare none.
AI contributions to research
AI was NOT used in any way in the generation of this paper.


 Open access