1. Introduction
The maximum output performance of the traditional high power laser facility[Reference Burkhart, Behrendt and Smith1–Reference Lin4] is often limited by the damage of the optical units, components and the entire system under high energy flux level. This is especially so for ultraviolet optical components. Various studies show that, not only the third-harmonics, but the remaining fundamental frequency, and the second harmonics also have a serious impact on the optical component damages[Reference Lin4–Reference Martin, Morono and Hodgson6]. Therefore, in order to systematically study the load capacity of the optical equipment, component and system under high intensity, it is necessary to have a high-precision measurement platform[Reference Conde, Alger, Azevedo, Chang, Glenn, Kegelmeyer, Liebman and Whitman7–Reference Thompson, Decker and Knopp9]. Not only does this platform have to have the sophisticated capabilities for laser parameter diagnosis, online damage detection for optical components, but it must also be able to comprehensively measure energy, which can obtain the energy of the remaining fundamental frequency, remaining second-harmonics, and third-harmonics entering the optical components.
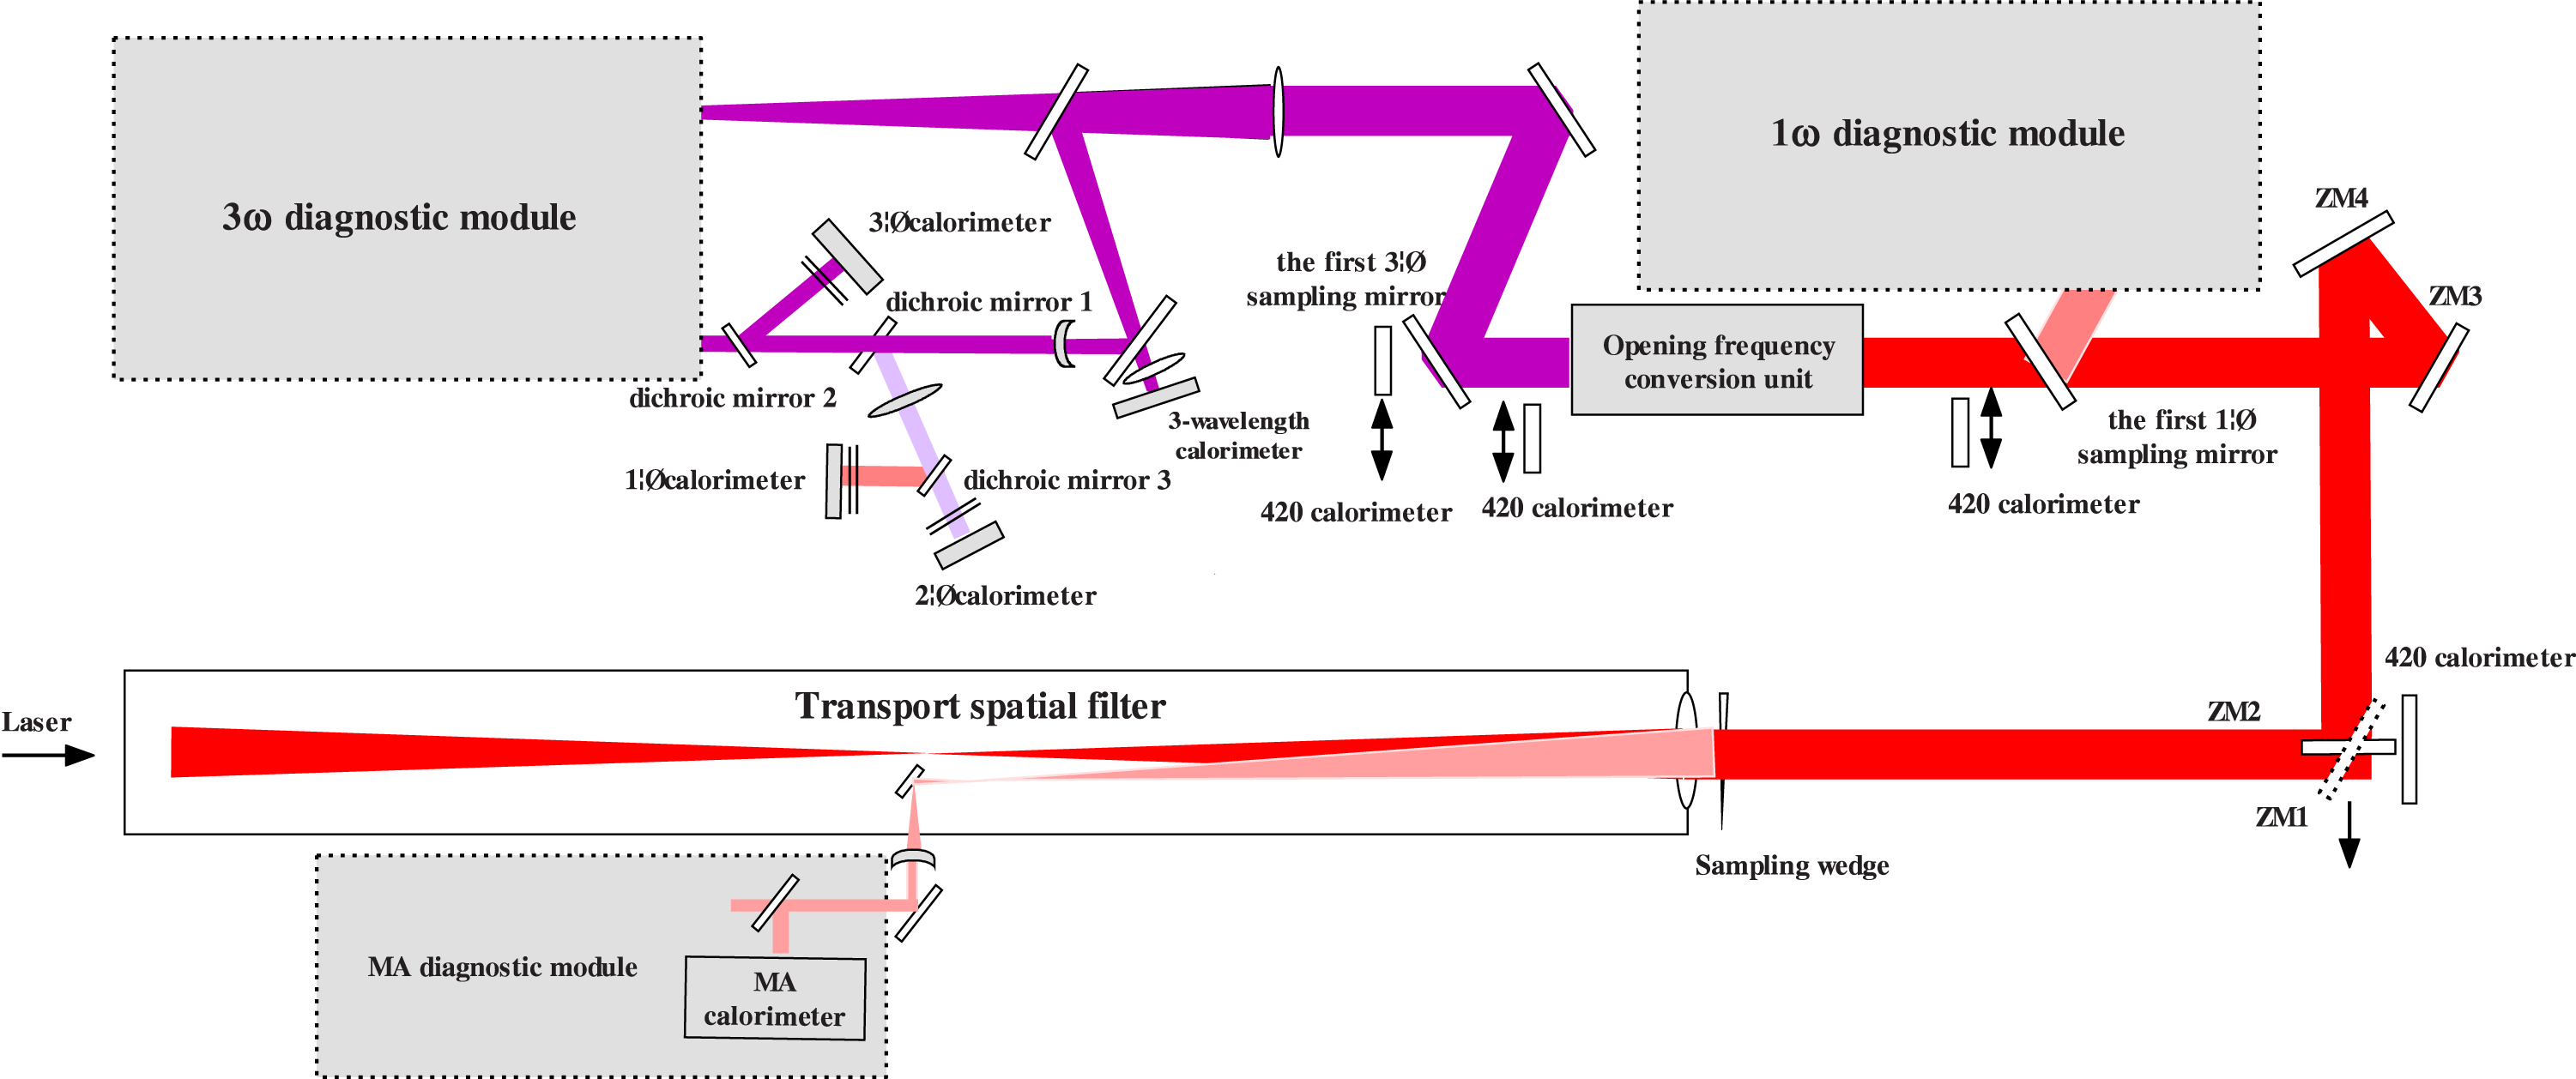
This article introduces an energy measurement system for Large-aperture High Power Laser Experiment Platform[Reference Peng, Wei, Yuan, Fu, Chen, Sun, Liu and Xu10, Reference Xia, Sun, Da, Zhao, Peng, Dong, Zheng and Liu11]. This system is composed of the sampling optical path and energy calorimeters, which are used to measure the energy of a single wavelength before and after the frequency conversion. We also show how to calibrate the calorimeter sampling coefficients.

Figure 1. Schematic view of the energy diagnostic system of the large-aperture High Power Laser Experiment Platform.
2. System optical paths
Our Large-aperture High Power Laser Experiment Platform is a comprehensive experiment
verification platform that can output more than tens of thousands of joules. It can be
used for comprehensively evaluating the load capacity of the optical equipment,
component and system under high energy flux level. The optical paths of its energy
measurement system are listed as in figure 1. The laser from the last lens of the transmission spatial filter is divided
into two paths: about 0.2% goes back the same optical path by sampling wedge as
reflected light. Around the filtering holes in the spatial filter, the negative lens
changes the beam aperture from 400 mm ![]() $\times $ 400 mm to 50 mm
$\times $ 400 mm to 50 mm ![]() $\times $ 50 mm parallel light. Then it enters the calorimeter in the
main amplifier diagnostic module, where the fundamental frequency laser energy is
measured. After the main laser transmitted from the sampling wedge passes the vertically
placed reflection mirrors ZM1 and ZM2, the height of the laser beam was lowered down to
about 1.2 m above the ground. At the same time, the optical path is rotated
for
$\times $ 50 mm parallel light. Then it enters the calorimeter in the
main amplifier diagnostic module, where the fundamental frequency laser energy is
measured. After the main laser transmitted from the sampling wedge passes the vertically
placed reflection mirrors ZM1 and ZM2, the height of the laser beam was lowered down to
about 1.2 m above the ground. At the same time, the optical path is rotated
for ![]() $90^\circ $. And then it enters the ZM3 and ZM4 both at an angle of incidence of
$90^\circ $. And then it enters the ZM3 and ZM4 both at an angle of incidence of ![]() $22.5^\circ $, where the laser is turned to go parallel with the transport spatial
filter. After being transmitted by the fundamental frequency sampling mirror 1, the
light goes into the frequency conversion unit. The mixed parallel laser beams after the
crystal conversion (remaining fundamental frequency, remaining second-harmonics,
third-harmonics) enters the third-harmonics sampling mirror 1. After the
reflected light is reflected and sampled by the third-harmonics sampling mirror 2, it
enters the large-aperture beam shrink optical path, where the light beam is transformed
into a 50 mm
$22.5^\circ $, where the laser is turned to go parallel with the transport spatial
filter. After being transmitted by the fundamental frequency sampling mirror 1, the
light goes into the frequency conversion unit. The mixed parallel laser beams after the
crystal conversion (remaining fundamental frequency, remaining second-harmonics,
third-harmonics) enters the third-harmonics sampling mirror 1. After the
reflected light is reflected and sampled by the third-harmonics sampling mirror 2, it
enters the large-aperture beam shrink optical path, where the light beam is transformed
into a 50 mm ![]() $\times $ 50 mm parallel light to complete the relevant parameter
diagnosis of the third-harmonics. Its transmitted light is then absorbed by the
absorber. An interface to a large-aperture calorimeter is placed in front of the
absorber, so it can calibrate the total energy when needed.
$\times $ 50 mm parallel light to complete the relevant parameter
diagnosis of the third-harmonics. Its transmitted light is then absorbed by the
absorber. An interface to a large-aperture calorimeter is placed in front of the
absorber, so it can calibrate the total energy when needed.
There are two reflection mirrors in the third-harmonics system to turn the optical path. After being transmitted from the second reflection mirror, and being collimated by the three-wavelength collimation lens, it enters the three-wavelength calorimeter. That accomplishes the sampling of all three wavelengths.
The light through the third-harmonics beam shrink system is a mixture of fundamental frequency, second-harmonics and third-harmonics. After being reflected by dichroic mirror 1 and dichroic mirror 2, the light enters third-harmonics calorimeter. The purpose of dichroic mirror 1 is to only transmit third-harmonics light, and only reflect fundamental frequency and second-harmonics light; dichroic mirror 2 is a half-transmission-half-reflection mirror. At the same time, it serves as a wave aberration compensation for any measurement that follows.
After the mixed light is reflected by dichroic mirror 1, it becomes a mixture of fundamental frequency and second-harmonics. Due to the chromatic aberration, it needs to be collimated. After being converged by the energy convergence lens, the light was projected on dichroic mirror 3. Its reflected light enters the fundamental frequency calorimeter, and the transmitted light enters the second-harmonics calorimeter.

Figure 2. After-crystal energy relationship diagram.
A filter was placed in front of each single-wavelength calorimeter, to ensure that the light entering the calorimeter is actually of a single wavelength.
Based on the modularization design requirement, all the calorimeters in the system use uniform calibers, and are composed of energy sensors, amplifiers, and display modules. The entire energy measurement system is centrally sampled and processed through remote control[Reference Xia, Shan, Gao and Sun12, Reference Xu, Yu, Fan and Deng13].
3. System calibration
For the fundamental frequency part of the main optical path, the energy values of two
key points need to be known: the main amplifier output energy ![]() $E$ (after the sampling wedge in figure 1), and the energy before the crystal in the frequency conversion
unit
$E$ (after the sampling wedge in figure 1), and the energy before the crystal in the frequency conversion
unit ![]() $E_{\mathrm{in}}$. They can both be given by the main amplifier calorimeter. Therefore
it is necessary to calibrate based on the sampling coefficients[Reference Wei, Zhang, Qian, Gao, Zhou and Zhou14]. First, we take the light guide ZM1 out
of the optical path, and replace it with a standard calorimeter with a caliber of
420 mm
$E_{\mathrm{in}}$. They can both be given by the main amplifier calorimeter. Therefore
it is necessary to calibrate based on the sampling coefficients[Reference Wei, Zhang, Qian, Gao, Zhou and Zhou14]. First, we take the light guide ZM1 out
of the optical path, and replace it with a standard calorimeter with a caliber of
420 mm ![]() $\times $ 420 mm, (420 standard calorimeter), to calibrate the main
amplifier output energy. The sampling coefficient of the main amplifier calorimeter is
given by:
$\times $ 420 mm, (420 standard calorimeter), to calibrate the main
amplifier output energy. The sampling coefficient of the main amplifier calorimeter is
given by: ![]() $k_{\mathrm{MA}}=E_{420}/W_{\mathrm{MA}}$, where
$k_{\mathrm{MA}}=E_{420}/W_{\mathrm{MA}}$, where ![]() $E_{420}$ is the energy given by the 420 calorimeter;
$E_{420}$ is the energy given by the 420 calorimeter; ![]() $W_{\mathrm{MA}}$ is the main amplifier calorimeter readings. Then we place the 420
calorimeter in front of the frequency conversion unit. The same approach is used on the
main amplifier calorimeter to calculate the energy sampling coefficient,
$W_{\mathrm{MA}}$ is the main amplifier calorimeter readings. Then we place the 420
calorimeter in front of the frequency conversion unit. The same approach is used on the
main amplifier calorimeter to calculate the energy sampling coefficient, ![]() $k_{\mathrm{in}}$, before the frequency conversion unit. Therefore the main amplifier
output energy,
$k_{\mathrm{in}}$, before the frequency conversion unit. Therefore the main amplifier
output energy, ![]() $E_{\mathrm{MA}}$, as well as the energy before the crystal in the frequency conversion
unit,
$E_{\mathrm{MA}}$, as well as the energy before the crystal in the frequency conversion
unit, ![]() $E_{\mathrm{in}}$, are both given by the main amplifier calorimeter:
$E_{\mathrm{in}}$, are both given by the main amplifier calorimeter: ![]() $E_{\mathrm{MA}}=k_{\mathrm{MA}}\, W_{\mathrm{MA}}$,
$E_{\mathrm{MA}}=k_{\mathrm{MA}}\, W_{\mathrm{MA}}$, ![]() $E_{\mathrm{in}}=k_{\mathrm{in}}\, E_{\mathrm{MA}}$.
$E_{\mathrm{in}}=k_{\mathrm{in}}\, E_{\mathrm{MA}}$.
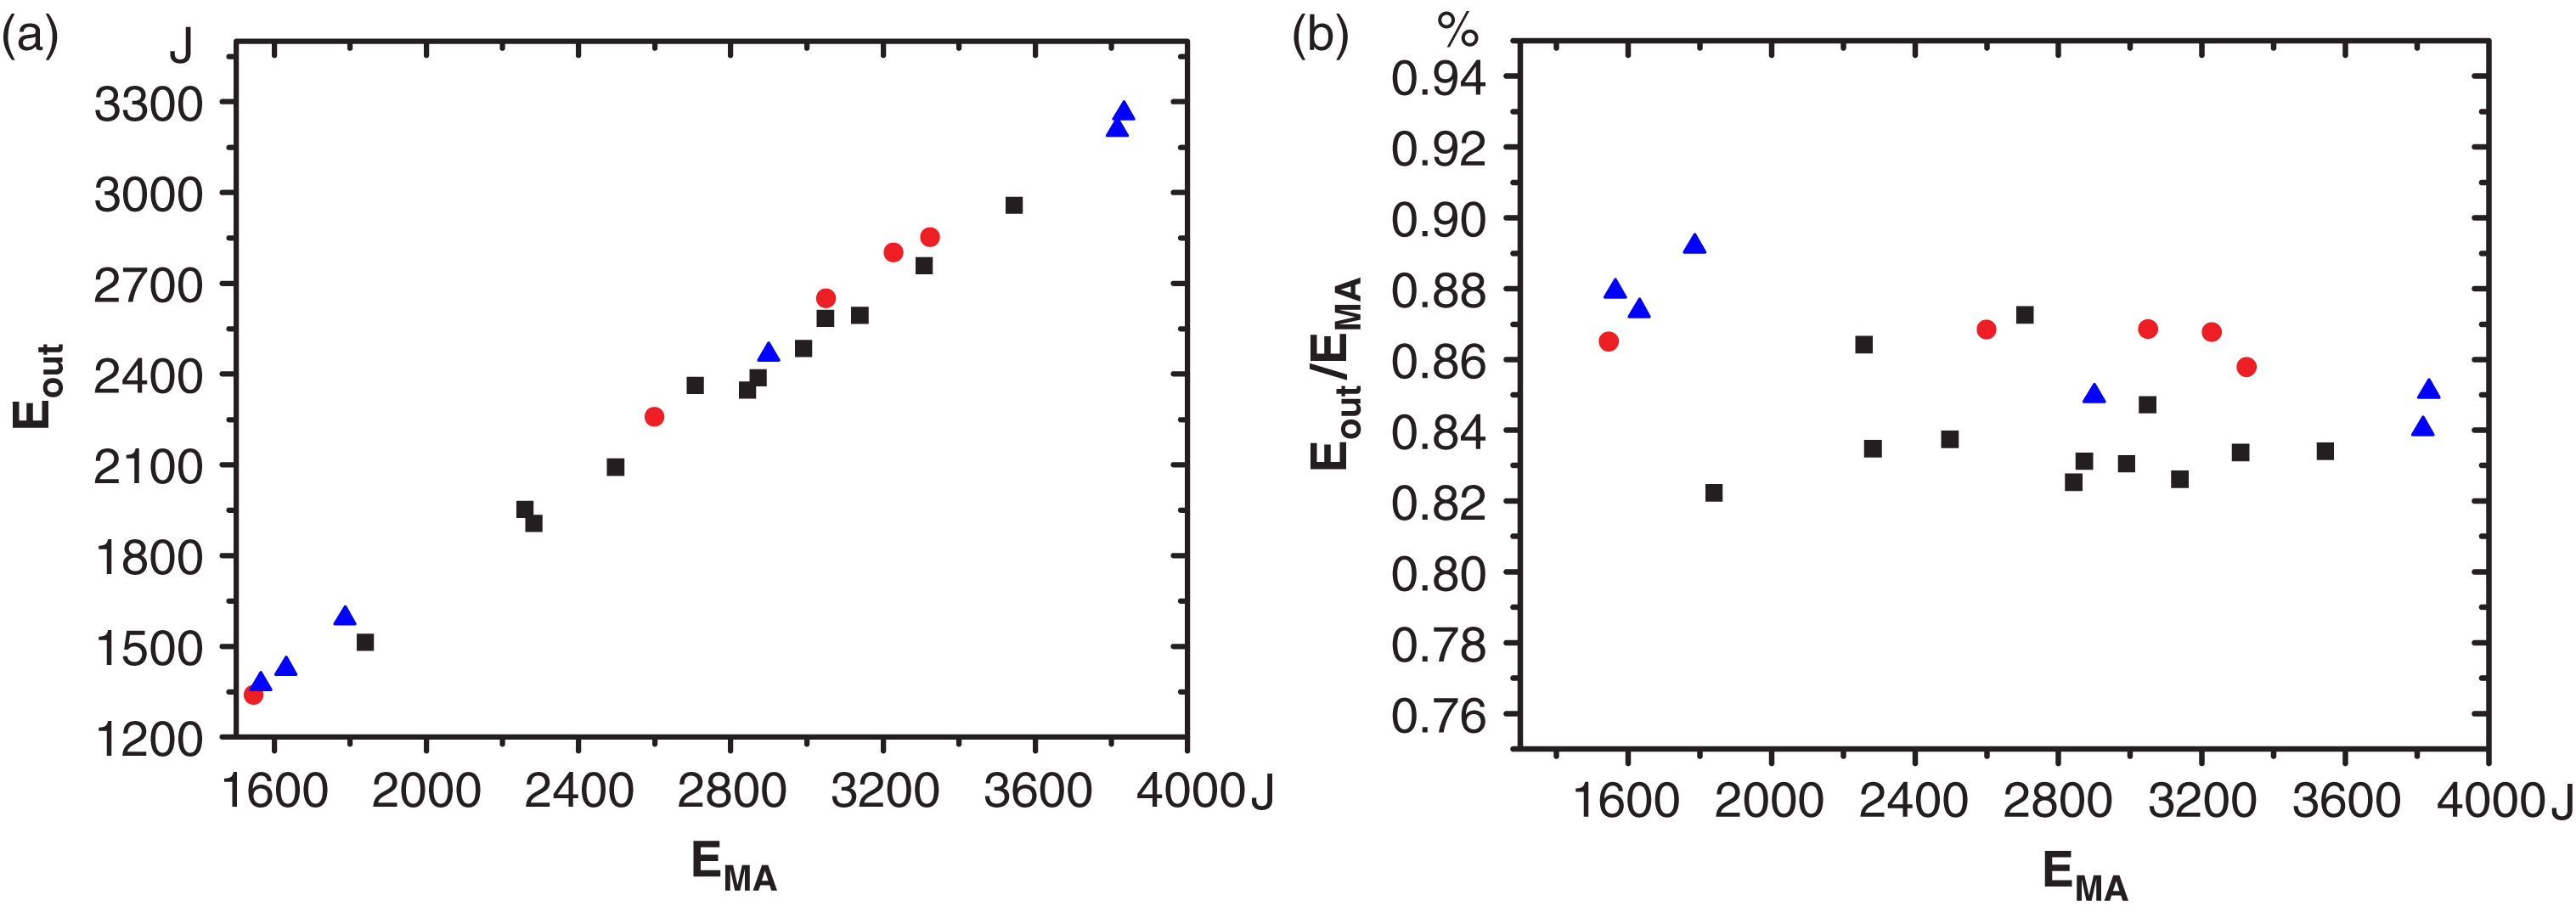
Here are four calorimeters after the frequency conversion unit. They are used to measure the energy of the remaining fundamental frequency, remaining second-harmonics, third-harmonics, and to sample the total energy for the purpose of energy balance. Their relationship can be shown in figure 2. Here the single wavelength calorimeter readings are from after the crystal. Energy balance refers to that the sampling coefficients of the single-wavelength calorimeters maintain a constant quantitative relationship, which can be used to monitor the reliability of various sampling coefficients. Since there is no target focusing lens in the frequency conversion unit, it is difficult to achieve harmonic separation[Reference Fleurot, Cavailler and Bourgade3, Reference Lin4]. Therefore they cannot be calibrated using traditional perforation method. Two different methods are employed here: direction and combinational calibration.
3.1. Direct calibration
We place the 420 standard calorimeter after the third-harmonics sampling
mirror 1, and insert an absorbing glass element between the frequency
conversion unit and the mirror 1, (two ![]() $1\omega $- and one
$1\omega $- and one ![]() $2\omega $- absorbing glass), to let only third-harmonics light pass for the
main laser shot. That makes only third-harmonics calorimeter and the three-wavelength
calorimeter have readings, and leads to the sampling coefficient of the
third-harmonics
$2\omega $- absorbing glass), to let only third-harmonics light pass for the
main laser shot. That makes only third-harmonics calorimeter and the three-wavelength
calorimeter have readings, and leads to the sampling coefficient of the
third-harmonics ![]() ${K}'_{3} (E_{420} ={K}'_{3} W_{3})$, as well as the energy balancing coefficient
${K}'_{3} (E_{420} ={K}'_{3} W_{3})$, as well as the energy balancing coefficient ![]() $h_{3}(W_{4}=h_{3}W_{3})$. Then we adjust the third-harmonics crystal, and only let
fundamental frequency and second-harmonics pass the frequency conversion. Then we
remove the
$h_{3}(W_{4}=h_{3}W_{3})$. Then we adjust the third-harmonics crystal, and only let
fundamental frequency and second-harmonics pass the frequency conversion. Then we
remove the ![]() $2\omega $ absorbing glass, and only let second-harmonics pass. That leads to
the sampling coefficient of the second-harmonics
$2\omega $ absorbing glass, and only let second-harmonics pass. That leads to
the sampling coefficient of the second-harmonics ![]() ${K}'_{2}(E_{420}={K}'_{2} W_{2})$, and its energy balancing coefficient,
${K}'_{2}(E_{420}={K}'_{2} W_{2})$, and its energy balancing coefficient, ![]() $h_{2}(W_{4}=h_{2}W_{2})$. Last we disable the second-harmonics, only the fundamental
frequency can pass the frequency conversion unit. After taking down all the absorbing
glass components, we use the main laser shot to obtain the sampling coefficient of
the fundamental frequency,
$h_{2}(W_{4}=h_{2}W_{2})$. Last we disable the second-harmonics, only the fundamental
frequency can pass the frequency conversion unit. After taking down all the absorbing
glass components, we use the main laser shot to obtain the sampling coefficient of
the fundamental frequency, ![]() ${K}'_{1} (E_{420} ={K}'_{1} W_{1})$, and the energy balancing coefficient,
${K}'_{1} (E_{420} ={K}'_{1} W_{1})$, and the energy balancing coefficient, ![]() $h_{1}(W_{4}=h_{1}W_{1})$.
$h_{1}(W_{4}=h_{1}W_{1})$.
Then, based on the energy transmission-reflection rate of different wavelengths from
the online calibration of the third-harmonics sampling mirror 1, we get
the single-wavelength sampling coefficients, ![]() $K_{1}, K_{2}$, and
$K_{1}, K_{2}$, and ![]() $K_{3}$ after the third-harmonics crystal, and before the third-harmonics
sampling mirror 1.
$K_{3}$ after the third-harmonics crystal, and before the third-harmonics
sampling mirror 1.
3.2. Combinational calibration
In the direct calibration approach, often we have a small number of calibrated laser
shot missions. Also because the inserted absorbing glass element is difficult to
guarantee a single-wavelength output, it results in a fair amount of dispersion in
the sampling coefficient. Therefore we can also employ combinational calibration
approach. There is no need to insert additional filters. The steps to calibrate the
sampling coefficients are as follows: first, we place the 420 calorimeter after the
third-harmonics sampling mirror 1. Within the range of ![]() $0.8\sim 4\ {\rm kJ}$ (the valid measurement range of the 420 calorimeter), we take
incident fundamental frequency at different energy levels. We record the total energy
from three wavelengths, and use the other four calorimeters to record the readings
from the remaining fundamental frequency, remaining second-harmonics and
third-harmonics. Then the relationship between the calorimeter readings can be
expressed as follows:
$0.8\sim 4\ {\rm kJ}$ (the valid measurement range of the 420 calorimeter), we take
incident fundamental frequency at different energy levels. We record the total energy
from three wavelengths, and use the other four calorimeters to record the readings
from the remaining fundamental frequency, remaining second-harmonics and
third-harmonics. Then the relationship between the calorimeter readings can be
expressed as follows:
 $$\begin {eqnarray} \left ({\begin {array}{@{}l@{}} {K}'_{1} \\ {K}'_{2} \\ {K}'_{3} \end {array}}\right ) &=& \left ({\begin {array}{@{}lll@{}} W_{1i} & W_{2i} & W_{3i} \\ W_{1j} & W_{2j} & W_{3j} \\ W_{1k} & W_{2k} & W_{3k} \end {array}}\right )^{-1}\ast \left ({\begin {array}{@{}l@{}} E_{420i} \\ E_{420j} \\ E_{420k} \end {array}}\right )\quad \left ({\begin {array}{@{}l@{}} h_{1} \\ h_{2} \\ h_{3} \end {array}}\right ) \\ &=& \left ({\begin {array}{@{}lll@{}} W_{1i} & W_{2i} & W_{3i} \\ W_{1j} & W_{2j} & W_{3j} \\ W_{1k} & W_{2k} & W_{3k} \end {array}}\right )^{-1}\ast \left ({\begin {array}{@{}l@{}} W_{4i} \\ W_{4j} \\ W_{4k} \end {array}}\right )\label {eq3} \end {eqnarray}$$
 where ![]() $i$,
$i$, ![]() $j$, and
$j$, and ![]() $k$ are the numbering of any single laser shot. Then we use linear
square to run linear regression, and give average coefficients and errors. Lastly, we
process the obtained the energy sampling coefficient,
$k$ are the numbering of any single laser shot. Then we use linear
square to run linear regression, and give average coefficients and errors. Lastly, we
process the obtained the energy sampling coefficient, ![]() $K_{1}$,
$K_{1}$, ![]() $K_{2}$ and
$K_{2}$ and ![]() $K_{3}$ using the same approach.
$K_{3}$ using the same approach.

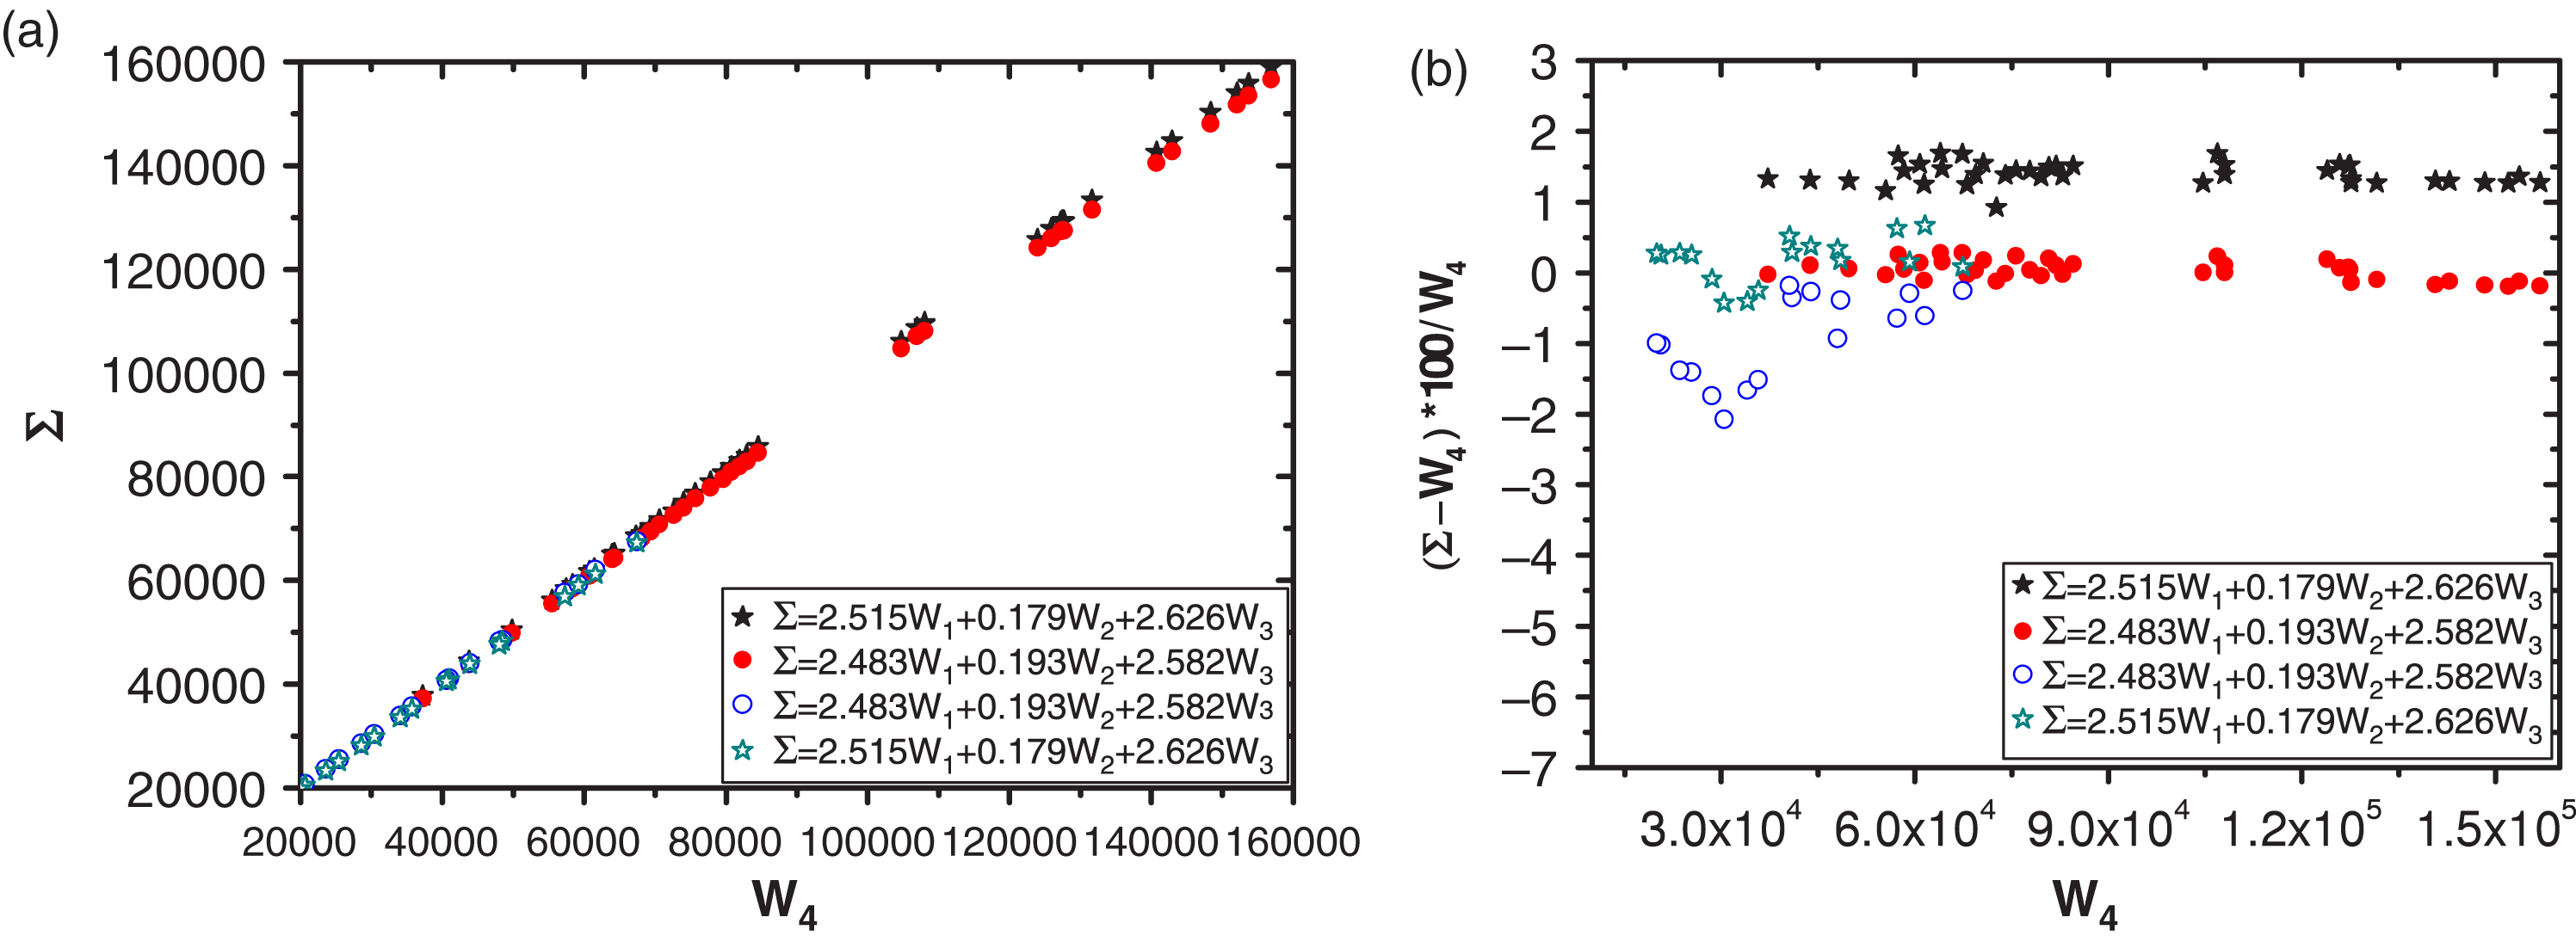
Figure 3. Comparison of the energy balancing relationship between the two approaches.
(a) the relationship curve between ![]() $\Sigma =h_{1}W_{1}+h_{2}W_{2}+h_{3}W_{3}$ and energy reading from three-wavelength calorimeter
reading
$\Sigma =h_{1}W_{1}+h_{2}W_{2}+h_{3}W_{3}$ and energy reading from three-wavelength calorimeter
reading ![]() $W_{4}$ and (b) their corresponding relative errors.
$W_{4}$ and (b) their corresponding relative errors.
4. Results and analysis
Table 1 shows the energy balancing coefficients from two calibration approaches. Figure 3 shows the corresponding energy balancing relationship. The hollow star in the figure means the energy balancing relationship obtained through direct calibration, and their relative errors. And the laser energy for only one wavelength exists after the frequency conversion at each laser shot. A solid star means the energy balancing coefficients are obtained through indirection calibration applied on mixed light. Here at each laser shot, the energy of all three wavelengths exists after the frequency conversion (remaining fundamental frequency, remaining second harmonics and third harmonics). A solid dot means to apply indirection combinational calibration on the raw data corresponding to the solid star to get the energy balancing relationship. A hollow dot means to apply the combinational calibration results on the raw data from hallow star to obtain the energy balancing relationship.
We can see from figure 3 that, with each
calibration shot mission, for the direct calibration marked by the hollow star and the
combinational calibration marked by solid dot, their obtained energy balancing
relationship ![]() $h_{1}W_{1}+h_{2}W_{2}+h_{3}W_{3}$ and their three-wavelength calorimeter reading
$h_{1}W_{1}+h_{2}W_{2}+h_{3}W_{3}$ and their three-wavelength calorimeter reading ![]() $W_{4}$ match very well. All relative errors are within 1%. But if we apply
the coefficients from the direct calibration on a normal laser shot mission, where all
remaining fundamental frequency, second-harmonics and third harmonics exist, the
combinational result
$W_{4}$ match very well. All relative errors are within 1%. But if we apply
the coefficients from the direct calibration on a normal laser shot mission, where all
remaining fundamental frequency, second-harmonics and third harmonics exist, the
combinational result ![]() $h_{1}W_{1}+h_{2}W_{2}+h_{3}W_{3}$ and
$h_{1}W_{1}+h_{2}W_{2}+h_{3}W_{3}$ and ![]() $W_{4}$ have a systematic error, and the relative error is about 1.4%. And if
we apply the energy balancing relationship from the combinational calibration on the
single-wavelength output, we also see systematic errors, in an opposite direction.
$W_{4}$ have a systematic error, and the relative error is about 1.4%. And if
we apply the energy balancing relationship from the combinational calibration on the
single-wavelength output, we also see systematic errors, in an opposite direction.
Table 1. Energy balancing coefficients from two approaches.

There are two areas of reasons for this situation. First there is a sensitivity
difference in the calorimeters themselves. Since under the normal phase matching
condition, the second-harmonics light from the harmonics crystal are almost all
converted into third-harmonics with the crystal, the remaining second-harmonics light is
far less than the remaining fundamental frequency and third-harmonics light. The design
of the diagnosis system takes many factors into consideration, so that the energy
sampling coefficients have a relatively smaller difference before entering the
photosensitive surface in the calorimeter. Therefore, in order to guarantee the
measurement precision of the second-harmonics energy, the sensitivity to the
second-harmonics is about 10 times of that in the remaining fundamental frequency,
third-harmonics, three-wavelength calorimeters, all of which have similar sensitivities.
So during direct calibration, taking the measurement range of the 420 calorimeter into
consideration, the actual energy value that enters the second-harmonics calorimeter is
at the center of the linear region of this calorimeter[Reference Yu, Xiong, Tao, Fan, Deng and Zhang15]. But that is at the bottom of the three-wavelength
calorimeter linear region. Therefore this leads to higher changes in ![]() $h_{2}$ and higher dispersions from different laser shot. Another reason is
that even though absorbing glass is inserted into the optical path, it is difficult to
get clean third-harmonics. Also we only have limited number of shot missions, these
leads to a system error in the obtained average coefficients.
$h_{2}$ and higher dispersions from different laser shot. Another reason is
that even though absorbing glass is inserted into the optical path, it is difficult to
get clean third-harmonics. Also we only have limited number of shot missions, these
leads to a system error in the obtained average coefficients.
Based on the analysis above, the error from combinational calibration approach is smaller. The obtained energy balance relationship is with 1%. We can use it as the guidance on the accuracy of the energy measurement. Once the deviation exceeds this value, the reason is either the measured energy values are not within the linear regions of the calorimeters, or there is a change in the energy balancing relationship. For the latter, we need to check the optical component damage in optical path.
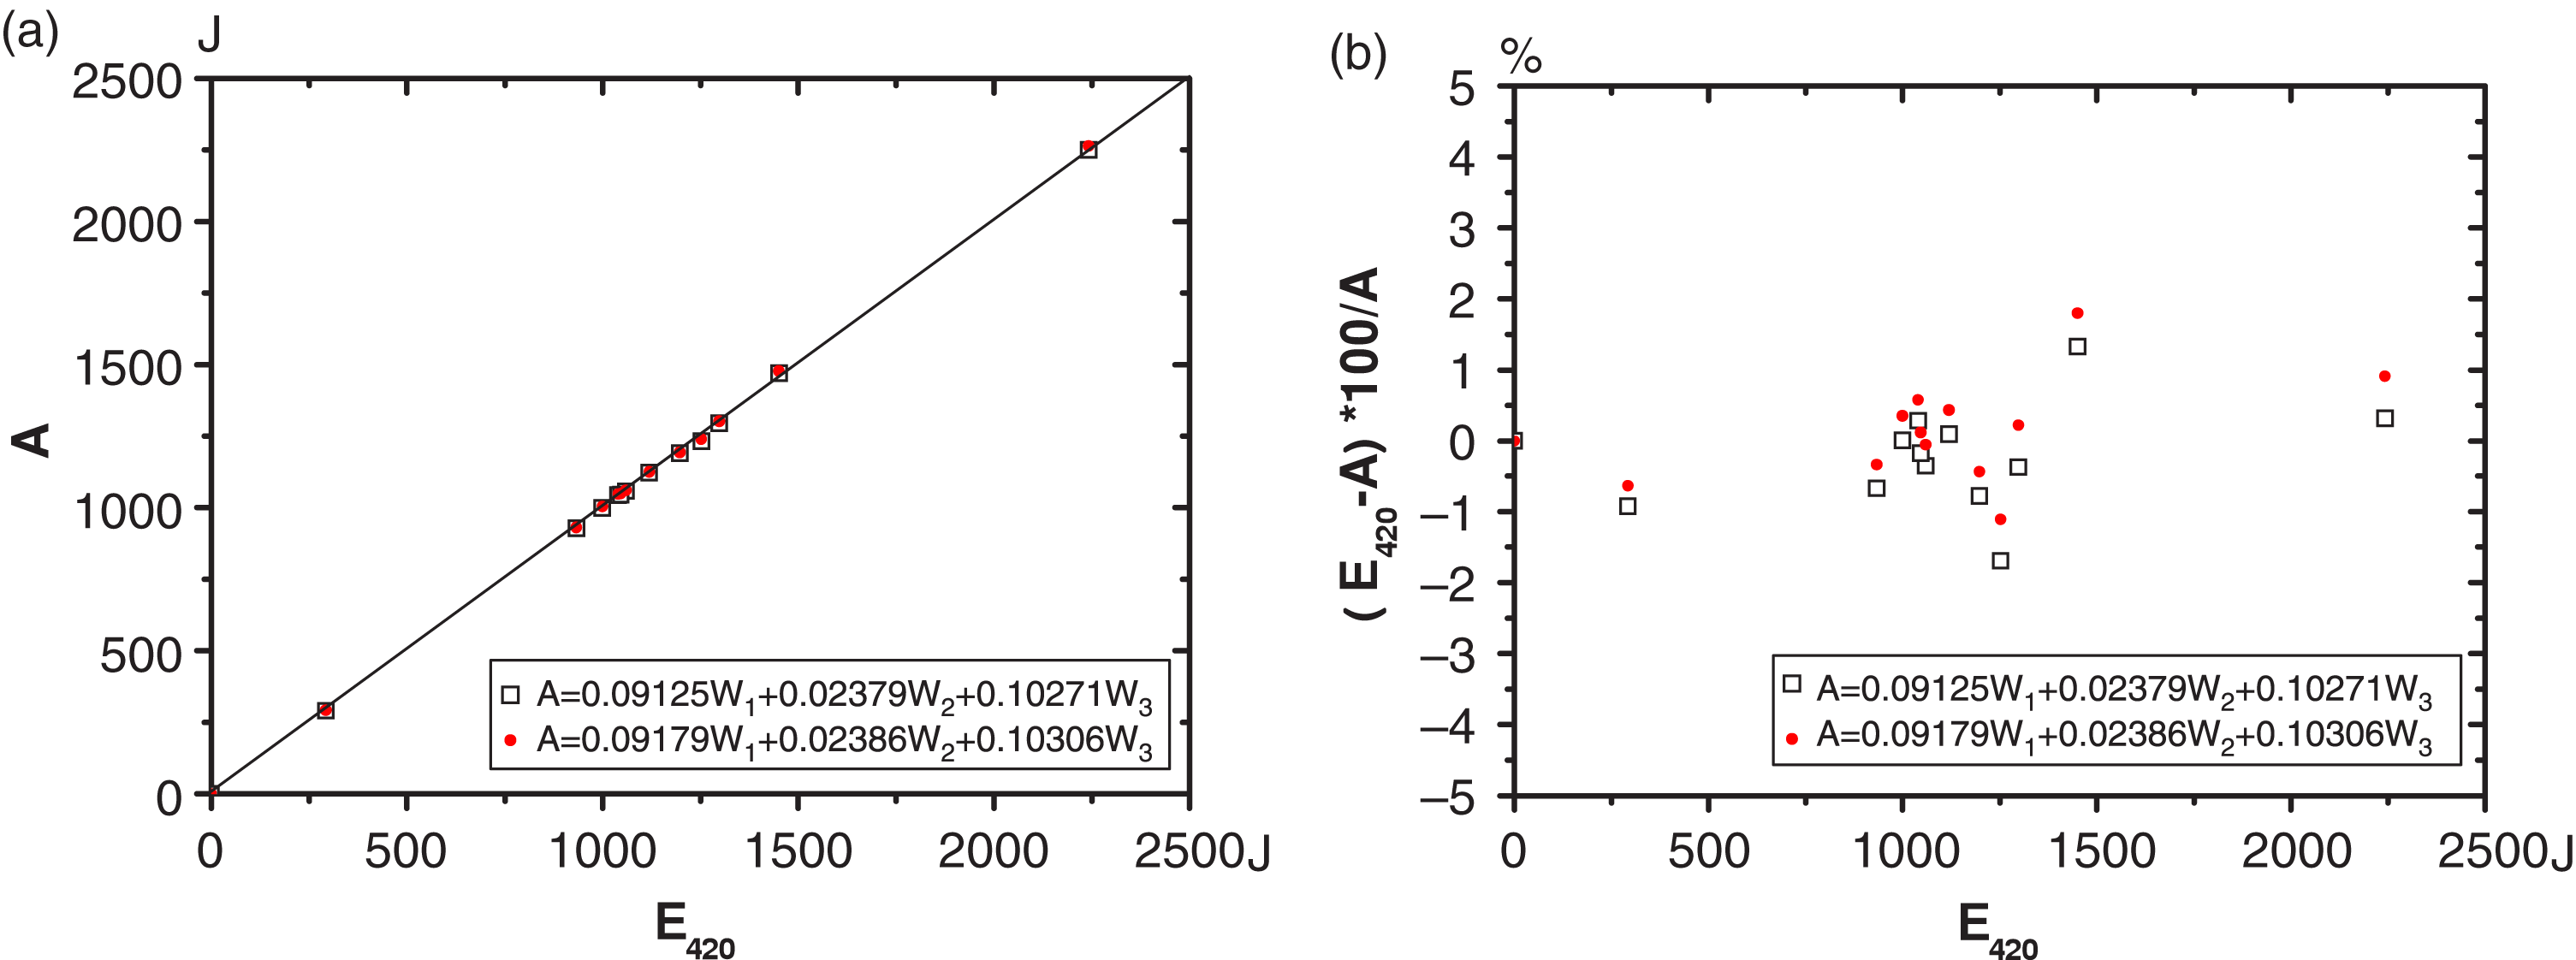
In the process of energy balancing coefficient calibration, only the readings from four calorimeters need to be recorded. There is no need to record the input energy levels. In order to obtain the input energy level, we need to calibrate the energy sampling coefficients of the optical path. Due to the limited number of laser shot missions, we only apply one group of calibration data, that from the direct calibration, in both groups of results. The result can be seen in table 2 and figure 4. Both approaches give out similar results.

Figure 4. Comparison between the energy balancing relationships from two approaches. (a)
The relationship curve between ![]() $A={K}'_{1} W_{1}+{K}'_{2} W_{2}+{K}'_{3}W_{3}$ and energy reading from the 420 calorimeter,
$A={K}'_{1} W_{1}+{K}'_{2} W_{2}+{K}'_{3}W_{3}$ and energy reading from the 420 calorimeter, ![]() $E_{420}$, in back of the third-harmonics sampling mirror 1
and (b) their corresponding relative errors.
$E_{420}$, in back of the third-harmonics sampling mirror 1
and (b) their corresponding relative errors.

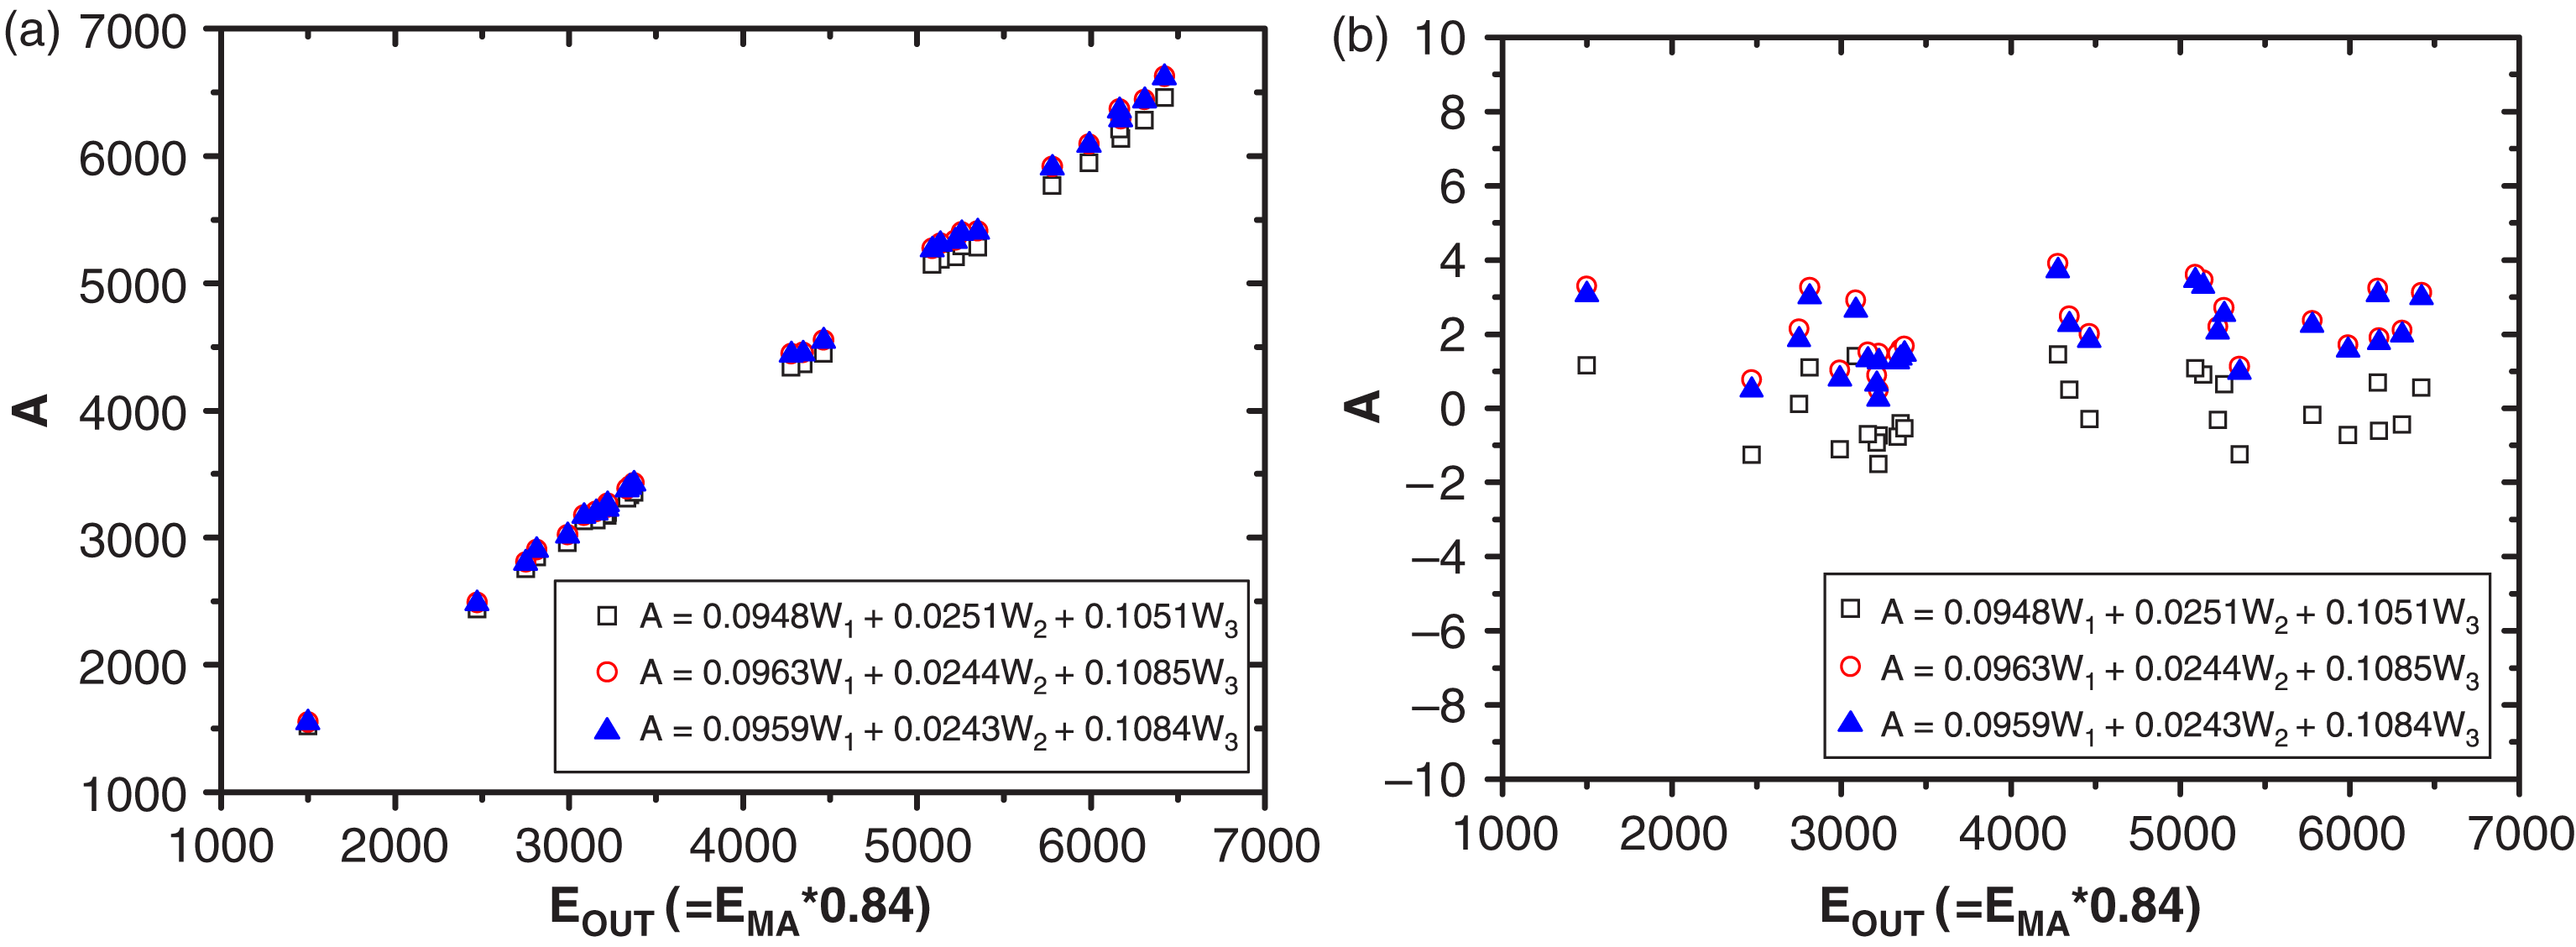
Figure 5. The relationship curve (a) between the total output energy from calibration and that derived from the main amplifier, and (b) their corresponding relative errors.
Table 2. The energy sampling coefficients from two approaches.

In order to verify the accuracy of the calibration data, we accumulate the laser shot
results that follow. More specifically, we use the main amplifier energy to backward
calculate the total energy after the crystal, ![]() $E_{\mathrm{out}}$. After comparing it to the after-crystal energy values from the
sampling coefficient combination, we observe the consistency between the two results.
The energy transmission coefficient between the main amplifier and the frequency
conversion unit is
$E_{\mathrm{out}}$. After comparing it to the after-crystal energy values from the
sampling coefficient combination, we observe the consistency between the two results.
The energy transmission coefficient between the main amplifier and the frequency
conversion unit is ![]() $k_{\mathrm{in}}=0.95$. The transmission coefficient of the frequency conversion unit is
$k_{\mathrm{in}}=0.95$. The transmission coefficient of the frequency conversion unit is ![]() $T=88{\%}$. We assume the transmission rate under different frequencies
conversion efficiency stay the same, then the after-crystal energy,
$T=88{\%}$. We assume the transmission rate under different frequencies
conversion efficiency stay the same, then the after-crystal energy, ![]() $E_{\mathrm{out}}$, can be approximated as:
$E_{\mathrm{out}}$, can be approximated as: ![]() $E_{\mathrm{out}}=TE_{\mathrm{in}}=Tk_{\mathrm{in}}E_{\mathrm{MA}} \approx 0.84E_{\mathrm{MA}}$.
$E_{\mathrm{out}}=TE_{\mathrm{in}}=Tk_{\mathrm{in}}E_{\mathrm{MA}} \approx 0.84E_{\mathrm{MA}}$.

Figure 6. Under different harmonics conversion efficiencies, the relationship curve between (a) the main amplifier energy and the total output energy from the crystal, and (b) their corresponding relative errors.
The experiment results can be seen in figure 5. The hollow squares show that relationship between the derived energy from the
main amplifier energy ![]() $E_{\mathrm{out}}$, and combined energy from three-single wavelength calorimeter readings
using the combination approach. Hollow circles represent the energy sampling
coefficients from the direct calibration, and solid triangles represent the results from
the combinational calibration.
$E_{\mathrm{out}}$, and combined energy from three-single wavelength calorimeter readings
using the combination approach. Hollow circles represent the energy sampling
coefficients from the direct calibration, and solid triangles represent the results from
the combinational calibration.
We can see from figure 5 that, there is a 2% system error between the output energy of the frequency conversion unit using the calibration, and the total output energy derived from the main amplifier. The dispersion of the average deviation is about 2%.
To explain such dispersions, besides the size of our data, also lies within the fact
that the derived energy from main amplifier ![]() $E_{\mathrm{out}}$ is approximate. Since the crystal has a rather large absorption to the
fundamental frequency light, there are some differences in the transmission rate from
the crystal in the frequency conversion unit for different harmonics conversion
efficiencies. figure 6 shows the
relationship curve between the main amplifier energy,
$E_{\mathrm{out}}$ is approximate. Since the crystal has a rather large absorption to the
fundamental frequency light, there are some differences in the transmission rate from
the crystal in the frequency conversion unit for different harmonics conversion
efficiencies. figure 6 shows the
relationship curve between the main amplifier energy, ![]() $E_{\mathrm{MA}}$, representing the total input energy
$E_{\mathrm{MA}}$, representing the total input energy ![]() $E_{\mathrm{in}}$, and the actual measured total energy output,
$E_{\mathrm{in}}$, and the actual measured total energy output, ![]() $E_{\mathrm{out}}$, under various conversion efficiencies. The different marks in the
graph represent only the measurement results at different shot period. Apparently, under
different conversion efficiencies, the transmission coefficients in the frequency
conversion component have variations. The deviation is around
$E_{\mathrm{out}}$, under various conversion efficiencies. The different marks in the
graph represent only the measurement results at different shot period. Apparently, under
different conversion efficiencies, the transmission coefficients in the frequency
conversion component have variations. The deviation is around ![]() $\pm $3%. Therefore the dispersion in figure 5 only represents the deviations in
$\pm $3%. Therefore the dispersion in figure 5 only represents the deviations in ![]() $E_{\mathrm{out}}$. It is also the error introduced by the transmission coefficients of
the frequency conversion unit.
$E_{\mathrm{out}}$. It is also the error introduced by the transmission coefficients of
the frequency conversion unit.
Regarding the system error, the main reason lies in that the fundamental frequency transmission rate in the frequency conversion unit is 88%, (no frequency conversion), in place of the total transmission rate of the frequency conversion unit. When there is significant harmonics conversion efficiency, the total transmission rate increases. That is also the reason why the third-harmonics sampling coefficients derived from the main amplifier is relatively smaller.
5. Conclusions
This article introduces the energy measurement system in a Large-aperture high power laser experiment platform, and its calibration process. The data analysis shows that, regarding the energy balancing coefficients, results obtained from the combinational approach has a higher precision. The energy balance can be controlled within 1%. It can accurately monitor the reliability of the energy sampling efficiency. Regarding the energy sampling coefficients to all the wavelengths after the frequency conversion, the results from direct and the combinational calibration approaches are consistent. But due to the limited number of laser shot missions, there is about 2% system error in the total output energy, along with 2% dispersion. However, the results are guaranteed to ensure the single wavelength energy measurement controlled within the 4.7% uncertainty range. To further improve the energy measurement accuracy of the third-harmonics, it is necessary to have a large number of laser shot statistics. This will be the focus of our future work.
Acknowledgement
This work was supported by the National Natural Science Foundation of China (No. 61377102).

