


Background
Mental health problems during the transition from adolescence into adulthood are a matter of great concern (Leebens and Williamson, Reference Leebens and Williamson2017; Shorey et al., Reference Shorey, Ng and Wong2022). This transitional period is characterized by diverse life paths, developmental milestones, and the creation of new pathways, which can be linked to future psychopathology (Schulenberg et al., Reference Schulenberg, Sameroff and Cicchetti2004). Mental health problems during this period can lead to long-term consequences such as educational dropout, poor labour market attachment and mental health problems in adulthood (Schulenberg et al., Reference Schulenberg, Sameroff and Cicchetti2004; Veldman et al., Reference Veldman, Reijneveld, Hviid Andersen, Nøhr Winding, Labriola, Lund and Bültmann2022). As the prevalence of mental health problems among adolescents has increased in recent decades, concerns today are more and more pressing (Larsen et al., Reference Larsen, Pedersen, Lasgaard, Sørensen, Christiansen, Lundberg, Pedersen and Friis2018; Plana-Ripoll et al., Reference Plana-Ripoll, Momen, Mcgrath, Wimberley, Brikell, Schendel, Thygesen, Weye, Pedersen, Mors, Mortensen and Dalsgaard2022; Shorey et al., Reference Shorey, Ng and Wong2022; The Danish Health Data Authority, 2024). A recent systematic review showed an increase of the global point prevalence of elevated self-reported depressive symptoms from 24% in 2001–2010 to 37% in 2011–2020 (Shorey et al., Reference Shorey, Ng and Wong2022). This trend has also been observed in Denmark, with increases in self-reported mental health problems, mental health-related medication use and mental disorder diagnoses (Larsen et al., Reference Larsen, Pedersen, Lasgaard, Sørensen, Christiansen, Lundberg, Pedersen and Friis2018; Plana-Ripoll et al., Reference Plana-Ripoll, Momen, Mcgrath, Wimberley, Brikell, Schendel, Thygesen, Weye, Pedersen, Mors, Mortensen and Dalsgaard2022; The Danish Health Data Authority, 2024). Many mental disorders have their onset during adolescence and early adulthood. The age of onset of mental disorder diagnoses has decreased since the 1970s. During the 1970s and 1980s, most individuals diagnosed with any mental disorder were aged between 25 and 50 years, while from 2004 the most common age was between 15 and 25 years (Plana-Ripoll et al., Reference Plana-Ripoll, Momen, Mcgrath, Wimberley, Brikell, Schendel, Thygesen, Weye, Pedersen, Mors, Mortensen and Dalsgaard2022). The drivers behind this decrease in age of onset have been widely discussed. Some argue that the thresholds for mental disorder diagnoses have been lowered, that the practice has been improved, while others argue that a psychologization of the society is the reason for more frequent and earlier diagnoses (Katznelson et al., Reference Katznelson, Pless and Görlich2022; Madsen, Reference Madsen2018; Kazda et al., Reference Kazda, Mcgeechan, Bell, Thomas and Barratt2023). Nevertheless, knowledge about the mental health development during this transitional period is of great importance.
From a life course perspective, low socio-economic status (SES) in childhood has been linked to poor mental health later in life (Agerbo et al., Reference Agerbo, Trabjerg, Børglum, Schork, Vilhjálmsson, Pedersen, Hakulinen, Albiñana, Hougaard, Grove, Mcgrath, Bybjerg-Grauholm, Mors, Plana-Ripoll, Werge, Wray, Mortensen and Musliner2021; Lange et al., Reference Lange, Just-Nørregaard and Winding2023; Poulsen et al., Reference Poulsen, Biering, Winding, Aagaard Nohr and Andersen2020; Reiss, Reference Reiss2013). Research has examined not only various SES measures, most commonly income and educational level, but also subjective measures of social status, and the strength of associations with mental health appear to vary across SES measures (Agerbo et al., Reference Agerbo, Trabjerg, Børglum, Schork, Vilhjálmsson, Pedersen, Hakulinen, Albiñana, Hougaard, Grove, Mcgrath, Bybjerg-Grauholm, Mors, Plana-Ripoll, Werge, Wray, Mortensen and Musliner2021; Lange et al., Reference Lange, Just-Nørregaard and Winding2023; Poulsen et al., Reference Poulsen, Biering, Winding, Aagaard Nohr and Andersen2020; Reiss, Reference Reiss2013). This suggests that exploring multiple facets of SES could provide valuable insights into the relationship with mental health. Despite this growing body of evidence, gaps remain in understanding how SES influences mental health during critical developmental periods. While the course of mental health in Denmark has been studied by estimating the age- and sex-specific incidence of mental disorders during childhood and adolescence, SES-specific patterns in the incidence of mental disorders during these life stages remain unknown (Dalsgaard et al., Reference Dalsgaard, Thorsteinsson, Trabjerg, Schullehner, Plana-Ripoll, Brikell, Wimberley, Thygesen, Madsen, Timmerman, Schendel, Mcgrath, Mortensen and Pedersen2020). Additionally, most studies have investigated mental health defined as mental disorder diagnosis; the most severe cases of mental health problems (Dalsgaard et al., Reference Dalsgaard, Thorsteinsson, Trabjerg, Schullehner, Plana-Ripoll, Brikell, Wimberley, Thygesen, Madsen, Timmerman, Schendel, Mcgrath, Mortensen and Pedersen2020; Kessing et al., Reference Kessing, Ziersen, Caspi, Moffitt and Andersen2023). More information is needed on broader aspects of mental health, as self-reported mental health, and medication use, during the transition from adolescence to early adulthood, particularly regarding SES-specific patterns.
To understand the development of mental health during the early life course and to identify adolescents at risk of poor mental health trajectories, studies on depressive symptom trajectories are valuable. A systematic review of depressive symptom trajectories in 15- to 25-year-olds found that most adolescents had consistently low depressive symptoms (60–80%), while 5–12% had consistently elevated symptoms, and 1–5% experienced increasing or decreasing symptoms (Schubert et al., Reference Schubert, Clark, Van, Collinson and Baune2017). Risk factors for consistently elevated depressive symptoms included being female, having a dopamine receptor phenotype, and being a sexual or ethnic minority, whereas good parental support was associated with consistently low symptoms (Schubert et al., Reference Schubert, Clark, Van, Collinson and Baune2017). Minh et al. (Reference Minh, Bültmann, Reijneveld, Van Zon and Mcleod2021) found similar trajectories in Canada and the USA but observed different distributions of childhood SES measures between the two countries. In Canada, depressive symptom trajectories depended less on childhood SES compared to the USA, suggesting that country-level differences may influence how childhood SES affects depressive symptom risk (Minh et al., Reference Minh, Bültmann, Reijneveld, Van Zon and Mcleod2021). Therefore, examining depressive trajectories and their associations with SES and other risk factors in a Danish setting is relevant.
This study aims to investigate the SES patterns in mental health from adolescence to adulthood by examining the mean, prevalence, cumulative incidence and trajectories of several mental health measures, including depressive symptoms, mental disorder diagnosis and medication use. Several SES measures, including subjective social status (SSS) in school and society, income and parental educational level, were used to cover different SES aspects.
Materials and methods
Study design, participants and setting
This present study was conducted within the VestLiv Cohort study, a longitudinal cohort study following a population of adolescents, born in 1989 and living in the western part of Denmark in 2004. A total of 3681 adolescents were invited to participate and 3054 (83%) participated at age 15 years, 2400 (65%) at age 18 years, 2145 (58%) at age 21 years, 2102 (57%) at age 28 years and 1206 (33%) at age 32 years. The geographical area covered by the cohort was rural, consisting of municipalities with towns of less than 30 000 inhabitants. The initial data collection in 2004 used paper questionnaires distributed to all primary schools in the region (Winding et al., Reference Winding, Andersen, Labriola and Nohr2014). Despite the rural context, the social structure of the sample has been shown to be broadly comparable to the general Danish population (Glasscock et al., Reference Glasscock, Andersen, Labriola, Rasmussen and Hansen2013). The surveys consisted of questions about health, family, social life, school, work, and wellbeing. The survey data were linked with register data using unique identification numbers from the Danish Civil Registration System (Schmidt et al., Reference Schmidt, Pedersen and Sørensen2014).
Data
Mental health measures
Three mental health measures were included: depressive symptoms, medication use and mental disorder diagnosis. Depressive symptoms were assessed using the 4-item version of the Center for Epidemiological Studies Depression Scale for Children (CES-DC4) at age 15, 18 and 21 years, and the adult version (CES-D4) at age 28 and 32 years. The four items are each scored from 0 to 3, resulting in a sum score from 0 to 12, with higher scores indicating more depressive symptoms (Fendrich et al., Reference Fendrich, Weissman and Warner1990).
Medication use was defined as prescriptions for psychotropic medication using Anatomical Therapeutic Chemical codes N05A (minus N05AN), N05AN, N05B, N05C, N06A, N06B, N06C (minus N06AX01 and N06AX02), N07BB and N07BC), obtained from the Danish National Prescription Register (Pottegård et al., Reference Pottegård, Schmidt, Wallach-Kildemoes, Sørensen, Hallas and Schmidt2017). The adolescents’ medication use was described as present or not present for each age of interest (age 15–32 years) and within the following categories: young child (age 0–4 years), older child (age 5–12 years), adolescent (age 13–17 years), adult (age 18–32 years) and throughout the study period.
Mental disorder diagnoses were obtained from the Danish National Patient Register from 1995 onwards, i.e. from the age of 6 year in the present population born in 1989 (Mors et al., Reference Mors, Perto and Mortensen2011; Plana-Ripoll et al., Reference Plana-Ripoll, Liu, Köhler-Forsberg, Sørensen and Momen2025; Schmidt et al., Reference Schmidt, Schmidt, Sandegaard, Ehrenstein, Pedersen and Sørensen2015). The register includes diagnoses recorded during all hospital contacts but does not cover consultations in the primary care sector, such as with general practitioners, psychologists, or independent specialist doctors. We included both psychiatric and somatic units as well as both primary and secondary diagnoses. Diagnoses were defined by the ICD-10 codes F10-F69 and F80-F99, excluding organic disorders (F00-F09) and intellectual disabilities (F70-79) given that these disorders either have onset at old ages or are congenital. The mental disorder diagnoses were described as ‘any mental disorder diagnosis’, a dichotomized measure of present/not present for each age of interest (15–32 years) and within the following categories: child (age 6–12 years), adolescent (age 13–17 years), adult (age 18–32 years) and throughout the study period.
Socio-economic status
Four SES measures were included: SSS in School, SSS in society, equalized household income, and parental educational level. SSS in school and SSS in society were measured at age 15 years with the MacArthur Scale of Subjective Social Status—youth version (MacArthur scale). The adolescents were asked to place themselves on a 10-step ladder representing the social hierarchy in their class (SSS in school) and to place their family on a 10-step social ladder representing the society (SSS in society) (Goodman et al., Reference Goodman, Adler, Kawachi, Frazier, Huang and Colditz2001). Three groups of SSS were defined: low (steps 1-4), middle (steps 5-8) and high (steps 9-10). Equalized family income during the 3 years preceding the initial survey in 2004, obtained from the Register of Family Income, was used to measure annual income. The equalized income accounts for household size and age composition by applying equivalence scales. This allows for more accurate comparisons of economic resources across households with differing compositions (Eurostat, Reference Eurostat2025). Three income groups were defined by the OECD definition of income quintile share ratio or the S60/S20 ratio: the low-income group was the families with the 20% lowest income, the high-income group was the families with the 20% highest income and the middle-income group was the families with incomes in between (OECD, 2023). The legal parents’ highest educational level in 2004 was used as measure of parental educational level. Data on both legal parents’ educational level was obtained from Register of the Highest Completed Education (Statistics Denmark, 2024). The highest educational levels of the parents’ were categorized into three groups: the low educational level group contained individuals with completion of up to secondary school (International Standard Classification of Education (ISCED): 0–2), the middle educational level group contained individuals with upper secondary school, vocational education, or short-cycle tertiary education (ISCED: 3–5) and the high educational level group contain individuals with a bachelor’s degree or higher (ISCED: 6–8).
Covariates
Based on the existing literature and discussions with experts working with adolescents with mental health problems, the following covariates were included: school pressure, social support from teachers, social support from classmates, bullying and parents’ support, sex, country of origin, family history of poor mental health, multimorbidity in family, multimorbidity in the adolescent and parental cohabitation (Details in Supplementary 1) (Balvig, (Reference Balvig2000), Currie and Alemán-Díaz, Reference Currie and Alemán-Díaz2015, Oecd, 2016, Kristensen et al., Reference Kristensen, Lund, Jensen, Broe, Rotbain, Damkier, Pottegård, Andersen, Højlund, Olesen, Rasmussen, Hansen, Ernst, Wesselhoeft, Henriksen, Reilev, Bliddal and Hallas2022).
Statistical methods
Missing data and participation into the survey
To address potential selection bias, multiple imputations (MI) with chained equations and inverse probability weights (IPW) were used (Details in Supplementary 2).
Descriptive statistics
For each SES measure, the mean values of the sum score of depressive symptoms across all survey waves, medication use prevalence across age 15–32 years, and the cumulative incidence of any mental disorder diagnosis across age 15–32 years were calculated with 95% confidence intervals (CI). The prevalence of medication use for ages 15–17 years were presented together because of the small numbers of observations. Individuals with any medication use before age 15 years were excluded from the analyses of medication use prevalence and individuals with mental disorder diagnosis before age 15 years were excluded from the analyses of cumulative incidence of mental disorder diagnosis to avoid reverse causality.
Mental health trajectories
Mental health trajectories from ages 15–32 years were determined using Group-Based Trajectory Modelling (GBTM) (Dalsgaard et al., Reference Dalsgaard, Thorsteinsson, Trabjerg, Schullehner, Plana-Ripoll, Brikell, Wimberley, Thygesen, Madsen, Timmerman, Schendel, Mcgrath, Mortensen and Pedersen2020; Sánchez-Gelabert, Reference Sánchez-Gelabert2023). The analyses were conducted on depressive symptoms scores (CES-D(C)4). First, the optimal number of groups was taken based on the Bayesian information criteria (BIC) and the minimum group sizes of all groups above 5%. Second, the optimal shape of the trajectories was determined by combining all different opportunities of linear, quadratic and cubic trajectories. The optimal combination was the model with the lowest BIC, no groups smaller than 5%, average posterior probability of assignments (APPA) values > 70% for each group, and odds of correct classification (OCC) > 5.0 for each group (Sánchez-Gelabert, Reference Sánchez-Gelabert2023). Third, the population was assigned membership of the trajectory group that they have the highest probability of belonging to and descriptive statistics of the members of each trajectory group was presented. Logistic regression was used to calculate the relative odds ratio (ROR) of membership to each of the trajectory groups compared with the low stable group for each of the characteristics.
Sensitivity analysis
A sensitivity analysis was conducted to investigate how a change in the definition of income groups, using tertiles of income, affects the results (Kempel et al., Reference Kempel, Winding, Böttcher and Andersen2022; Poulsen et al., Reference Poulsen, Biering, Winding, Aagaard Nohr and Andersen2020).
All statistical analyses are performed in Stata Version 18.0. Plots and graphs are performed in R Studio (Version 4.4.1).
Results
Participants
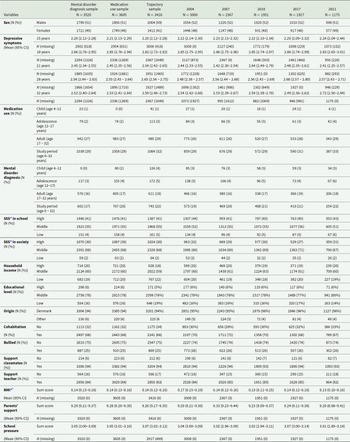
The VestLiv sample consisted of 3681 individuals, of which 81.5% (2004) to 31.9% (2021) were included in the descriptive analyses of depressive symptoms. In the descriptive analyses, 97.9% were included in the medication use sample, 96.7% in the mental disorder diagnosis sample and 92.8% in the trajectory sample (Supplementary F1). Attrition analyses showed that non-responders were more often males, with low SES across all SES measures, used psychotropic medication, and more often were having a mental disorder diagnosis in the study period, which resulted in largest IPW’s in persons with these characteristics. After imputations and weighting, only minor differences were found in the distributions of the characteristics between the samples (Table 1). For example, the proportion of males ranged between 51% and 52% in the diagnosis sample, the medication sample, and the survey samples from 2004, 2007, 2010, 2017 and 2021, while the proportion of males differed slightly in the trajectory sample with 59% (Details of characteristics without imputations and IPW in Supplementary T1).
Table 1. Characteristics of samples (imputed and weighted data)
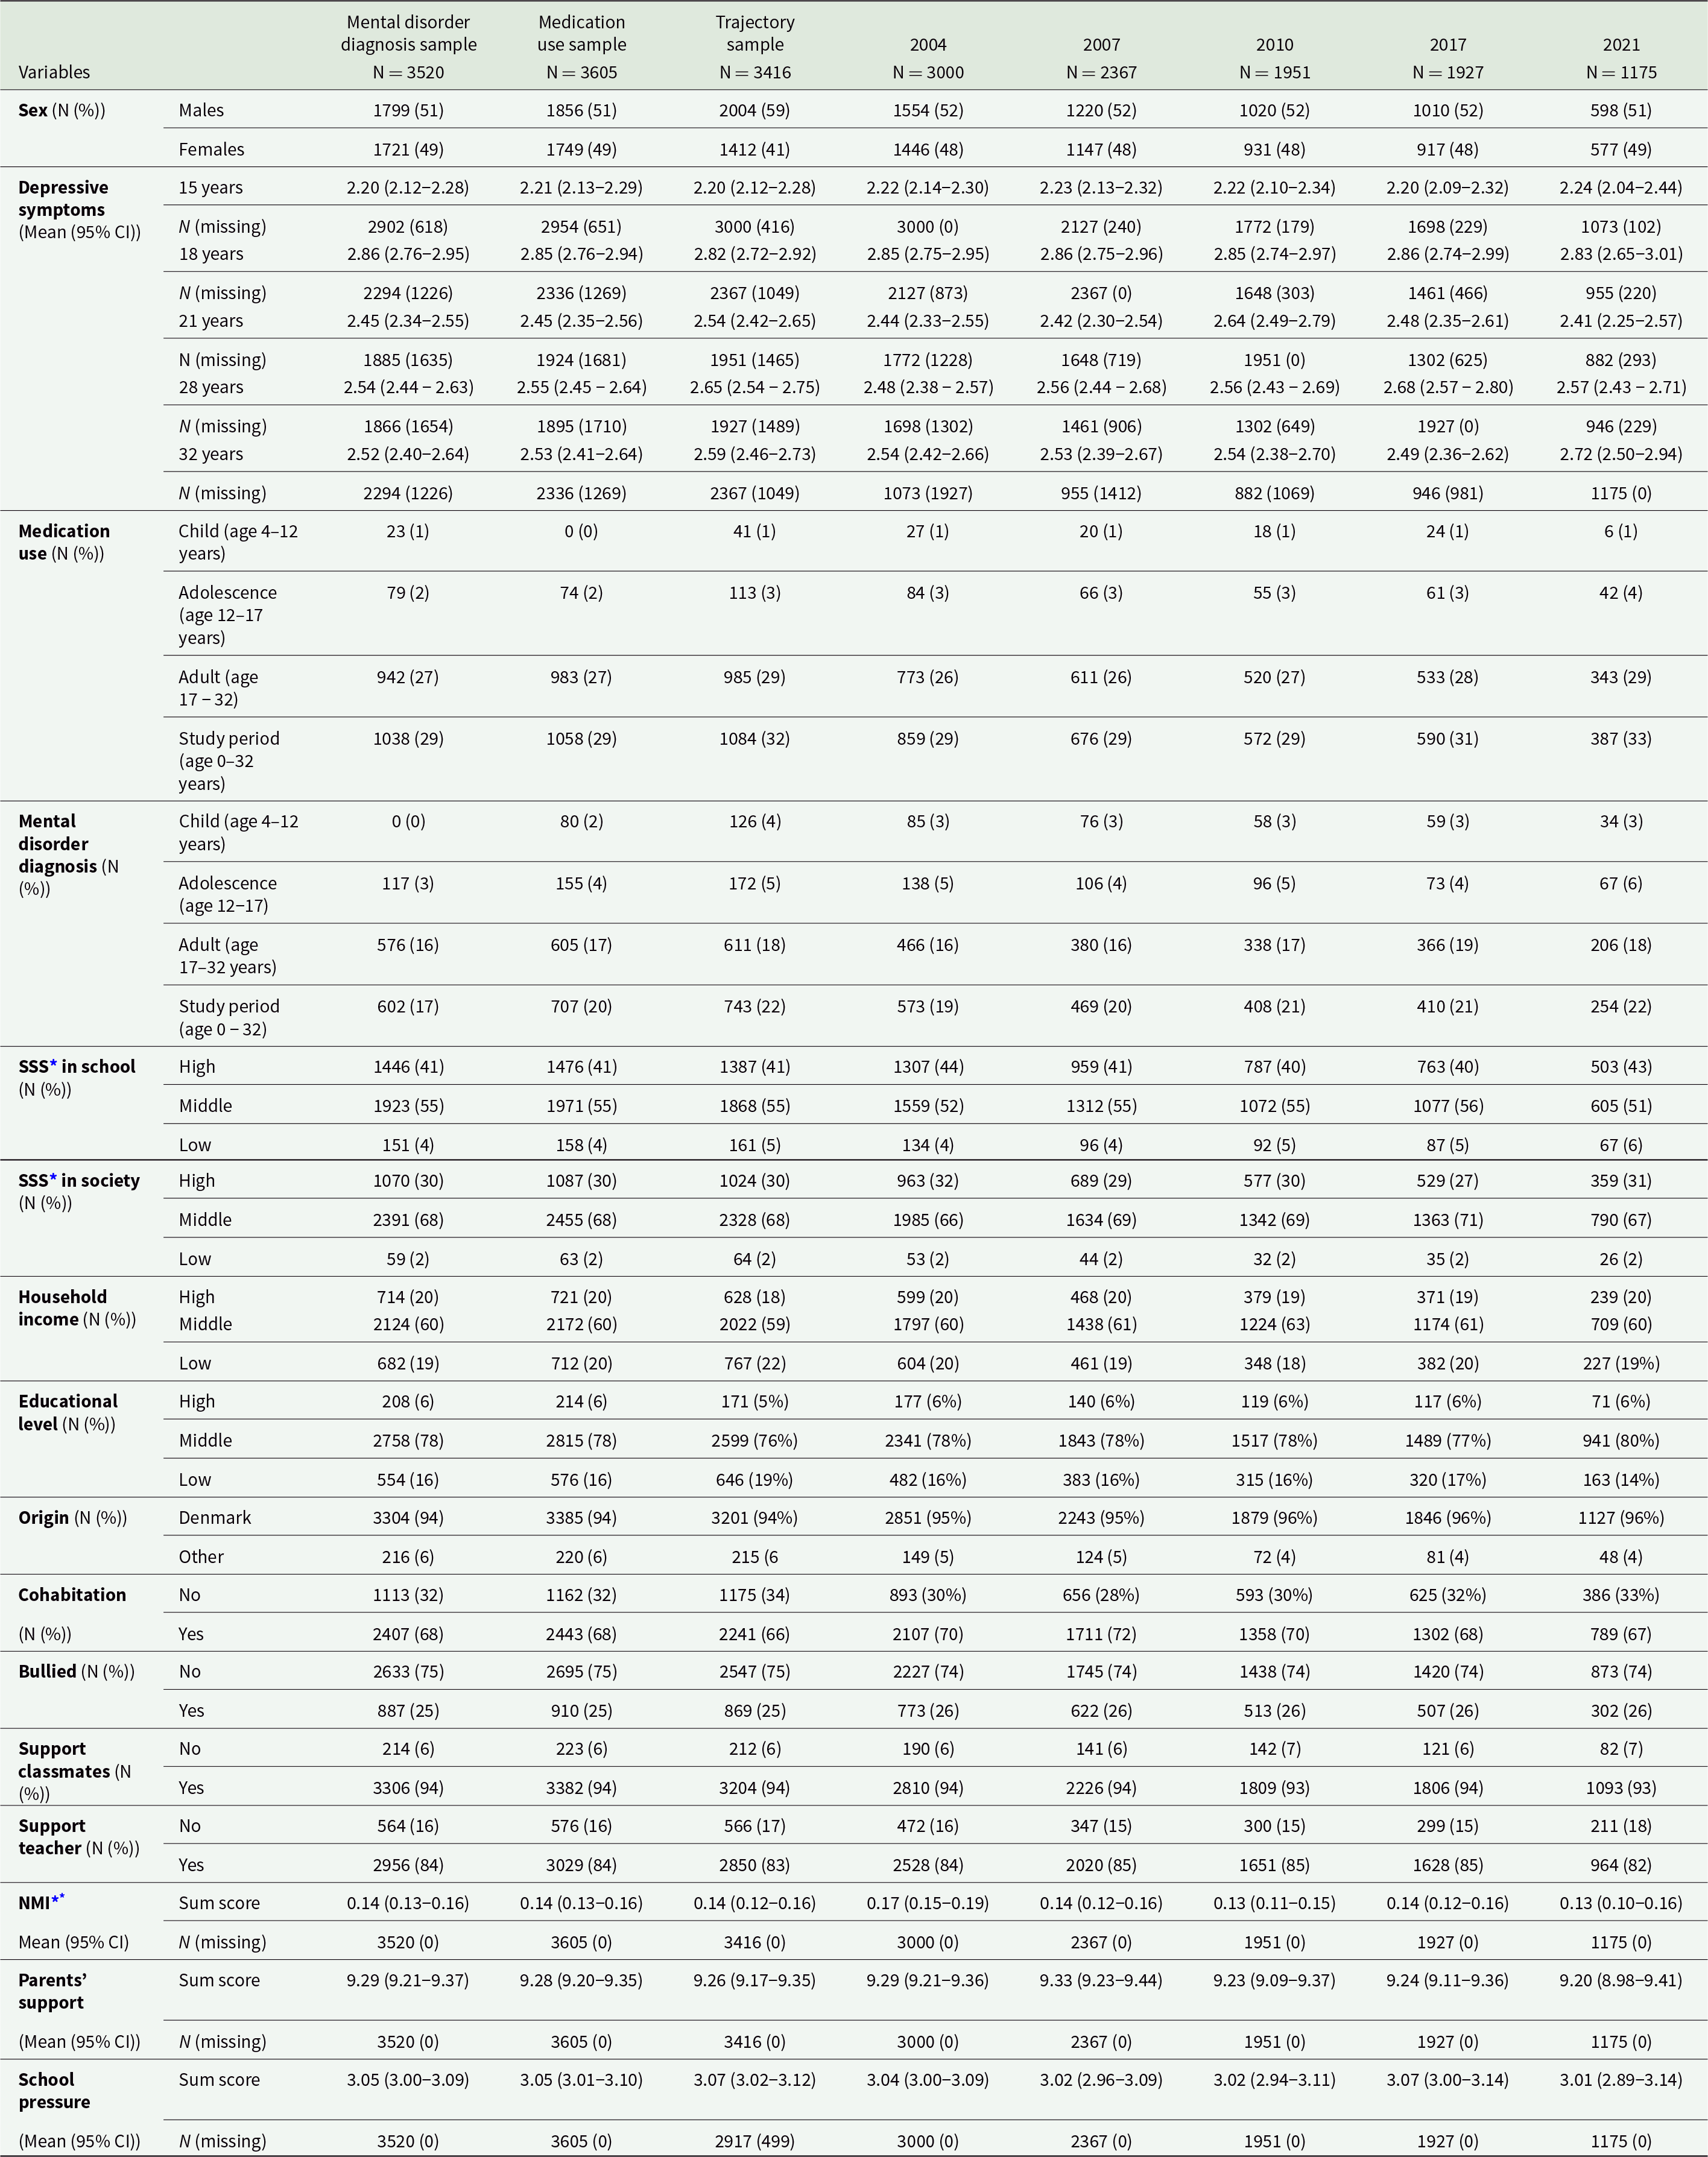
* SSS = Subjective Social Status, **NMI = Nordic Morbidity Index
SES-specific patterns
The low SES group, particularly individuals reporting low SSS in school, tended to have the highest mean depressive symptoms score across all ages. When examining parental educational level and household income, the mean scores for the SES groups were nearly identical at ages 15 and 18 years, with similar means across all ages for educational level groups (Fig. 1).
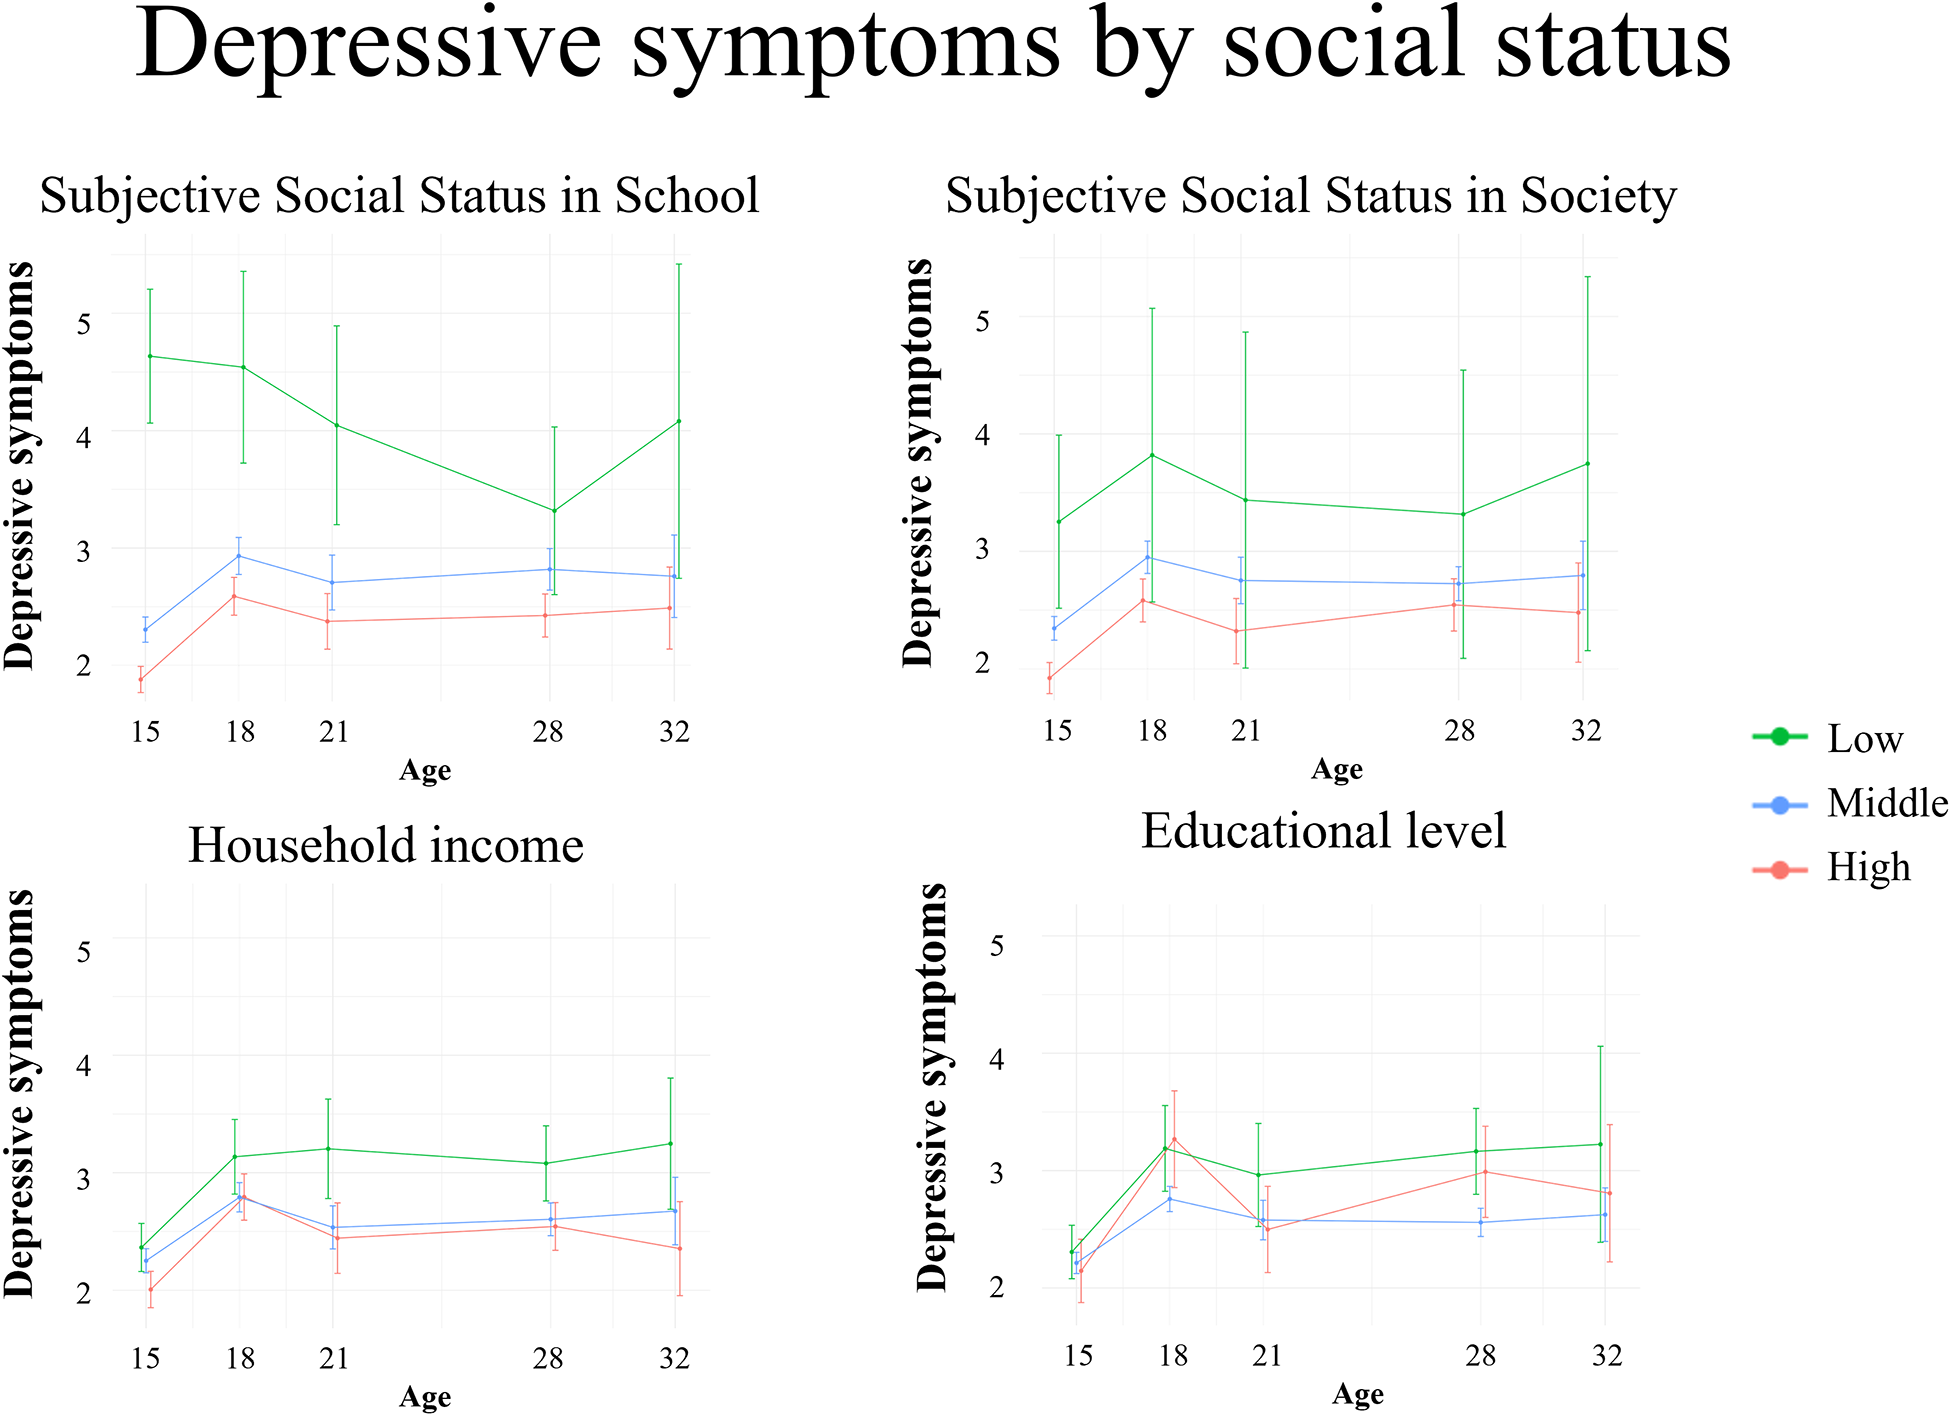
Figure 1. Prevalence of depressive symptoms stratified by SES measures.
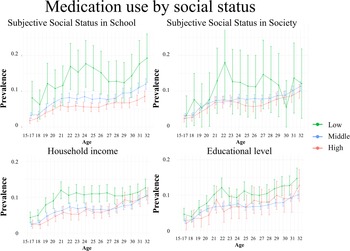
For medication use, the highest prevalence was found in the low SES group across all ages and across all SES measures (Fig. 2).
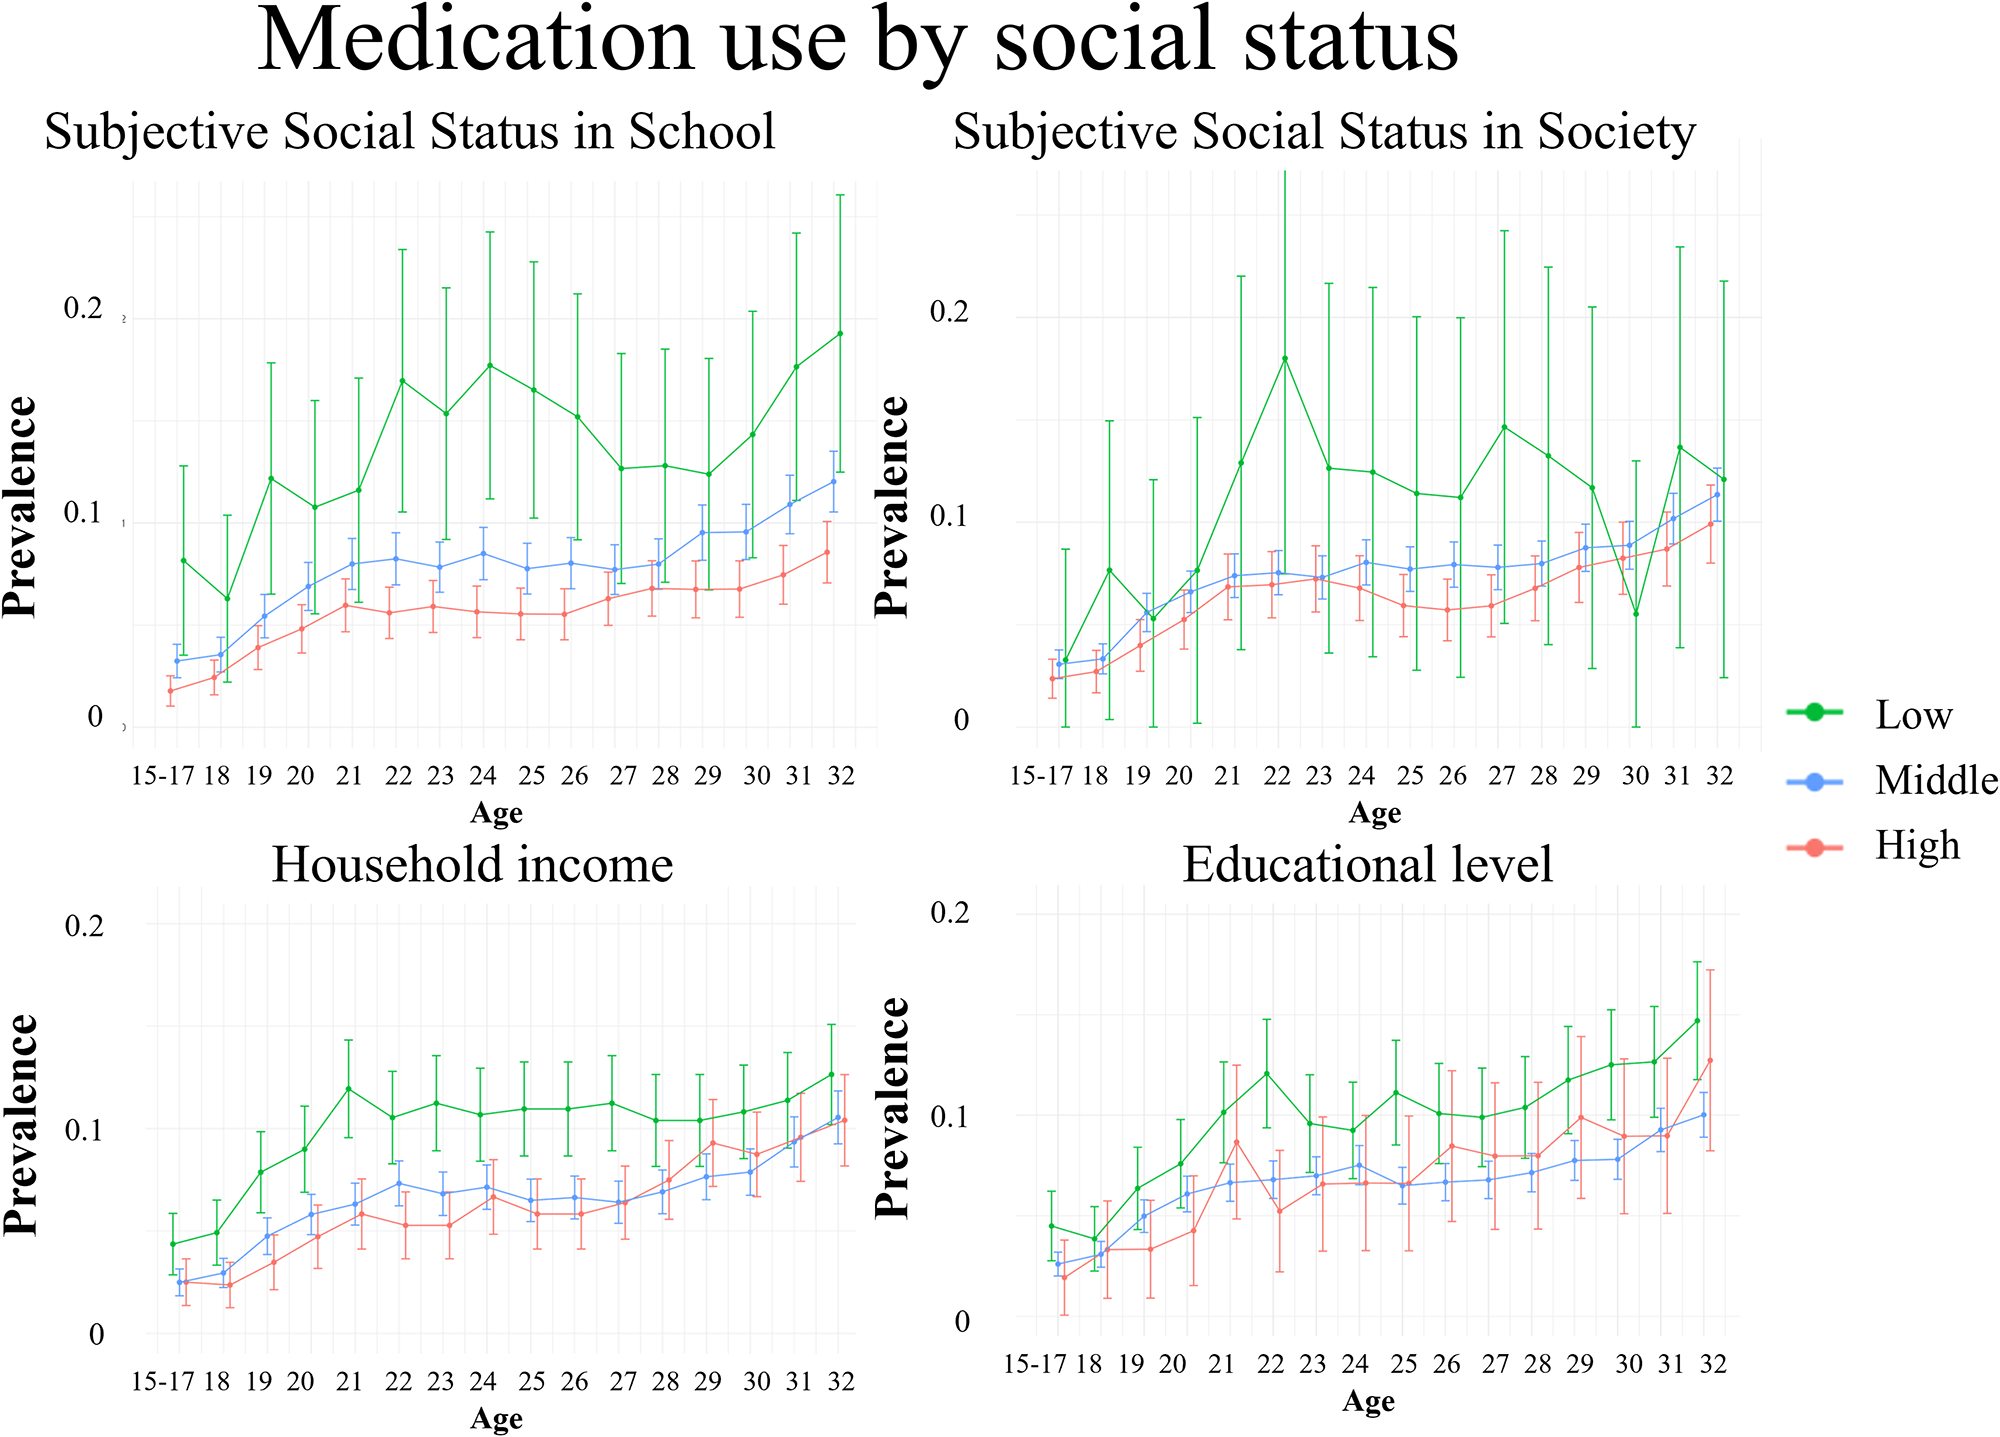
Figure 2. Prevalence of medication use stratified by SES measures.
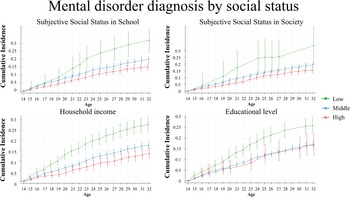
The low SES group showed the highest incidence of mental disorder diagnosis across all ages and SES measures, while the middle and high SES groups showed comparable and lower incidences. At age of 32 years, the highest incidence of mental disorder diagnosis was found in the low SSS society group with 0.34 (CI: 0.21–0.48) and the low SSS school group with 0.32 (CI: 0.24–0.40) (Supplementary T2). When examining SES by parental educational level, the incidences of mental disorder diagnosis were comparable between the SES groups until age 19 years, then, at later ages, the low group had higher incidences (Fig. 3).
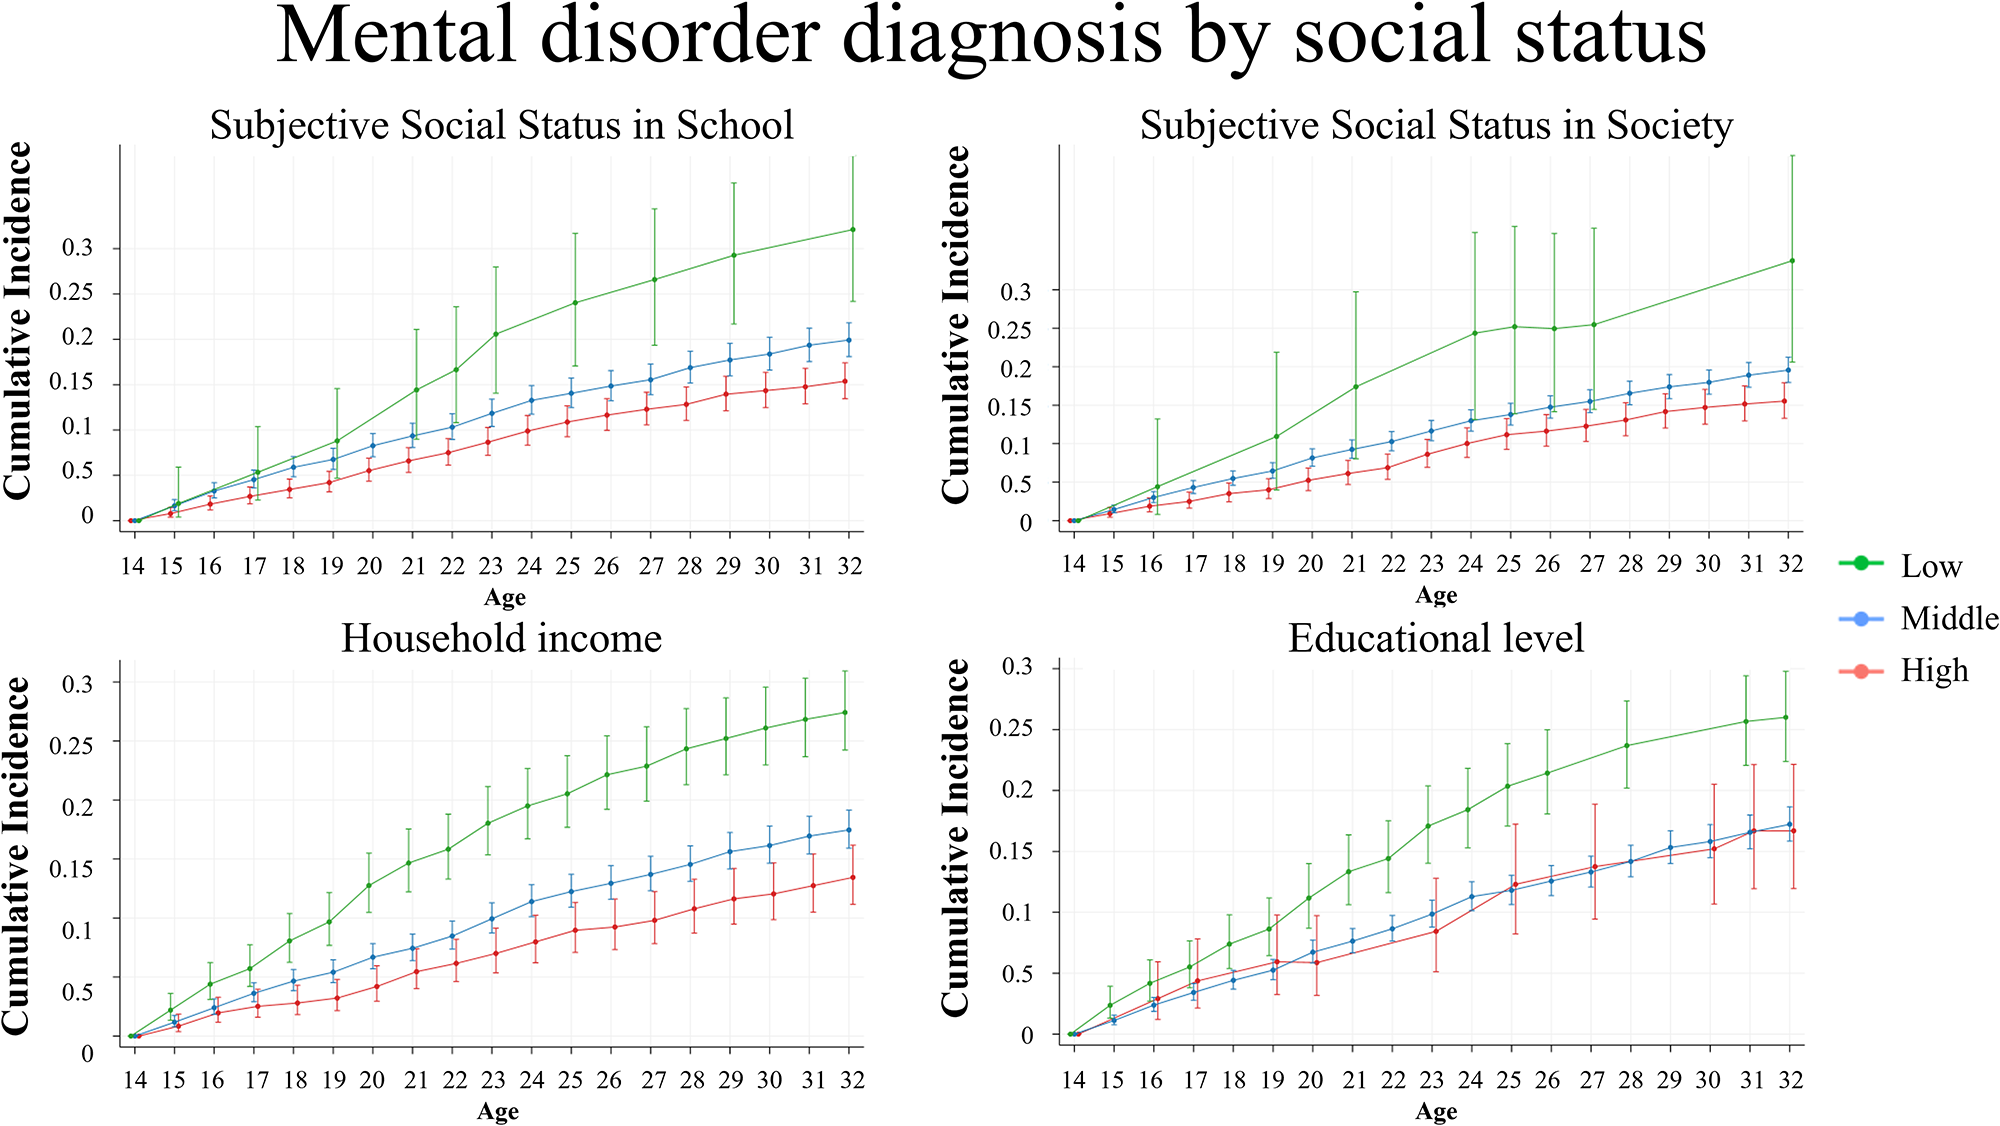
Figure 3. Cumulative incidence of first mental disorder diagnosis stratified by SES measures.
Sex-stratified analyses of depressive symptoms, medication use, and mental disorder diagnosis showed no differences in the SES-specific courses. The sensitivity analyses showed no difference in the results when using tertiles for income.
Developmental trajectories
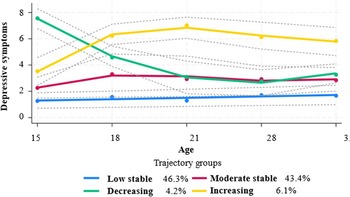
By evaluating the BIC and group sizes, four groups were found most suitable for modelling trajectories of depressive symptoms from ages 15 to 32 years. APPA and OCC values were calculated for the 10 models with the lowest BIC value and with no groups containing less than 5% of the population (Supplementary T3). Based on the BIC, the group size, the APPA values and the OCC values, a model with four trajectory groups with the following shapes linear, cubic and quadric was build: low stable (46.3%), moderate stable (43.4%), decreasing (4.2%) and increasing trajectory (6.1%) (Fig. 4). The BIC value was –18 739 and the lowest among the tested models. The low stable and moderate stable trajectories had OCC values of 3.51 and 2.68, both below the recommended limit of 5, while the APPA value for the moderate stable trajectory was 65.5, also below the recommended limit of 70.

Figure 4. Depressive symptoms trajectories with 95% confidence intervals (dotted lines) and averages (dots) at ages 15–32 years.
Characteristics of trajectory membership
Based on the highest probability, the individuals were assigned to the four trajectory groups. Descriptive results showed differences in the characteristics of the individuals in the four trajectory groups (Supplementary T4). The highest proportion of men was found in the low stable trajectory (58%), while the highest proportion of women was found in the decreasing trajectory (70%). Medication use and mental disorder diagnosis during the study period was most frequent in the increasing trajectory (60% and 41%) and the decreasing trajectory (47% and 36%) and less frequent in the low stable trajectory (22% and 15%) and moderate stable trajectory (31% and 20%). Regarding SES, the results showed the highest proportion of low SSS in school in the decreasing trajectory (22%), the highest proportions of low SSS in society in the decreasing and increasing trajectory (4%), the highest proportions of low educational level in the moderate stable and increasing trajectory (7%), and highest proportion of low-income in the low stable trajectory (22%). Generally, the increasing trajectory had the lowest proportions of social support measures.
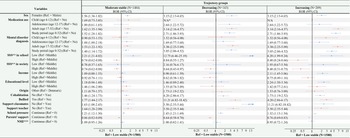
Table 2 presents relative odds ratios (ROR) and 95% CI with two-level comparisons: each trajectory group versus the low stable trajectory and the characteristics to their reference. Being female, receiving medication in adulthood and during the study period, having a mental disorder diagnosis in adulthood and during the study period, having low SSS school, having parents not living together, being bullied, lacking support from classmates, lacking support from teachers, lower parental support and higher school pressure were associated with a higher ROR of membership in other trajectory groups compared to the low stable group. Moreover, experiencing high SSS in society resulted in a lower ROR of membership to the other groups compared to the low stable trajectory.
Table 2. Relative odds ratios (ROR) with 95% confidence intervals (95% CI) of membership to the different trajectory groups compared to the low stable groups for each characteristic
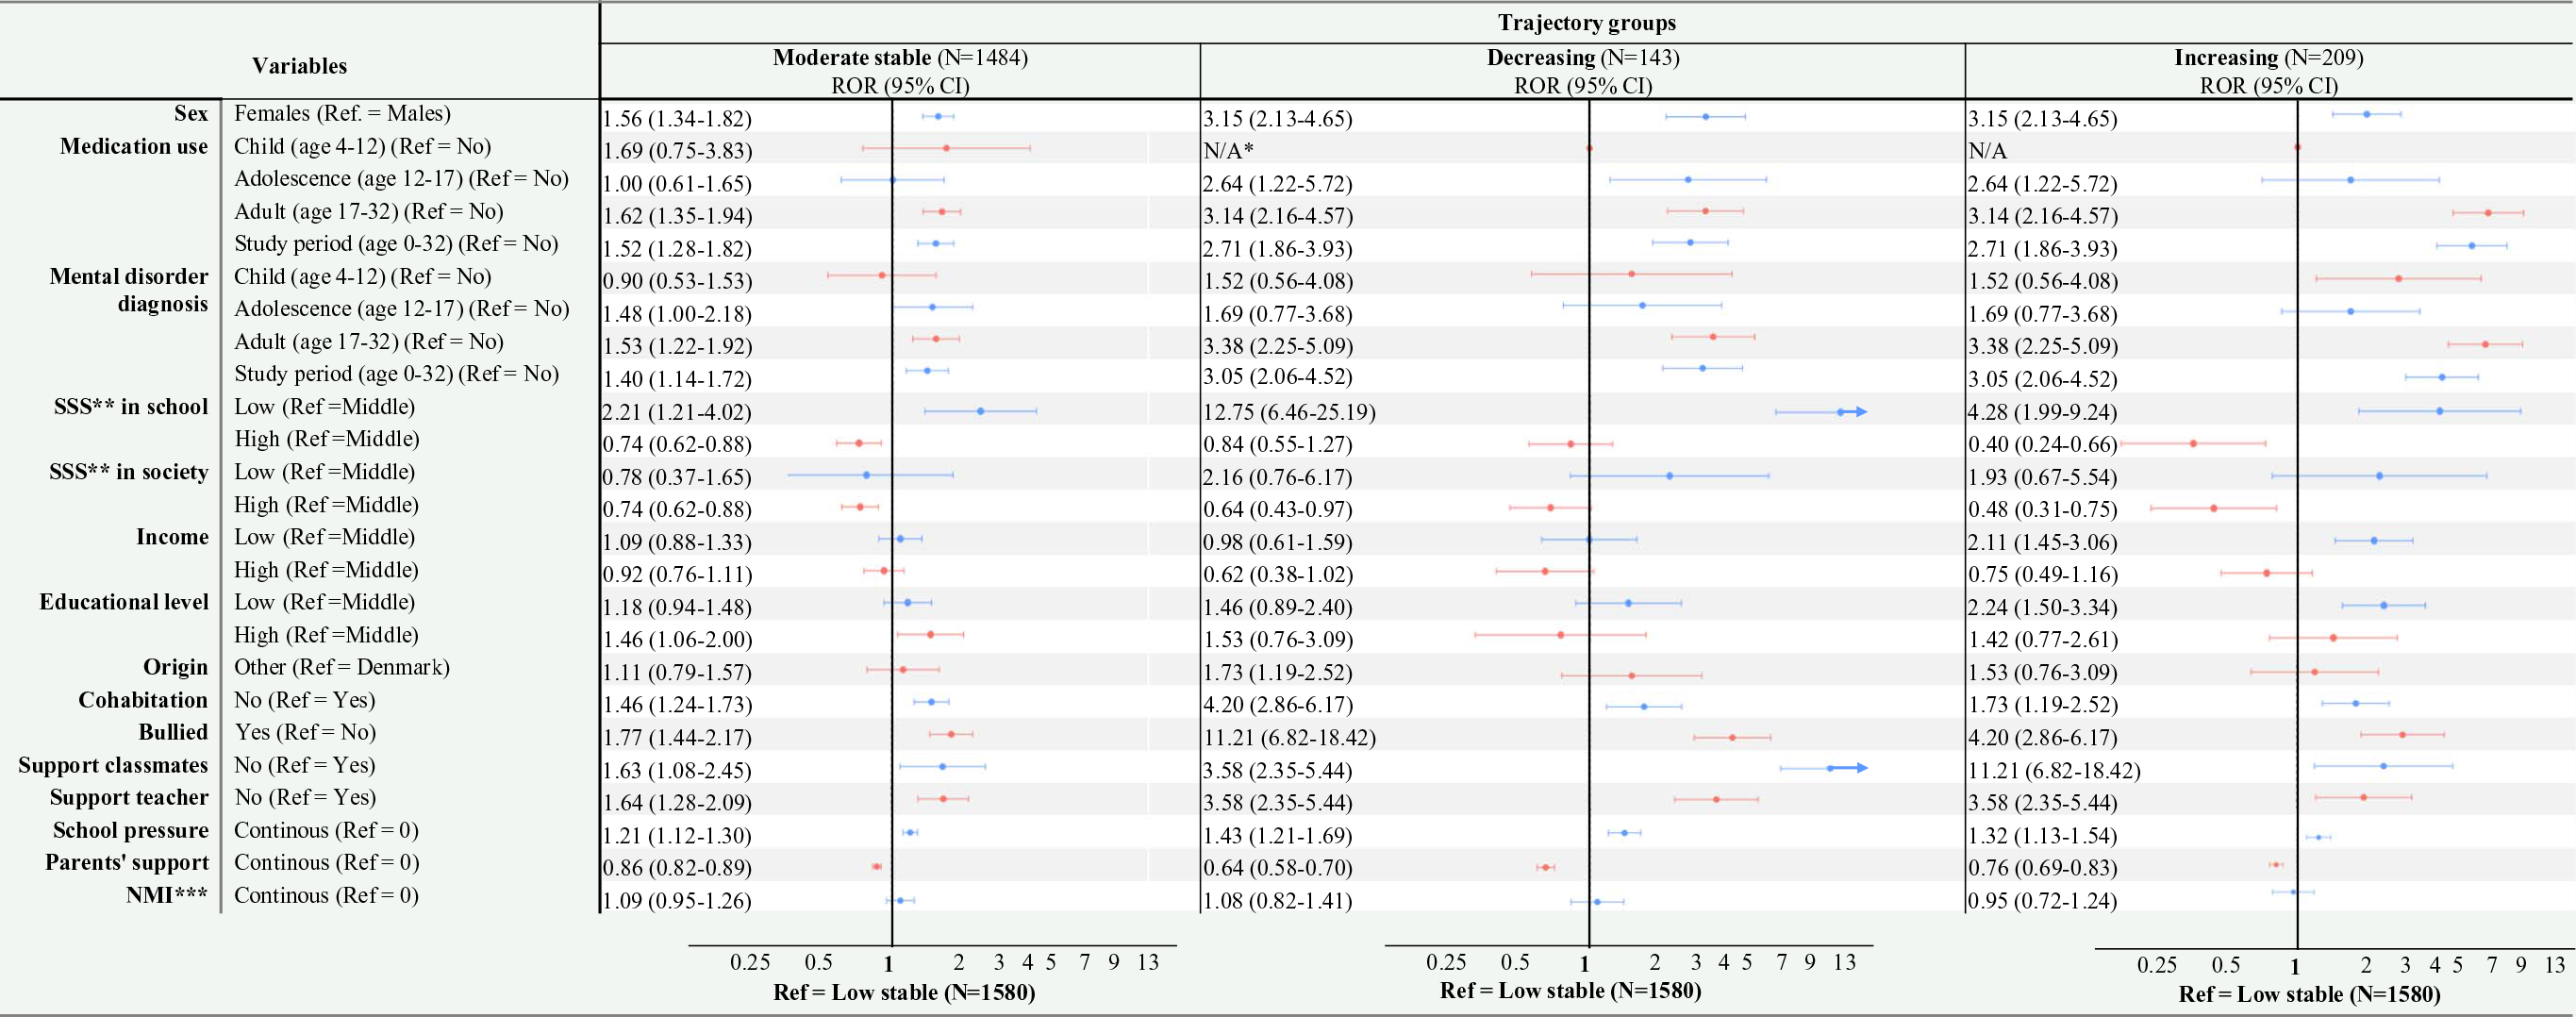
*No observations of medication use in childhood in the decreasing and increasing group, ** SSS = Subjective Social Status, ***NMI = Nordic Morbidity Index
Note: Data are imputed and weighted
Receiving a mental disorder diagnosis in adolescence and a high parental educational level were associated with a higher ROR of membership in the moderate stable trajectory compared to the low stable trajectory, while reporting high SSS school was associated with a lower ROR of membership of the moderate stable trajectory compared to the low stable trajectory. Additionally, receiving medication in adolescence was associated with a higher ROR of membership in the decreasing trajectory compared to the low stable trajectory. Receiving medication in adolescence, receiving a mental disorder diagnosis in childhood and adolescence, low-income and low parental educational level were associated with a higher ROR of membership in the increasing trajectory compared to the low stable trajectory, while high SSS school was associated with a lower ROR of membership in the increasing trajectory compared to the low stable trajectory.
Discussion
Individuals with a low SES at age 15 years, measured by SSS school, SSS society, household income and parental educational level showed higher mean depressive symptoms, a higher prevalence of medication use and a higher cumulative incidence of mental disorder diagnosis through adolescence and adulthood (age 15–32 years). Four trajectory groups were identified for depressive symptom trajectories: low stable, moderate stable, decreasing and increasing trajectory. Odds of membership to trajectories of moderate stable, decreasing and increasing depressive symptoms were generally higher compared to the low stable trajectory for females, for low social status, for low social support, and for adolescents with other mental health outcomes.
Overall, the low SES groups showed a higher prevalence and incidence of negative mental health outcomes compared to the middle and high SES groups. The tendencies were most pronounced for the SSS measures and less clear for income and parental educational level measures. This could be explained by the low SSS groups only containing about 5% of the population, while the low-income and low education groups were larger, resulting in the low SSS group representing a more extreme segment of low social status than the other measures. However, a sensitivity analysis showed that shifting the low-income group to include the lowest 5% did not alter the results.
The prevalence of medication use may have changed since the present cohort was initiated in 2004, particularly for individuals up to 24 years old, due to a regulation introduced in 2014. This regulation requires young individuals to consult a psychiatrist rather than obtaining an antidepressant prescription from their general practitioner (Ministry of the Interior and Health, 2014). As a result, the prevalence of medication use among individuals under 24 years old may have decreased since 2014.
A Danish study by Dalsgaard et al. on a younger cohort of 18-year-olds found a cumulative incidence of any mental disorder of 0.15 (CI: 0.15–0.15). In contrast, Beck et al. reported cumulative incidences of mental disorder diagnoses at age 80 years of 0.31 (CI:0.31–0.31) for males and 0.34 (CI: 0.34–0.35) for females (Beck et al., Reference Beck, Pedersen, Plana‐Ripoll, Dalsgaard, Debost, Laursen, Musliner, Mortensen, Pedersen, Petersen, Yilmaz, Mcgrath and Agerbo2024; Dalsgaard et al., Reference Dalsgaard, Thorsteinsson, Trabjerg, Schullehner, Plana-Ripoll, Brikell, Wimberley, Thygesen, Madsen, Timmerman, Schendel, Mcgrath, Mortensen and Pedersen2020). These results differ from the present study, which estimated a cumulative incidence of 0.19 (CI: 0.17–0.20). A key distinction between our study and the earlier Danish studies lies in the age of the studied cohorts, which likely explains the observed differences in incidence rates. Specifically, the lower incidence reported by Dalsgaard et al. reflects their younger cohort, while the higher incidence observed by Beck et al. corresponds to their older cohort. Additionally, several other factors may contribute to the discrepancies with Beck et al.’s results. First, the geographical location of the study population in Western Jutland, as it is known that individuals living further from hospitals are less likely to receive a mental disorder diagnosis compared to those living closer to hospitals, which might explain the higher results found by Beck et al. in the nationwide cohort (Blæhr et al., Reference Blæhr, Gallo Cordoba, Skipper and Søgaard2024; Dalsgaard et al., Reference Dalsgaard, Thorsteinsson, Trabjerg, Schullehner, Plana-Ripoll, Brikell, Wimberley, Thygesen, Madsen, Timmerman, Schendel, Mcgrath, Mortensen and Pedersen2020; Madsen et al., Reference Madsen, Ersbøll, Olsen, Parner and Obel2015). Second, our cohort is born in 1989, while the Beck et al. included individuals born in 1995-2016 (Beck et al., Reference Beck, Pedersen, Plana‐Ripoll, Dalsgaard, Debost, Laursen, Musliner, Mortensen, Pedersen, Petersen, Yilmaz, Mcgrath and Agerbo2024); thus, temporal shifts in the age of onset may play a role, with more recent cohorts being diagnosed at younger ages than the cohort included in our study (Plana-Ripoll et al.). Third, we only obtained mental disorder diagnosis from 1995 for individuals born in 1989, since The Danish Psychiatric Central Research Register included only outpatient data since 1995. As a result, some individuals may have had a diagnosis during the first six years of their life that we did not include (Mors et al., Reference Mors, Perto and Mortensen2011).
Like many other studies, the present study identified four trajectory groups. Shubert et al. showed that most trajectory studies on depressive symptoms in late adolescence and adulthood typically report 3 to 4 trajectory groups, with most identifying a low stable trajectory, along with a moderate stable group (Schubert et al., Reference Schubert, Clark, Van, Collinson and Baune2017). The combination of decreasing, increasing and low stable trajectories as identified in the present study has been reported before (Diamantopoulou et al., Reference Diamantopoulou, Verhulst and Van Der Ende2011; Essau et al., Reference Essau, De La Torre-Luque, Lewinsohn and Rohde2020; Minh et al., Reference Minh, Bültmann, Reijneveld, Van Zon and Mcleod2021; Wickrama et al., Reference Wickrama, Wickrama and Lott2009; Williams and Merten, Reference Williams and Merten2014), though few studies have reported a moderate stable trajectory group within this combination (Costello et al., Reference Costello, Swendsen, Rose and Dierker2008; Wickrama and Wickrama, Reference Wickrama and Wickrama2010). Most studies in the review reported a high stable group, which differs from the finding of the present study (Schubert et al., Reference Schubert, Clark, Van, Collinson and Baune2017). As the present study, several studies have identified female sex as a risk factor for trajectories with higher levels of depressive symptoms (Costello et al., Reference Costello, Swendsen, Rose and Dierker2008; Essau et al., Reference Essau, De La Torre-Luque, Lewinsohn and Rohde2020; Minh et al., Reference Minh, Bültmann, Reijneveld, Van Zon and Mcleod2021; Schubert et al., Reference Schubert, Clark, Van, Collinson and Baune2017), and also low SES has been identified as a risk factor (Costello et al., Reference Costello, Swendsen, Rose and Dierker2008; Ferro et al., Reference Ferro, Gorter and Boyle2015; Minh et al., Reference Minh, Bültmann, Reijneveld, Van Zon and Mcleod2021; Wickrama et al., Reference Wickrama, Wickrama and Lott2009). However, in aforementioned studies the timing of measuring SES during the life course differed from childhood SES to adolescent SES, like in the present study, which might affect the size of the association. A previous Danish study showed that the timing of SES measurement was associated with depressive symptoms, with the strongest associations observed between low-income in early childhood (age 0–8 years) and depressive symptoms at age 21 years, as well as low maternal labour market participation during late childhood (age 9–14 years) and depressive symptoms at age 21 (Poulsen et al., Reference Poulsen, Biering, Winding, Aagaard Nohr and Andersen2020). Therefore, an earlier timing of SES measurement in the present study might result in stronger associations.
The study has several strengths. First, the use of register data on mental health with almost complete information limits the risk of selection bias. Second, the participation in the early waves of the survey was high (81.5% in 2004), which also limits the risk of selection bias. The use of IPW, built on rich register data and data from earlier waves, to correct for selection bias limits the risk of selection bias further, especially in the later waves of the surveys where the drop out is a larger problem. Third, the use of MI to account for missing data on the covariates limits the number of individuals excluded from the population. The fact that the MI are based on register information and survey information with limited amount of missing data, especially in the early waves, strengthens the quality of the MI. Forth, the use of several SES measures to capture different aspects of social status is a strength. The SSS measures showed poor correlation with income and education, which underlines that the measures cover different aspects of SES.
Some limitations of the study need to be addressed. First, the geographical area of the study population can limit the external validity, since the study population lives in a mostly rural area in 2004, and there might be differences in the constructs of social status and mental health from urban to rural areas. Second, some risk of reverse causality is present, as the depressive symptoms at age 15 years and the SSS measures are measured at the same time. Third, the measurement of depressive symptoms has shown poor psychometric properties in children, with poor reliability and acceptable structural validity (Sørensen et al., Reference Sørensen, Grønborg and Biering2022). The short four-item version of the CES-D has not been tested in adults. Therefore, the level of depressive symptoms should be interpreted with caution. Moreover, no validated cut-points of The MacArthur Scale exist. Earlier studies have used the categorization of low (steps 1–3), middle (steps 4–7) and high (steps 8–10) (Lange et al., Reference Lange, Just-Nørregaard and Winding2023; Poulsen et al., Reference Poulsen, Biering, Winding, Aagaard Nohr and Andersen2020). However, in the samples in the present study this categorization resulted in a large high group and very small low group and therefore this categorization did not seem appropriate. Studies on the construct validity and the appropriate cut-points of the scale are requested to ensure appropriate interpretation of the scale. Forth, the APPA and OCC fit was not within the recommended limits on 70% and > 5.0 for the moderate stable group (APPA = 65%, OCC = 2.7) and the low stable group (OCC = 3.6), i.e., the results should be interpreted with caution.
These findings highlight the relevance of targeting adolescents with low SES in mental health prevention efforts, particularly those with low SSS. The two SSS measures reflect perceptions of the adolescents’ social standing in school and society respectively and therefore, the measures may capture vulnerable individuals not identified by traditional SES indicators such as income or parental education. Additionally, the strong association between low social support and more negative depressive symptom trajectories suggests that improving social support could be a promising avenue for intervention. Strengthening social support may also positively influence SSS, which encompasses not only academic or occupational achievement but also social relationships.
Conclusion
Individuals with low SES – particularly low SSS – experienced more negative mental health outcomes than individuals with middle or high SES from adolescence to adulthood (age 15–32 years). This indicates that subjective measures of social status may capture vulnerable individuals not identified by traditional SES indicator such as income and education. Odds of membership to trajectories of less favourable depressive symptoms – the moderate stable, decreasing, or increasing – compared to the low stable trajectory, were generally higher for females, individuals with low SES, individuals with low social support, and individuals with other mental health outcomes.
Preventive initiatives should focus on these high-risk groups. Notably, individuals in the increasing trajectory reported the lowest levels of social support, indicating that strengthening social networks for vulnerable adolescents may be particularly important for shaping long-term mental health trajectories.
Supplementary material
The supplementary material for this article can be found at https://doi.org/10.1017/S2045796025100073.
Data Availability Statement
Data have been made available for the first author specifically via Statistics Denmark and can therefore not be shared. The codes are available from the corresponding author on reasonable request.
Acknowledgements
We are grateful for the adolescents who took time to respond the questionnaires in the VestLiv.
Author contributions
C.L.B.S.: Conceptualization; Methodology; Formal analysis; Investigation; Project administration; Writing – Original draft preparation; Writing – Reviewing and Editing. K.B.: Conceptualization; Methodology; Supervision, Writing – Reviewing and Editing. T.N.W., O.P.R., U.B., P.B.S.: Conceptualization; Methodology; Writing – review & editing.
Financial support
This work was supported by KV fonden and Sygeforsikring Danmark (Grant number 2021-0105).
Conflict of Interest
None reported.
Ethical standards
The authors assert that all procedures contributing to this work comply with the ethical standards of the relevant national and institutional committees on human experimentation and with the Helsinki Declaration of 1975.


 Open access