INTRODUCTION
The increased use of antimicrobials has been identified as one of the main risk factors for the emergence and dissemination of antimicrobial-resistant bacteria and resistance genes [Reference van den Bogaard and Stobberingh1]. Misuse and overuse of antimicrobials in food-animal production is thought to be a major risk factor for the development of resistant bacterial populations [Reference Aarestrup2, Reference Wise3], which has resulted in the implementation of several risk management strategies worldwide in an attempt to limit the emergence and spread of resistant bacteria through the food chain.
Data on antimicrobial usage is essential for (1) risk analyses on association between consumption and development of resistance, (2) antimicrobial resistance monitoring programmes, and (3) planning intervention strategies to lower resistance levels at the country, region or herd levels [Reference Nicholls4]. However, limited antimicrobial consumption data is currently available, and only few countries have well established surveillance programmes to monitor trends in non-human antimicrobial usage. These programmes collect data on consumption of some of the most important antimicrobial classes used for treatment of food animals, and are collected from different sources, such as feed mills, pharmacies and veterinarians. Some programmes present data at the national or regional level, while more advanced programmes are able to monitor antimicrobial consumption data at the herd level. Data from these programmes are usually analysed by risk managers to establish and maintain food-safety programmes.
The Danish pig production system presents an organized structure which facilitates the monitoring of antimicrobial usage patterns. The annually published Danish Integrated Antimicrobial Resistance Monitoring and Research Programme (DANMAP) report shows that there are different trends in the consumption of different antimicrobial classes in pigs [5]. Since it is known that the number of pig producers in Denmark has decreased over the years [6], there is a need to assess whether the antimicrobial consumption patterns have been influenced by changes in the herd size distribution and whether there is an association between herd size and amount of antimicrobials consumed.
Although differences in consumption patterns between regions and between age groups have been assessed before in Denmark, data on antimicrobial consumption should also be evaluated considering different herd sizes. The objective of this study was to evaluate the trends in pig production and antimicrobial usage data of five antimicrobial classes for therapeutic use in slaughter pigs (i.e. pigs weighing >50 kg) in different herd sizes, from 2002 to 2008. In addition, we investigated the association between herd size and the amounts of antimicrobials prescribed for slaughter pigs in Denmark.
MATERIALS AND METHODS
Herd and slaughter pig data
Data on the size of the pig production were collected and analysed retrospectively from January 2002 to December 2008. The data used in this study were stored in the Danish Zoonosis Register (ZOOR) and included all herds delivering pigs to Danish slaughterhouses. This database was established as part of the Central Husbandry Register (CHR), and each month an update on the number of pigs delivered to the slaughterhouses from different herds was registered and linked to the herd identification data [Reference Mousing7]. These data were used to estimate both the annual production of slaughter pigs for each herd and their ‘anytime slaughter pig occupancy’ within that year.
Antimicrobial consumption data
The Danish Veterinary Medicines Statistics Programme (VetStat) was established in 2001 with the purpose of monitoring antimicrobial usage in production animals. It includes all prescriptions of antimicrobials issued through pharmacies, veterinarians, and also from preparation of medicated feed by feed mills. For each prescription the following information was available: date of prescription, active substances, amounts, species age group and herd identification [Reference Stege8]. These data are available at the herd level and were used to calculate the amount of antimicrobial drugs prescribed to the different pig age groups at herd level in a period of time. Measuring antimicrobial usage in terms of weight of active substance has limitations due to differences in antimicrobial groups and in their potency; therefore measures in standard dosages are preferable. In this study, animal-defined daily doses (ADDs) were calculated as adopted by the VetStat monitoring programme, to standardize data of drug consumption [Reference Jensen, Jacobsen and Bager9].
The VetStat database classifies antimicrobials based on their anatomical therapeutic chemical veterinary classification system [Reference Dahlin10]. In order to simplify the analysis and data presentation, the target antimicrobial drugs were summarized into five therapeutic classes: tetracyclines, macrolides, sulfonamides/trimethoprim, cephalosporins and fluoroquinolones. These antimicrobial classes were selected based on their usage rates and their public health importance. Macrolides and tetracyclines were included because they are the most commonly used antimicrobials in slaughter pigs in Denmark. According to the Danish guidelines for antimicrobial treatment in pigs, sulfonamides are considered the priority choice when treating some of the most common pig diseases and therefore were included in this study [11]. Cephalosporins and fluoroquinolones presented the lowest usage rates of all antimicrobials prescribed to pigs between 2002 and 2008, and are of critical public health importance [12]. Antimicrobial prescriptions where one of the descriptive information categories was not available (prescription date, pig age group, herd identification, amount prescribed or antimicrobial class prescribed) were excluded from the dataset.
Data management and analysis
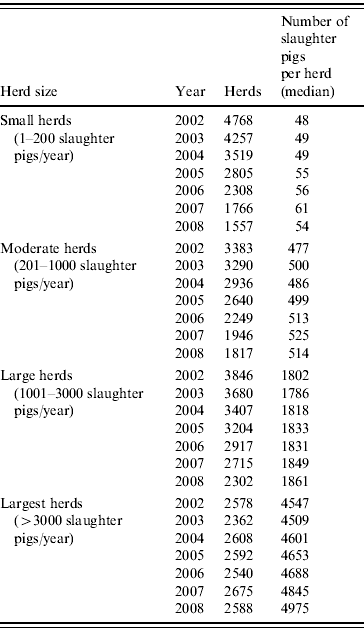
Data on animal demographics and antimicrobial consumption of all herds delivering slaughter pigs to Danish slaughterhouses were included in the analysis. Herds were classified into four different size categories, according to the number of animals slaughtered per year (Table 1). Cut-off points were used to determine the four category limits and were based on data from the herd size distribution of the overall Danish pig herd population. For each herd, the period for total amount of pigs delivered per year was calculated and a fattening period of 112 days was assumed in order to estimate the number of slaughter pig-days.
Table 1. Number of herds and slaughter pigs produced per year, between 2002 and 2008, by herd size
All macrolide, tetracycline, sulfonamide/trimethoprim, cephalosporin and fluoroquinolone prescriptions to slaughter pigs were registered and calculated as ADD. This measure expresses how many pig-days could be treated in each herd with each antimicrobial during that year. The treatment incidence (TI) rate in a herd was calculated as the total number of ADDs prescribed within a year, divided by the estimated number of slaughter pig-days in that herd during that year.

Then
All the database management and statistical analyses were performed using Enterprise Guide® version 3.0 (SAS Institute, USA). Two-proportion z tests were used to assess the significance of observed trends and changes in prevalences. Linear regression analyses were used to assess the significance of the observed trends and differences in TI rates between herd sizes. For each antimicrobial class, the effects of year and herd size in the log-transformed TI rates were analysed. Microsoft Excel (Microsoft Corp, USA) was used to plot the trend charts.
RESULTS
Table 1 shows the number of pig herds included in the analysis, grouped by herd size, from January 2002 to December 2008. During this period, the overall number of herds decreased markedly, from a total of 14575 herds in 2002 to 8264 in 2008. Meanwhile, the number of pigs slaughtered in Denmark ranged from 19 to 22 million pigs per year. The number of herds decreased mainly in the three groups including the smallest herds. These changes caused shifts in the relative prevalence of the herd sizes, with larger herds becoming more prevalent and smaller herds less prevalent (Fig. 1). The prevalence of herds delivering up to 200 slaughter pigs per year (small herds) decreased from 33% in 2002 to 19% (P<0·01) in 2008. In the same period, herds delivering >3000 pigs to slaughter (largest herds) increased (P<0·01) and corresponded to 31% of the total number of herds in 2008. In addition, as shown in Table 1, the number of slaughter pigs per herd increased over the evaluated years for all herd size categories.
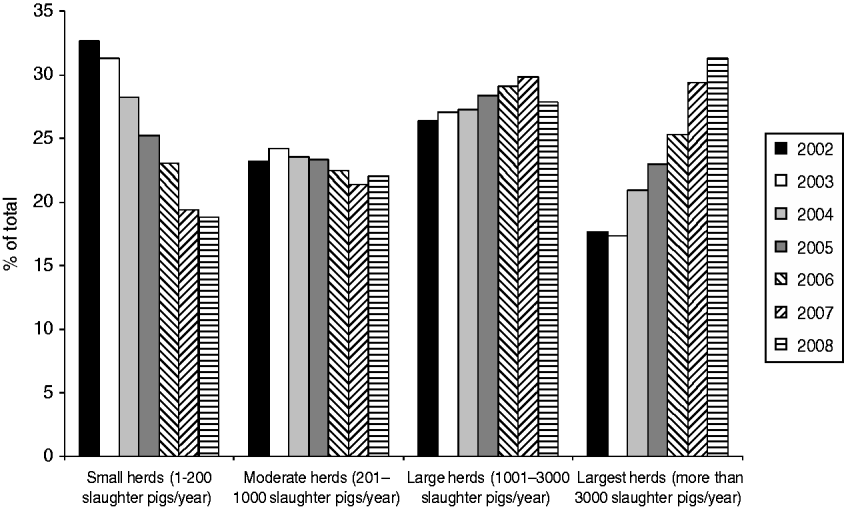
Fig. 1. Distribution of herds delivering slaughter pigs to Danish slaughterhouses, between 2002 and 2008, categorized by herd size.
Figure 2 shows that in 2008 the largest herds delivered about 73% of all pigs slaughtered in Denmark, even though they represented only 31% of the herds (Fig. 1). In the same year, all the slaughter pigs delivered by the two smallest herd size groups together (small and moderate herds) accounted for <6% of the total number of animals, although these categories accounted for 41% of the herds.
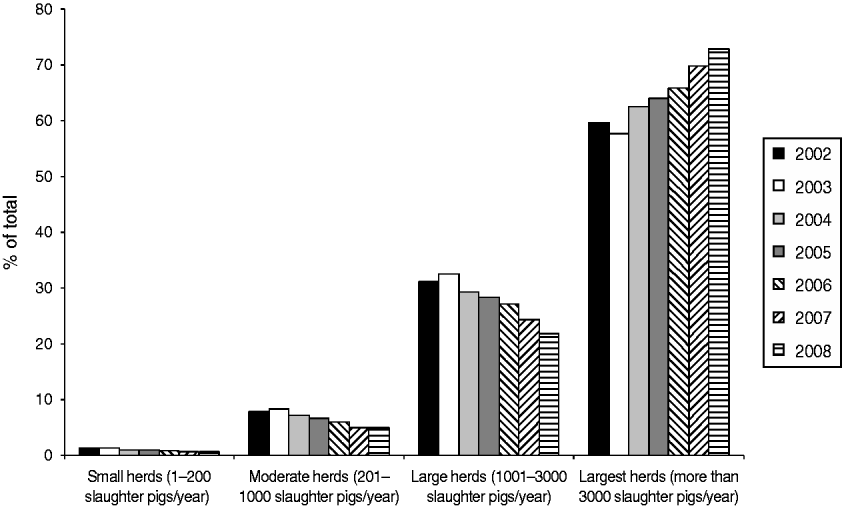
Fig. 2. Distribution of slaughter pigs delivered to Danish slaughterhouses, between 2002 and 2008, categorized by herd size.
A total of 2·3% of the prescriptions were excluded from the dataset due to incomplete information on prescription date, pig age group, herd identification, amount prescribed or antimicrobial class prescribed. Overall, 173 503 prescriptions for tetracyclines, macrolides, sulfonamides/trimethoprim, cephalosporins and fluoroquinolones were available for the analyses, giving a total of 156 523 963 ADDs prescribed for slaughter pigs during 2002–2008. The majority of these ADDs were for tetracycline and macrolide prescriptions (53% and 46%, respectively), with cephalosporins, sulfonamides and fluoroquinolones accounting for the remaining 1% of the ADDs prescribed within the study period. Although the number of pigs slaughtered differed by <10% between the years studied, the number of prescriptions for the five evaluated antimicrobial classes increased every year, from 18 622 prescriptions in 2002 to 25 998 prescriptions in 2008. This was followed by an increase of 48% in the number of ADDs of the five antimicrobial classes prescribed, from 17 759 042 in 2002 to 26 293 770 in 2008. This trend in number of prescriptions and ADDs was mainly driven by tetracyclines, for which the number of prescriptions increased by 57% and the number of ADDs by 121% between 2002 and 2008.
The TI rate calculated for the five evaluated antimicrobial classes presented different trends within each class. While tetracycline TI increased from 0·28 to 0·70 ADD/100 slaughter pig-days at risk, macrolide TI presented a more moderate increase, from 0·40 to 0·44 ADD/100 slaughter pig-days at risk. In 2005, tetracyclines overtook macrolides as the highest TI rate. Sulfonamide/trimethoprim TI decreased (from 0·008 to 0·005), and cephalosporin TI increased (from 0·001 to 0·002) when comparing the 2002 to the 2008 rates. Meanwhile, fluoroquinolone TI rates remained close to zero, since prescription of fluoroquinolones in food animals was restricted by the Danish veterinary authorities in 2002.
When herd size is taken into account, differences in the annual trends in number of ADD/100 slaughter pig-days at risk between herd size groups were observed. In general, there were marked differences between the TI rates presented by the small herds and the TI presented by the other three herd size categories. The trends of TI rates for the five antimicrobials over time, by herd size, are shown in Figure 3. Small herds had a higher TI for the five antimicrobial groups, while the remaining three herd size categories presented TI <1 ADD/100 slaughter pig-days at risk for the five antimicrobials. With the exception of tetracyclines and cephalosporins, the TI in small herds oscillated over the years, but presented an overall decrease over the whole study period. The decreasing trend in macrolide TI in small herds did not follow the trend in other herd sizes, where macrolide TI slightly increased over the evaluated years.
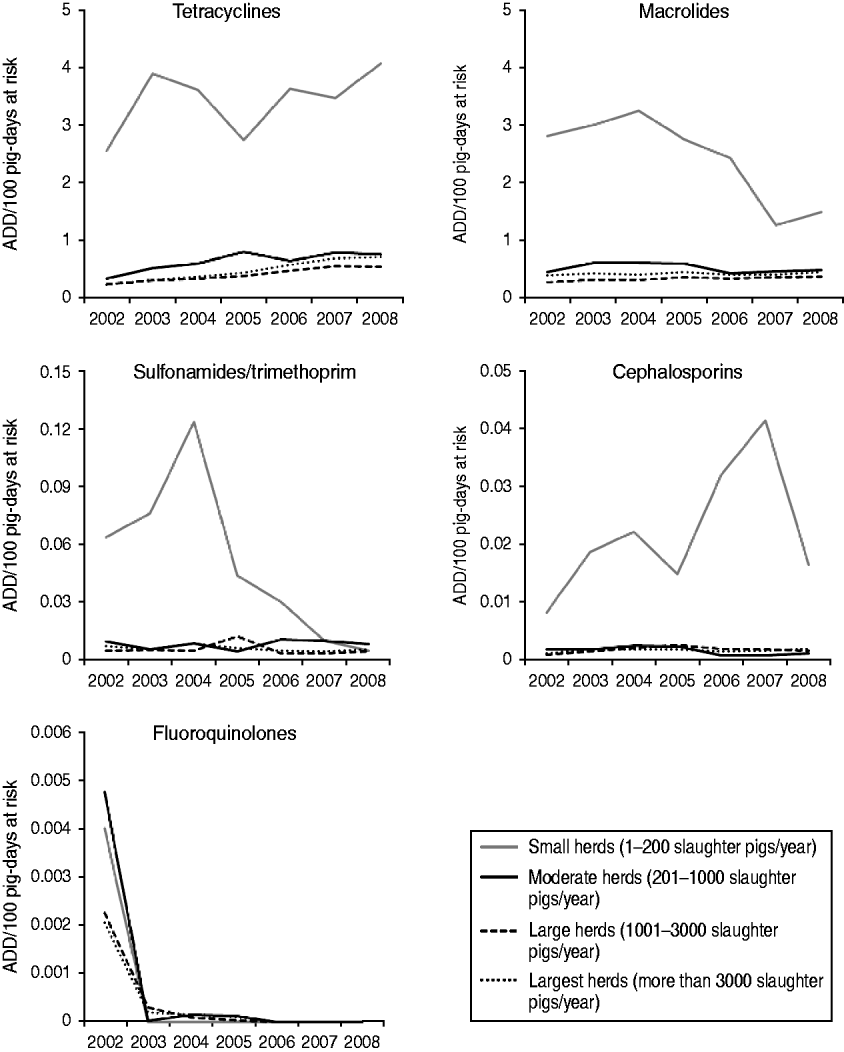
Fig. 3. Trends on treatment incidence rates [animal-defined daily dose (ADD)/100 pig-days at risk] for tetracyclines, macrolides, sulfonamides/trimethoprim, cephalosporins and fluoroquinolones for slaughter pigs, by herd size category, between 2002 and 2008, in Denmark.
Linear regression analyses revealed a significant association between herd size and the log-transformed TI rates for tetracyclines, macrolides, sulfonamides/trimethoprim and cephalosporins. The TI rates for these four antimicrobials in small herds were significantly higher than for moderate, large and largest herds. A significant increase was observed in tetracycline TI and a decrease in sulfonamide/trimethoprim TI over the years. The steep decrease in fluoroquinolone TI from 2002 to 2003 did not allow for the fit of a model for this antimicrobial class. Final models for each antimicrobial class are shown in Table 2.
Table 2. Final models assessing the effect of year and herd size on tetracycline, macrolide, sulfonamide/trimethoprim and cephalosporin treatment incidence rates in slaughter pigs in Denmark
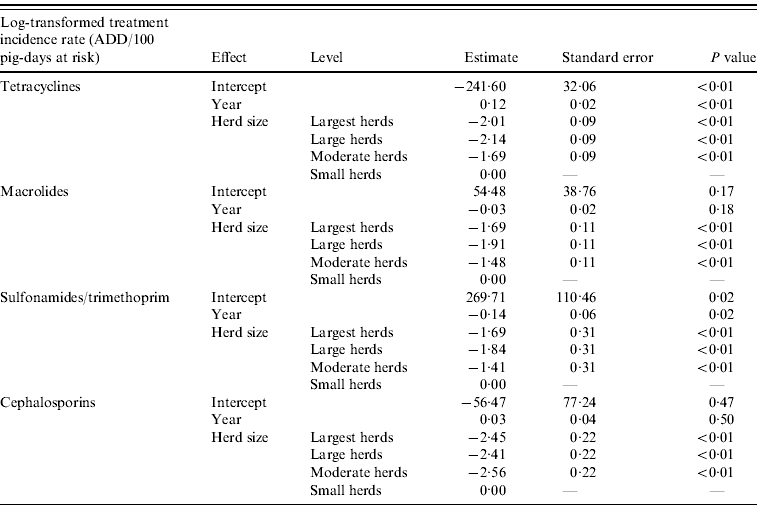
ADD, Animal-defined daily dose.
DISCUSSION
This study investigated trends on antimicrobial consumption and differences in the antimicrobial TI rates in herds of different sizes, and showed that herds producing up to 200 pigs per year (small herds) presented a significant higher antimicrobial TI rate than larger herds. Previous studies assessing the amount of antimicrobials prescribed to pig herds were not able to assess differences in antimicrobial consumption between different herd sizes [Reference Dunlop13–Reference Timmerman15]. Since few countries have data available on non-human antimicrobial consumption, nearly all studies assessing the antimicrobial consumption patterns in pig herds are performed using very homogeneous populations (e.g. herds from the same geographical area, under similar management, etc.). These populations are usually chosen based on their physical location, association with organizational structure or antimicrobial usage practices. In addition to having similar herd sizes, there is a tendency of similar patterns of antimicrobial usage in the herds. Another limitation of other studies assessing antimicrobial consumption in herds is the data collection on antimicrobial usage. Data is usually gathered through interviews and questionnaires to producers or veterinarians. However, questionnaires on antimicrobial usage are a frequent source of bias, such as recall bias due to delays in reply and selection bias obtained at low response rates [Reference Grave and Aarestrup16].
The concept of TI rate was applied in this study in order to estimate the incidence of animals being treated within each herd. It allows for the comparison of the amounts of antimicrobials prescribed, measured in standard dosages, in herds of different sizes, and other studies have used similar tools to measure the proportion of animals being treated within a herd [Reference Timmerman15, Reference Dunlop17]. Limitations of using TI rates include the inability to estimate the actual number of animals receiving antimicrobial drugs and the duration of treatments. Such parameters might play a key role in studies addressing antimicrobial resistance development and drug administration patterns, but these parameters are outside the scope of this study.
The analysis performed showed a significant difference in TI for tetracyclines, macrolides, sulfonamides and cephalosporins in small herds and other herd sizes. The accentuated increase of tetracycline consumption in small-sized herds, parallel to the fall in TI for macrolides in these herds may represent either an upcoming trend on health problems affecting these herds or only a shift in prescription behaviour. However, some of these observed differences in antimicrobial TI rates in small herds could be associated with the fact that few treatments of few animals can still result in a high TI because the smallest package of antimicrobial may still be far too large to treat only a few sick animals. This may also be reflected in failure to report to the VetStat monitoring programme when antimicrobials are used in the herd, since the producer already has the antimicrobial in stock. Although antimicrobial prescription regulation in Denmark stipulates that only the amount necessary for the treatment of the sick animals should be prescribed, and that antimicrobials should never be prescribed for a period longer than 30 days, the occurrence of prescribing more than necessary should not be disregarded. However, an overestimation of the proportion of treated animals is less likely to occur since it is reasonable to assume that the herd would consume all or nearly all the prescribed antimicrobial at some point. Moreover, in herds producing few animals per year, it is likely that most animals are raised together. Therefore, if an animal or few animals are sick, the proportion of pigs exposed will increase quicker than in a larger herd.
There are several potential reasons for the differences in TI rates in different-sized herds. Small herds are more likely to be either integrated or regarded as ‘hobby’ herds, having reduced biosecurity measures and an increased likelihood of introduction and spread of diseases. A biosecurity survey performed by De Sadeleer et al. showed that >95% of the surveyed pig herds in Belgium with low biosecurity status were small herds, while >70% of the herds with high biosecurity status were larger herds [Reference De Sadeleer, de Kruif and Maes18]. Differences in husbandry and health management practices may also be responsible for these observed differences in TI rates, and surveys on biosecurity techniques and management practices in Denmark, accounting for the different herd sizes, should be applied in order to better understand the causes of these differences. When controlling for year, TI rates in the moderate, larger and largest herds were similar within each antimicrobial class assessed. This is likely to be associated with a similar management practices, higher standard of biosecurity, and more strict control on animal health used by these industrial production herds.
In Denmark, all prescriptions from pharmacies, veterinarians and feed mills are collected on a monthly basis and recorded in a database, which allows for the complete monitoring of the trends on animal antimicrobial usage in the country [Reference Stege8]. In the Danish pig industry, antimicrobials are rarely sold directly from the veterinary practice to the farmer, and this type of consumption represents <1% of the total consumption. For these analysed data, prevarication bias is not likely to be a problem because of the nature of the VetStat-enforced prescription report. A considerable amount of data is entered into the VetStat database by pharmacists and other authorized antimicrobial sellers. Such procedure increases the probability of registration errors regarding herd identification, animal species or age group, but not the probability of systematic information bias. Limitations of the use of data from the VetStat database includes the inability to estimate the actual number of slaughter pigs receiving antimicrobials, and the duration of treatments, since the standard dosage unit used is measured in pig-days at risk. Another possible source of bias regarding antimicrobial consumption in slaughter pigs is the use of antimicrobials originally prescribed for other pig age groups or other herds owned by the same producer or company, causing an underestimation of the TI rates. On the other hand, antimicrobials prescribed for slaughter pigs could be used for other animal categories, e.g. sows or weaning pigs.
The analysis shows a clear trend on herd size distributions over the years, with a decline in the number of small herds with larger herds becoming more prevalent. This trend is observed in several countries as a result of changes in the pig production industry where larger producers are more likely to have the economic balance necessary to maintain production activity while smaller farms are forced out of business or merge with larger pig operations. In addition, the increase in the mean number of pigs produced by the largest herds may also indicate that more animals are being produced per farm every year.
This study highlights the importance of the establishment of antimicrobial consumption monitoring programmes, integrated with comprehensive food-animal production surveillance. We have observed that there is currently a shift in herd size towards larger herds, and that smaller herds are associated with higher TI rates than larger herds. By investigating antimicrobial consumption patterns and the size distribution of Danish pig herds, we were able to describe and better understand the observed trends on the Danish pig production and the levels of antimicrobial usage for slaughter pigs over the past years. Further research should be performed addressing the potential causes of the detected associations between herd size and antimicrobial consumption in pigs. The data described in this study can now be used as base for interventions on the antimicrobial usage regulations or by other studies assessing trends on pig production. Moreover, it can be used as background information in other studies assessing antimicrobial consumption trends and farm surveillance, as well as for antimicrobial resistance risk assessment.
ACKNOWLEDGEMENTS
This work was supported by a grant from the EU Marie Curie Programme TRAINAU (MEST-CT-2004-007819).
DECLARATION OF INTEREST
None.


