INTRODUCTION
The U.S. Center for Disease Control and Prevention (CDC) describes syndromic surveillance as ‘an investigational approach where health department staff, assisted by automated data acquisition and generation of statistical alerts, monitor disease indicators in real-time or near real-time to detect outbreaks of disease earlier than would otherwise be possible with traditional public health methods’. Theoretical benefits of syndromic surveillance include potential timeliness, increased response capacity, the ability to establish baseline disease burdens, and the ability to delineate the geographical reach of an outbreak [Reference Berger, Shiau and Weintraub1]. The French National Health Insurance (NHI) database is a potential data source for syndromic surveillance [Reference Tuppin2]. All individuals residing in France must be registered with the French Social Security System. This registration provides access to social protection which includes reimbursement of expenses for healthcare and drugs. The NHI is responsible for these reimbursements. Since 1998, NHI has developed a database used for medical consultations and drug refunds. The NHI database contains information on patients and drug refunds which is useful for epidemiological studies (Table 1). In this database, drugs are referred by the code of the ‘Inter Pharmaceutical Club’ (CIP) which corresponds to the product packaging. Drugs may also be extracted by homogenous classes of the ‘Anatomical Therapeutic Classification’ (ATC) of the World Health Organization [3] or ‘European Pharmaceutical Marketing Research Association’ (EPhMRA) nomenclatures.
Table 1. Database of French National Health Insurance on drug prescription (ERASME, SNIIR-AM)
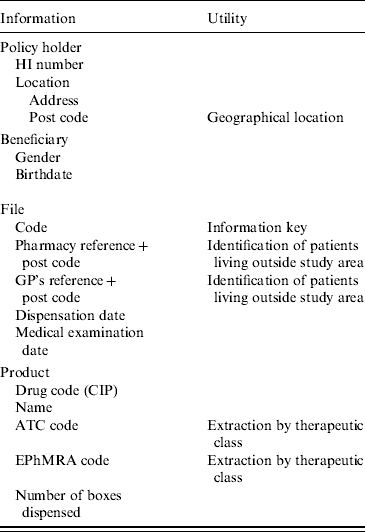
CIP, Inter Pharmaceutical Club; ATC, Anatomical Therapeutic Classification; EPhMRA, European Pharmaceutical Marketing Research Association.
Drug consumption data are already used to estimate the prevalence of chronic diseases like asthma [Reference Kesten, Rebuck and Chapman4], diabetes [Reference Fontbonne, Papoz and Eschwege5–Reference Sartor and Walckiers8], or cardiovascular diseases [Reference Oreberg9]. These data are used less frequently to estimate the incidence of diseases such as acute gastroenteritis (AG) [Reference Beaudeau10] and acute respiratory diseases [Reference Zeghnoun11–Reference Harf and Dechamp13]. The incidence or prevalence of these diseases is generally estimated by the annual drug sales divided by the average daily dose, and by average treatment duration. However, the conversion of sales into cases remains inaccurate because of the variation in drug dosage and drug associations. Furthermore, this indicator lacks specificity related to the use of these drugs in the treatment of non-targeted pathology. Specific methods have been proposed to deal with these problems in asthma epidemiology [Reference Spitzer14, Reference Osborne15] but no methods are available for AG epidemiology.
AG results from an inflammation of the gastrointestinal tract, most commonly following an infection. Due to its high incidence, AG represents a significant cost in developed countries [Reference Payment16, Reference Fourquet17] and is a useful index for surveillance of diseases due to faecal pathogens. AG is characterized by rapid onset of diarrhoea with or without vomiting, nausea, fever, and abdominal pain. Occasionally patients may present initially with vomiting alone, with the onset of diarrhoea following later. In children, the symptoms might be less specific and confused by respiratory symptoms. An AG case is clinically defined as diarrhoea and/or vomiting at least three times per day with recent onset [Reference Warrell18].
Like other countries, the French Ministry of Health first built enteric disease surveillance on compulsory reporting of specific infections, e.g. cholera, salmonellosis, or collective food poisonings, by both general practitioners (GPs) and laboratories [Reference Desenclos, Vaillant and Bonmarin19]. The ‘Sentinelle GPs’ network' supplemented the system in 1990, providing an estimate of the weekly number of AG consultations in the 20 regions of France [Reference Boussard20]. The specific usefulness of the ecological (i.e. non-individual) data depends on both their sensitivity and their time–space resolution power. The Sentinelle GPs' network provides the public health stakeholders with data, with a 1-week delay, regarding the spread of winter viral AG outbreaks throughout France. However, with a GP participation rate of about 1/1000 and a GP consultation rate for AG representing 0·08/person per year, this database cannot support local investigations, particularly for waterborne AG outbreaks. The quasi-completeness of the NHI database dramatically increases the possibilities for local investigations and studies.
The aim of this study was to develop a method to identify cases of AG from drug-reimbursement data in the NHI database. The performance of this method was evaluated and its use for an AG surveillance system was discussed.
MATERIALS AND METHODS
The definition of a medically treated AG case is based on the typology of GP prescriptions, which we obtained according to the following design.
Pharmacy survey
A list of drugs currently used in the treatment of AG in France was released by GPs and pharmacists. Drugs used for treating AG were divided into six therapeutic classes which roughly matched the A07 ATC subclasses but required some adaptations from day-to-day prescription practice (Table 2). A retrospective investigation was conducted in pharmacies to obtain a sample of prescriptions associated with the diagnosis. This investigation was carried out by pharmacy students during a training period in five pharmacies during two periods, a 1-month period in 2000 and a 6-month period in 2006. The data from these two periods was pooled because no significant changes were observed in prescription patterns or in drug refunding. During the two periods in 2000 and 2006 no important drug was withdrawn from the market nor was a new drug launched. Additionally, no significant changes in prescription patterns were validated by the pharmacists participating in the study. The five pharmacies were located in three major cities and two small villages of the same region. A consent form was obtained verbally from each patient prior to enrolling in the study. The patients were asked about their medical history (e.g. presence of AG vs. other diseases, labelled as non-AG), age, gender and post code. The selection bias was reduced by including any patient in the study who had presented a prescription containing at least one AG drug (Table 2). In addition, the diagnosis first reported by the patient was then compared to the known symptoms of AG in order to reduce bias due to misunderstanding. AG diagnosis was validated if the reported symptoms corresponded to the AG definition. Non-AG cases were not checked for diagnosis. Moreover, the GP's name, the date of the medical examination, drug dispensation, the drug name and the number of boxes dispensed for each drug were collected from the prescription form.
Table 2. Drug used for the treatment of acute gastroenteritis (data provided by NHI)
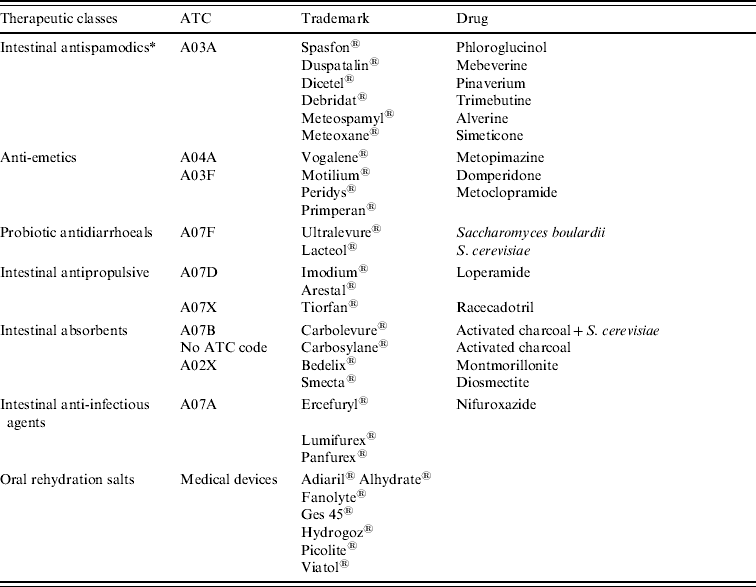
ATC, Anatomical Therapeutic Classification.
* Not used for the extraction of refund data from NHI database.
Building the AG/non-AG discrimination algorithm
The sample of prescriptions was evaluated. The type of drugs, number of boxes, and therapeutic classes were used to differentiate between AG prescriptions (intended for patients suffering from AG) and non-AG prescriptions (intended for patients suffering from other diseases) along with their characteristics. The statistical analysis of the sample enabled us to define a set of relevant rules to discriminate AG from non-AG cases. The resulting AG indicator was subsequently evaluated from the contingency table of observations in terms of sensitivity and specificity (Table 3).
Table 3. Contingency table showing determination of sensitivity and specificity
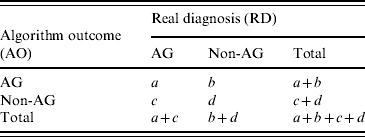
AG, Acute gastroenteritis.
Sensitivity=p(AO=AG|RD=AG)=a/(a+c).
Specificity=p(AO=non-AG|RD=non-AG)=d/(b+d).
Drug-based case definitions proposed by pharmacists and GPs, i.e. combinations of relevant discrimination rules, were tested in order to obtain an optimized balance between sensitivity and specificity.
Use of NHI data
The most efficient algorithm was implemented in C language. Inputs were the data files provided by NHI. The extraction request specified criteria about prescriptions, study area and period of time and these items had to be extractable from the database. The presence of one AG drug in the prescription (Table 2) caused the extraction of this prescription and of patient information as listed in Table 1. In the extraction request, the AG drugs were specified by ATC (or EPhMRA) classes when all drugs of the class are relevant, or by CIP otherwise. Four therapeutic classes (probiotics, antipropulsives, anti-inflammatory and anti-infectious drugs) corresponded to subdivisions of A07 ATC class, i.e. ‘antidiarrhoeic, anti-inflammatory drugs and anti-infectious drugs’. Other therapeutic classes were recomposed. Simplified lists were used for fast investigation with negligible information loss. Outputs were tables of the number of daily incident AG cases detailed by preset prescription categories (e.g. prescriptions including an anti-emetic), by defined areas (through GP's office or patient's residence location post-code lists) and by patient categories (gender and age).
RESULTS
Pharmacy study
During the investigation, 557 prescriptions with at least one drug currently used for the treatment of AG were collected, including 206 AG case prescriptions and 351 non-AG case prescriptions. These prescriptions were prescribed by 152 different GPs. An AG case prescription covered an average of 2·3 therapeutical classes used for AG treatment. Single-drug treatment was used in 11% (95% CI 7–15) of AG cases and more in children aged <5 years (AG cases). Antipropulsives and probiotics each represented one third of the single-drug treatments. A treatment with two drugs was used in 34% of AG cases (95% CI 27–41), mostly involving an antispamodic and either an anti-emetic or an antipropulsive. Intestinal antibiotics and rehydration salts were not frequently used in the two-drug treatments. A treatment with three drugs was prescribed in 46% (95% CI 39–53%) of AG cases. Anti-emetics were prescribed in 4/5 cases and were generally associated with antispasmodics and antipropulsives. A treatment with four drugs was used less frequently (9%, 95% CI 5–13) and corresponded to a three-drug treatment (anti-emetics+antipropulsives+antispamodics) in which intestinal antibiotics were added. Ninety-two percent (95% CI 88–96) of the patients suffering from AG purchased their drugs within 24 h of their GP consultation.
The number of therapeutic classes used for AG treatment included in non-AG prescriptions ranged from 1 to 3 (mean 1·2). Non-AG case diseases were documented for 215 prescriptions, i.e. 76% of the non-AG prescriptions. They varied considerably with 37 different diseases reported. Twenty-five percent (95% CI 19–31) of the patients with known disease were suffering from abdominal pain or constipation and 10% (95% CI 6–14) from gastroesophageal reflux. Other non-AG-associated diseases were flu, stress, migraine, cystitis, etc.
Discriminant algorithm
The retained algorithm consisted of a sequence of inclusion/exclusion binary tests (Fig. 1).
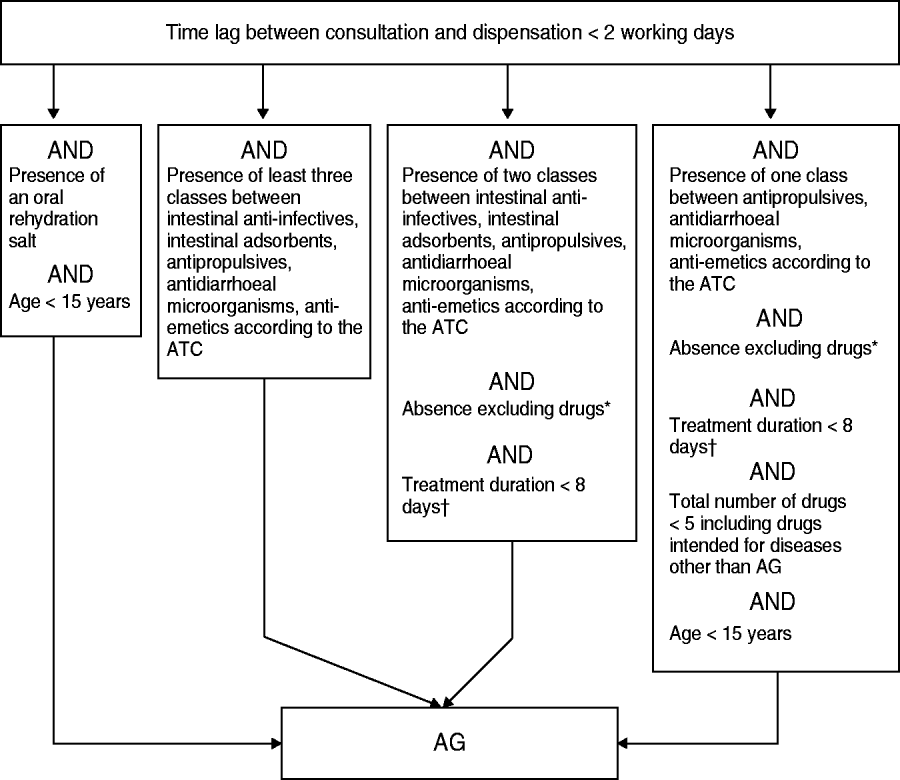
Fig. 1. The algorithm used for acute gastroenteritis (AG) case discrimination based on drug reimbursement data. * Excluding drugs: ‘antacids/anti-regurgitants’, ‘systemic antibiotics’ and any drug causing diarrhoea. † Considering any drug present; estimated from both the content and the number of boxes dispensed. ATC, Anatomical Therapeutic Classification.
Exclusion of late drug-dispensing cases
The lag time between issuing of the prescription and dispensation date should be <2 working days. Patients who waited until becoming sick (e.g. avoiding diarrhoea when travelling to non-developing countries) or were eligible to renew their prescriptions for their chronic pathologies obtained the required drugs less quickly and were considered as non-AG cases.
Inclusion of prescriptions including AG-specific drug or combination of drugs
Any prescription containing ⩾3 drugs used for AG treatment, or oral rehydration salts, was considered an AG case and no further testing was needed.
Exclusion of prescriptions including at least one eliminatory drug
The prescriptions remaining after the second algorithm stage operation contained one or two drugs for AG treatment. At the third stage, the presence of specific drugs used to treat another disease was tested and resulted in the exclusion of some prescriptions. For instance, the presence of laxative and gastric antacid, or mesalazine, which is usually prescribed for the treatment of haemorrhagic rectocolitis or Crohn's disease, was considered as an eliminatory criterion. For some drugs, the box size was also utilized as a selection criterion. For example, the prescription of diosmectite ‘Smecta® 60 packets’ was shown to be used for the symptomatic treatment of gastric pain and thus it was eliminated, whereas the prescription of ‘Smecta® 30 packets’, usually reserved for AG treatment, resulted in its inclusion.
Exclusion of prescriptions corresponding to lengthy duration treatments
Since duration of AG treatment is generally limited to 1 week, the occurrence of any drug prescribed for >1 week led to exclusion of the prescription. The drug box generally holds 20 or 30 units. The treatment duration was therefore assessed by using the provided box number, since the pharmacist was not supposed to dispense more than two boxes of the drug for AG treatment. All remaining two-drug treatments which passed the former tests were included.
Inclusion of the most specific paediatric single-drug prescriptions
Residual prescriptions included single-drug treatment not associated with an eliminatory drug. The last step for selection of AG cases relied upon a mix of conditions detailed in Figure 1. As the therapeutic aim of numerous drug prescriptions failed to materialize from the prescription analysis in the absence of further explanation from the prescribing GP, and as this concern generally affected elderly patients, the last selection step relied mainly on both the test of the patient's age (<15 years for inclusion) and the overall number of prescribed drugs (<5 for inclusion). Furthermore, the single AG-related drug present on the prescription had to be quite specific to AG treatment, thus excluding antispasmodics.
Indicator evaluation
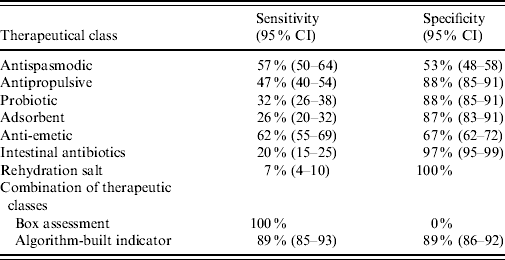
The basic case definition of AG, i.e. presence of a drug used in the prescription, had a sensitivity of 100% and null specificity. The signal generated by a single class as anti-emetic or antipropulsive might seem a simpler indicator but whatever therapeutic class used, its presence in the prescription did not indicate an AG case with both sensitivity and specificity (Table 4). For example, the sensitivity and specificity of anti-emetics were low with 62% (95% CI 55–69%) and 67% (95% CI 62–72), respectively. In contrast, the full definition of an AG case based on the discriminant algorithm achieved an optimal balance between specificity 89% (95% CI 86–92%) and sensitivity 89% (95% CI 85–93%).
Table 4. Sensitivity and specificity of individual therapeutic class compared to box assessment and algorithm-built indicator (n=557 prescriptions)
CI, Confidence interval.
DISCUSSION
This study has demonstrated that a prescription analysis was able to effectively distinguish AG from other possible pathologies. The assessment of AG case numbers was more effective than counting boxes sold or therapeutic class occurrences in the sales, since no therapeutic class was both sensitive and specific to AG. Thus, it was necessary to set up an algorithm based on the survey of GPs' prescription behaviour which involved considering the therapeutic class combinations and quantities dispensed.
Limitations of the study
The main limitations of the study's conclusions arose from the use of a single dataset for both the algorithm building and its evaluation, errors in self-report diagnosis, and bias induced by the sampling design.
The use of a single dataset for both modelling and validation resulted in an overestimation of sensitivity and specificity and possibly led to over-interpretation of data. This issue could be addressed through further studies involving both the NIH data and reference data such as epidemic curves drawn from outbreak investigation reports or time-series from Sentinelle GPs' network data. Splitting the AG indicator into a set of sub-indicators (e.g. paediatric cases treated by oral rehydration salts, cases treated by anti-emetic drugs, etc.) would allow performance of separate tests and reduce subcategories which did not correlate the reference indicators.
Diagnosis was collected by patient self-report and a misclassification of diagnosis would have a significant impact on the results. A mistake of diagnosis report was unlikely for AG cases. If there was any doubt regarding the actual diagnosis, the patient was asked about the observed symptoms and possible non-infectious cause, and the interviewer referred to clinical case definition for the classification of the patient.
The prescriptions sample did not correspond to a random sample as only patients with drug prescriptions for AG were included in this study. Estimation of sensitivity could be considered as unbiased as it was acknowledged that, in France, 100% of AG patients who consulted their GP had been prescribed at least one drug [Reference Uhlen, Toursel and Gottrand21]. On the other hand, the sample of non-AG cases, i.e. patients who did not have AG but were still prescribed an AG drug, lead to underestimation of specificity. The trivial case definition ‘presence of an AG drug in the prescription’ led to a null ‘specificity’. Despite the bias due to sampling, our specificity index could be used as a relative index to compare alternative AG case indicators.
Scope of the algorithm-based AG indicator
Implementation of the algorithm allowed performance of the collection of sporadic AG cases concerning 4·7 million inhabitants within 14 urban sites. The multi-centre time-series study based on these data aimed, in the main, to discover water operation conditions, specified by proxies such as water turbidity, which relates to daily rates of AG incidence. It could evolve into an endemic waterborne AG surveillance system including water distribution zones, and provide a consumer population of >50 000 inhabitants in order to meet the statistical power requirement. Moreover, a feasibility study [Reference Beaudeau22] showed that NHI data were adequate for waterborne AG outbreak surveillance in municipalities of >500 inhabitants: statistical power calculations indicated that AG clusters could be detected in towns with as few as 500 or 5000 inhabitants depending on the attack rate. Furthermore, the water hypothesis could be tested by comparing the spatial fitting of the cluster area to the water distribution zone.
The lack of sensitivity of the NHI system finally appeared at a lower scale. Considering the size of the smallest spatial unit available, small clusters involving fewer than 100 people could not be detected by the NHI system, which thus precluded this system from the surveillance of food or handborne infections.
A further limitation concerned the long-term follow-up of the impact of AG. The homogeneity of the algorithm-based AG indicator through time is compromised by any change in the pharmacopoeia (new molecules), the medical prescription practice, the commercial practice (new drugs) or drug refund rates. Thus, the ‘used drug’ list and the discriminant algorithm must be regularly updated to meet the changes in medical prescription practice. For instance, since 2005 new therapeutic recommendations promoting the use of oral rehydration for the treatment of diarrhoea in children have caused a significant but gradual change in GPs' prescription patterns. This modification had necessitated the restructuring of the discriminatory process for paediatric AG case selection. A cessation in some drug refunding, i.e. the microbial products in 2006, appeared the most challenging because it caused the abrupt exclusion of the drug from the NHI database and required timely re-examination of discrimination rules.
Since economic or therapeutic evolution may compromise the drug-based AG case definition through time, the algorithm-based AG indicator does not fully meet the homogeneity criteria over time that would help to assess the multi-annual trend of the AG-related burden of disease. The GPs' network and the compulsory reporting of specific infections are better equipped to deal with the multi-annual trend. The NHI AG surveillance system under development will find its specific and main usefulness in its capacity to deal with short-term risk factors related to both endemic and epidemic waterborne infectious risks and to tackle the water-related factors of risk. Currently, the NHI provides InVS with half-yearly data files. The system is planned to be used for alert purposes and will commence when the online provision of the NHI data is set up.
The algorithm developed in this study was built to be used with the French NHI database for the syndromic surveillance of AG. This product can not be directly used in other countries because of different health systems, different type and source of data, and different medical practices. However, it should be appreciated as an example of a tool designed to achieve a specific AG indicator from GP prescriptions when diagnoses are not available.
CONCLUSION
A sample of prescriptions associated with the clinical diagnosis was collected in French pharmacies. Exploitation of these data showed that it was possible to distinguish cases of AG based on prescription content. The discriminant algorithm makes possible the exploitation of the French NHI databases for syndromic surveillance of AG. Potential space–time resolution of NHI data is much higher than the other French information systems for AG monitoring because they are available by district and day throughout the whole French territory. The NHI database content may, however, evolve along with changes in pharmacopoeia, prescription practices or drug refunds. This requires periodic revisions of the discriminant algorithm.
ACKNOWLEDGEMENTS
The authors are grateful to Richard Medeiros, Rouen University Hospital Medical Editor, Tek-Ang Lim, Louise Henneguet, Amélie Petit, Marie Clothilde Dubois, Marc Ponthieux and Taher Boukhris for their valuable contribution to the editing of the manuscript.
DECLARATION OF INTEREST
None.


