


Introduction
Worldwide, dengue is the vector-borne disease with the highest incidence in urban areas [Reference Mendonça, Souza and Dutra1]. It is currently considered the most important arbovirus infection, showing an exponential increase in recent decades, with an estimated 390 million cases and more than 4000 deaths occurring annually in the world [Reference Bhatt2, 3].
Dengue has strong negative impacts on health and the economy, especially in lower- and middle-income countries of the southern regions of the world, where the disease causes periodic epidemics and shows local variations that are deeply influenced by social and environmental factors [3].
The spread of dengue occurs through a complex process that involves vectorial capacity, population mobility, environmental changes, living conditions, access to health services, and the levels of population immunity [Reference Tauil4]. The high population density and precarious housing with poor basic sanitation in urban areas, combined with the circulation of different serotypes of the virus, have contributed to the spread and persistence of the disease [Reference Gubler5]. Furthermore, factors such as hot and humid climates create favourable conditions for the development and maintenance of the vector’s life cycle [Reference Casali6, Reference Almeida, Medronho and Valencia7].
Dengue has plagued the population of the city of Rio de Janeiro with notable epidemics since the 1980s, following the reintroduction of the main dengue vector in the city, the Aedes aegypti mosquito. From 1986 onwards, several epidemics occurred in the city mainly from January to May during the hot and rainy seasons [Reference Marzochi8, Reference Xavier9]. The first epidemic occurred in 1986, with only DENV-1 circulating [Reference Nogueira10]. In 1990, the second epidemic began with the introduction of DENV-2 in Brazil. In 1995, the co-circulation of DENV-1 and DENV-2 was responsible for the third epidemic in the city, and a new epidemic was recorded in 1998 [Reference Nogueira10]. With the introduction of the DENV-3 serotype in 2001, the fourth epidemic occurred in 2002 with 288245 reported cases, 1831 cases of severe cases, and 91 deaths [Reference Nogueira11]. The year 2008 was also marked by an intense increase in the number of cases and severe symptoms, especially among children [Reference Almeida, Medronho and Valencia7, Reference Romano12]. In 2011, a new epidemic began with the introduction of DENV-4 and the co-circulation of the four serotypes [Reference Heringer13] DENV-4 was responsible for most of the dengue confirmed cases in the epidemics of 2012 and 2013 in the city of Rio de Janeiro [14], and 2024 DENV-1 e DENV-2, accounting for more than 75% of the cases notified in the first two decades of the 21st century [15].
The disease presents heterogeneous behaviours in the city, endemic in some neighbourhoods and epidemic in others [Reference Xavier9, Reference Luz16, Reference Honório17]. This heterogeneity suggests particularities at the local level determined by several factors such as rainfall, precarious basic sanitation, mobility of the susceptible population, and different effectiveness of control actions, which result in the increase or maintenance of the vector population [Reference Luz16].
Over the years, efforts have been made to improve understanding of the dynamics of dengue and improve control strategies in the city [18]. Locating geographic areas at high risk of transmission is essential for identifying possible risk factors for the disease occurrence and developing more effective dengue control strategies [Reference Almeida, Medronho and Valencia7], and the application of spatial analysis in the health area has been considered an important tool in this context.
Given this context, the present study aimed to understand the dengue propagation process in Rio de Janeiro in 2002, 2008, 2011, 2012 2013, and 2024.
Methods
This is an ecological study using confirmed dengue cases in the Notifiable Diseases Information System (SINAN) for the years 2001–2024, obtained through the Municipal Health Department of Rio de Janeiro (SMS/RJ). All cases of dengue that had a laboratory or clinical-epidemiological confirmation were included in the analysis.
The city of Rio de Janeiro is in the metropolitan region of the state of Rio de Janeiro (Figure 1b), southeastern Brazil (Figure 1a), and is divided into 33 administrative regions, 160 neighbourhoods, and 8145 census tracts [19]. The city has an area of 122456.01 km2 with a resident population of 6320446 inhabitants (Figure 1) [20].
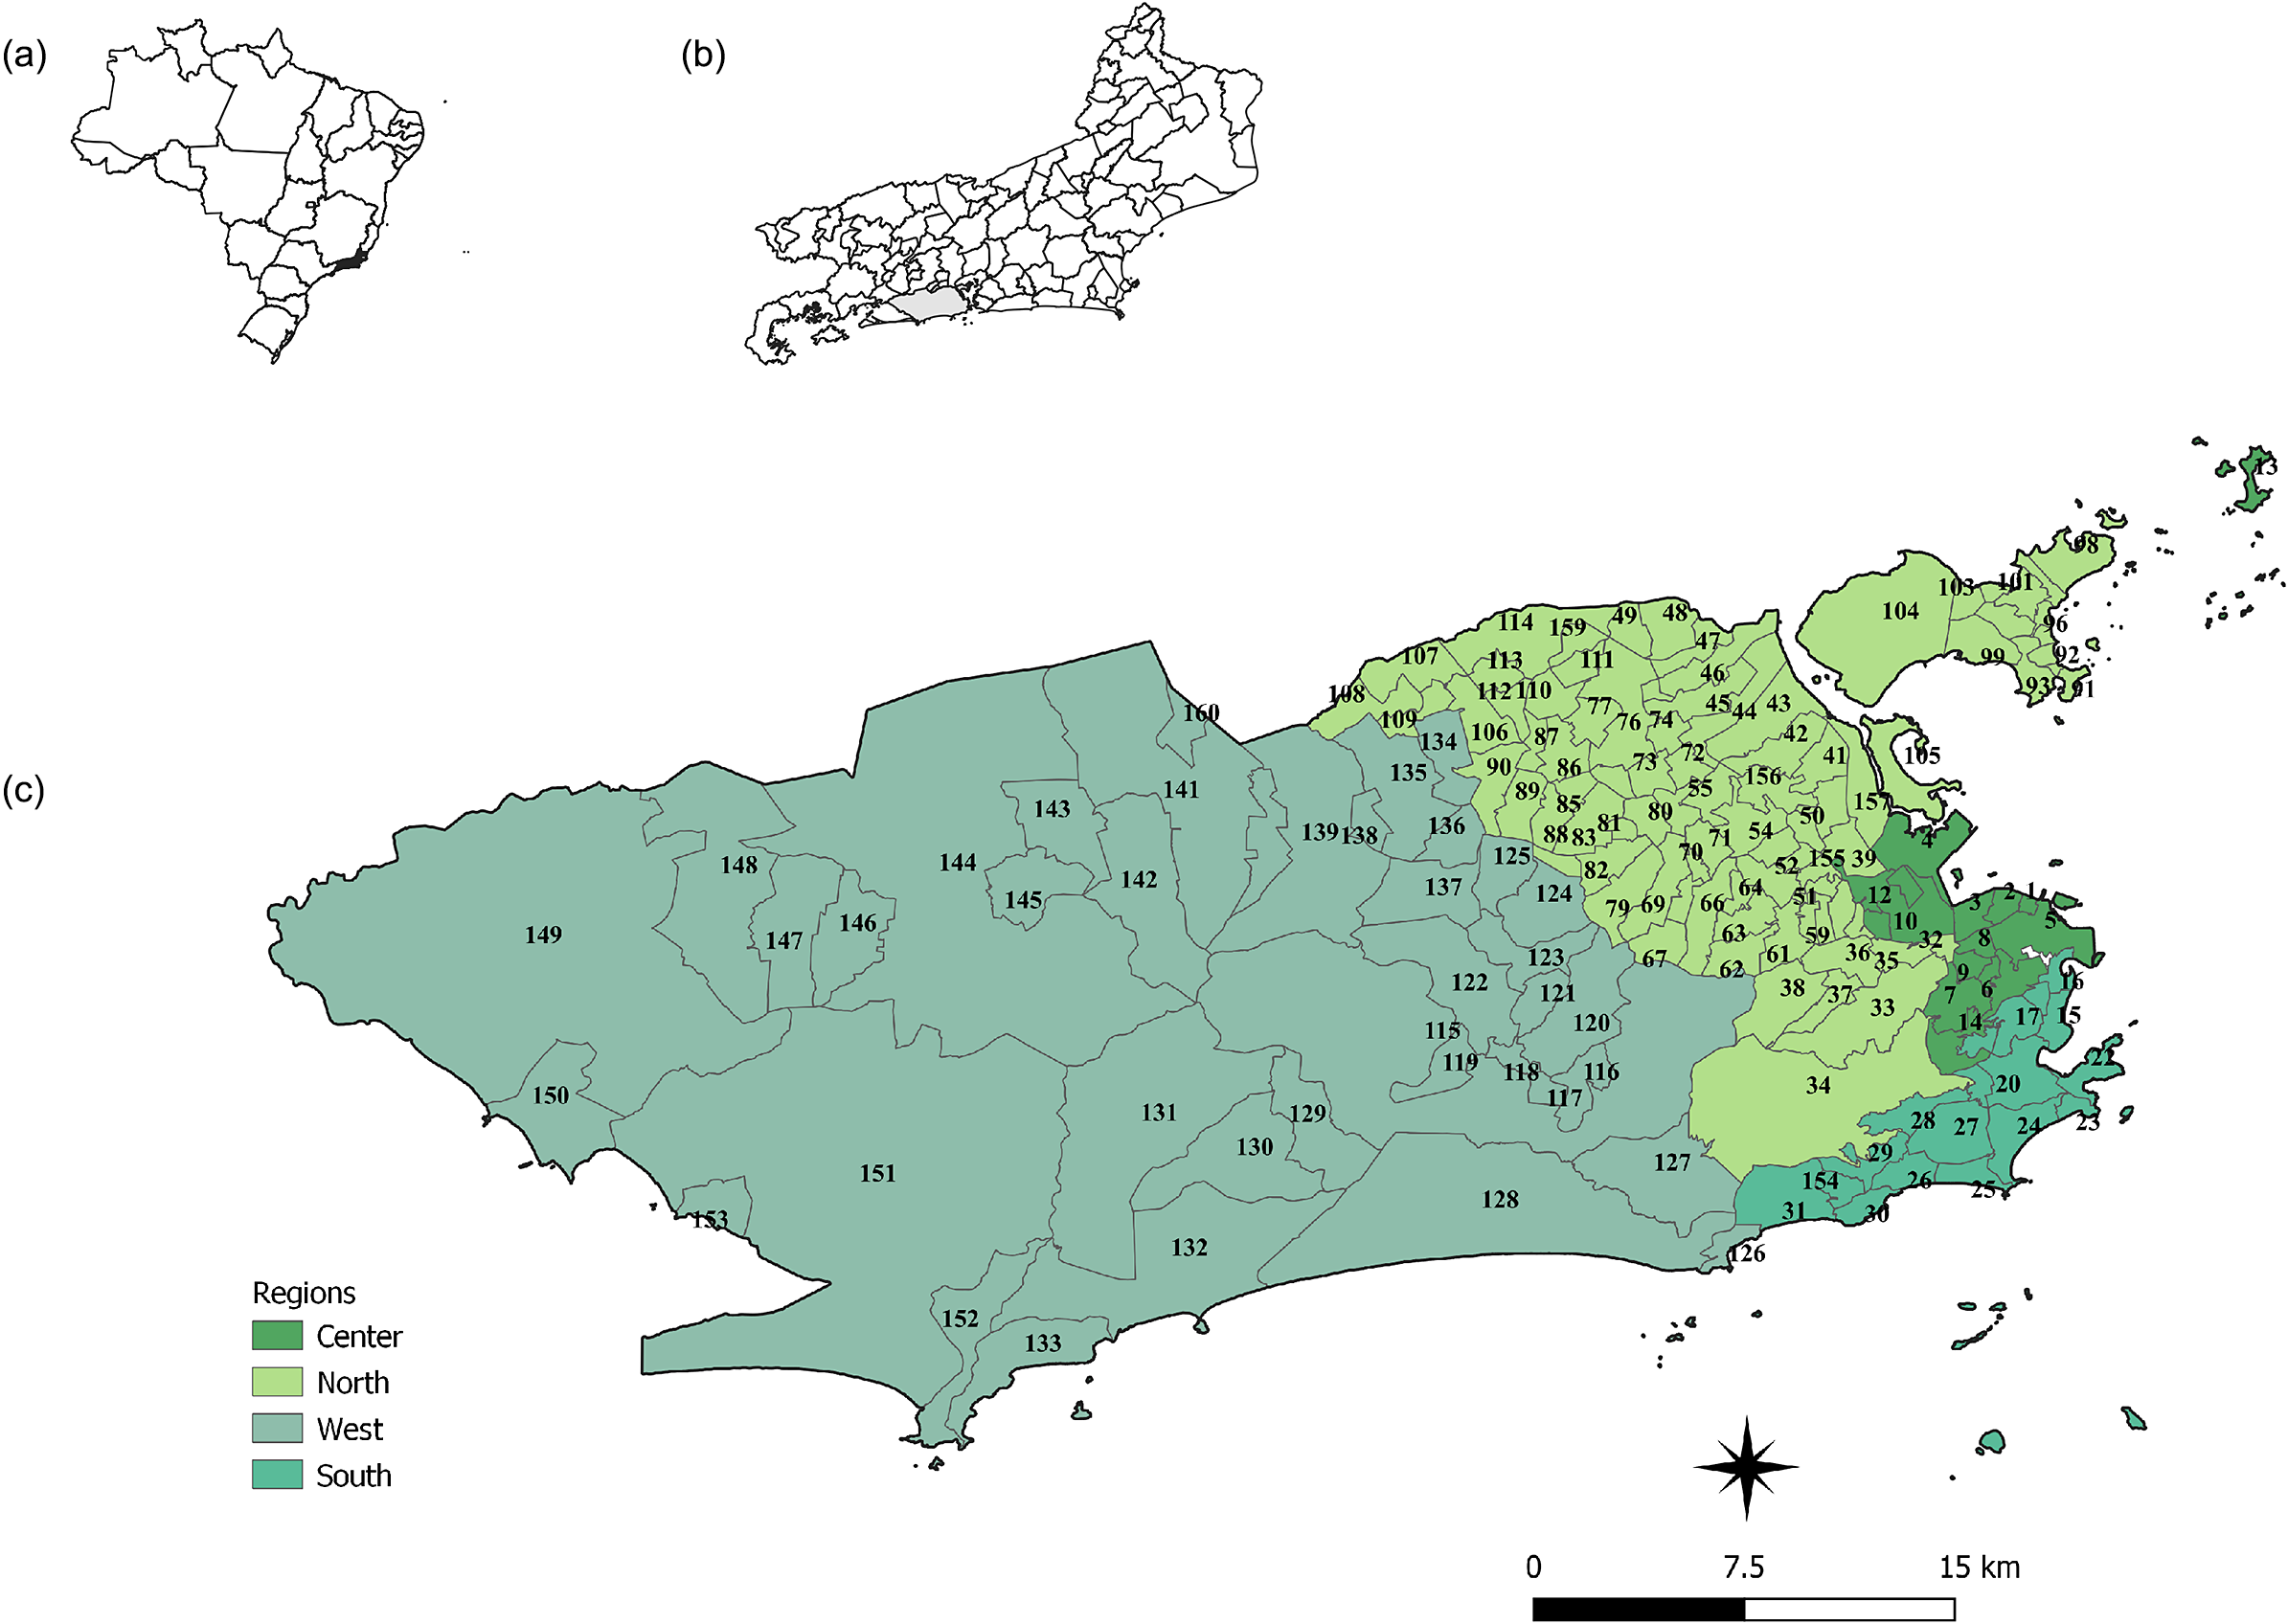
Figure 1. Map of Brazil (a), of the location of the city of Rio de Janeiro (b), and the regions (colours) and neighbourhoods of the city of Rio de Janeiro (c).
Source: (IBGE 2010; IPP 2020).
The full list of neighbourhoods is provided in the Supplementary Material.
Digital maps of the City of Rio de Janeiro were obtained through the Pereira Passos Institute [21]. The population used to calculate the incidence rate was estimated based on the 2000, 2010, and 2024 censuses by linear interpolation in the intercensal years and linear extrapolation for the years after the 2010 census [20].
Data analysis
Sequential thematic maps were created with incidence rates smoothed by the Local Empirical Bayes method using a neighbourhood adjacency matrix to verify the most affected areas in each epidemic year studied [Reference Assunção22].
Subsequently, local autocorrelation indicators (LISA—Local Indicators of Spatial Association) were calculated to evaluate the degree of spatial autocorrelation between the incidence rate of a geographic area and the average rate of neighbouring areas. The method produces a specific value for each area, allowing the visualization of clusters of hotspots or coldspots. Areas with high incidence rates surrounded by neighbours that, on average, also have high incidence rates are labelled as ‘High-High’ or hotspots. Likewise, areas are classified as ‘Low-Low,’ or coldspots, if they have low incidence rates and are surrounded by neighbours that, on average, also have low incidence rates. Areas labelled ‘High-Low’ and ‘Low-High’ correspond to the inverse spatial autocorrelation, that is, local rates are different from the average rates of neighbours [Reference Anselin23]. Maps were constructed with the LISA results.
To summarize the dynamics of the geographic spread process of dengue, an analysis of the geographic trajectory of dengue occurrence was carried out by calculating the geographic centre [Reference Sviatlovsky and Eells24–Reference Castro26]. In this analysis, the geographic centre considers the geographic location of the centroids of each neighbourhood weighted by the number of dengue cases for each month and year throughout the period studied [Reference Sviatlovsky and Eells24, Reference Trevelyan, Smallman-Raynor and Cliff25, Reference Lee and Wong27].
The average of the coordinates × (longitude) e y (latitude) defines the position of the geographic centre:
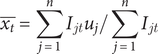 $$ \overline{x_t}=\sum \limits_{j=1}^n{I}_{jt}{u}_j/\sum \limits_{j=1}^n{I}_{jt} $$
 $$ \overline{y_t}=\sum \limits_{j=1}^n{I}_{jt}{v}_j/\sum \limits_{j=1}^n{I}_{jt} $$
where: $ \overline{x_t},\overline{y_t} $
are the coordinates of the geographic centre.
$ \overline{x_t},\overline{y_t} $
are the coordinates of the geographic centre. $ {I}_{jt} $
are the cases at the time t.
$ {I}_{jt} $
are the cases at the time t.
j = 1, 2, 3… n is the neighbourhoods.
The Terraview 4.2.2 and Quantum GIS 3.30 software were used to calculate and build the smoothed incidence rate maps. The R software was used to construct the epidemic curves. To calculate and build maps with local indicators (LISA), the GeoDa software version 1.18.14 was used.
Results
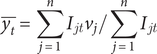
From 2000 to 2024, more than 1 million dengue cases were reported in the city of Rio de Janeiro. The years 2002, 2008, 2012, and 2024 present the epidemics of greatest magnitude. A certain increase in the number of cases was observed in 2001, 2007, 2011, and 2023, years that preceded the epidemics of 2002, 2008, 2012, and 2024. The months with the greatest intensity of dengue in 2002 were January, February, and March. In 2008, the months of March and April recorded the highest numbers of cases. During the 2011 epidemic, cases began to rise from January through March, peaking in April and starting to decline in May. In 2012, cases began to increase in January, peaked in April, and began to fall in May. In 2013, the epidemic had a smaller magnitude compared to other epidemic years, with more intensity in March and April, while in 2024, the peak occurred in February and May (Figure 2).
Figure 2. Epidemic curves of the monthly cases of dengue for the city of Rio de Janeiro, period 2000–2024.
Sequential maps of incidence rates show high rates in almost every year in the western, central, and northern regions of the city. In 2002, dengue had the highest incidence rates in the western, central, and northern neighbourhoods. In 2008, 2011, and 2013, there was a decrease in the incidence rate in the northern, central, and western neighbourhoods. During the 2012 epidemic, dengue became more intense in the northern and western neighbourhoods, with a decrease in the central and southern neighbourhoods. In 2024, dengue was distributed throughout the city, with higher intensity in the western and central zones (Figure 3).
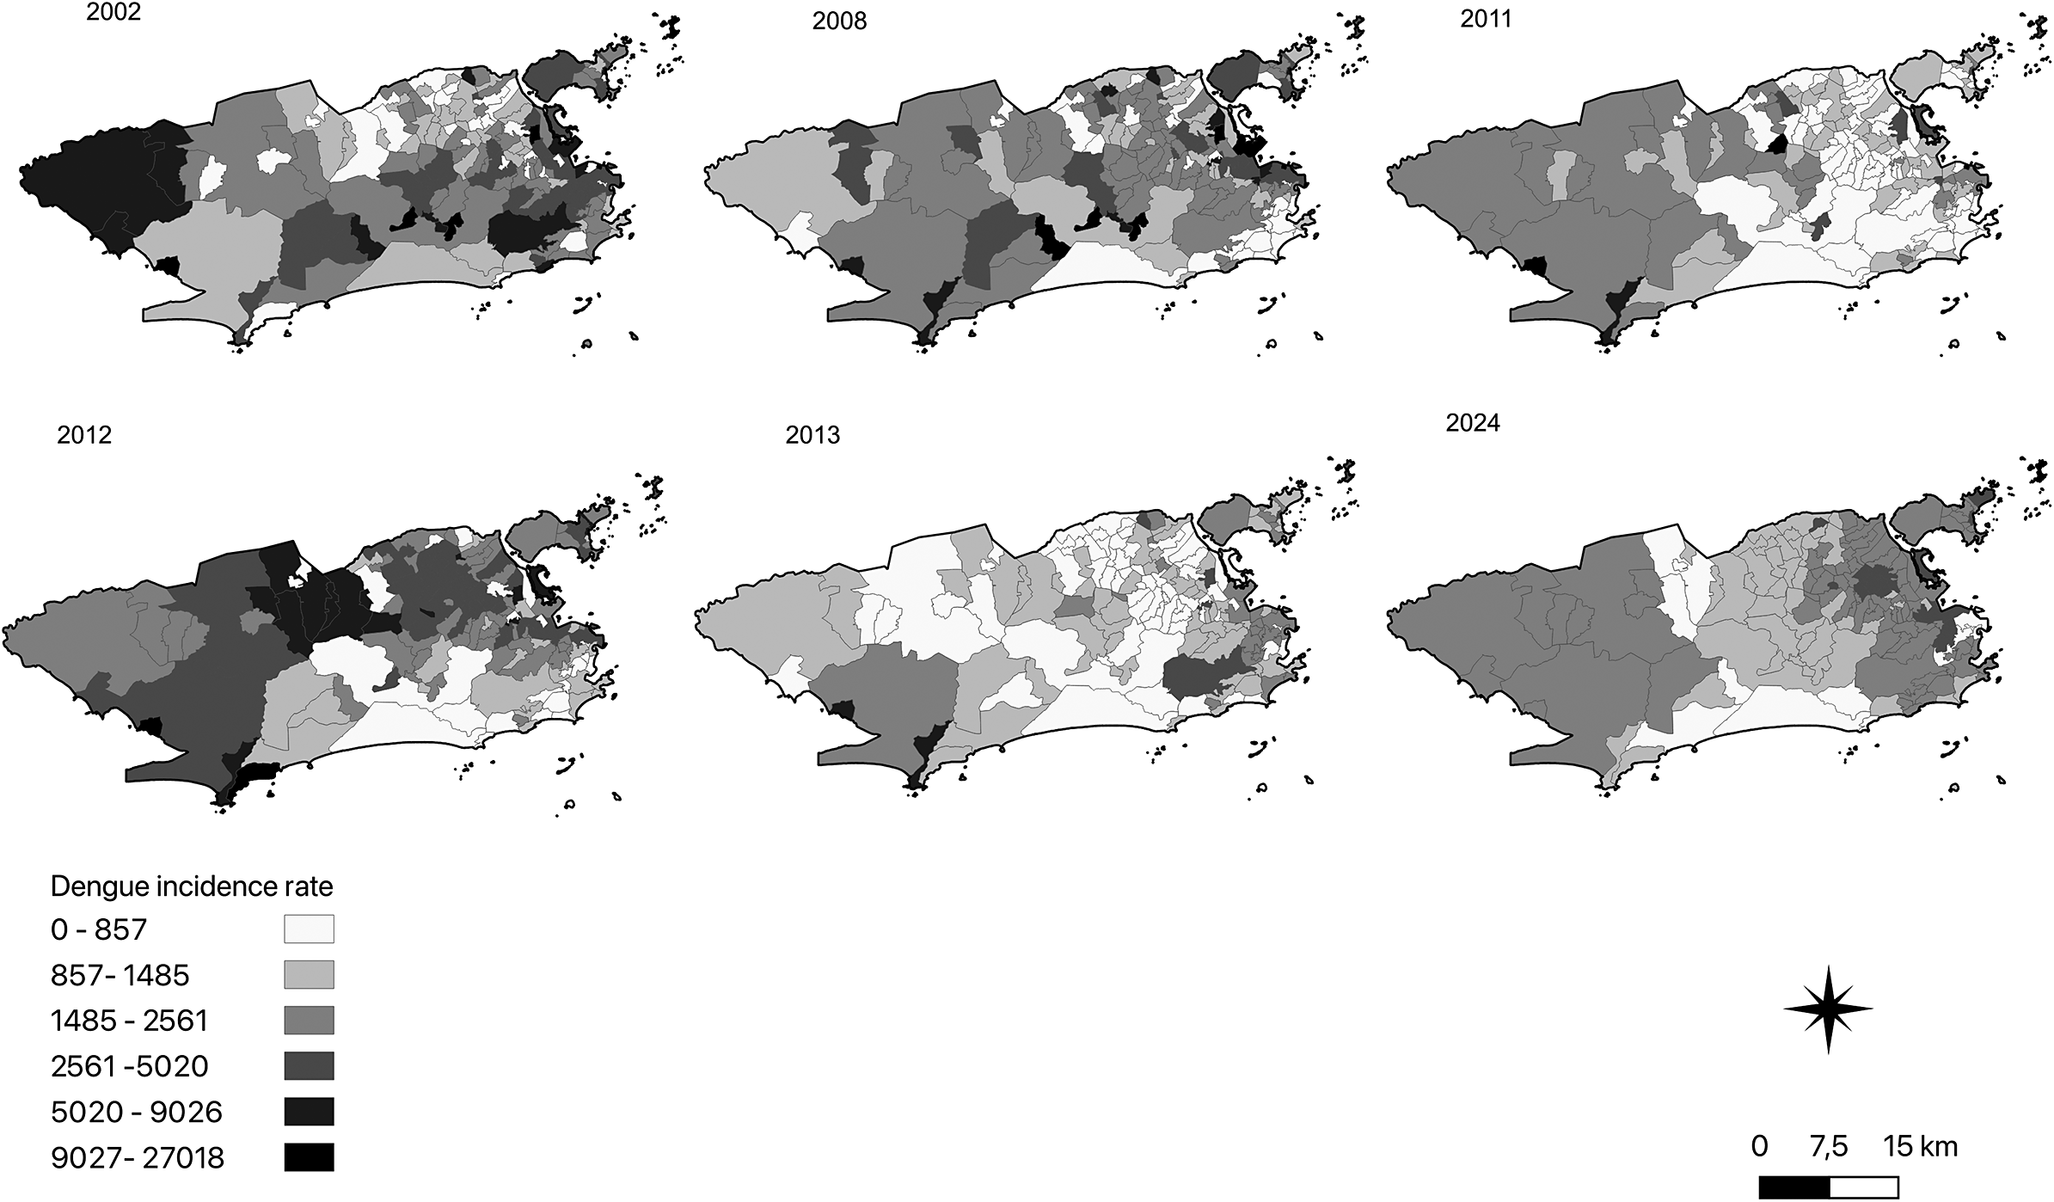
Figure 3. Sequential maps of the local empirical Bayes annual incidence dengue rates in the neighbourhoods of the city of Rio de Janeiro.
The maps with statistically significant LISA results reiterate the pattern of disease spread observed in the thematic maps. During the 2002 epidemic, high-incidence clusters (High-High) were located in the central zones, while low-incidence clusters (coldspots) were identified in the northern zone. However, as observed in the thematic maps, the incidence rate per neighbourhood was higher than in other years. In 2008, high-incidence clusters were also detected in neighbourhoods of the Central Zone and Jacarepaguá. In 2011, 2012, 2013, and 2024, the Guaratiba region in the western zone and small areas in the northern and central zones showed local clusters of high dengue incidence. In these years, the pattern of low-incidence clustering (Low-Low) was observed in other parts of the northern zone, the southern zone, and the Baixada de Jacarepaguá area (Figure 4).
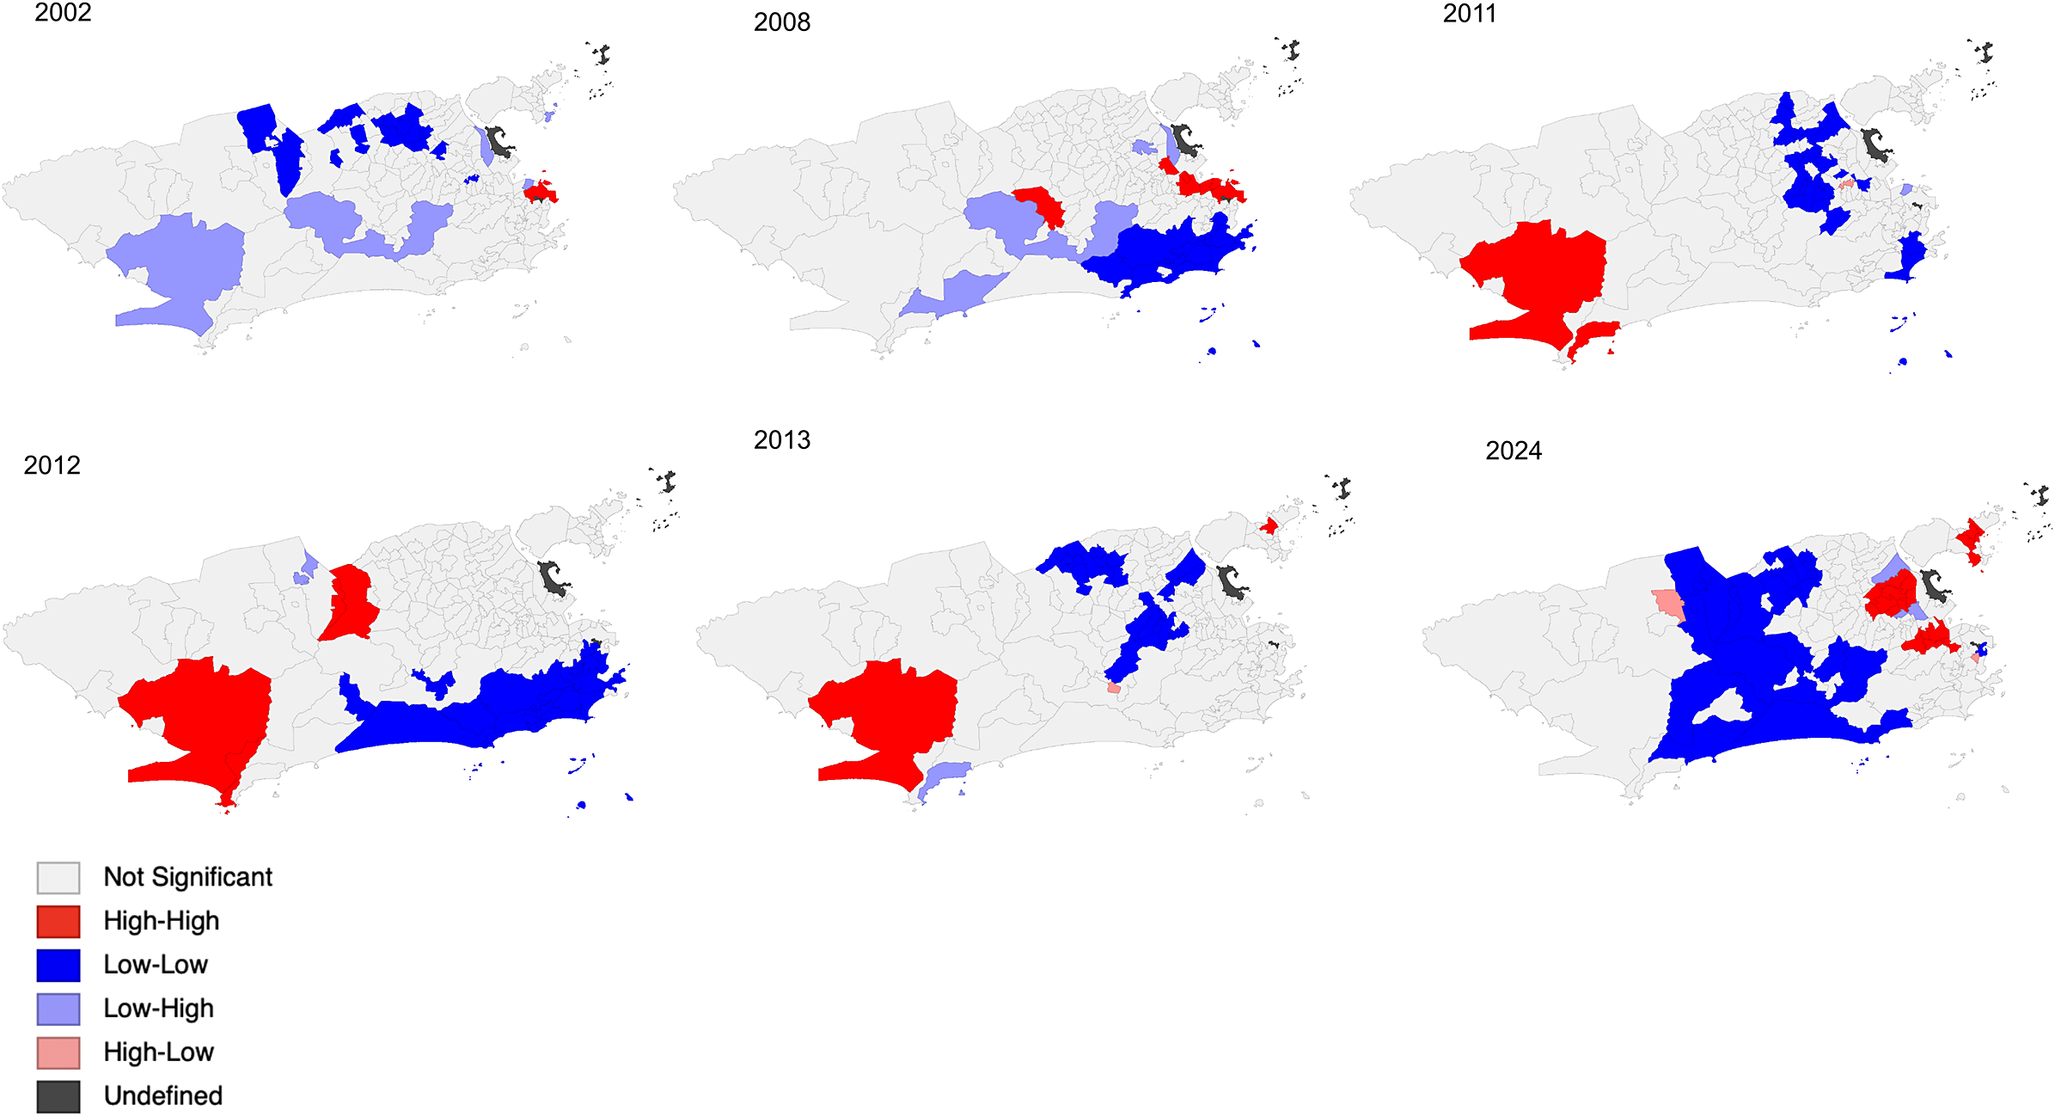
Figure 4. Maps of the local indicator of spatial autocorrelation (LISA cluster maps) of the local empirical Bayes annual incidence dengue rate in the city of Rio de Janeiro.
The analysis of the trajectory of the monthly geographic centre of dengue incidence shows the relevance of the transmission across the neighbourhoods of the north and west zones (Figure 5). In the 2002 epidemic, the trajectory of the geographic centre begins in the neighbourhoods of the west zone to the northern zone, during the first 4 months of the year, when the number of cases peaked. In the following months, when cases begin to decline, the trajectory returns to the north. In 2008, the trajectory of the geographic centre showed a similar geographical trend, moving towards the northern zone in the first months of the year, when most of the dengue cases occurred. In the following months, the trajectory moved back to the west-north zone border. In 2011, the trajectory of the geographic centre initially moved from a neighbourhood in the west zone to neighbourhoods in the north zone. In the following months, March to May, when cases peaked, the trajectory moved to the west zone and stayed there until the last trimester, when the incidence rate rose again, it moved to neighbourhoods at the west-north zone border. In the 2012 epidemic, the geographic centre of the epidemic stayed in the west the first semester, when more than 90% of the reported cases were registered. However, in the following months it moved towards the north neighbourhoods, remaining there for the rest of the year. In the 2013 epidemic, the trajectory of the geographic centre stayed in the neighbourhoods of the west zone, close to the border of the north zone. In 2024, until the month of August, the trajectory covered neighbourhoods in the western zone.
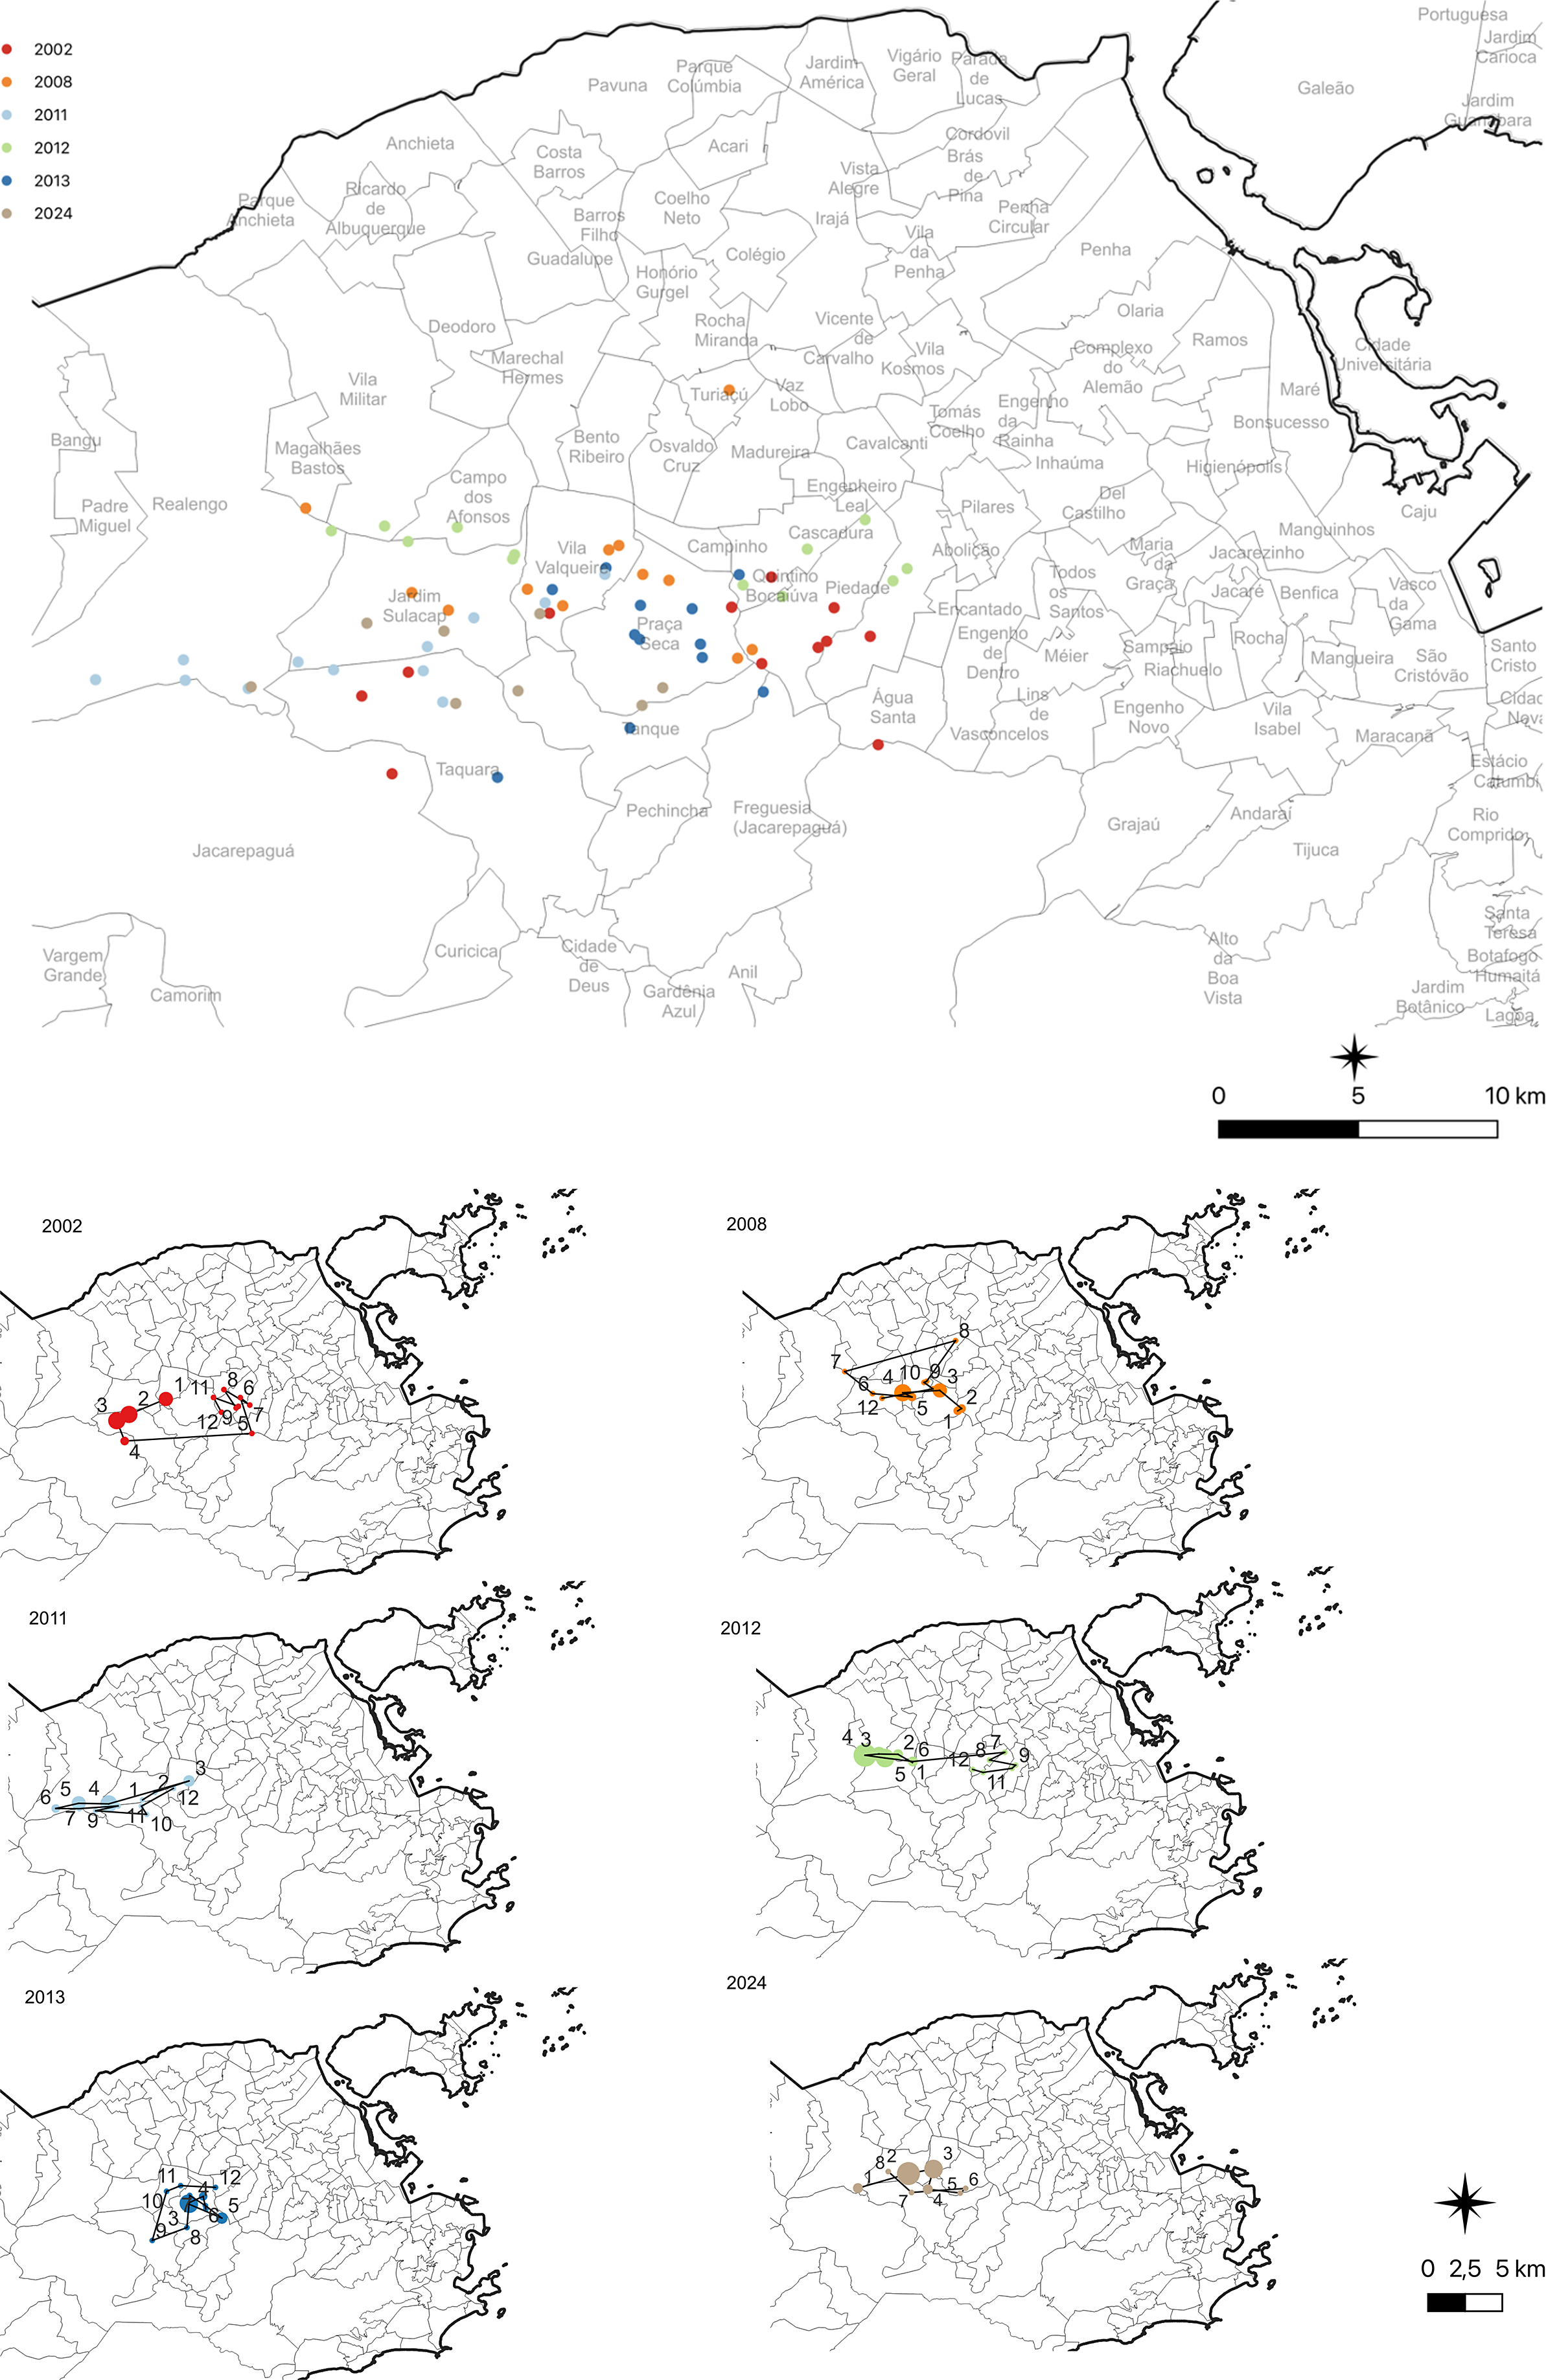
Figure 5. Map of the trajectory of the annual and monthly mean geographic centre, indicating where the geographical centre would be in the situation in which the dengue incidence rates were homogeneously distributed across the neighbourhoods of the city of Rio de Janeiro.
Discussion
The present study described the distribution of dengue and its trajectory throughout the neighbourhoods of the city of Rio de Janeiro in the epidemic years 2002, 2008, 2011, 2012, 2013, and 2024. The thematic maps indicate a spatial pattern of dengue epidemics in which the neighbourhoods in the west zone concentrated the highest intensity of cases, especially in 2011, 2012, and 2013. In previous years, such as 2002 and 2008, high incidence clusters were more concentrated in specific areas, such as the central and northern zones. In 2024, the distribution of dengue was broader, affecting practically the entire city, with greater intensity in the western and central zones. The 2024 epidemic showed a spike in reported cases in a broader range of months compared to previous years. For instance, in 2024, significant peaks occurred between February and May, whereas earlier epidemics, such as the one in 2002, had peaks concentrated primarily in the early months of the year.
The LISA results indicate areas of hotspot in the west, north, and centre zones. Corroborating this finding, we found that the movement of the trajectory of the geographic centre occurred more intensely in the neighbourhoods of the west zones in the first semester, when cases tend to be higher, and in the border of the north and west zone in the second semester, when incidence is at the lowest level.
Epidemics were characterized by an increase in the number of cases in January, with short peaks and variation in peak months. In the 2002 epidemic, the three serotypes, DENV-1, DENV-2, and DENV-3, circulated, with a high number of cases of haemorrhagic dengue and deaths, which has been attributed to the predominance of the serotype 3 [Reference Casali6]. In 2008, studies showed that during this epidemic, there was a change in the epidemiological profile, characterized by an increase in severe cases in children under 15 years of age, a severity attributed to the simultaneous circulation of DENV-2 and DENV-3 serotypes in Rio de Janeiro in a susceptible population [Reference Pone28–Reference Teixeira31]. In the epidemic period from 2011 to 2013, the most prevalent circulating serotype was DENV-4, which has lower virulence than other serotypes [32], and in 2024, the circulating serotypes were DENV-1 and DENV-2 [33].
Dengue epidemics manifest themselves in different ways in time and space, reflecting local dynamics that change over time, and climatic factors, mainly increased temperature and precipitation, are also important determinants of vector reproduction and propagation, although these relationships may vary geographically in Brazil [Reference Barreto and Teixeira30]. Its dissemination occurs through a complex process that involves the capacity and competence of the vector, population mobility, acquired immunity levels, living conditions, the provision of health services, and changes in socio-environmental and demographic factors [Reference Barreto and Teixeira30].
In Rio de Janeiro, the dengue incidence and the abundance of vectors follow seasonal patterns, with an increase in the number of cases during the summer, from December to March, when high rainfall and high temperatures are observed [Reference Câmara34]. Câmara et al. suggest that hot and dry summers, with an average monthly minimum temperature above 22 °C and rainfall below 200 mm/month, constitute a critical risk for dengue epidemic peaks in the city [Reference Câmara34]. Honório et al. found an association between A. aegypti abundance and average weekly temperature of 22–24 °C in three neighbourhoods in Rio de Janeiro [Reference Honório17]. Dos Reis et al. identified more eggs and adult mosquitoes during summer [Reference dos Reis35].
Rainfall data from the Rio de Janeiro city hall showed that rainfall volumes in 2002 were the lowest among the years analyzed. In contrast, the 2008, 2011, and 2012 years presented a more balanced rainfall distribution, with peaks in specific months but without extreme values like those observed in 2013 and 2024. In 2008, the rainiest months were March and December; in 2011, April and December; in 2012, January and June recorded the highest volumes. In 2013, January was exceptionally rainy, and in 2024, the highest rainfall occurred in January and March, which may have contributed to the increased availability of mosquito breeding sites in the following months, alongside the El Niño phenomenon [36–Reference Cai39].
In recent years, dengue has reached record levels of confirmed cases globally and in the Americas. Some researchers suggest that this increase may be linked to climatic factors, such as climate change and the influence of the El Niño phenomenon. On a global scale, it is speculated that the rise in average temperatures has created more favourable conditions for the virus’s spread. In the Americas, the warming and the effects of El Niño may have contributed to the intensification of recent outbreaks [38–Reference Pasquotto41].
Thus, climatic factors and socioeconomic factors, may have increased the vulnerability of the neighbourhoods in the north and west zones of the city. The relationship between climate patterns and the incidence of the disease reinforces the importance of monitoring meteorological variables to predict and mitigate future epidemics. However, other factors, such as the circulation of new serotypes of the virus and the susceptibility of the population (low levels of immunity), are also important determinants of epidemic outbreaks.
The neighbourhoods in the north and west zones have socio-environmental, historical-geographical, and land use and occupation characteristics that favour the occurrence and spread of dengue in these territories [21]. The north zone is the area with the highest population density in the city, and one of the areas with the highest concentration of subnormal agglomerations or favelas like Complexo do Alemão and Complexo de Manguinhos [Reference Almeida, Medronho and Valencia7]. The region’s uncontrolled growth has been associated with the formation of irregular settlements and areas where the accumulation of stagnant water favours the reproduction of A. aegypti. Infrastructure and sanitation issues, such as irregular water supply, often lead to inadequate storage, and sanitation issues, such as irregular water supply, often lead to inadequate storage in containers that, in turn, become breeding grounds for the vector. In addition, the intense circulation of people, favoured by the proximity of major roads such as Avenida Brasil and Linha Amarela, influences the movement of infected individuals, which, combined with environmental and social factors, impacts the transmission dynamics.
The west zone, in turn, is the second largest in area, with approximately 1/4 of the city’s territory, and is characterized as a region of urban expansion, it was one of the last areas of the city to be occupied based on the pilot plan for urbanization and zoning, which covers Jacarepaguá and Barra da Tijuca [Reference Pasquotto41]. Although some neighbourhoods in Baixada de Jacarepaguá are predominantly occupied by middle and upper-class populations, such as Barra da Tijuca and Joá, most neighbourhoods in this area have a low Social Development Index (SDI), characterizing the great heterogeneity that exists throughout the city [21]. The gradual occupation of the banks of streams and lakes led to deforestation, silting of streams, and expansion of slums with precarious infrastructure [Reference Câmara34]. Furthermore, more recently, a new generation of urban projects, driven by a series of major sporting events, such as the Pan American Games (2007), the World Cup (2014), and the Olympics (2016), have gradually expanded to the western zone of the city [Reference Vico and Azevedo42].
Significant events have brought many changes to the region in a short period. Real state speculation and large-scale infrastructure projects, intensified by preparations for events such as the Pan American Games and the 2016 Olympics, have significantly altered local dynamics [Reference Vico and Azevedo42]. Rapid urban transformations often have environmental and social consequences that impact public health, especially in regions experiencing uncontrolled growth. During the rapid urban expansion of the Jacarepaguá and Barra da Tijuca region, vulnerable communities, such as Vila Autódromo, were displaced without access to adequate housing and infrastructure, forcing many families to move to peripheral areas with precarious sanitation and public services [Reference Vico and Azevedo42]. This process not only exacerbated the population’s social vulnerability but may also have created conditions conducive to the proliferation of A. aegypti, with vacant lots, unfinished construction sites, and stagnant water accumulation, increasing the risk of dengue transmission in these regions.
Land occupation and urban expansion in the city are marked by morphologies that favour social inequalities, factors that contribute to the endemic and epidemic conditions of dengue [Reference Mendonça, Souza and Dutra1, Reference Tauil4, Reference Luz16]. Studies have shown that the distribution of dengue cases and the A. aegypti vector in the city’s neighbourhoods are not homogeneous, reflecting precarious infrastructure and deficient basic sanitation services in certain regions [Reference Luz16, Reference Honório17]. A study suggests that the areas of greatest persistent risk in the city are concentrated in regions of low social development and in areas of expansion of an urban occupation that has not yet been consolidated [Reference dos Santos43]. Almeida et al. highlighted that some neighbourhoods in the west, occupied in recent years and with poor and precarious basic infrastructure conditions, presented a high number of dengue cases in 2001 and 2002, although the 2002 epidemic also strongly affected the north and centre regions of the city [Reference Almeida, Medronho and Valencia7].
The contingency actions against dengue and other arboviruses carried out by the Environmental Health Surveillance of SMS/RJ are intensified according to the seasonality of these diseases. The municipal contingency plan for arboviruses has six components that must be adapted to local characteristics: epidemiological surveillance, vector control, assistance, education and social mobilization, communication, and management [18]. Although this plan included integrated dengue control strategies, historically, actions to combat the vector are the most used, mainly chemical control. Among the various vector control methodologies, the Infestation Index Rapid Survey (LIRAa) and ovitrap (oviposition trap) surveillance are the most used. According to Oliveira et al. [Reference Oliveira44], ovitrap surveillance has greater sensitivity for capturing A. aegypti compared to traps for adult mosquitoes, indicating the need to expand vector control measures [37]. Although chemical control remains the primary tool used, other strategies are essential to minimizing epidemics and the continued circulation of dengue serotypes in Rio de Janeiro. One notable strategy, developed in partnership between the Municipal Health Department (SMS), Fiocruz, and the World Mosquito Program Brazil (WMP Brazil), is the Wolbachia Method implemented in several locations in Rio de Janeiro since 2016 [Reference Oliveira44]. However, to date, there are no official publications on its results [45]. Furthermore, increased uptake of the dengue vaccine, distributed at city clinics, can significantly contribute to reducing the transmission of the disease.
Dengue control is a challenging task, particularly in vulnerable areas where inadequate public services and urban violence hinder the implementation of continuous and effective control strategies. In addition to social determinants, environmental factors play a crucial role in dengue transmission [Reference Barcellos40]. Rainfall and the presence of bodies of water create conditions favourable to the proliferation of A. aegypti, while climate change can influence the spatial distribution and seasonality of the disease. The dynamics of disease transmission extend beyond the health sector. Intersectoral actions are crucial to enable shared decision-making between different areas of government, ensuring a more effective response to the problem [Reference de Freitas, Rodrigues and Almeida46]. Furthermore, active participation of civil society and health education initiatives is essential, not only to keep environments free of mosquito breeding sites but also to monitor and hold public authorities accountable for their actions [Reference Chaves, Silva and Rossi47].
The spread of dengue occurs through a complex process that involves the capacity and competence of the vector, the mobility of the population, living conditions, the provision of health services, the levels of immunity acquired by the population, and changes in socio-environmental factors and demographics [Reference Xavier9]. The city of Rio de Janeiro has undergone important transformations throughout its history, such as the Pereira Passos Urban Reform and the urban revitalization of the port area, known as Porto Maravilha, which changed the transport and housing structure, access to social facilities, and the urban infrastructure of many neighbourhoods [Reference Pasquotto41]. These transformations altered the urban structure, leading to the disorderly growth of neighbourhoods in the west zone, mainly around the Olympic Park, and the removal of communities due to the construction of streets and roads, among others [Reference Vico and Azevedo42].
We used an eminently descriptive analytical approach that allowed us to identify areas with a higher risk of occurrence, including their temporal variation, where dengue control can be prioritized. However, additional analyses are necessary to better understand the spatial and temporal patterns of dengue occurrence identified in this study. In this context, analyses focusing on the circulation of different serotypes of the virus, the level of immunity of the population, and situations of greater socio-environmental vulnerability are necessary. One limitation was the lack of knowledge about the degree of underreporting of cases or the delay in recording notifications, situations that may occur more frequently during epidemic periods. Another limitation of the study is the use of data from 2024, which may be subject to review until investigations are concluded.
The present study highlights situations in which the epidemic spreads by analyzing the trajectory of the geographic centre of dengue occurrence and identifying clusters of high and low incidences of the disease. These analyses can be useful in informing more intensive, integrated, region-specific control strategies.
Conclusion
Dengue in the city of Rio de Janeiro manifests heterogeneously, with high incidence clusters shifting throughout epidemic years, mainly towards the west zone of the city. Spatial analysis of the disease reveals a complex system, likely influenced by the interaction between population immunity levels and changes in socio-environmental and demographic factors. The incidence of dengue in the city follows seasonal patterns, with an increase in cases during the warmer and rainier months of the year. Neighbourhoods in the north and west zones, with their specific socio-environmental characteristics, are more prone to disease outbreaks, reflecting social inequalities and poor infrastructure and sanitation conditions in these areas. Dengue control strategies must be intensive, integrated, and targeted to specific regions, considering not only vector elimination but also improving the living conditions of the population. Continuous epidemiological surveillance and the adoption of effective preventive measures are essential to contain the spread of the disease and reduce its impact on public health in the city.
Supplementary material
The supplementary material for this article can be found at http://doi.org/10.1017/S0950268825100162.
Author contribution
Bárbara Campos Valente contributed to the conception, critical analysis, structuring, drafting, and final revision of the article. Ana Paula Razal Dalvi contributed to the critical analysis, structuring, drafting, and final revision of the article. Guilherme Loureiro Werneck contributed to the conception, critical analysis, structuring, drafting, and final revision of the article.
Competing interests
The authors declare no conflict of interest.
Acknowledgements
This study was partially funded by MCTIC/FNDCT-CNPq/MEC-CAPES/MS-Decit (#440691/2016-8), and FAPERJ (E-26/202.677/2019).


 Open access