INTRODUCTION
Legionnaires' disease (LD) is an atypical pneumonic infection, with over 5000 cases diagnosed across Europe each year [Reference Joseph and Ricketts1]. Legionella bacteria are aquatic and aerobic, and are ubiquitous in natural and artificial water environments worldwide [Reference Fliermans2]. They are frequently found in domestic and public water systems, and in evaporative cooling water systems used for air conditioning or industrial cooling [3]. The organism infects humans through aerosol transmission (or rarely through aspiration).
Laboratory studies have demonstrated that temperature and relative humidity (RH) play important roles in the growth and replication of legionellae [4–Reference Hambleton7], and that ultraviolet (UV) light can inhibit growth of the bacteria [Reference Antopol and Ellner8]. Epidemiological observational studies suggest that there is an association between case numbers and both temperature and RH [Reference Fisman9], and also suggest that there may be an association with rainfall [Reference Hicks10, Reference Karagiannis11]. Sunlight duration may also play a role, but its effects are less clear [Reference Karagiannis11]. A combination of warm temperature and high RH have been recorded multiple times in association with outbreaks [Reference Ferre12, Reference Sala13], while gentle winds [Reference Anderson14, 15] and heavy rains have also been implicated [Reference Hoyle, Wickramasinghe and Watkins16, Reference Thacker17].
In order for legionellae in the environment to cause disease, the conditions in the water source must be suitable for bacterial growth and replication, aerosols containing the organism must be formed by an apparatus capable of generating an aerosol, and the organism must survive in the atmosphere long enough to disseminate widely in order to encounter a susceptible host. Meteorological factors may influence any of the stages of this process and thereby influence the probability of infection.
This paper uses a case-crossover analysis to examine the relationship between sporadic cases of community-acquired LD in England and Wales and five meteorological variables: temperature, RH, rainfall, windspeed, and UV light.
METHODS
The case dataset
Information on all cases of LD diagnosed in residents of England and Wales is collected by Public Health England (PHE) [formerly the Health Protection Agency (HPA), Colindale]. Cases are diagnosed by local laboratories and reported to their health protection team which has responsibility for completing a national surveillance questionnaire for each case containing demographic, clinical and microbiological information, as well as information on the case's exposure history. This is then sent to the Communicable Infectious Disease Surveillance Centre, PHE and entered into the national dataset. All community-acquired cases (individuals who did not report overnight travel or hospital stay during their incubation period) that occurred between 1993 and 2008, and which had not been associated with an outbreak, were selected for inclusion in this study.
Between 1993 and 2008, 2173 community-acquired cases were reported for English or Welsh residents. Of these, 470 were known to be associated with an outbreak and were removed from the dataset. To aid the analyses, those cases that could not be allocated to a region of residence (n = 13), and those cases without a date of onset (n = 14), were also removed from the study. This left 1676 cases for analysis.
The weather dataset
Weather data were obtained from Met Office Land Surface Observation Stations Data (‘MIDAS’ – Met Office Integrated Data Archive System) held by the British Atmospheric Data Centre [18]. Data for each variable were downloaded from all available weather stations which had readings for at least 75% of days for the period 1993–2008 for that variable. A single regional series was derived for each parameter, weighted by population.
Temperature data was extracted as maximum daily air temperatures in degrees Celsius (°C) to the nearest 0·1°C. RH data was extracted as hourly dewpoint temperature and hourly air temperature, both measured to the nearest 0·1°C. RH was calculated using the following formula:
 $$\eqalign{ {\rm RH} =& 100 \times \exp \left( {2 {\cdot} 453 \times \displaystyle{{10^6} \over {461 {\cdot} 5}}} \right. \cr & \times \left( {\displaystyle{1 \over {273 {\cdot} 15 + {\rm airtemp}}}} \right.\left. {\left. {\, -\, \displaystyle{1 \over {273{\cdot}15 + {\rm dewpt}}}} \right)} \right).} $$
Readings were available for 09:00 and 15:00 hours each day, and the mean of these two readings was used to comprise the daily dataset for the study.
Rainfall data was extracted as the daily precipitation amount in millimetres, and wind data was extracted as the daily mean wind speed in knots. Data was imputed for any missing daily readings for each weather variable (with the exception of rainfall data), using the AIRGENE method which was developed for use with air pollution data [Reference Ruckerl19]. Missing rainfall data were calculated separately because of a strong positive skew observed in the data, using a simple alternative formula:
where i = date, j = monitor, k = month,
![]() $\bar x_{jk} $
= period average of monitor,
$\bar x_{jk} $
= period average of monitor,
![]() $\bar z_i $
= mean regional value for 1 day, and
$\bar z_i $
= mean regional value for 1 day, and
![]() $\bar z_k $
= mean regional value for 1 month.
$\bar z_k $
= mean regional value for 1 month.
Data on UV radiation for England and Wales was obtained from HPA Chilton. Data series were available for three sites (Camborne, Chilton, Leeds), and each region was allocated the data series for the closest geographical station. The UV data are based on 5-min averages of erythemally effective irradiance (EEI) (measured in mW/m2). These readings are averaged across the hour, multiplied by 3600 s, and summed across the day to give the total radiant exposure for each day.
Analytical methods
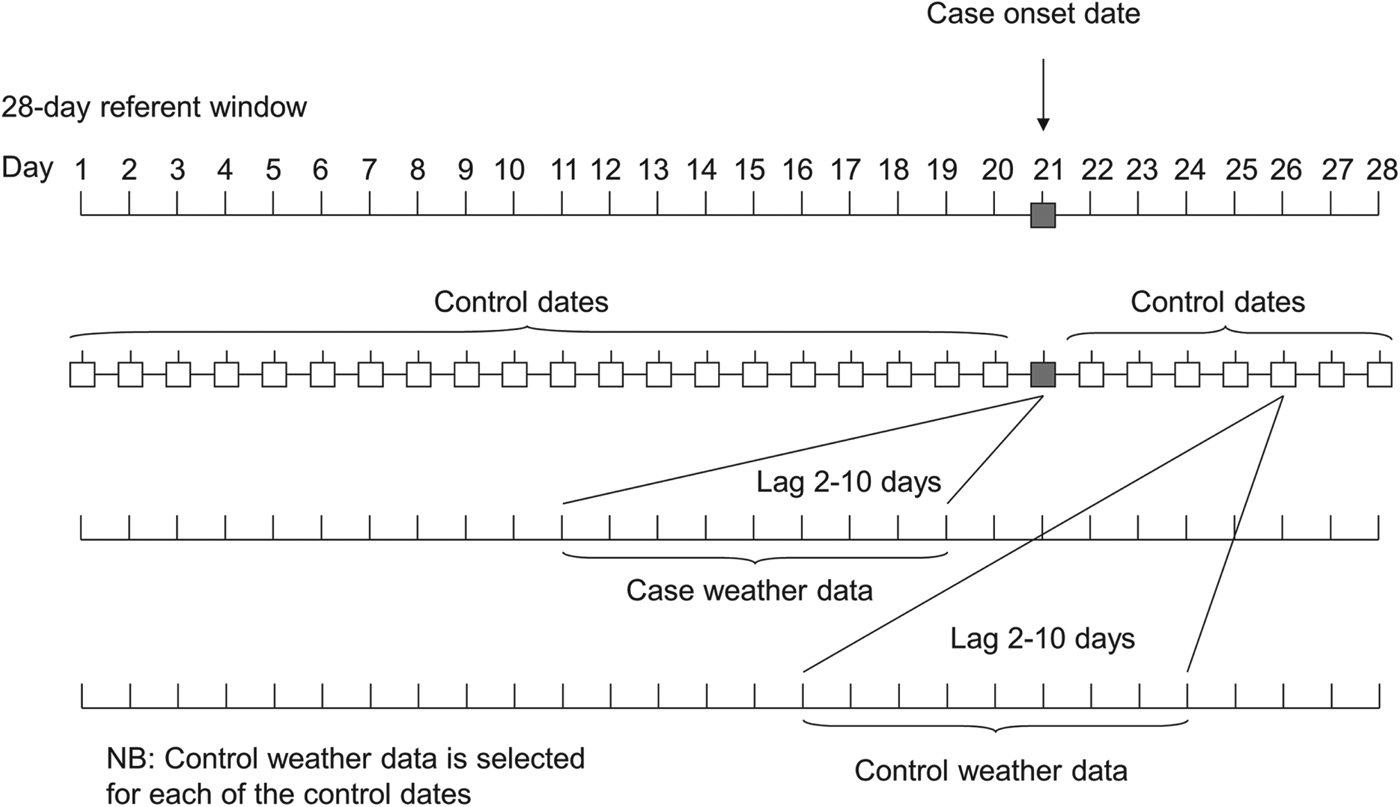
The relationship between the risk of LD and each meteorological variable was examined using a fixed stratum case-crossover analysis. Time was divided into periods of 28 days (‘strata’), and the stratum within which each case fell provided the control set for that case. The date of onset for each case was therefore allocated 27 control dates from the rest of the 28-day stratum, and together they formed a matched case-control set (see Fig. 1). These matched sets were analysed by conditional logistic regression, adjusting for ‘day of the week’ and for a 28-day linear term representing day within each lunar month.

Fig. 1. Schematic representation of selection of controls and weather data used in the analysis.
Time lags between meteorological conditions and disease onset were selected to reflect a lag due to (i) the incubation period (2–10 days) of LD (representing the delay between the meteorological conditions at the time of dispersal and the subsequent onset of disease) and (ii) for temperature and rainfall, the potentially longer lagged effect of environmental conditions on the growth of the organism in the environment. Seven-day moving averages were used to construct sets of weekly lag periods which were entered simultaneously into the regression models. Wald tests were performed to assess the value of adding each additional lagged term.
The (lagged) associations between the risk of LD and meteorological conditions were examined (i) using quartiles of each weather variable (with the overall coefficient for each quartile determined by linear combination of the coefficient for each component lag period included), and (ii) graphically by using natural cubic spline functions of each weather parameter fitted using the spbase command in Stata v. 9 (three internal knots placed at equally spaced percentiles, graphed as the predicted risk of LD relative to the mean of quartile 1) [20]. Robust standard errors were calculated clustering on government office region (GOR) to allow for spatial correlations within the data.
The relationship between each case of LD and each weather variable was examined initially in univariable analyses and then in a multivariable model that included all five meteorological variables regardless of statistical significance. Each variable was entered into the model using a natural cubic spline function with three internal knots, and with the lag structure developed in the single-weather analyses (these were largely lag periods of 2–10 days; however, week-of-lag terms were also considered for the temperature and rainfall models, and were used where there was evidence of a clear improvement in model fit).
An interaction between temperature and RH has been previously suggested in the literature [Reference Ricketts21], and we tested this using a simplified version of the multivariable model. RH was represented as a binary variable above and below the 25th centile (66·21%; lag 2–10 days), and temperature by a linear threshold model, with the threshold at the 25th centile (11·35°C; lag 0–9 weeks).
RESULTS
The number of sporadic, community-acquired cases of LD reported to PHE has increased substantially over the 16-year period covered by the study: the average number of cases per year between 1993 and 2000 was 62·5, and between 2001 and 2008 was 147. The male-to-female sex ratio of cases in the dataset was 3·6:1, and the highest proportion of cases (30·5%) fell within the 50–59 years age group. The majority of cases (41·4%) occurred in late summer, between July and October, consistent with European data [Reference Joseph and Ricketts1].
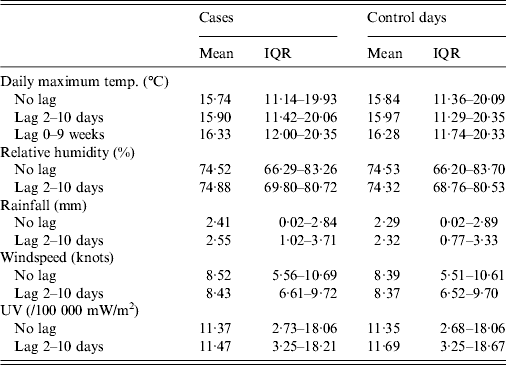
Each weather parameter was divided into quartiles. There were 1676 cases and 45 204 control days (each case was allocated 27 control days, with a small number of exceptions that fell at the beginning or end of the 1993–2008 time period, where meteorological data were available for fewer than 27 days). Summary data is presented in Table 1, with various lag periods.
Table 1. Meteorological data for case and control days (where a lag period is specified, the data is an average across that time period)

IQR, Interquartile range.
Univariable analysis
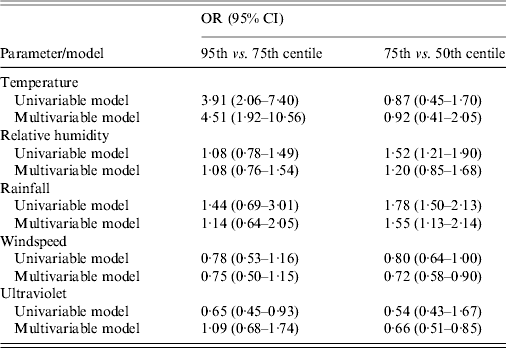
The univariable model for each variable, with quartiles and cubic splines can be seen in Figure 2, and odds ratios (OR) for 95th vs. 75th centiles, and 75th vs. 50th centiles are shown in Table 2.

Fig. 2. Univariable models for each meteorological parameter: natural cubic spline curves with point estimates and 95% confidence intervals for odds ratios by quartile of the parameter distribution. Vertical dotted lines indicate the 50th, 75th and 95th centiles of the relevant parameter distribution.
Table 2. Odds ratios (OR) and 95% confidence intervals (CI) for risk of Legionnaires' disease for each meteorological parameter in univariable and multivariable models. The multivariable model includes all weather variables fitted simultaneously

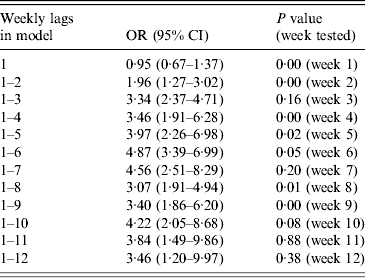
Lag effects were examined for 2–10 days and also by week of lag up to 12 weeks for temperature and rainfall. All week-of-lag terms were included where there was evidence of clear improvement in model fit. Only in the case of temperature was there such evidence (for lag effects up to 9 weeks), as shown in Table 3. For maximum daily temperature, we therefore included weekly terms for lags 1–9 weeks. For all other variables we used lags of 2–10 days.
Table 3. Odds ratios (OR) and 95% (confidence intervals (CI) for risk of disease at 24·5°C vs. 16·73°C (95th vs. 50th centile) at 1- to 12-week temperature lags, and P values for Wald tests of additional terms of lag. Based on natural cubic spline models with three internal knots

Multivariable model
For most weather variables, the patterns of association seen in the univariable models were broadly similar in the multivariable model (Table 2). The point estimate for the 95th vs. 75th centile comparison was slightly stronger in the multivariable model for temperature, and appreciably so for UV exposure, but somewhat lower for rainfall. The point estimates for the 75th vs. 50th centile comparison was weaker in the multivariable model for RH and rainfall, but not materially altered for the other variables. Overall, the evidence for windspeed and UV suggested no clear association with risk of LD, while temperature, RH and rainfall all showed some evidence of increased risk at mid to high levels.
The analysis of potential effect modification between temperature and RH suggests that the effect of temperature increased from an OR of 1·08 (for each degree increase above 11·35°C) for RHs below the 25th centile (<66·2%), to 1·18 for RHs ⩾25th centile. The inclusion of the interaction term significantly improved the model fit (P < 0·0001).
DISCUSSION
This study provides evidence of an association between sporadic, community-acquired cases of LD and some meteorological conditions, independent of season. It suggests that temperature and rainfall, and to lesser extent RH, may be associated with the risk of sporadic disease.
There appeared to be a lag of up to 9 weeks between air temperatures and disease risk, consistent with an effect of temperature on the growth and spread of the bacterium in the environment. Legionella bacteria are slow growing, and require the support of other organisms in order to multiply in the environment (e.g. algae, other bacteria, protozoa). Growth of photosynthetic primary producers (e.g. algae and cyanobacteria) will be followed by heterotrophic bacteria and other organisms, the protozoa that feed on them, and finally the legionellae that grow in the protozoa [Reference Fliermans22, Reference Taylor, Ross and Bentham23]. The long lag period may therefore reflect the time taken for the populations of other organisms to multiply in the environment and support Legionella growth. Additionally, the long lag period may reflect the time taken for air temperatures to warm the environment, including ponds and rivers; most sources of LD are fed by mains water systems, and mains water does not heat up quickly.
When RH was investigated in a single-weather model it appeared to show an association with LD, consistent with the findings of previous studies. However, the inclusion of additional weather variables in the model reduced this association, implying that the apparent relationship may have been driven by other weather parameters. This study also provides evidence of an association with rainfall during a case's incubation period, which may equate to the time of aerosol dispersal. This could be a result of rainfall ‘stirring up’ or ‘flushing through’ water systems; such conditions have been identified as important during outbreak situations [Reference Hoyle, Wickramasinghe and Watkins16, Reference Thacker17].
There appears to be evidence of association between conditions of low windspeed and a risk of LD, but the confidence intervals for the regression model were wide. Biologically it is plausible that any association would be strongest at very low, gentle windspeeds which would allow the aerosolized organism to disseminate but which would not be strong enough to break up the aerosol. However, it is difficult for weather stations to record windspeeds <2 m/s (equivalent to 3·89 knots) [24]. In addition, the approach used in this analysis of aggregating mean data from a large number of weather stations would tend to reduce extreme measurements.
The results from the UV model suggest that there may be an association present in the data, with a lower risk of disease >15 mW/m2 (and a generally protective effect at all levels in the multivariable model). This is biologically plausible: high UV levels may damage the aerosolized bacteria and reduce the risk of infection.
Limitations
The study inevitably has some limitations. Some of the lags identified were very long. This is unusual and it is difficult to disentangle the influence of the weather over a 9-week period from other seasonal effects. This study attempted to deal with the issue by controlling for seasonality through use of a case-crossover design, the addition of a linear 28-day term, and the inclusion of ‘day of the week’ as a categorical variable. This in itself is not without risk; there is a danger of a downwards bias in the results of the regression due to overly aggressive fitting of time trends.
Using regional meteorological data series may not fully represent the environmental conditions affecting the growth of legionellae since there can be appreciable geographical variations and disparities between day-time and night-time conditions.
This study also had to rely on the assumption that individuals contracted their disease within their region of residence. This was made more likely by the exclusion of any case that had been away from home overnight during their incubation period; however, the study could not account for individuals who had made day-trips outside the region, although this is likely to have had only a minor effect with regard to the misclassification of weather conditions. There are other factors which may influence the survival of Legionella in the environment, and which were beyond the scope of this analysis. As an example, air pollution may influence the survival of legionellae during their transmission in aerosol.
Other literature
Much of the previous literature on sporadic cases of LD and weather factors is recent. In 2006 there was a sudden, unexpected increase in the number of sporadic cases occurring in Northern Europe [25, Reference Joseph and Van Der Sande26]. Investigators established that there was no change in the circulating strain of Legionella that could explain the increase in case numbers, and no new sources of infection were identified; it was instead hypothesized that weather conditions might have been responsible [Reference Karagiannis11, Reference Ricketts21, Reference Conza27]. The findings in this paper are broadly comparable with the results of those studies.
A recent paper by Dunn et al. found an association between LD, RH and windspeed, but the association did not remain after controlling for season and year [Reference Dunn28]. In contrast, our study suggests that associations do remain, even after close control for time-related variables.
Public health implications
The associations identified in this analysis suggest that current control measures do not adequately curb the growth and distribution of legionellae during periods of high risk. There may be an opportunity to better target prevention measures to counter these raised risks. For example, it might be possible to monitor air temperature using a 9-week moving average, with the aim of identifying periods of high risk. A reminder could then be issued to public health professionals and water treatment companies of the importance of ensuring their systems have proper control measures in place. This type of alert is already carried out on an informal basis when risk periods are identified through environmental testing.
The work presented in this study may have implications for the future burden of disease. If the associations with temperature demonstrated here reflect a causal relationship, then the influence of climate change on the number of cases of LD should be considered. This study suggests that temperature may affect the growth and replication of bacteria in the environment; rising temperatures may result in a greater bacteria load within water systems which, when released into the environment, may result in an increased likelihood of exposure to infected aerosols. In addition, raised temperatures can affect people's behaviour and alter their exposure to infection: air conditioning systems are more often used during warm periods, people shower more frequently, and windows are left open.
CONCLUSIONS
In conclusion, this study presents evidence to show that there is an association between selected meteorological conditions and the occurrence of sporadic cases of community-acquired LD for cases detected in residents of England and Wales. It provides evidence of association between the risk of LD and temperature, with an apparently long time lag and possibly modified by RH, and between LD and rainfall at short time lags. These associations may be useful in targeting public health interventions during periods of high risk, as identified by weather conditions.
DECLARATION OF INTEREST
None.


