INTRODUCTION
Dengue, an arboviral disease in the tropics and subtropics transmitted by mosquitoes, has emerged as an international public health problem [Reference Gubler1]. Reasons for the resurgence of dengue in the tropics and subtropics are complex and include unprecedented urbanization with substandard living conditions, lack of vector control, virus evolution, and international travel [Reference Wilder-Smith and Gubler2]. Aedes aegypti is the main epidemic vector although transmission is also mediated by other Aedes mosquitoes. Dengue activity therefore depends on fluctuations in Aedes populations. Aedes populations depend on climate factors including temperature, humidity and rainfall [Reference Bangs3–Reference Li7]. Understanding the effects of meteorological variables on A. aegypti population dynamics will help to target control measures at the times when vector populations are greatest, contributing to the development of climate-based control and surveillance measures for dengue fever in a hyperendemic area.
A recent paper proposed haze as a possible additional factor influencing dengue transmission [Reference Massad8]. This hypothesis was based on several observations: smoke, a component of haze, is anecdotally claimed to repel biting insects [Reference Davis and Bowen9]. Fire to maintain grassland plant community also results in a reduction of arthropod diversity [Reference Hartley10]. Communities in the Solomon Islands use fire to protect themselves from mosquitoes [Reference Dulhunty11]. Based on mathematical modelling on Singapore's year to year oscillations of dengue, Massad et al. postulated that the reduction of dengue cases in 2006 was due to an increase in mosquito mortality in response to the disproportionate haze affecting the country that year [Reference Massad8]. The 2006 Southeast Asian haze event was caused by continued uncontrolled burning from ‘slash and burn’ cultivation in Indonesia, and affected several countries in the Southeast Asian region including Singapore. Fires in Indonesia produce great amounts of smoke, burn a long time and are difficult to extinguish because they are on peatland, and once lit the fires can burn for months and release gases that produce sulphuric acid [12]. The haze was made worse in 2006 than during previous occurrences by the El Niño-Southern Oscillation which delayed that year's monsoon season [12].
Singapore is a city-state in South East Asia that is endemic for dengue [Reference Massad and Wilder-Smith13–Reference Ooi and Gubler18]. Due to its geographical location Singapore suffers almost every year from hazes caused by wildfires from Indonesia. Such hazes have a significant impact on pollution indexes in Singapore. However, no studies are currently available that identify a direct relationship between shorter longevity of the vector under haze conditions, and therefore an association of dengue activity with haze remains a hypothesis to be tested.
Autoregressive integrated moving average (ARIMA) models have been proposed to forecast dengue activity [Reference Hu19, Reference Luz20]. ARIMA models are a useful tool for analysing non-stationary time-series data containing autocorrelation and seasonal trends [Reference Hu19, Reference Hu21]. The advantage of ARIMA over regression models is that they take into account correlation in the data and lag time: failure of which will result in incorrect standard errors and spurious significant results [Reference Brunkard, Cifuentes and Rothenberg22]. We set out to study the relationship of dengue activity and haze [measured as pollution standard index (PSI)] in Singapore, using ARIMA models.
METHODS
Data on weekly human dengue fever infections were obtained from the Weekly Infectious Disease Bulletin, which is freely available on the Singapore Ministry of Health (MOH) website [23]. The PSI is a proxy for haze smoke [12, 24]. We obtained the mean daily PSI values and mean daily temperature from the Meteorological Services Division of the National Environment Agency (NEA), Singapore for the period January 2001 to December 2008.
In order to ensure that the climate data was analysed in the same scale as dengue notifications, we aggregated the daily climate and pollution data into the 52 epidemiological calendar weeks using a customized software code, written in Stata version 10.2 (Stata Corp, USA).
Statistical model
ARIMA models are characterized by three key parameters, namely the autoregressive (AR) term, the moving average (MA) term and the differencing (D) term. The AR term relates the observation made at week t to the previous week (t−1) or earlier weeks. The MA term relates the error (defined as the difference between observed and predicted dengue cases) at week t to the previous week (t−1) or earlier weeks. Assuming θt is the observed dengue count, the D term allows modelling of the differenced series (i.e. θt−θt−1) in the event of non-stationarity in the time series.
The model used is as follows:
where ![]() and
and ![]() are the predicted dengue cases at week t and t−1 respectively, θt−1, θt−2 and θt−3 are observed dengue counts at weeks of lag 1, 2 and 3 respectively, μ and φ1, φ2 are the constant and autoregressive coefficients, respectively.
are the predicted dengue cases at week t and t−1 respectively, θt−1, θt−2 and θt−3 are observed dengue counts at weeks of lag 1, 2 and 3 respectively, μ and φ1, φ2 are the constant and autoregressive coefficients, respectively.
In an exploratory analysis, we examined the various choices of the ARIMA model formulation. With the aid of the autocorrelation and partial autocorrelation plots, we determined that the ARIMA (2,1,0) model best fitted the underlying seasonal trends of dengue in Singapore. Specifically, the model with an autoregressive term of order 2 and with differencing in the series provided a reasonable fit. Moreover, we noticed that the series was heterogeneous in terms of the variance across the years, and we analysed the data on a natural logarithmic scale to stabilize the variance and improve the estimation.
We ran different univariate models, each encompassing a different lag period for the effects of haze and temperature (from lag 0 to lag 12 weeks). Data analysis was performed in Stata version 10.2 (StataCorp.) and all tests evaluated at the 5% level of significance.
RESULTS
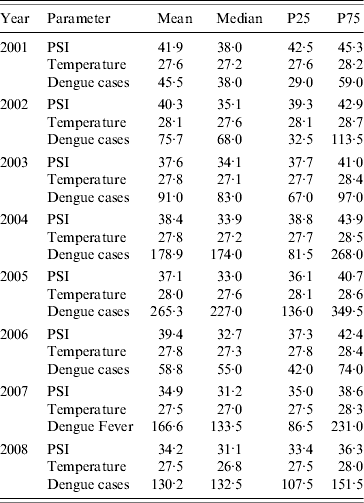
Table 1 describes the PSI across the years 2001–2008 in Singapore, in comparison with the mean daily temperature and mean weekly dengue cases. The PSI readings vary temporally, with values ranging from a median of 31 in 2008 to a median of 38 in 2001. The mean weekly cases of dengue also vary from year to year. In particular, the years 2005 and 2007 were characterized by an unusually large number of dengue cases (maximum weekly cases of 697 and 426, respectively; mean values are shown in Table 1).
Table 1. Mean, median and percentiles of pollution standard index (PSI), mean daily temperature, and mean weekly dengue cases by year

P25, P75 are the 25th and 75th percentile, respectively.
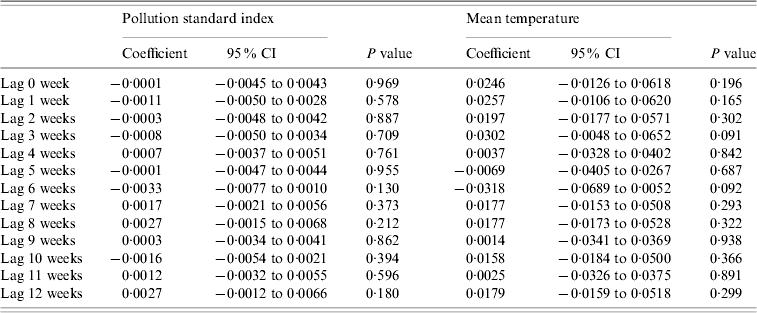
Table 2 shows the results of the univariate ARIMA models, examined from a lag of 0 week to 12 weeks. There was no significant relationship between mean PSI as well as mean temperature readings and dengue notifications across the various lag periods. We also analysed the data based on days of moderate to high PSI readings for each epidemiological week, based on the national threshold of >50. We found no association with dengue activity.
Table 2. Relationship between pollution standard index and temperature with dengue fever notifications

Results presented in the table are from univariate models.
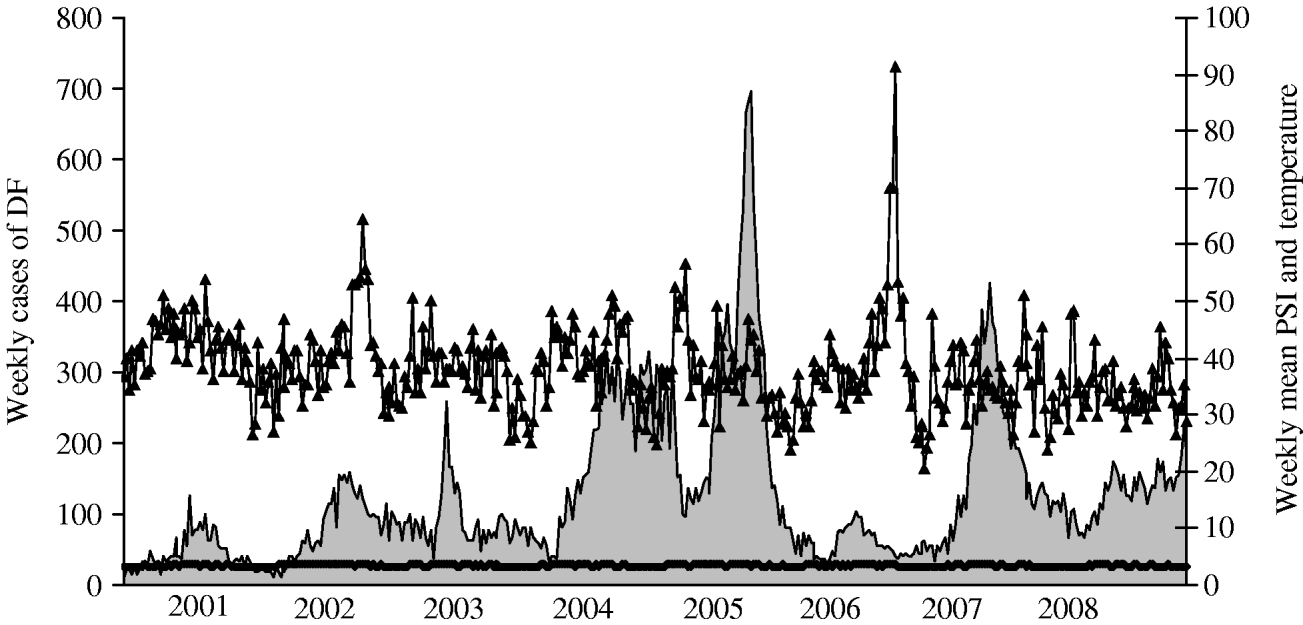
Figure 1 illustrates the temporal variations of dengue activity and PSI readings between 2001 and 2008.

Fig. 1. Weekly dengue cases (DF; ![]() ), pollution standard index (PSI; –▴–) and weekly mean temperature (
), pollution standard index (PSI; –▴–) and weekly mean temperature (![]() ) between 2001 and 2008 in Singapore.
) between 2001 and 2008 in Singapore.
DISCUSSION
Recently, Massad et al. submitted a hypothesis that haze leads to reduced longevity of Aedes mosquitoes which in turn results in reduced dengue activity [Reference Massad8]. This hypothesis was based on mathematical modelling and various assumptions rather than national epidemiological data – all in the context of the 2006 dengue activity and haze situation in Singapore. We used ARIMA models to test this hypothesis based on reported national data. We explored the relationship between weekly notifications of dengue fever and the PSI between 2001 and 2008 in Singapore. ARIMA models are more suitable to examine such relationships as they take into account the lag time as well as serial correlation in the data. In brief, we found no relationship between PSI and dengue activity in Singapore.
The study is limited to the years 2001–2008, because the weekly dengue notifications were not freely available on the MOH website before 2000. However, our findings are consistent with the historical observation that the most severe haze in Singapore's history in late 1997 to early 1998 did not result in reduced dengue activity in 1997 or 1998. In contrast, the incidence of dengue in 1997 and 1998 was the highest in Singapore in the 1990s, which represented the peak of a six- to seven-yearly cycle of dengue epidemic observed in Singapore [Reference Ooi, Goh and Gubler17]. High incidence of dengue was also observed in many Southeast Asian countries in 1997–1998, many of which were also affected by the haze that resulted from forest fires [25]. National and regional data therefore support the notion that haze did not result in reduced dengue activity.
The issues surrounding haze are complex. On one hand, the effect of haze on Aedes populations may be biologically plausible. Some data show that fire (particles of which are part of smog and haze) may reduce dengue activity, possibly mainly by reducing human-to-mosquito contact. Bushfires reduce arthropod diversity [Reference Hartley10]. However, haze is not the same as fire; in Singapore it is the result of fires several thousand kilometres away. Severe haze and smog may also result in people preferring to stay inside the homes which could also indirectly reduce exposure to mosquito bites, as current transmission of dengue in Singapore is thought to predominantly occur outside the home rather than indoors [Reference Ooi, Goh and Gubler17, Reference Ooi and Gubler18]. This could result in more exposure to dengue for those countries where dengue is mainly acquired indoors. Theoretically haze could reduce mean temperature, which would probably increase mosquito longevity as well as the extrinsic incubation period. Depending on the amount of temperature reduction, this could increase or decrease dengue transmission. However, variation of temperature is minimal in Singapore. Our ARIMA model did not show a correlation between mean temperature and dengue activity, probably due to the minimal variation and lack of seasons in Singapore.
PSI data is the overall pollution data, not only the haze. Therefore to directly correlate this information with haze may be misleading. However, particulate matter was the air pollutant that predominantly contributed to the haze and degradation in ambient air quality standards during the crises in 1997 and 2006. In all countries affected by the smoke haze, this translated into significantly raised PSI levels [24]. Although PSI values are only a proxy measurement for haze, it is currently the only measurement available as an indicator for smoke haze.
Our findings do not lend support to the hypothesis that smoke haze is associated with reduced dengue activity in Singapore. Other factors may be more plausible that would explain the year to year oscillations. Molecular epidemiological studies have shown that dengue epidemics have resulted from the emergence of new clades or subtypes of viruses that were associated with increased frequency of severe disease outcomes and epidemic potential [Reference Gubler26–Reference Messer29]. It is likely that different genotypes of the dengue virus interact differently with host factors and these then give rise to different disease manifestation and epidemiological outcomes [Reference Rosen30]. Factors related to the history of herd immunity, the introduction of a new serotype, El Niño oscillations or demographic transitions may also influence the cyclical transmission of dengue [Reference Wilder-Smith and Gubler2, Reference Cazelles31]. Case clustering information, regional dengue distributions, climate factors and population density transformations must also be obtained in order to assess the forecasting ability of any predictive model. However, haze is unlikely to play a significant role in dengue activity.
DECLARATION OF INTEREST
None.


