Introduction
The incidence of HIV and other sexually transmitted infections (STIs) among men who have sex with men (MSM) remains high. Neisseria gonorrhoeae (NG) is one of the most prevalent STIs in MSM [Reference Maes, Crombe and Crucitti1, Reference Dukers-Muijrers2]. There is considerable uncertainty as to the effectiveness and optimal targeting/timing of NG screening in MSM. Guidelines vary in advocating screening from every 3 to 12 months, which of three sites to test (urethra, rectum, pharynx) and how to determine which of these sites to test [Reference Workowski and Bolan3–Reference LeFevre6]. There is even some disagreement as to whether or not there is sufficient evidence to advocate screening. The US Preventive Task Force guidelines, for example, state that there is insufficient evidence to advocate for or against screening for NG in men [Reference LeFevre6]. In a systematic review conducted to inform these guidelines, the authors found no randomised, controlled trials or controlled observational studies that assessed the utility of NG screening in men [Reference Zakher7].
Optimization of NG screening in MSM is a non-trivial issue. NG has evolved resistance to a wide range of antibiotics and a number of authors have expressed concerns that urgent action is required to prevent it becoming untreatable with all known antibiotics [Reference Blomquist8, 9]. The combination of the known selection pressure that antibiotic use places on the emergence of resistance and the fact that NG resistance to a number of antibiotics has first emerged in MSM networks makes it particularly important to ensure that there is evidence that NG screening in this population has benefits that outweigh the risks of resistance induction [Reference Lewis10]. One of the major reasons to screen for NG is to reduce NG prevalence [Reference Kenyon, Osbak and Vandenbruane11]. In the absence of evidence from randomised controlled trials, mathematical models could help us to understand the effectiveness of NG screening on prevalence. In Belgium, we follow European guidelines which advocate at least annual screening of MSM for NG [12]. There is imperfect data on exactly what proportion of MSM is screened for NG in Belgium. The largest survey of MSM in Belgium that asked about STI screening was conducted in 2010 and found that 3.5%/19.4% reported having had anal/urine STI screening in the past year [Reference Ronti, Vanden Berghe and Nostlinger13]. The pharyngeal screening was not assessed. Since the prevalence of asymptomatic NG is typically ten times higher in the rectum than the urethra in MSM [Reference Dukers-Muijrers2, Reference Cook14], we used the 3.5% screening rate as a lower bound of NG screening coverage in Belgian MSM. A mathematical model was developed to evaluate if this, or higher levels of screening would have an effect on NG prevalence in our MSM population.
Methods
Overview
Separable Temporal Exponential Random Graph Models (STERGMs) are used to model the sexual relationships network in MSM (see Supplementary Appendix Box 1 for more details). The models simulate parallel networks for main partnerships and casual sexual contacts with parameters based on the European Men who have sex with men Survey (EMIS). Next, the transmission of Gonorrhoea is simulated on this dynamic network. The models are implemented using the R package statnet [Reference Handcock15]. However, this package only allows a single infection status per person: susceptible, infected or recovered [Reference Krivitsky and Handcock16]. We have adapted the package to include different infection statuses per person for the pharynx, urethra and rectum and a global infection status which indicates if the person is infected in at least one site. In addition, the different possible transmission routes (anal sex, oral sex and rimming) with their own act and transmission rate have been implemented. We differentiated the recovery rate between symptomatic and asymptomatic infections but assumed no difference in transmission rates. The model was used to compare different screening programmes in terms of the outcome on NG prevalence. Our models simulate day-by-day evolution for 10 years of a population of 10 000 MSM. Initial prevalence of NG was 3.4% in the pharynx, 1.5% in the urethra and 3.7% in the rectum. Each scenario was simulated 20 times.
The behavioural parameters (Supplementary Appendix Table 1) for our model were all taken from the Belgian participants in EMIS, an internet-based survey which recruited a large and diverse sample of MSM across Europe in 2010. The study was promoted through invitations in gay social media, websites for MSM and via non-governmental organisations in each participating country. The online questionnaire was available in 25 different languages and was extensively validated through a sequence of pilot projects. In total, 3982 MSM respondents completed the survey in Belgium [Reference Ronti, Vanden Berghe and Nostlinger13, 17]. For a detailed overview of the survey methodology and definitions of inconsistent responses please see the full EMIS report [17]. All procedures were approved by the Research Ethics Committee of the University of Portsmouth, UK (REC application number 08/09:21).
Main and casual partnerships
We simulated the formation and dissolution of main and casual partnerships. Of MSM without (with) a casual partner, 51% (45%) did not have a main partner, 47% (49%) had one main partner and 3% (6%) had multiple main partners. Conversely, 15% of MSM without the main partner, 17% of MSM with one main partner and 30% of MSM with multiple main partners reported a casual partner. The mean duration was 2318 days for the main partnership and 62 days for a casual partnership. In the main partnership, the probability of a daily sexual act was 30% and in a casual partnership 25%. The probability of the specific sexual acts (insertive and receptive oral sex, anal sex and rimming) is shown in Supplementary Appendix Table 2. For simplicity, these are assumed to be the same for main and casual partnerships.
NG infection
The basic model of gonorrhoea is that developed by Yorke et al. [Reference Yorke, Hethcote and Nold18]. Sexually active MSM are divided into three groups: (1) those that are susceptible, (2) those who are infected and are or will become symptomatic and (3) those who are infected and remain asymptomatic.
There is some evidence for strain-specific immunity in sex workers [Reference Plummer19] but at a population level acquired immunity does not appear to play a significant role in gonorrhoea epidemiology [Reference Fox20]. As such and in keeping with other models, our model assumes that individuals recovering from infection return to the susceptible category [Reference Garnett21].
Incubation period
The latent period (time from infection to infectiousness) for gonorrhoea is not known and hence we assume that the persons are infectious throughout their incubation period.
Asymptomatic infections
There is considerable variation between studies in the proportion of cases of urethral gonorrhoea that are symptomatic. Population- and contact-tracing-based surveys typically find lower prevalence [Reference Grosskurth22, Reference Handsfield23] and surveys of men attending medical services such as STD and men's health clinics find a higher proportion of urethral gonorrhoea being symptomatic [Reference Handsfield23–Reference Detels25]. Based on a literature review we have assumed the following proportions of infections to be symptomatic by anatomical site: pharynx 5%, urethra 60% and rectum 16% [Reference Chesson26–Reference Wallin and Siegel29].
There is no data available whether symptomatic and asymptomatic infections have different transmission probability. Therefore we follow the example of other modelling studies in assuming that relative transmissibility of asymptomatic infections is the same as that of symptomatic ones [Reference Garnett21, Reference Chesson26].
Duration of infection
Various studies estimate the duration of asymptomatic infection to be between 120 and 180 days [Reference Chesson26–Reference Orroth31]. We chose a duration of 120 days in the urethra [Reference Korenromp27] and rectum [Reference Chesson26, Reference Korenromp27] and a duration of 84 days in pharynx [Reference Fairley32]. For a symptomatic infection, a duration of 13 days was modelled [Reference Johnson, Alkema and Dorrington30].
Transmission probability per sex act
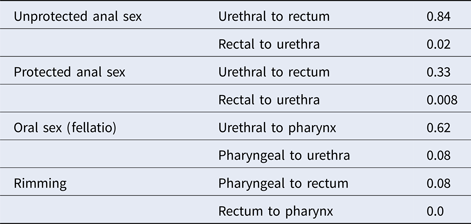
The transmission probabilities used in our model are shown in Table 1.
Table 1. Transmission probabilities per sexual act [Reference Hui34]

Screening and therapy
Reviews have established that screening the oropharynx, rectum and urethra via contemporary molecular techniques is highly sensitive and specific for the detection of the gonococcus at these sites [Reference Cook14]. As such in the model, we have assumed that screening detects all infections. The screening intervention is modelled as follows: individuals are sampled at random at daily intervals such that an individual will be sampled once every 12 months. The different screening programmes compared are no screening, 3.5% of the population screened, 32% screened and 50% screened.
Efficacy of therapy
In the San Francisco NG MSM screening programme 95% of those screened positive are given appropriate therapy [Reference Chesson26]. This occurs a median of 2 days after screening. Based on these data we assumed that all NG infections detected through screening would be effectively treated immediately after detection.
Antibiotics use
At each time point, the number of infected subjects was approximated as the maximum of the number of subjects with NG infection in the pharynx, urethra and rectum. This number was multiplied with the proportion of population screened to calculate the number of antibiotics treatment due to screening.
Results
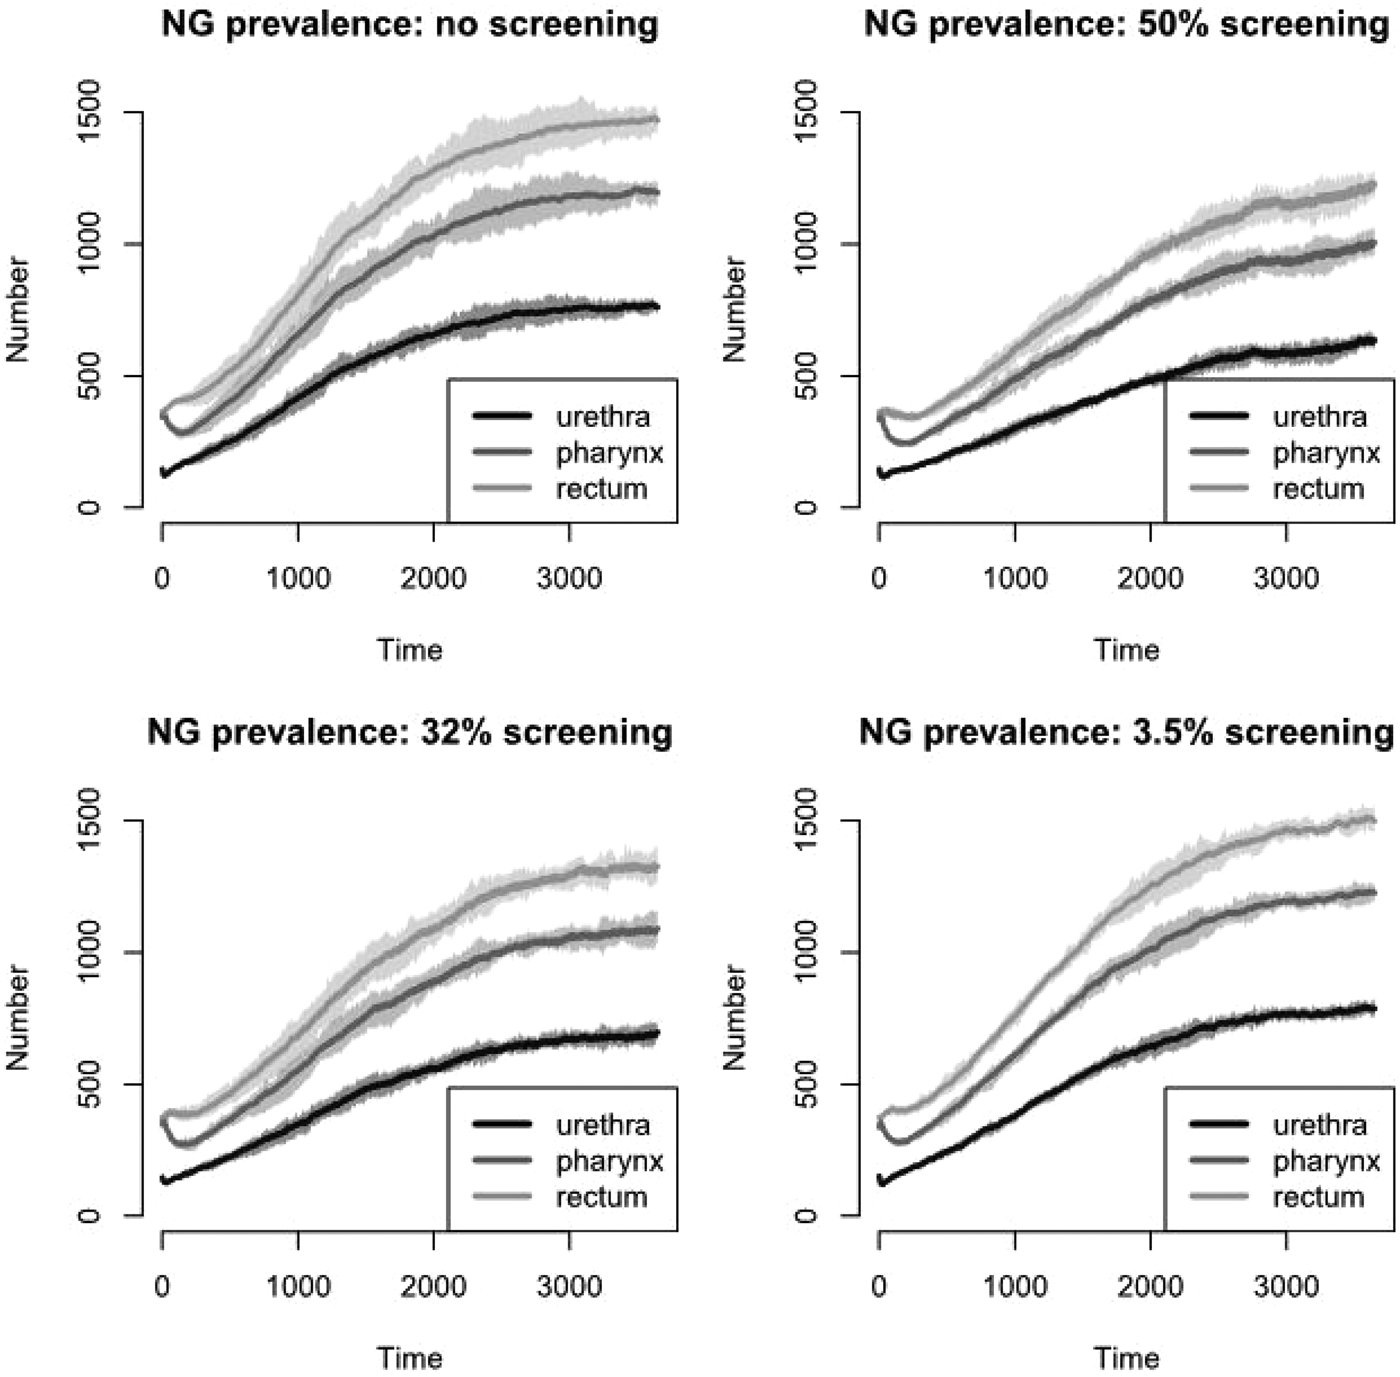
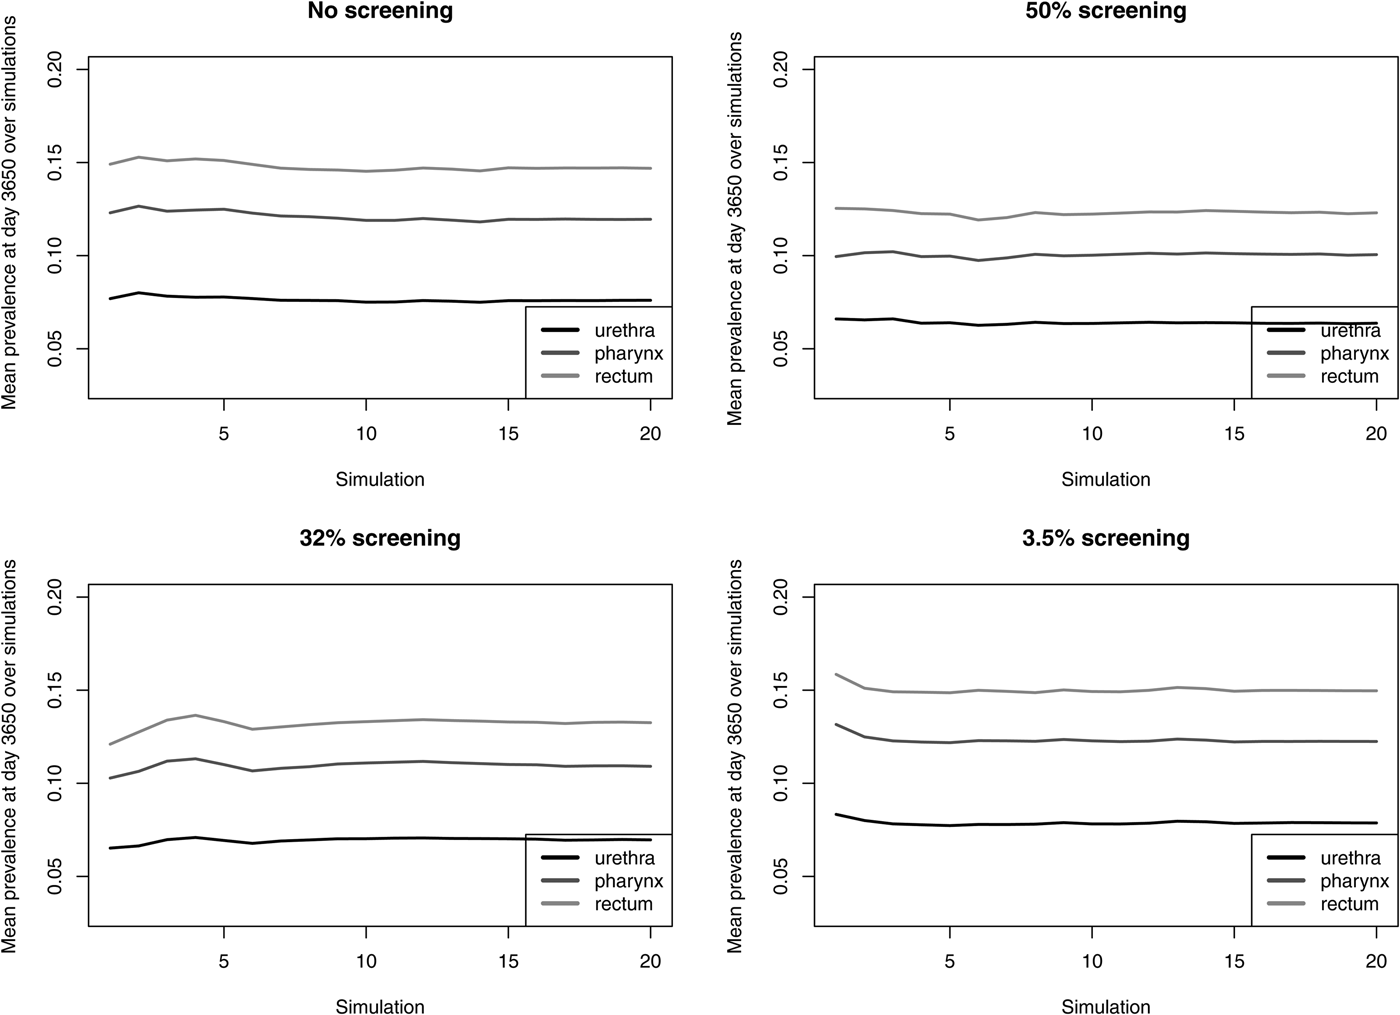
The prevalence of NG over time for the different screening programmes is shown in Figure 1 and Table 2. The screening level in Belgium in 2010 (3.5%) does not decrease prevalence compared with no screening. Even if half of the population would be screened, only a limited reduction in prevalence is attained, e.g. NG prevalence in the pharynx decreases from 11.9% to 10.2%. With 32% of the population screened, NG prevalence in the pharynx is still 11.0%. Analogous results hold for prevalence in the urethra and in the rectum (Fig. 1). Increasing the percent screened from 3.5% to 50% results in an 11-fold higher antibiotic exposure/proportion of the population treated for NG. Although only 20 simulations were run, the estimated prevalence is stable (Fig. 2).

Fig. 1. NG prevalence over time for various screening levels at pharynx, urethra and rectum, respectively.

Fig. 2. Mean NG prevalence at day 3650 over simulations for various screening levels.
Table 2. NG prevalence at day 3650 for various screening levels at pharynx, urethra and rectum, respectively

Discussion
Our model studies the impact of screening on NG prevalence. Reaching half of the MSM population with the screening programme only results in a limited reduction of NG prevalence. However, increasing screening uptake results in a dramatic increase in antibiotic exposure.
Our study has a number of limitations. Chief amongst these are the simplifying assumptions made in the model construction. First, in modelling the sexual network, the choice of partner does not depend on individual characteristics of ego or their partner. Hence the model does not allow for homophily on the basis of various characteristics such as risk behaviour. It also does not adjust for serosorting. Second, sexual behaviour (number of partners, number of sexual acts) is not altered based on NG infection status. Third, screening is fixed at a 12 monthly interval. We do not adjust screening rates based on risk behaviour which is a further weakness of our model. Fourth, some of our assumptions may be unrealistic such as the assumption that NG is equally infectious in each site regardless of the duration of infection or presence or absence of symptoms. A result of these limitations is that we cannot exclude the possibility that screening may be effective in reducing the prevalence of NG in different scenarios including in a core-group of MSM with higher risk behaviour. We did not conduct the additional sensitivity analyses we had planned, as the STERGM models are so computationally demanding that even on our university supercomputer the models took an average of 3 months to run.
A strength of our study is that for the first time we have developed a stochastic network-based model of NG transmission that includes separate and directional transmission probabilities between pharynx, rectum and urethra. Three previous modelling studies have included site-specific NG transmission probabilities. Two of these were however compartmental models [Reference Zhang33, Reference Hui34]. None of these studies explicitly modelled the effect of screening vs. no screening on NG prevalence. The most recent of these studies modelled the impact of increasing NG screening rates at both pharyngeal and rectal sites from 40% to 100%. It found that this would decrease NG prevalence from 8.6%/8% to 5%/3.2%, at pharyngeal/rectal sites, respectively [Reference Zhang33]. The only previous network-based model was weakened by not including oropharyngeal transmissions [Reference Jenness35]. It found that using HIV pre-exposure prophylaxis (PrEP) to target NG screening would if utilised by 40% of those eligible for PrEP lead to a 40% reduction in NG prevalence. Because transmissions to and from the oropharyngeal have been shown to be important to NG spread in MSM its results are hard to interpret [Reference Zhang33]. It is likely that differences in modelling approaches account for the slight differences in results between these studies and ours.
A more prescient issue is evaluating if increased screening also increases selection pressure on the emergence of antimicrobial resistance. Further models could help to better define this risk by including this as a modelled variable.
No randomised controlled trials have been conducted to assess if screening for NG leads to a reduction in the prevalence of NG or other favourable outcomes in MSM. In a PubMed search, we found 11 published observational studies that have assessed if NG screening in MSM cohorts is associated with a reduction in NG prevalence [Reference Volk36–Reference Marcus46]. These include a number of pre-exposure prophylaxis studies and typically involved 3-site NG screening at 3–12 monthly intervals. Two out of 11 studies found a reduction [Reference Grant38, Reference Rieg39] and 3/11 an increase [Reference Volk36, Reference Chow37, Reference Marcus46] in NG prevalence during the period of screening. Because these studies are observational we cannot exclude the possibility that NG screening may reduce NG prevalence compared with a placebo arm. However, taken in conjunction with our modelling outcomes these findings do however suggest that NG screening is likely to only have a modest effect on reducing NG prevalence in MSM. Given the real risks of NG screening programmes promoting the selection of antimicrobial resistance in NG, randomised controlled trials should be conducted to directly assess if screening can lower NG prevalence and if so at what cost to the individual and population resistome.
Supplementary material
The supplementary material for this article can be found at https://doi.org/10.1017/S0950268818000092.
Acknowledgements
We would like to acknowledge the scientists, who organised and conducted EMIS between 2009 and 2011: Axel J. Schmidt (Project co-ordination); Ulrich Marcus (Project initiation and supervision); Peter Weatherburn (Promotion co-ordination); Ford Hickson and David Reid (Technical implementation) and the European MSM Internet Survey network. We are grateful for the support of our Belgian EMIS partners: l'Observatoire du Sida and Sensoa. We thank Steven Goodreau for assistance with the STERGM modelling. EMIS was funded by a grant of the European Commission under the EU Health Programme 2008–2013. Further funding was received from CEEISCat (Centre d'Estudis Epidemiològics sobre les ITS/HIV/SIDA de Catalunya, Spain); Department of Health for England; Maastricht University (The Netherlands); Regione del Veneto (Italy); and Robert Koch Institute (Germany). Further funding for the participation of men in specific countries was provided by: German Ministry of Health for Ukraine and Moldova; Finnish Ministry of Health for Finland; Norwegian Institute of Public Health for Norway; Swedish Board of Health and Welfare for Sweden; and Bundeszentrale für gesundheitliche Aufklärung (BZgA) for Germany. We further acknowledge support from the FWO scientific research community on Network Statistics for Sexually Transmitted Infections Epidemiology (WOG) W0.025.14N.
Declaration of Interest
None.


