Type 2 diabetes mellitus (T2DM) is characterised by chronically elevated blood glucose levels, which result from defects in insulin production, insulin action or a combination of both( Reference Cornier, Dabelea and Hernandez 1 ). T2DM is a complex disease caused by genetic and environmental factors including lifestyle. Improvement of eating habits is an effective way to prevent and delay the progression of this disease, particularly during the early stages. Moreover, T2DM is associated with various complications including diabetic neuropathy, diabetic retinopathy and diabetic nephropathy. Diabetic nephropathy, occurring in approximately 42 % of T2DM cases in Japan, is now the most prevalent cause of end-stage renal disease( Reference Yokoyama, Kawai and Kobayashi 2 ). A fundamental clinical problem in treating patients with diabetic nephropathy is designing their diets to ensure optimal dietary protein and mineral intake, especially P( Reference Kalantar-Zadeh, Gutekunst and Mehrotra 3 ). High-protein intake causes glomerular hypertension and hyperfiltration, resulting in the progression of renal disease. Reducing protein intake limits the severity of the uraemic syndrome and is currently an important nutritional treatment in the advanced stages of diabetic nephropathy( Reference Brenner, Meyer and Hostetter 4 , Reference Maroni and Mitch 5 ). However, there are disadvantages to protein restriction; low-protein diets may lead to the loss of lean body mass, and are often associated with poor compliance and the risk of malnutrition or protein–energy wasting( Reference Franch and Mitch 6 ).
Both protein quantity and protein quality have recently been evaluated in this context, not only because of the complications associated with both high and low protein, but also because intake of animal protein such as meat is known to contribute to the development of dyslipidaemia which is a major risk factor of cardiovascular complications in diabetes with nephropathy( Reference Azadbakht, Shakerhosseini and Atabak 7 ). It is also known that the type of protein consumed can improve glucose tolerance and insulin sensitivity in rats( Reference Lavigne, Marette and Jacques 8 ) and change renal function in patients with diabetic nephropathy( Reference Nakamura, Takasawa and Kasahara 9 ). Substitution of animal protein with soya protein (a vegetable protein) has therefore been tested for therapeutic value in diabetic nephropathy( Reference Williams and Wallis 10 – Reference Trujillo, Ramírez and Pérez 14 ). Results from animal studies are generally positive, but those in human subjects are still controversial( Reference Azadbakht, Shakerhosseini and Atabak 7 , Reference Anderson, Blake and Turner 11 , Reference Teixeira, Tappenden and Carson 13 , Reference Azadbakht, Atabak and Esmaillzadeh 15 ).
Rice is one of the most important cereals in the world, especially in Asia. It is a major source not only of energy but also of protein, and has been receiving increasing attention as a healthy, nutritious and hypoallergenic foodstuff( Reference Shih and Champagne 16 , 17 ). As a vegetable protein source, rice protein (RP) is not as well known as soya protein as a functional food material, mainly because it is not commercially available in the market. However, according to the National Health and Nutrition Survey in Japan( 18 ), daily protein intake from rice is 12·3 %, the third highest source of total protein intake following meat (23·9 %) and fish (19·3 %), and it is the most abundant vegetable protein source in Japan. Recently, a simple and mass preparative procedure of RP with an alkali extraction method was developed( Reference Kumagai, Kawamura and Fuse 19 ). This RP isolate is characterised by more than 80 % crude protein and consists of the same protein composition as rice flour, with much lower amounts of minerals such as P. The true digestibility of RP in humans is 88 %( 20 ), with the major indigestible component being prolamin. However, the recently developed alkali extraction procedure markedly changes the digestibility of prolamin( Reference Kubota, Saito and Masumura 21 ) and improves the bioavailability of whole RP( Reference Kumagai, Kawamura and Fuse 19 , Reference Morita, Oh-hashi and Kasaoka 22 , Reference Kumagai, Watanabe and Saito 23 ). RP has also been shown to exhibit hypocholesterolaemic and hypolipidaemic effects comparable with those of soya protein( Reference Morita, Oh-hashi and Kasaoka 22 , Reference Yang, Kumagai and Kawamura 24 ).
The purpose of the present study was to investigate the effect of RP in Goto–Kakizaki (GK) rats, a model of non-obese T2DM, which are considered to mimic the non-obese T2DM seen in the majority of Japanese patients. In this regard, two dietary conditions, standard and high-sucrose diets, were employed, since the latter is known to be deleterious to diabetic rodents( Reference Hallfrisch, Lazar and Reiser 25 , Reference Kang, Fears and Noirot 26 ). The results obtained indicate that RP has no significant effect on blood glucose homeostasis, but has a pronounced effect on the preservation of renal function in the GK rat model of T2DM.
Experimental methods
Materials
RP was prepared according to an alkali extraction method reported by Kumagai et al. ( Reference Kumagai, Kawamura and Fuse 19 ): milled rice flour was mixed with 0·2 % NaOH solution at room temperature for 1 h to extract RP and the mixture was centrifuged at 3000 g for 10 min. The supernatant was then neutralised with 1 m-HCl to precipitate RP at pH approximately 6·0. The collected RP was washed three times with distilled water and freeze-dried. Purity obtained was above 80 % crude protein. Casein (C) was purchased from Nichiku Yakuhin Kogyo Corporation. Composition of these proteins was analysed, as shown in Table 1. All other reagents were purchased from Wako Pure Chemical Industries.
Table 1 Composition of the dietary proteins (Mean values with their standard errors, n 5–6)
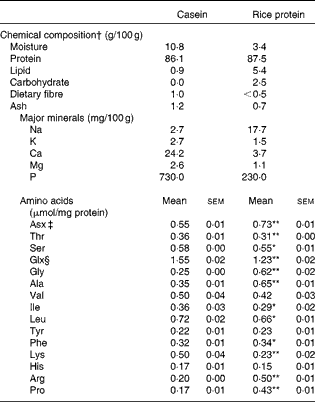
Mean values were significantly different from those of casein: * P< 0·05, ** P< 0·01.
† Chemical composition analysis was conducted according to the analytical method in the Standard Tables of Food Composition in Japan 2010( 44 ).
‡ Asx = Asn+Asp.
§ Glx = Gln+Glu. The proteins were hydrolysed in 6 m-HCl for 22 h at 110°C to analyse amino acid composition. The amino acid analysis was conducted with the JLC-500/V AminoTac™ Amino Acid Analyzer (JEOL Ltd).
Animals and experimental design
For the experiment, 7-week-old male GK rats, weighing 180–200 g each, and 7-week-old male Wistar (non-diabetic) rats, weighing approximately 220 g each, were purchased from Japan SLC. Wistar strain was employed as a control to assess the symptom of diabetes in GK rats, because GK rats are derived from Wistar rats by selective breeding. These rats were housed in individual stainless-steel cages with wire screen bottoms in a room under controlled temperature (22 ± 2°C) and lighting (lights on from 06.00 to 18.00 hours). To allow them to adapt to these housing conditions, they were fed commercial pellets (Nosan) for 3 d before the start of the experiment. After adaptation, rats were divided into two (Expt 1) or three (Expt 2) groups on the basis of body weight (eight GK rats and six Wistar rats per group), and fed experimental diets that contained either C or RP (Table 2). In Expt 1, rats were fed standard experimental diets for 10 weeks and in Expt 2, rats were fed high-sucrose diets for 10 weeks. In Expt 1, male Wistar rats (n 4) were fed a commercial pellet diet for 9 weeks for an oral glucose tolerance test (OGTT). Rats in the RP group were allowed free access to the diet, whereas the C group and a group of Wistar rats fed a high-sucrose C diet were restricted to the same weight of diet that the RP group had consumed the day before. Body weight and food intake were measured every morning before feeding. To collect urine and faeces, rats were transferred to individual metabolism cages 3 d before the end of the experimental period. Urine and faeces were collected before feeding every day for 3 d and were stored at − 80°C. At the end of the experiment, after 18 h fasting, rats were anaesthetised with sodium pentobarbital (50 mg/kg body weight), blood samples were collected from the inferior vena cava using heparinised syringes and rats were then euthanised by exsanguination. The collected blood was centrifuged at 9500 g for 3 min to collect plasma, which was stored at − 40°C until analysis. Viscera were collected and their weights were measured. Liver and kidneys were immediately frozen in liquid N2 and stored at − 80°C until analysis. All experiments were performed in accordance with the Guidelines of the Committee for Animal Experimentation of Niigata University.
Table 2 Composition of the experimental diets*
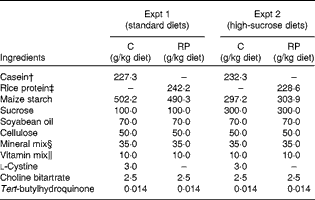
C, casein; RP, rice protein.
* Based on AIN-93G( Reference Reeves, Nielsen and Fahey 45 ).
† Crude protein: 88·0 % in Expt 1; 86·1 % in Expt 2.
‡ Crude protein: 82·6 % in Expt 1; 87·5 % in Expt 2.
§ AIN-93G mineral mixture( Reference Reeves, Nielsen and Fahey 45 ).
∥ AIN-93G vitamin mixture( Reference Reeves, Nielsen and Fahey 45 ).
Analysis of blood parameters
Fasting blood glucose levels were measured every week in the blood collected from the tail vein after 18 h fasting, using the Medisafe GR-102 blood glucose meter (Terumo). Fasting blood insulin and adiponectin levels were measured at the end of the experimental period using an ultrasensitive rat insulin kit (Morinaga Institute of Biological Science) and a mouse/rat adiponectin ELISA kit (Otsuka Pharmaceuticals), respectively. The homeostasis model assessment of insulin resistance (glucose (mmol/l) × insulin (pmol/l)/3·4) index was calculated from fasting glucose and insulin levels. Glycated Hb was measured using an HPLC method (HLC-723G8; Tosoh Bioscience, Inc.). Other blood parameters were measured using a Roche/Hitachi Modular System (Roche). In Expt 2, blood pressure was measured at week 9 of the experimental period by a tail-cuff method with a blood pressure monitor for mice and rats (MK-2000ST; Muromachi Kikai). The trained rats were housed in the rat holder (Muromachi Kikai) for blood pressure measurement. After the value became stable, the reading was taken at least four times and averaged. The blood pressure measurements were conducted at a similar time of day in a quiet room. In Expt 1, an OGTT was carried out at 9 weeks. A d-glucose solution in distilled water (2 g/kg body weight) was administered orally and blood samples were obtained from the tail vein for up to 4 h. For comparison, the OGTT in male Wistar rats fed commercial pellets was performed at the same age in the same manner.
Analysis of kidney function and morphology
Urinary albumin excretion (UAE), a parameter of early diabetic nephropathy, was determined as the urinary albumin:creatinine ratio by measuring albumin with a rat albumin enzyme immunoassay (EIA) kit (Panapharm Laboratories) and creatinine with a QuantiChrom™ Creatinine Assay Kit (BioAssay Systems). Data are represented as μg/mg creatinine.
In order to observe histological damages, kidneys were fixed in 4 % paraformaldehyde phosphate buffer solution (Wako) as soon as they were collected from the rats. They were embedded in paraffin, sectioned into 4 μm slices and stained by periodic acid–Schiff (PAS) stain. Morphological observations were conducted on fifty renal glomeruli in each group; twenty-five renal glomeruli were from superficial cortex tissue under the capsule and twenty-five renal glomeruli were from deep cortex tissue near the corticomedullary junction. Degrees of the glomerular mesangial matrix area in the histological images were determined by assessment of the mesangial PAS-positive and nucleus-free area in each glomerulus and semi-quantitatively scored from 1 to 4: 1, 0–24 %; 2, 25–49 %; 3, 50–74 %; 4, 75–100 %. An investigator blinded to sample identity performed the image analysis.
Statistical analysis
Results are expressed as means with their standard errors of the mean. Data were evaluated using Student's t test or one-way ANOVA followed by Fisher's least significant difference. For the histological analysis, the Kruskal–Wallis test was employed. The criterion for significance was P< 0·05.
Results
Composition of rice protein and casein
There were no large differences between C and RP with respect to chemical composition, with the exception of minerals (Table 1). The low P content of RP was particularly notable in terms of therapy for diabetic nephropathy. In contrast, amino acid compositions were significantly different between the two proteins (Table 1). RP had higher arginine and proline contents, but a lower lysine content compared with C (P< 0·01).
Growth performance
Growth performance in both experiments is shown in Table 3. GK rats grew slightly more slowly than Wistar rats in Expt 2. Body-weight gain in response to RP feeding was 12 and 16 % less than that by C feeding in Expt 1 and 2, respectively (P< 0·05), partly because food intake was 5 % less in the RP-fed animals compared with those fed C. There was no effect of high-sucrose diets on growth performance. Liver weights in the RP group were significantly lower than those in the C group in both experiments (P< 0·05). The kidney weight of GK rats was significantly greater than that of Wistar rats in Expt 2 (P< 0·05), suggesting that GK rats may have developed renal hypertrophy compared with Wistar rats while there was no significant difference between the types of protein. In addition, fat depots in the RP group were significantly lower than those in the C group in Expt 1 (P< 0·05). These results may be partially caused by the difference of food intake. Faecal excretion was significantly different between the types of protein in Expt 1 (P< 0·05), but urine volume showed no difference between the types of protein in both experiments.
Table 3 Growth performance (Mean values with their standard errors, n 6–8)

GK, Goto–Kakizaki; C, casein; RP, rice protein.
a,b,cMean values with unlike superscript letters were significantly different between the groups (P< 0·05).
* Mean value was significantly different from that of the C group (P< 0·05).
† GK rats were fed a standard C or RP diet.
‡ GK rats were fed a high-sucrose C or RP diet and Wistar rats were fed a high-sucrose C diet.
§ Fat depots (g) = epididymal fat depots (g)+perirenal fat depots (g).
Effect of rice protein on blood glucose homeostasis
Fasting blood glucose levels were monitored for 10 weeks as shown in Fig. 1. They rose sharply within a few weeks after the start of Expt 1 (Fig. 1 (A) top panel), or showed a higher level from the start of Expt 2 (Fig. 1 (B)), which was maintained throughout the experimental period, demonstrating a mild hyperglycaemia in this strain. In Expt 2, there was an obvious difference in the blood glucose levels of GK and Wistar rats fed high-sucrose diets. In order to estimate insulin sensitivity of rats, an OGTT was performed at 9 weeks in Expt 1 (Fig. 1 (A) bottom panel). GK rats clearly exhibited a prolonged elevation in blood glucose levels, indicating impaired glucose tolerance compared with Wistar rats, but there was no modifying effect of RP on the glucose tolerance of GK rats. In Table 4, the Glycated Hb level was slightly but significantly higher in GK rats fed a high-sucrose diet compared with Wistar rats (P< 0·05), supporting the observation that hyperglycaemia was maintained. There was no effect of RP on blood glucose levels (Table 4).
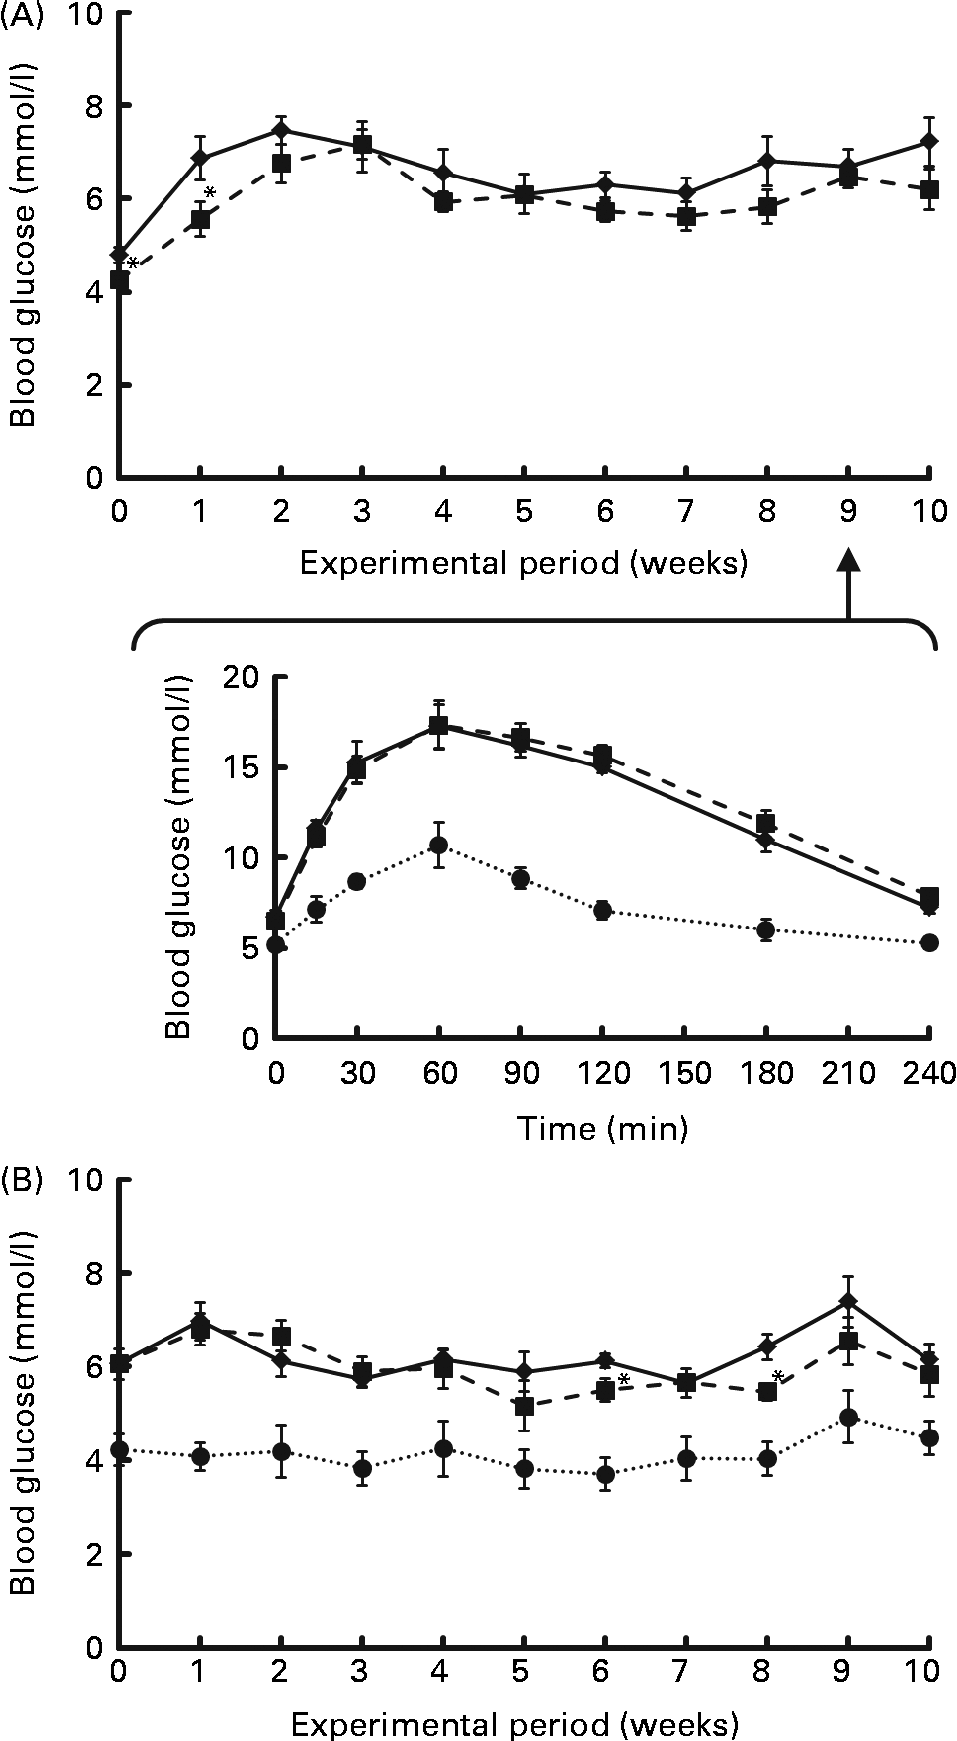
Fig. 1 Effect of rice protein (RP) on fasting blood glucose levels ((A) top panel and (B) for Expt 1 and 2, respectively) and the oral glucose tolerance test (OGTT; (A) bottom panel, Expt 1) of Goto-Kakizaki (GK) rats fed standard or high-sucrose diets. Expt 1: GK rats were fed a standard casein (C) or RP diet for 10 weeks. Blood samples after 18 h fasting were collected every week. (A) Change in fasting blood glucose levels of GK rats fed a C (![]() ) or RP (
) or RP (![]() ) diet during the experimental period (top panel). OGTT of GK and Wistar rats (bottom panel). It was carried out in GK rats fed a C (
) diet during the experimental period (top panel). OGTT of GK and Wistar rats (bottom panel). It was carried out in GK rats fed a C (![]() ) or RP (
) or RP (![]() ) diet and in Wistar rats fed a commercial pelleted diet (WC,
) diet and in Wistar rats fed a commercial pelleted diet (WC, ![]() ) at 9 weeks of the experimental period. Expt 2: GK rats were fed a high-sucrose C (
) at 9 weeks of the experimental period. Expt 2: GK rats were fed a high-sucrose C (![]() ) or RP (
) or RP (![]() ) diet for 10 weeks. Blood collection was conducted in the same way as for Expt 1. Wistar rats were fed a high-sucrose C diet. Values are means (n 6-8), with their standard errors represented by vertical bars. *Mean value was significantly different from that of the C group (P< 0·05).
) diet for 10 weeks. Blood collection was conducted in the same way as for Expt 1. Wistar rats were fed a high-sucrose C diet. Values are means (n 6-8), with their standard errors represented by vertical bars. *Mean value was significantly different from that of the C group (P< 0·05).
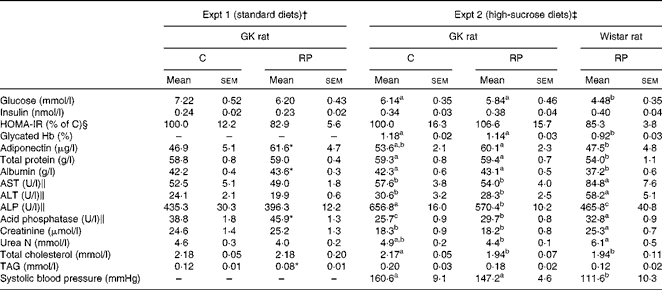
Table 4 Effects of rice protein (RP) on blood parameters in Goto–Kakizaki (GK) rats (Mean values with their standard errors, n 6–8)
C, casein; HOMA-IR, homeostasis model assessment of insulin resistance; AST, aspartate aminotransferase; ALT, alanine aminotransferase; ALP, alkaline phosphatase.
a,b,cMean values with unlike superscript letters were significantly different between the groups (P< 0·05).
* Mean value was significantly different from that of the C group (P< 0·05).
† GK rats were fed a standard C or RP diet.
‡ GK rats were fed a high-sucrose C or RP diet and Wistar rats were fed a high-sucrose C diet.
§ HOMA-IR = fasting plasma glucose concentration (mmol/l) × fasting plasma insulin concentration (pmol/l)/3·4.
∥ The enzymic product of 1 μmol substrate per min at 37°C represents one unit of enzyme activity.
Plasma insulin levels were not significantly different between GK and Wistar rats in Expt 2 (Table 4). Moreover, they were not different between the C and RP groups in each experiment, but the levels in Expt 2 were higher than those in Expt 1. It has been reported that plasma insulin level is augmented by high-sucrose feeding, although the glucose level is not changed( Reference Kang, Fears and Noirot 26 , Reference Koyama, Wada and Sakurada 27 ). From this result, it was assumed that GK rats fed high-sucrose diets were exposed to a stronger hyperglycaemic stress which led to insulin secretion, compared with those fed standard diets. Homeostasis model assessment of insulin resistance, which is used to assess insulin resistance, was not different between the two groups.
Interestingly, levels of plasma adiponectin, which regulate energy homeostasis and glucose and lipid metabolism, were significantly higher in the RP group than in the C group in Expt 1 (P< 0·05). Overall, RP had only slight effects on blood glucose homeostasis, but affected adiponectin levels in GK rats.
Effect of rice protein on blood biochemical parameters
Blood parameter results, including total protein, albumin, aspartate aminotransferase, alanine aminotransferase, alkaline phosphatase (ALP) and lipid parameters, are shown in Table 4. Total protein, an index to assess protein nutritional condition, showed no difference between the C and RP groups in either experiment. However, albumin, which is synthesised in the liver and is a sensitive index of protein nutrition, was significantly increased in the RP group in Expt 1 (P< 0·05), suggesting that RP is able to improve protein nutrition compared with C. ALP in the RP group, used as a marker for biliary and bone disorders, was significantly lower than the C group in Expt 2 (P< 0·05). These results suggest that RP maintains liver function in GK rats. Acid phosphatase was augmented in the RP group (P< 0·05).
In the present study, total cholesterol levels of the RP group in Expt 2 were significantly lower than those of the C group (P< 0·05). This result is coincident with the findings of Morita et al. ( Reference Morita, Oh-hashi and Kasaoka 22 ) and Yang et al. ( Reference Yang, Kumagai and Kawamura 24 ) using non-diabetic rats. This result suggests that RP may improve hypercholesterolaemia of GK rats. In addition, GK rats showed raised systolic blood pressure compared with Wistar rats in Expt 2 (P< 0·05).
Effect of rice protein on kidney function
The results of creatinine analysis are shown in Table 4. Creatinine, an index to assess renal filtering function, showed no differences between the two GK rat groups in either experiment. However, in Expt 2, the creatinine level in GK rats was significantly lower than that in Wistar rats (P< 0·05). This reduction in GK rats could be derived from glomerular hyperfiltration. The observation of a higher systolic pressure in GK rats than in Wistar rats in Expt 2 is a sign of progressive nephropathy, since hypertension may be a second injurious mechanism which induces progressive nephropathy( Reference Janssen, Riley and Vassiliadou 28 ).
UAE, a major marker of early diabetic nephropathy, results from the leakage of albumin across the glomerular podocyte filtration barrier into the urine. In Expt 1, there was no significant difference in albumin excretion between the C and RP groups at 10 weeks (Fig. 2). In contrast, in high-sucrose-fed GK rats (Expt 2), albumin excretion was increased by more than 3-fold compared with Wistar rats (P< 0·05). This observation of increased UAE is evidence of the progression of diabetic nephropathy due to high-sucrose loading. Under this condition, RP exhibited a 36 % suppression of albumin excretion compared with C in GK rats (P< 0·05). RP feeding may maintain glomerular capillary permeability to protein, slow the progression of diabetic nephropathy and confer some protection against it.
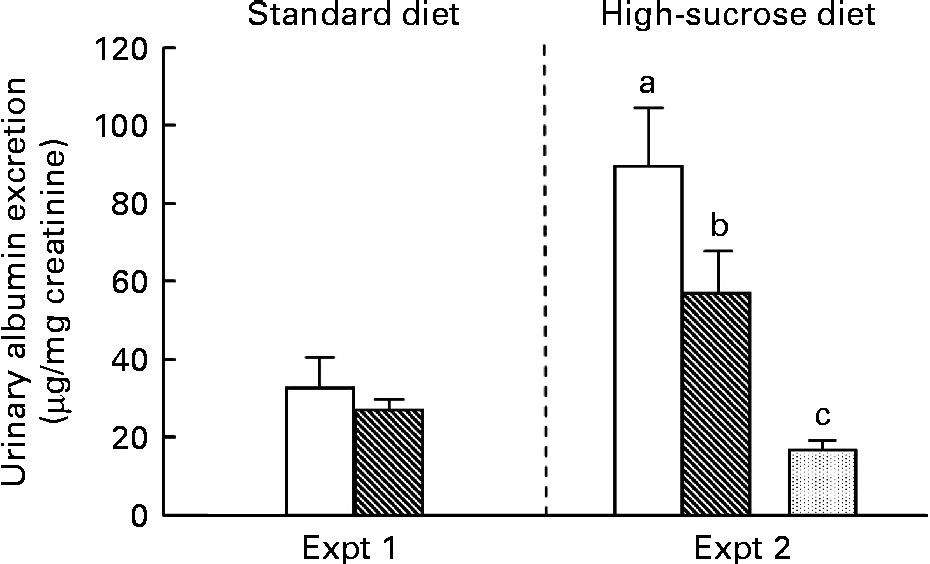
Fig. 2 Effect of rice protein (RP) on urinary albumin excretion. Urine was collected for the last 3 d of the experimental period. Urinary albumin excretion was measured by the EIA method. □, Goto–Kakizaki (GK) rats fed a standard or high-sucrose casein (C) diet; ![]() , GK rats fed a standard or high-sucrose RP diet;
, GK rats fed a standard or high-sucrose RP diet; ![]() , Wistar rats fed a high-sucrose C diet. Values are means (n 6–8), with their standard errors represented by vertical bars. a,b,cMean values with unlike letters were significantly different between the three groups in Expt 2 (P< 0·05).
, Wistar rats fed a high-sucrose C diet. Values are means (n 6–8), with their standard errors represented by vertical bars. a,b,cMean values with unlike letters were significantly different between the three groups in Expt 2 (P< 0·05).
Since RP showed a remarkable effect on the renal filtering function of GK rats, morphological observation of kidney tissues was also conducted in GK rats fed high-sucrose diets for 10 weeks (Fig. 3). The expansion of the mesangial matrix in renal glomeruli of the C group was more evident than that in the RP group. In particular, damage to renal glomeruli in the corticomedullary junction of the C group was more severe than that in the cortex (Fig. 3(A)). In contrast, the score was significantly reduced by RP feeding (P< 0·05) and glomeruli in the RP group were not significantly different from those in Wistar rats (Fig. 3(B)). These results strongly indicate that RP had a protective effect on mesangial matrix expansion, which is one of the histological glomeruli alterations, with the progression of diabetic nephropathy.
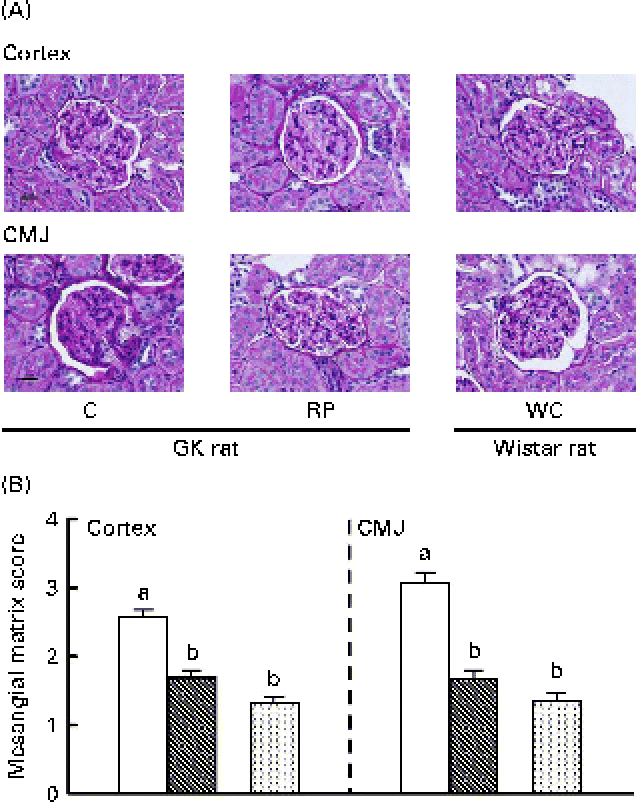
Fig. 3 Effect of rice protein (RP) on kidney tissue morphology in Goto–Kakizaki (GK) rats and Wistar rats fed high-sucrose diets. (A) Histological images of renal glomeruli in GK rats and Wistar rats. Scale bar represents 20 μm. (B) Mesangial matrix score representing the degree of kidney damage. □, GK rats fed a high-sucrose casein (C) diet; ![]() , GK rats fed a high-sucrose RP diet; WC (
, GK rats fed a high-sucrose RP diet; WC (![]() ), Wistar rats fed a high-sucrose C diet. Statistical analysis was performed using the Kruskal–Wallis test. Values are means, with their standard errors represented by vertical bars. a,bMean values with unlike letters were significantly different (P< 0·05). CMJ, corticomedullary junction.
), Wistar rats fed a high-sucrose C diet. Statistical analysis was performed using the Kruskal–Wallis test. Values are means, with their standard errors represented by vertical bars. a,bMean values with unlike letters were significantly different (P< 0·05). CMJ, corticomedullary junction.
Discussion
The GK rat is a non-obese, spontaneous T2DM model, which was produced from non-diabetic Wistar rats by the repetition of selective breeding based on glucose intolerance( Reference Goto, Suzuki, Sasaki, Shafrir and Renold 29 ). At 3–4 weeks of age, they develop mild glucose intolerance and complications which are characterised by tissue damage in the peripheral nerves as well as in the kidneys, presenting with symptoms similar to those seen in human T2DM( Reference Goto, Suzuki, Sasaki, Shafrir and Renold 29 ). GK rats have been shown to develop morphological changes in diabetic nephropathy, including the thickening of glomerular basement membranes and glomerular hypertrophy( Reference Yagihashi, Goto and Kakizaki 30 , Reference Phillips, Baboolal and Riley 31 ).
We assessed the effect of dietary RP on diabetic nephropathy, one of the major complications in diabetic mellitus. We did not observe any effects of RP on blood glucose levels in GK rats, but it showed beneficial effects on the structure and function of kidneys in GK rats, especially when these were fed high-sucrose diets. It has been reported that sucrose feeding promotes the apoptosis of islet β-cells in GK rats through increased oxidative stress( Reference Koyama, Wada and Sakurada 27 ). In the present study, attention was focused on protein quality in the diets and we attempted to demonstrate the influence of protein quality, especially RP, on T2DM. We used two types of diet composition. The first composition was a standard diet based on American Institute of Nutrition (AIN)-93G (Expt 1). This diet was used as a model of controlled eating habits to assess the effects on the typical symptoms of diabetes, particularly hyperglycaemia. The second composition was a high-sucrose diet in which the sucrose content was three times greater than that in the standard diet (Expt 2). There are some reports that sucrose feeding exacerbates the symptoms of diabetic animals( Reference Hallfrisch, Lazar and Reiser 25 , Reference Leiter, Coleman and Ingram 32 ) and leads to thickening of the glomerular basement membrane in non-diabetic rats, which is one of the characteristic histological changes in diabetic kidneys( Reference Taylor, Price and Kang 33 ). Therefore, we adopted high-sucrose feeding as a model of advanced T2DM and diabetic nephropathy. In the present study, RP had no significant effects on hyperglycaemia in GK T2DM model rats, although RP did increase plasma adiponectin levels, which is known to improve insulin resistance (Table 4). From these results, we conclude that RP has no substantial effects on glucose homeostasis in GK rats. Incidentally, it has also been reported that soyabean protein has no effects on plasma glucose concentrations( Reference Teixeira, Tappenden and Erdman 12 ). This report is similar to the present study except that the protein sources are different.
It was interesting to find an effect on ALP (Expt 2), which is generally considered as a marker for hepatobiliary and skeletal disorders, despite its physiological function not being known yet. There are some interesting cohort studies concerning the relationship between T2DM and ALP. Webber et al. ( Reference Webber, Krishman and Thomas 34 ) reported that ALP was significantly associated with diabetes and Cheung et al. ( Reference Cheung, Ong and Cheung 35 ) reported that plasma ALP level was significantly associated with plasma C-reactive protein level, a widely used biomarker of cardiovascular risk and systemic inflammation. Therefore, this result could suggest that RP may have some beneficial effects on diabetes via suppressing systemic inflammation. We have a preliminary result showing a suppression by the RP of blood C-reactive protein, a marker of systemic inflammation in a short experiment for 6 weeks (M Kubota and R Watanabe, unpublished results).
Excessive albumin leaks from the blood into the urine because of abnormal permeability in renal glomeruli and reduces renal tubular reabsorption. Because microalbuminuria is generally an early clinical sign of renal dysfunction in T2DM, UAE is an important marker of diabetic nephropathy. Therefore, in the present study, UAE was measured to assess the progression of diabetic nephropathy and to determine any beneficial effects of RP. It has been thought that the suppression of UAE in diabetic patients, as well as lowering the blood pressure, is an effective countermeasure for reducing the risk of end-stage renal disease( Reference Ruggenenti, Fassi and Ilieva 36 ). In addition, UAE is a predictor of CHD in male T2DM patients( Reference Mattock, Barnes and Viberti 37 ) and CVD risk increases with increasing UAE( Reference de Zeeuw, Parving and Henning 38 ). Because UAE is related to the risk of certain diseases, it is thought that its suppression reduces the risk of these diseases. In Expt 1, UAE had not increased in response to RP by 10 weeks; thus, no beneficial effect of RP was seen (Fig. 2). It is conceivable that the experimental conditions of Expt 1 were not sufficient to initiate, or cause the progression of, renal damage. In contrast, there was a clear preventive effect of RP on the progression of albuminuria in Expt 2. Furthermore, from the morphological observation, RP had a protective effect on renal glomeruli damage (Fig. 3). Therefore, it is strongly suggested that RP has an ameliorating effect on the progression of renal damage compared with C. In contrast, it could not be found that RP had any effects on plasma creatinine concentration, the filtering function of kidneys in both experiments, although RP had effects on albuminuria and kidney tissue damage. This was supported by the findings that serum creatinine concentrations in GK rats were not changed up to 52 weeks old( Reference Phillips, Baboolal and Riley 31 ), which strongly suggested that the experimental period in the present study was not enough to assess the effect of RP on the filtering function of kidneys.
The mechanism by which RP confers renal protection is not clear. There is a possibility that amino acid composition in RP may affect diabetes and diabetic nephropathy. RP had a higher arginine content than C (Table 1). In isolated islets, it has been shown that the responsiveness of insulin secretion to glucose is impaired, but the response to arginine (which is a secretagogue of insulin) is maintained, in GK rats compared with Wistar rats( Reference Hughes, Suzuki and Goto 39 ). In addition, arginine is an important amino acid as a substrate of NO synthesis. In the case of soya protein, it has been reported that the renal protective effect of soya protein in obese Zucker rats might be mediated by the improvement of NO generation( Reference Trujillo, Ramírez and Pérez 14 ). Since RP has a higher arginine content than soya protein (0·46 v. 0·35 μmol/mg protein)( Reference Yang, Kumagai and Kawamura 24 ), the mechanism may be due to arginine. Further evidence is the link between albuminuria and adiponectin. Sharma et al. ( Reference Sharma, Ramachandrarao and Qiu 40 ) reported that adiponectin was a key regulator of albuminuria in mice and reduced podocyte permeability to albumin. In addition, Nakamaki et al. ( Reference Nakamaki, Satoh and Kudoh 41 ) reported that overexpression of adiponectin in streptozotocin-induced diabetic rats reduced the degree of proteinuria. The evidence that decreased serum adiponectin is an independent risk factor for the progression of T2DM in human subjects has also been shown( Reference Daimon, Oizumi and Saitoh 42 ). Therefore, the present findings that plasma adiponectin levels were significantly higher in response to RP feeding in Expt 1 strongly suggest that RP might exert its effect on kidneys through an increased adiponectin level.
It is likely that reducing protein intake is an effective treatment to delay the progression of renal diseases including diabetic nephropathy( Reference Robertson, Waugh and Robertson 43 ). However, protein restriction is not always the best therapy for early diabetic nephropathy because of an associated risk of malnutrition and the loss of compliance. From the present results, not only protein quantity but also protein quality are effective for the amelioration of diabetic nephropathy, and RP may be an alternative to soya protein which is effective for early diabetic nephropathy with microalbuminuria. In addition, hyperphosphataemia has recently emerged as a cardiovascular and mortality risk factor, and a reduction of dietary sources of phosphate may be important( Reference Kalantar-Zadeh, Gutekunst and Mehrotra 3 ). In this regard, RP may have another advantage over soya protein because of its much lower content of P (230 v. 790 mg/100 g; data not shown).
Thus, it is evident that selecting the appropriate type of protein may make it possible to delay the progression of diabetic nephropathy without the risks associated with protein restriction. As a vegetable protein source, RP is comparable with soya protein, and may be more effective from the perspective of its relatively low content of P, and increased palatability for patients, particularly in Asian countries.
Acknowledgements
The present study was supported by a Grant-in-Aid for Scientific Research (no. 19500706) from the Japan Society for the Promotion of Science to R. W., a grant from the Japan Science and Technology Agency Innovation Satellite Niigata, and a grant for research ‘Development of fundamental technology for analysis and evaluation of functional agricultural products and functional foods’ from the Ministry of Agriculture, Forestry and Fisheries to M. Kadowaki, M. Kubota and R. W. designed and performed the animal and biochemical studies, and performed the data analyses. H. K. and N. I. performed the histological observation. M. Kubota drafted the manuscript which was revised by M. Kadowaki and subsequently discussed by R. W., T. K., S. F. and A. S. All the authors read and approved the final version of the manuscript. The authors declare no conflict of interest.


