It is generally considered that fish do not have a specific requirement for dietary carbohydrate(1), and meanwhile, carbohydrate of starch origins with good binding and expansion properties is crucial in the manufacture of extruded floating pellet(Reference Sørensen, Nguyen and Storebakken2). Even so, dietary digestible carbohydrate content has been suggested to not exceed 10 % in cultured carnivorous fish(Reference Wang, Li and Han3–Reference Ma, Mu and Pu5), because excessive dietary carbohydrate generally produces persistent glycogen deposition(Reference Goodwin, Lochmann and Tieman6–Reference Xu, Chen and Liu8) and induces immunity response(Reference Deng, Pan and Liu9–Reference Li, Wang and Li11) and further impairs growth and health status of cultured carnivorous fish. Notably, dietary digestible carbohydrate content, mainly starch origin, that carnivorous fish can tolerate may not be enough to meet the necessary for floating pellet processing. Therefore, studies on how to alleviate hepatic glycogen deposition caused by high dietary carbohydrate should receive much attention, which may contribute to coping with the nutritional–technological conundrum in manufacturing aquafeeds of carnivorous fish.
In mammals, insulin pathway plays a vital role in maintaining glucose homoeostasis(Reference Saltiel and Kahn12,Reference Titchenell, Lazar and Birnbaum13) . Meanwhile, high activity of insulin pathway depressed hepatic glycogen accumulation of a carnivorous fish, largemouth bass (Micropterus salmoides), fed diets with similar dietary starch content(Reference Li, Sang and Wang14). The activation of sirtuin 1 (SIRT1), an nicotinamide adenine dinucleotide-dependent protein deacetylase, can efficiently lower plasma glucose content and improve insulin sensitivity in diabetes model(Reference Sun, Zhang and Ge15–Reference Yoshizaki, Milne and Imamura17), and this makes SIRT1 activation to be a potential therapeutic approach for type 2 diabetes in mammals. In addition, SIRT1 has been demonstrated to exert anti-inflammatory effects through inhibiting NF-κB activation in mammals(Reference Yoshizaki, Milne and Imamura17–Reference Yang, Zhang and Pan19). Therefore, it is plausible that SIRT1 activation can improve glucose utilisation capacity to reduce glycogen deposition through the regulation of insulin pathway and alleviate immune response of carnivorous fish.
Resveratrol (RSV), a polyphenolic SIRT1 activator, is a natural phytoalexin existed in many biological sources such as butterfly orchid tree, white hellebore and corn lily(Reference Burns, Yokota and Ashihara20). It has well demonstrated that RSV inclusion can improve insulin sensitivity(Reference Lagouge, Argmann and Gerhart-Hines21), and the role of RSV in anti-diabetic effects has been well documented in mammals(Reference Szkudelski and Szkudelska22). Meanwhile, the supply of RSV is suggested to activate the phosphoinositide 3-kinase (PI3K)/AKT (serine/threonine kinase) pathway, an important component of insulin pathway(Reference Chi, Chen and Chi23–Reference Wang, Li and Xu25), and results in the promotion of glycolysis or the inhibition of gluconeogenesis in diabetic mammals(Reference Yonamine, Pinheiro-Machado and Michalani26,Reference Yonamine, Pinheiro-Machado and Michalani27) . However, on the contrary, RSV inclusion promotes gluconeogenic gene expression of rat hepatocytes(Reference Ganjam, Dimova and Unterman28,Reference Park, Kim and Bae29) , and the reason for the apparent conflict results remains unclear. The influence of RSV inclusion on lipid and glucose metabolism has been explored in some fish species, such as blunt snout bream (Megalobrama amblycephala)(Reference Zhang, Yan and Tian30,Reference Shi, Xu and Liu31) and zebrafish (Danio rerio)(Reference Ran, Ying and Li32), while whether RSV supplementation can improve glucose metabolism and impact glycogen deposition remains unclear in fish species. In addition, the anti-inflammatory property of RSV has also observed in diabetic rats(Reference Palsamy, Sivakumar and Subramanian33,Reference Soufi, Arbabi-Aval and Kanavi34) and leucocytes of a carnivorous fish, turbot (Scophthalmus maximus)(Reference Domínguez, Pardo and Noia35). Therefore, RSV inclusion may contribute to alleviating glycogen deposition and improving immune response of carnivorous fish.
Largemouth bass has been widely cultured in China, and its production increased from 175 thousand tons in 2009 to about 500 thousand tons in 2019(36,37) . However, the culture of largemouth bass in China still largely relies on the fresh/thawed raw fish because digestible carbohydrate content of commercial feeds commonly leads to abnormal hepatic glycogen deposition and further impairs health status of this fish species. Therefore, taken into the potential role of RSV in improving glucose metabolism, the present study was conducted to explore the influence of RSV inclusion on hepatic glycogen content and glucose metabolism of largemouth bass fed high dietary carbohydrate. In addition, the anti-inflammatory property of RSV inclusion was also evaluated. It is assumed that the findings of the present study will provide a basis for alleviating hepatic glycogen deposition and improving immune response of carnivorous fish.
Materials and methods
Experimental diets and experimental procedure
Previous study in our laboratory has demonstrated that, compared with 5 % inclusion level, 10 % α-cassava starch produced abnormal hepatic glycogen accumulation and further impaired hepatocyte function of largemouth bass(Reference Xu, Chen and Liu8). Therefore, two isonitrogenous and isolipidic diets formulated with 5 and 10 % α-cassava starch were used as positive control (low carbohydrate, LC) and negative control (high carbohydrate, HC), respectively. Another four diets were supplemented with 0·05 % (HCR (0·05)), 0·10 % (HCR (0·10)), 0·25 % (HCR (0·25)) and 0·50 % ((HCR (0·50)) RSV based on the HC diet (Table 1). RSV (purity, 99 %) used in the present study was acquired from Xi’an Quan’ao Biotech Co., Ltd. In the formulation, zeolite powder was used to compensate for the variation of starch content, and microcrystalline cellulose was used as inert filler to balance the RSV inclusion. The experimental diets were prepared following previously described method(Reference Li, Li and Zhang4). Briefly, all of the grounded low-lipid ingredients were thoroughly mixed and then well blended with lipid ingredients (soyabean oil and soyabean lecithin). After that, the above mixture was added with water to form a stiff dough, which was then extruded through a 2·5 mm die with an extruded pelleting machine (Xinchang Chenshi Mechanical Factory). Then, the pellets were cooked for starch gelatinisation at 105 °C for 15 min and dried at 55 °C. All experimental diets were stored at −20 °C until being used.
Table 1. Formulation and chemical composition of experimental diets (% DM)
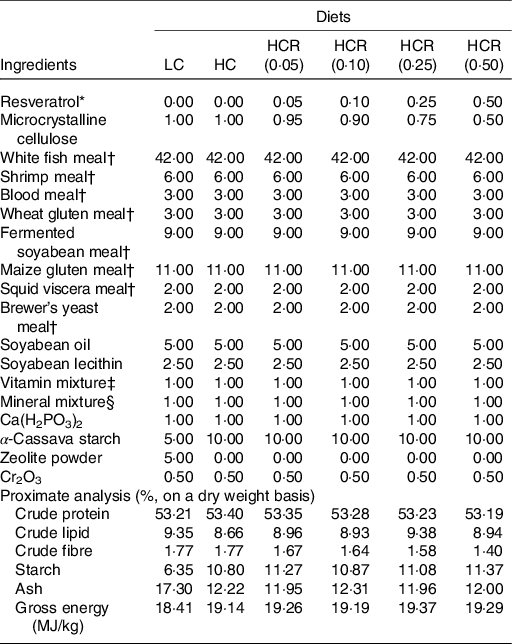
LC, low carbohydrate; HC, high carbohydrate; HCR, high carbohydrate diet supplemented with resveratrol.
* Acquired from Xi’an Quan’ao Biotech Co., Ltd (Shanxi, China), purity, 99 %.
† Supplied by Xinxin Tian’en Feed Corporation (Zhejiang, China): white fishmeal, crude protein, 72.01 %, crude lipid, 7.46 %; shrimp meal, crude protein, 61.72 %, crude lipid, 3.62 %; wheat gluten meal, crude protein, 80.05 %; fermented soyabean meal, crude protein, 51.67 %, crude lipid, 2.62 %; maize gluten meal, crude protein, 60.41 %, crude lipid, 5.12 %; squid viscera meal, crude protein, 49.27 %, crude lipid,19.07 %; brewer’s yeast meal, crude protein, 37.05 %, crude lipid, 0.52 %.
‡ Vitamin Premix (mg/kg diet): vitamin A, 16 000 IU; vitamin D3, 8000 IU; vitamin K3, 14.72; vitamin B1, 17.80; vitamin B2, 48; vitamin B6, 29.52; vitamin B12, 0.24; vitamin E, 160; vitamin C, 800; niacinamide, 79.20; calcium pantothenate, 73.60; folic acid, 6.40; biotin, 0.64; inositol, 320; choline chloride, 1500; l-carnitine, 100.
§ Mineral Premix (mg/kg diet): Mineral Premix (mg kg−1 diet): Cu (CuSO4), 2.00; Zn (ZnSO4), 34.4; Mn (MnSO4), 6.20; Fe (FeSO4), 21.10; I (Ca(IO3)2), 1.63; Se (Na2SeO3), 0.18; Co (CoCl2), 0.24; Mg (MgSO4·H2O), 52.70.
The proposed animal study was reviewed and approved by the Animal Care and Use Committee of Shanghai Ocean University. Juvenile largemouth bass were obtained from a Commercial Hatchery (Jiangsu, China) and domesticated in a recirculating freshwater aquaculture system for 2 weeks with a commercial feed (Zhejiang Xinxin Tian’en Aquatic Feed Co., Ltd). Then, after being fasted for 24 h, the fish (initial body weight 33·76 (sem 0·12) g) were randomly assigned to 21 tanks (water volume of 800 L) with 30 individuals per tank, following anaesthesia with eugenol (1:10 000) (Shanghai Chemical Reagents Co., Ltd), and another 20 fish were collected for initial body composition analysis. The fish were fed to visual satiation twice daily (8:00 and 16:00) for 9 weeks with experimental diets, and each diet was randomly allocated to three tanks. Water was recirculated after being filtered by sponges and coral sand and sterilised by ultra-violet light, and meanwhile, 10 % water were refreshed every day. All tanks were under a natural photoperiod and water temperature was monitored during the feeding trial: temperature at 27 (sem 1) °C and pH at 7·2 (sem 0·2).
Sample collection
At the termination of feeding trial, fish per tank were counted and weighted after being fasted for 24 h and anesthetised with eugenol (1:10 000). Then, three individuals were randomly sampled and stored at −80 °C for body composition analysis. Another ten fish per tank were collected to measure individual body length and body weight and then were drew blood samples with 1-mL syringes from tail vein. The obtained blood samples were stored at 4 °C for 1 h and thereafter centrifuged at 3000 g (10 min, 4 °C) to separate serum. Among the above ten fish, four were dissected to separate the liver and viscera for the calculation of hepatosomatic index and viscerosomatic index, respectively, and liver and muscle samples were obtained for biochemical composition analysis. Another six were sampled to separate liver and head kidney for gene expression analysis. The remaining fish per tank were refed in original tank with their respective experimental diet for another 1 week to return to normal physiological condition. Then, after being fasted for 24 h, serum samples were collected at the 0 (−3 h prior to feeding), 1, 3, 6, 12 and 24 h time points post-feeding for post-prandial serum glucose content analysis.
Chemical analysis
Moisture content was determined by drying samples at 105 °C to a constant weight in an oven (BPG-9140 A, Shanghai Yiheng Scientific Instrument Co., Ltd), and ash content was assayed by combusting samples at 550 °C to a constant weight in a muffle furnace (SX2, Shanghai Laboratory Instrument Works Co., Ltd)(38). Crude protein content was measured with Kjeldahl apparatus (Kjeltec 2200, Foss Analytical A/S, Hillerød) by measuring nitrogen content (N × 6·25)(38), and crude lipid content was determined using the chloroform-methanol extraction method(Reference Folch, Lees and Sloane-Stanley39). Cellulose content was estimated using a cellulose analyser (FT12, C. Gerhardt GmbH & Co. KG). Gross energy of experimental diets was analysed using oxygen bomb calorimeter (Parr 6400, Parr Instrument Company). The content of starch (digestible starch and resistant starch) in experimental diets was measured following the methods of McCleary et al. (Reference McCleary, McNally and Rossiter40). Serum glucose content was assayed following the glucose oxidase-peroxide enzyme (GOD-POD) method(Reference Trinder41). Glycogen content was measured following the potassium hydroxide/anthrone method(Reference Seifter, Dayton and Novic42). Lysozyme content was measured using Micrococcus lysodeikticus (Sigma) as substrate following the turbidimetric method(Reference Muona and Soivio43). Complement C3 and C4 contents were assayed with the immune turbidimetric method using a commercial kit following its instruction (Nanjing Jiancheng Bioengineering Institute).
RNA extraction and real-time quantitative PCR
Total RNA of liver and head kidney was extracted with Trizol Reagent, and its concentration was measured with a spectrophotometer (Tiangen Biotech Co., Ltd). After that, Prime ScriptTM RT reagent Kit was used to synthesise single-stranded cDNA. The primers of glucose metabolism-related genes were referred to the study of Li et al. (Reference Li, Sang and Wang14), and primers of inflammation related genes were designed using Primer Premier 5·0 (Table 2). Quantitative real-time PCR was conducted in a quantitative thermal cycler (Mastercycler EP Realplex, Eppendorf) with the following procedure: 95 °C for 2 min, followed by 40 cycles of 95 °C for 10s, 57 °C for 10s, and 72 °C for 20s, and melting curve analysis. Relative gene expressions were analysed using the 2−ΔΔCt method(Reference Livak and Schmittgen44), and β-actin was used as reference gene after its stability being verified.
Table 2. Primers used in the present study
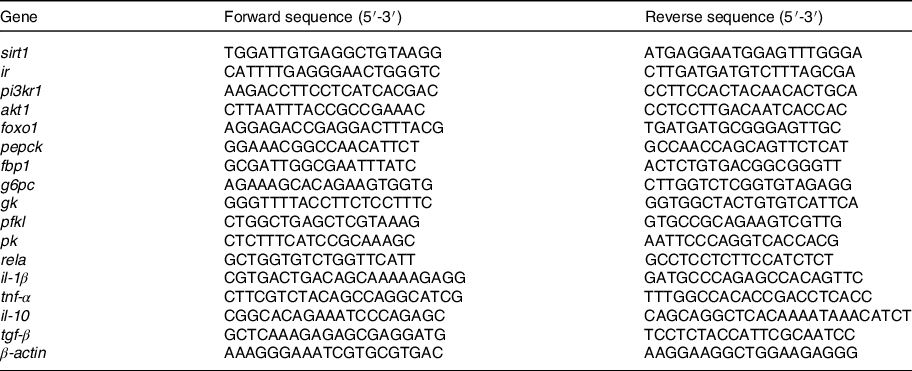
sirt1, sirtuin 1; ir: insulin receptor; pi3kr1: phosphatidylinositol-3-kinase p85 alpha; akt1, serine/threonine kinase 1; foxo1: Forkhead box O1; pepck, phosphoenolpyruvate carboxykinase; fbp1, fructose-1,6-bisphosphatase-1; g6pc, glucose-6-phosphatase catalytic subunit; gk, glucokinase; pfkl, phosphofructokinase liver type; pk, pyruvate kinase; rela: NF-κB p65; tgf-β: transforming growth factor-β.
Calculations and statistical methods
The parameters of growth and feed utilisation were calculated as follows:
The results were expressed as the mean values with their standard errors. All of the statistical evaluations were performed after data being tested for normality and homoscedasticity with SPSS 19·0. Factorial (two-way) ANOVA was used to determine the main effects of sampling time, dietary treatments and their interaction on post-prandial serum glucose content. If significant differences were observed in the interaction, post-prandial serum glucose content at each treatment was further analysed by one-way ANOVA followed by Tukey’s multiple range test. As for serum content of different treatments at each sampling time, in accordance with statistical analysis of other variables measured, Dunnett’s test was used to compare the data in HC to HCR (0·50) group to the LC group, and meanwhile, polynomial contrasts (linear, quadratic and cubic) were used to evaluate the effect of RSV inclusion on the analysed data within HC through HCR (0·50) groups. The level of significance was set at P < 0·05.
Results
Growth performance and feed utilisation
The growth performance and feed utilisation of largemouth bass fed experimental diets are presented in Table 3. All dietary treatments produced no statistical difference on survival rate (Table 3). Although no significant difference was observed, high dietary carbohydrate decreased final body weight and specific growth rate (Table 3). The inclusion of RSV did not cause significant effect in growth, and final body weight and specific growth rate in fish fed the diet with 0·5 % RSV was much lower than that in the LC group (Table 3). No significant difference was observed in condition factor among treatments (Table 3). High dietary carbohydrate significantly elevated hepatosomatic index, while the inclusion of RSV led to a significant decrease in hepatosomatic index in a partial U-shaped manner with lowest value in HCR (0·25) group (Table 3). However, viscerosomatic index was not significant increased with the increase in dietary carbohydrate, while the inclusion of RSV caused a non-linear decline to a nadir in viscerosomatic index with the lowest value in 0·25 % RSV group (Table 3). High dietary carbohydrate significantly decreased feed intake (FI) but remarkably elevated feed efficiency rate and protein efficiency rate (Table 3). The inclusion of RSV did not result in any significant impacts in FI but led to a non-linear decline of feed efficiency ratio and protein efficiency ratio to a nadir in a partial U-shaped manner with the minimum value in 0·50 % RSV group (Table 3). Meanwhile, feed efficiency ratio and protein efficiency ratio of fish fed diets with 0·25 % and 0·50 % RSV possessed no statistical difference with that of LC group (Table 3).
Table 3. Growth performance and feed utilisation of largemouth bass fed experimental diets for 9 weeks
(Mean values with standard error of the mean)

LC, low carbohydrate; HC, high carbohydrate; HCR, high carbohydrate diet supplemented with resveratrol; IBW, initial body weight; FBW, final body weight; SR, survival rate; SGR, specific growth rate; CF, condition factor; HSI, hepatosomatic index; VSI, viscerosomatic index; FI, feed intake; FER, feed efficiency ratio; PER, protein efficiency ratio.
* Values (means with their standard error of the mean, sem) within a row with the asterisks are significantly different compared with that of the LC group (Dunnett’s test, P < 0.05).
Tissue glycogen content and post-prandial serum glucose content
The increased dietary carbohydrate significantly promoted hepatic glycogen accumulation (Fig. 1 (a)). However, the inclusion of RSV caused to a decline of hepatic glycogen content to a nadir in an L-shaped manner with the lowest value in 0·10 % RSV group. Meanwhile, no significant difference was observed between LC and HCR groups (Fig. 1(a)). Similarly, RSV supplementation significantly decreased high-dietary-carbohydrate-induced muscle glycogen accumulation in an L-shaped manner, and muscle glycogen content in fish fed the diet with RSV presented no statistical difference with that of the LC group (Fig. 1(b)).
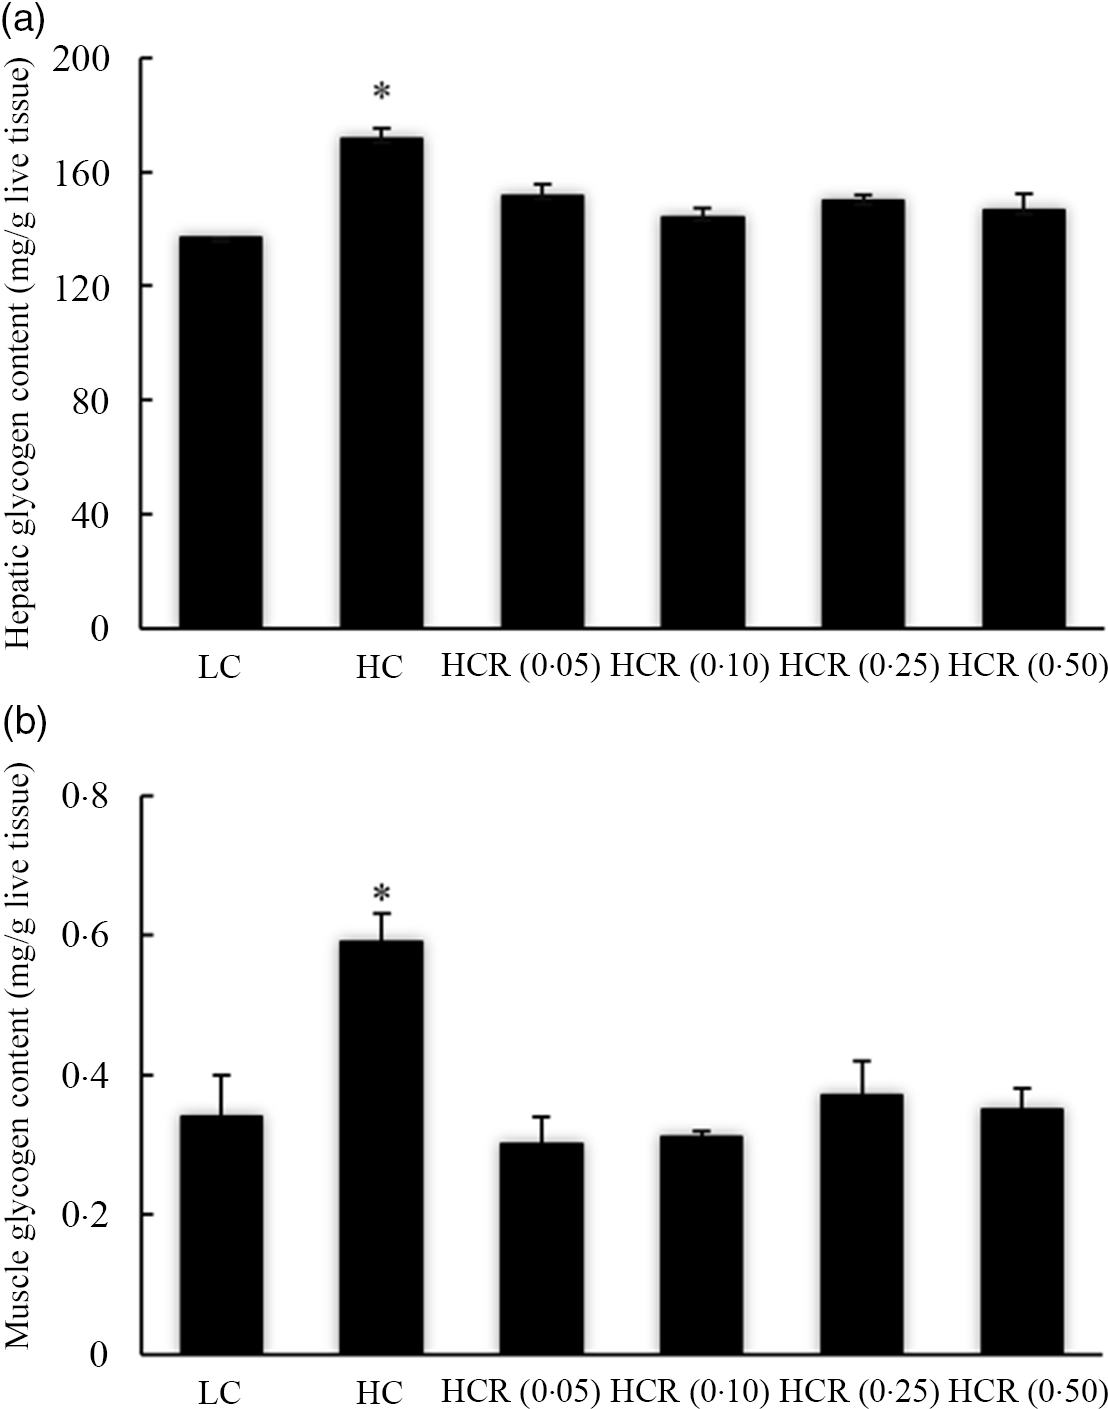
Fig. 1. Hepatic (a) and muscle (b) glycogen content of largemouth bass fed diets with experimental diets for 9 weeks. Values are means (N 3), with their standard errors represented by vertical bars. The asterisks indicate significant difference compared with the LC group (Dunnett’s test, P < 0·05). Polynomial contrasts (linear, quadratic and cubic) were conducted within HC through HCR (0·50) groups. Hepatic glycogen content (a): P linear < 0·01; P quadratic < 0·01; P cubic < 0·01. Muscle glycogen content (b): P linear = 0·07; P quadratic < 0·01; P cubic < 0·01. LC, low carbohydrate; HC, high carbohydrate; HCR, high carbohydrate diet supplemented with resveratrol.
The post-prandial serum glucose content was significantly affected by sampling time, glucose dose and their interaction (Fig. 2). Serum glucose content in all treatments increased significantly with the peak in the 6-h time point post-feeding and thereafter decreased significantly to the basal level at the 24-h time point post-feeding (Fig. 2). High dietary carbohydrate significantly elevated serum glucose content at the 6- and 12-h time points post-feeding (Fig. 2). The inclusion of RSV decreased serum content at 0-h time points post-feeding in a cubic manner with minimum value observed in 0·05 % RSV group (Fig. 2). Meanwhile, the RSV inclusion caused an L-shaped decrease in serum glucose content at the 1-h time point post-feeding to a nadir in 0·25 % RSV group (Fig. 2). The serum glucose content at the 3-h time point post-feeding was not significantly affected with the inclusion of RSV, while its content in 0·05 and 0·25 % RSV groups was significantly lower than that of the LC group (Fig. 2). The RSV inclusion significantly decreased serum glucose content at the 6-h time point post-feeding in an L-shaped manner to a minimum value in the 0·25 % RSV group, and meanwhile, fish fed diets with 0·25 and 0·50 % RSV produced a significantly lower glucose content compared with the LC group at this time point (Fig. 2). However, RSV inclusion led to a partial U-shaped decline of serum glucose content at the 12-h time point post-feeding to a nadir in 0·25 % RSV group, and no significant difference was observed in its content at the 24-h time point post-feeding (Fig. 2).
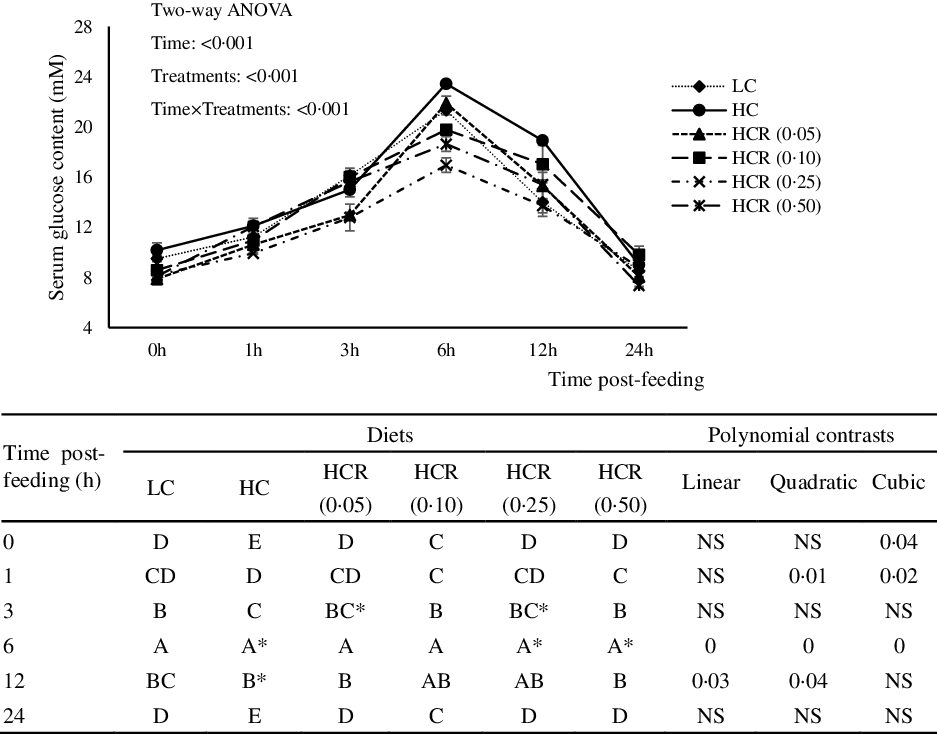
Fig. 2. Post-prandial serum glucose content, 0 (−3 h prior to feeding), 1-, 3-, 6-, 12- and 24-h time points post-feeding, of largemouth bass fed experimental diets for 9 weeks. Values are means (N 3), with their standard errors represented by vertical bars. The same capital letters indicate no significant differences (Tukey’s test, P > 0·05) at different sampling time within each treatment. The asterisks indicate significant difference compared with the LC group (Dunnett’s test, P < 0·05). LC, low carbohydrate; HC, high carbohydrate; HCR, high carbohydrate diet supplemented with resveratrol.
Expression of sirtuin 1 (sirt1) and genes involved in insulin pathway
The increase in dietary carbohydrate significantly reduced the expression of sirt1, while RSV inclusion promoted its expression to a plateau in a U-shaped manner with the maximum value in 0·10 % RSV group (Fig. 3). There is no statistical difference in the expression of insulin receptor (ir) in all treatments (Fig. 4(a)). High dietary carbohydrate significantly decreased the expression of phosphatidylinositol-3-kinase p85 alpha (pi3kr1) (Fig. 4(b)). Meanwhile, its expression was responded in a cubic manner to the inclusion of RSV, and meanwhile, fish fed the diet with 0·25 % RSV, not other inclusion levels, showed no significant difference with the LC group (Fig. 4(b)). High dietary carbohydrate produced no significant effect on the expression of serine/threonine kinase 1 (akt1) (Fig. 4(c)). Meanwhile, the inclusion of RSV produced a cubic increase of akt1 expression to a plateau, and the maximum expression was observed in 0·10 % RSV group, which was significantly elevated compared with the LC group (Fig. 4(c)). The expression of Forkhead box O1 (foxo1) was significantly up-regulated as dietary carbohydrate increased, while the increased expression was significantly inhibited in an L-shaped manner with RSV inclusion (Fig. 4(d)). Meanwhile, the foxo1 expression in fish fed diets with 0·25 and 0·50 % RSV showed no statistical difference compared with that of the LC group (Fig. 4((d)).
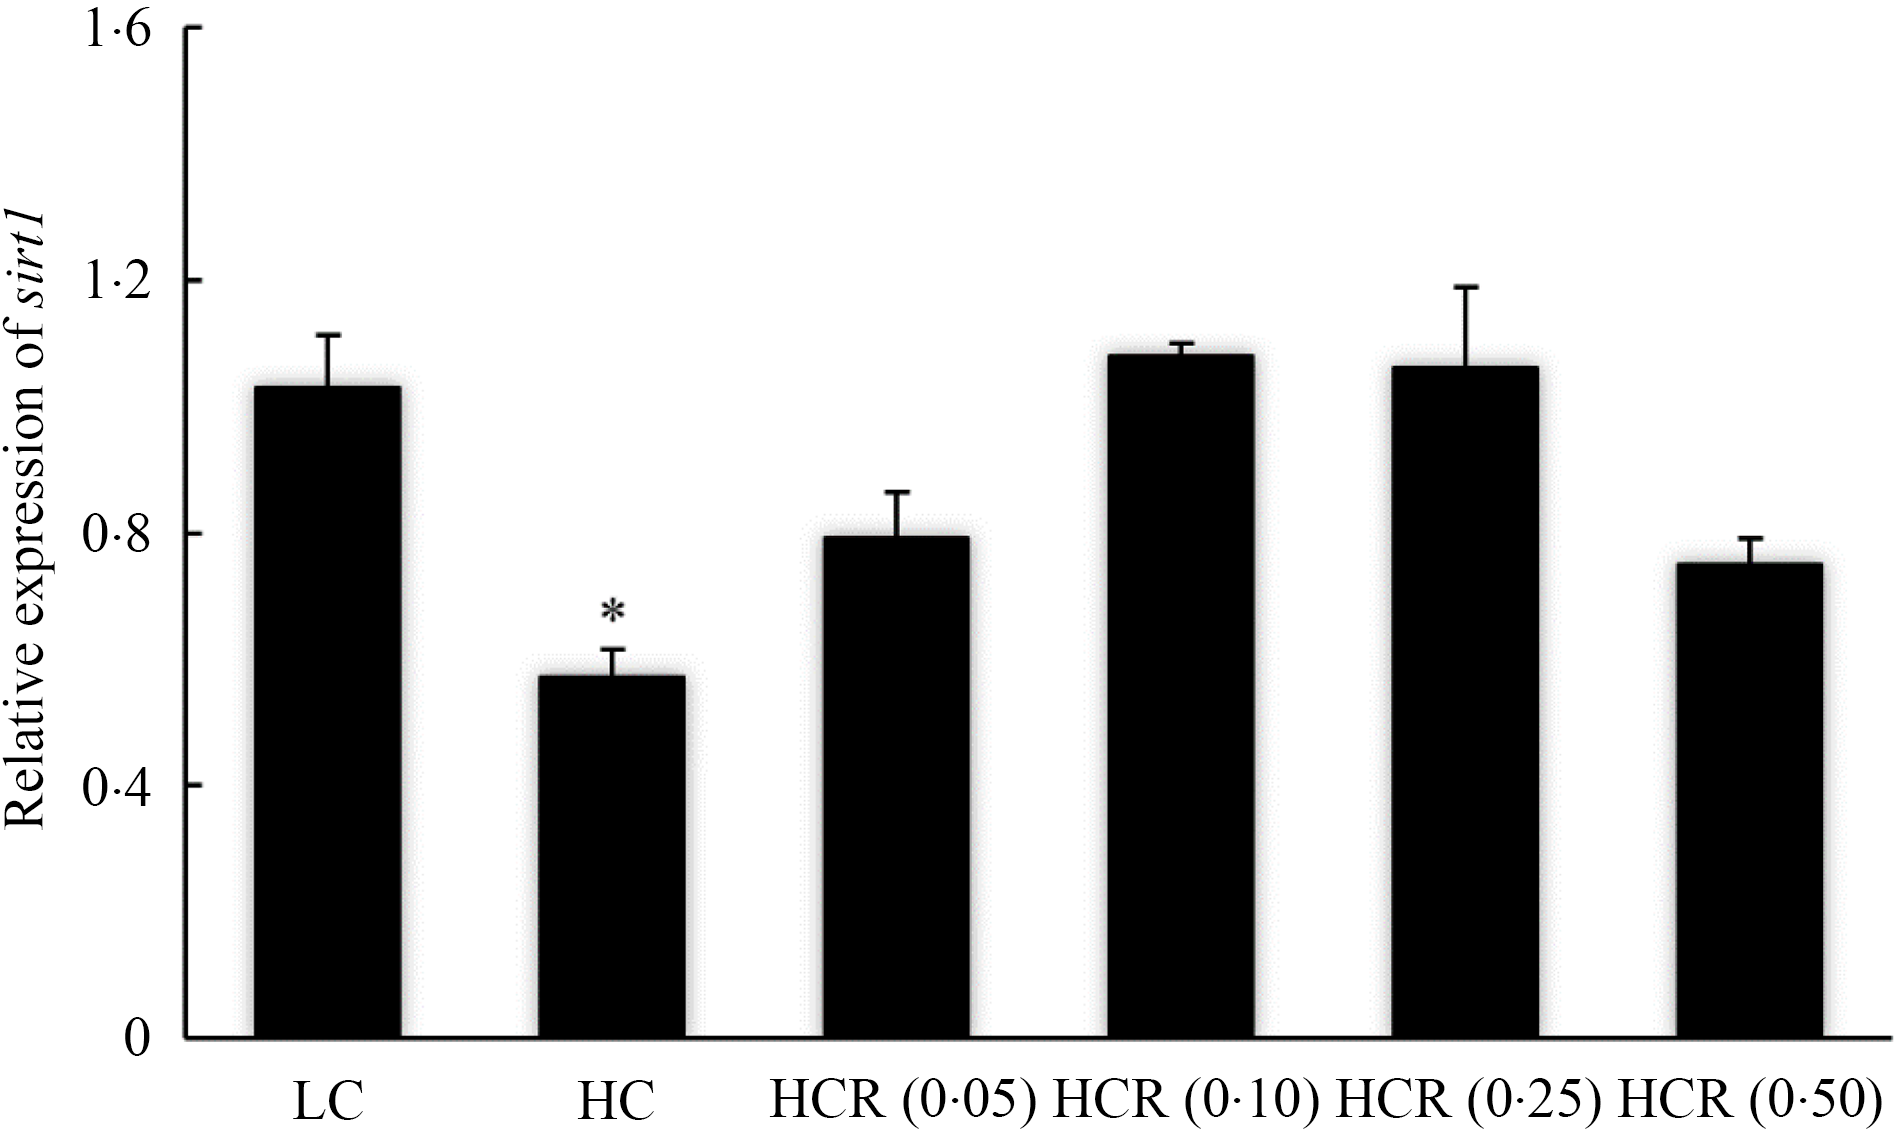
Fig. 3. The expression of sirtuin 1 (sirt1) of of largemouth bass fed experimental diets for 9 weeks. Values are means (N 3), with their standard errors represented by vertical bars. The asterisks indicate significant difference compared with the LC group (Dunnett’s test, P < 0·05). Polynomial contrasts (linear, quadratic and cubic) were conducted within HC through HCR (0·50) groups. P linear = 0·14; P quadratic < 0·01; P cubic < 0·01. LC, low carbohydrate; HC, high carbohydrate; HCR, high carbohydrate diet supplemented with resveratrol.
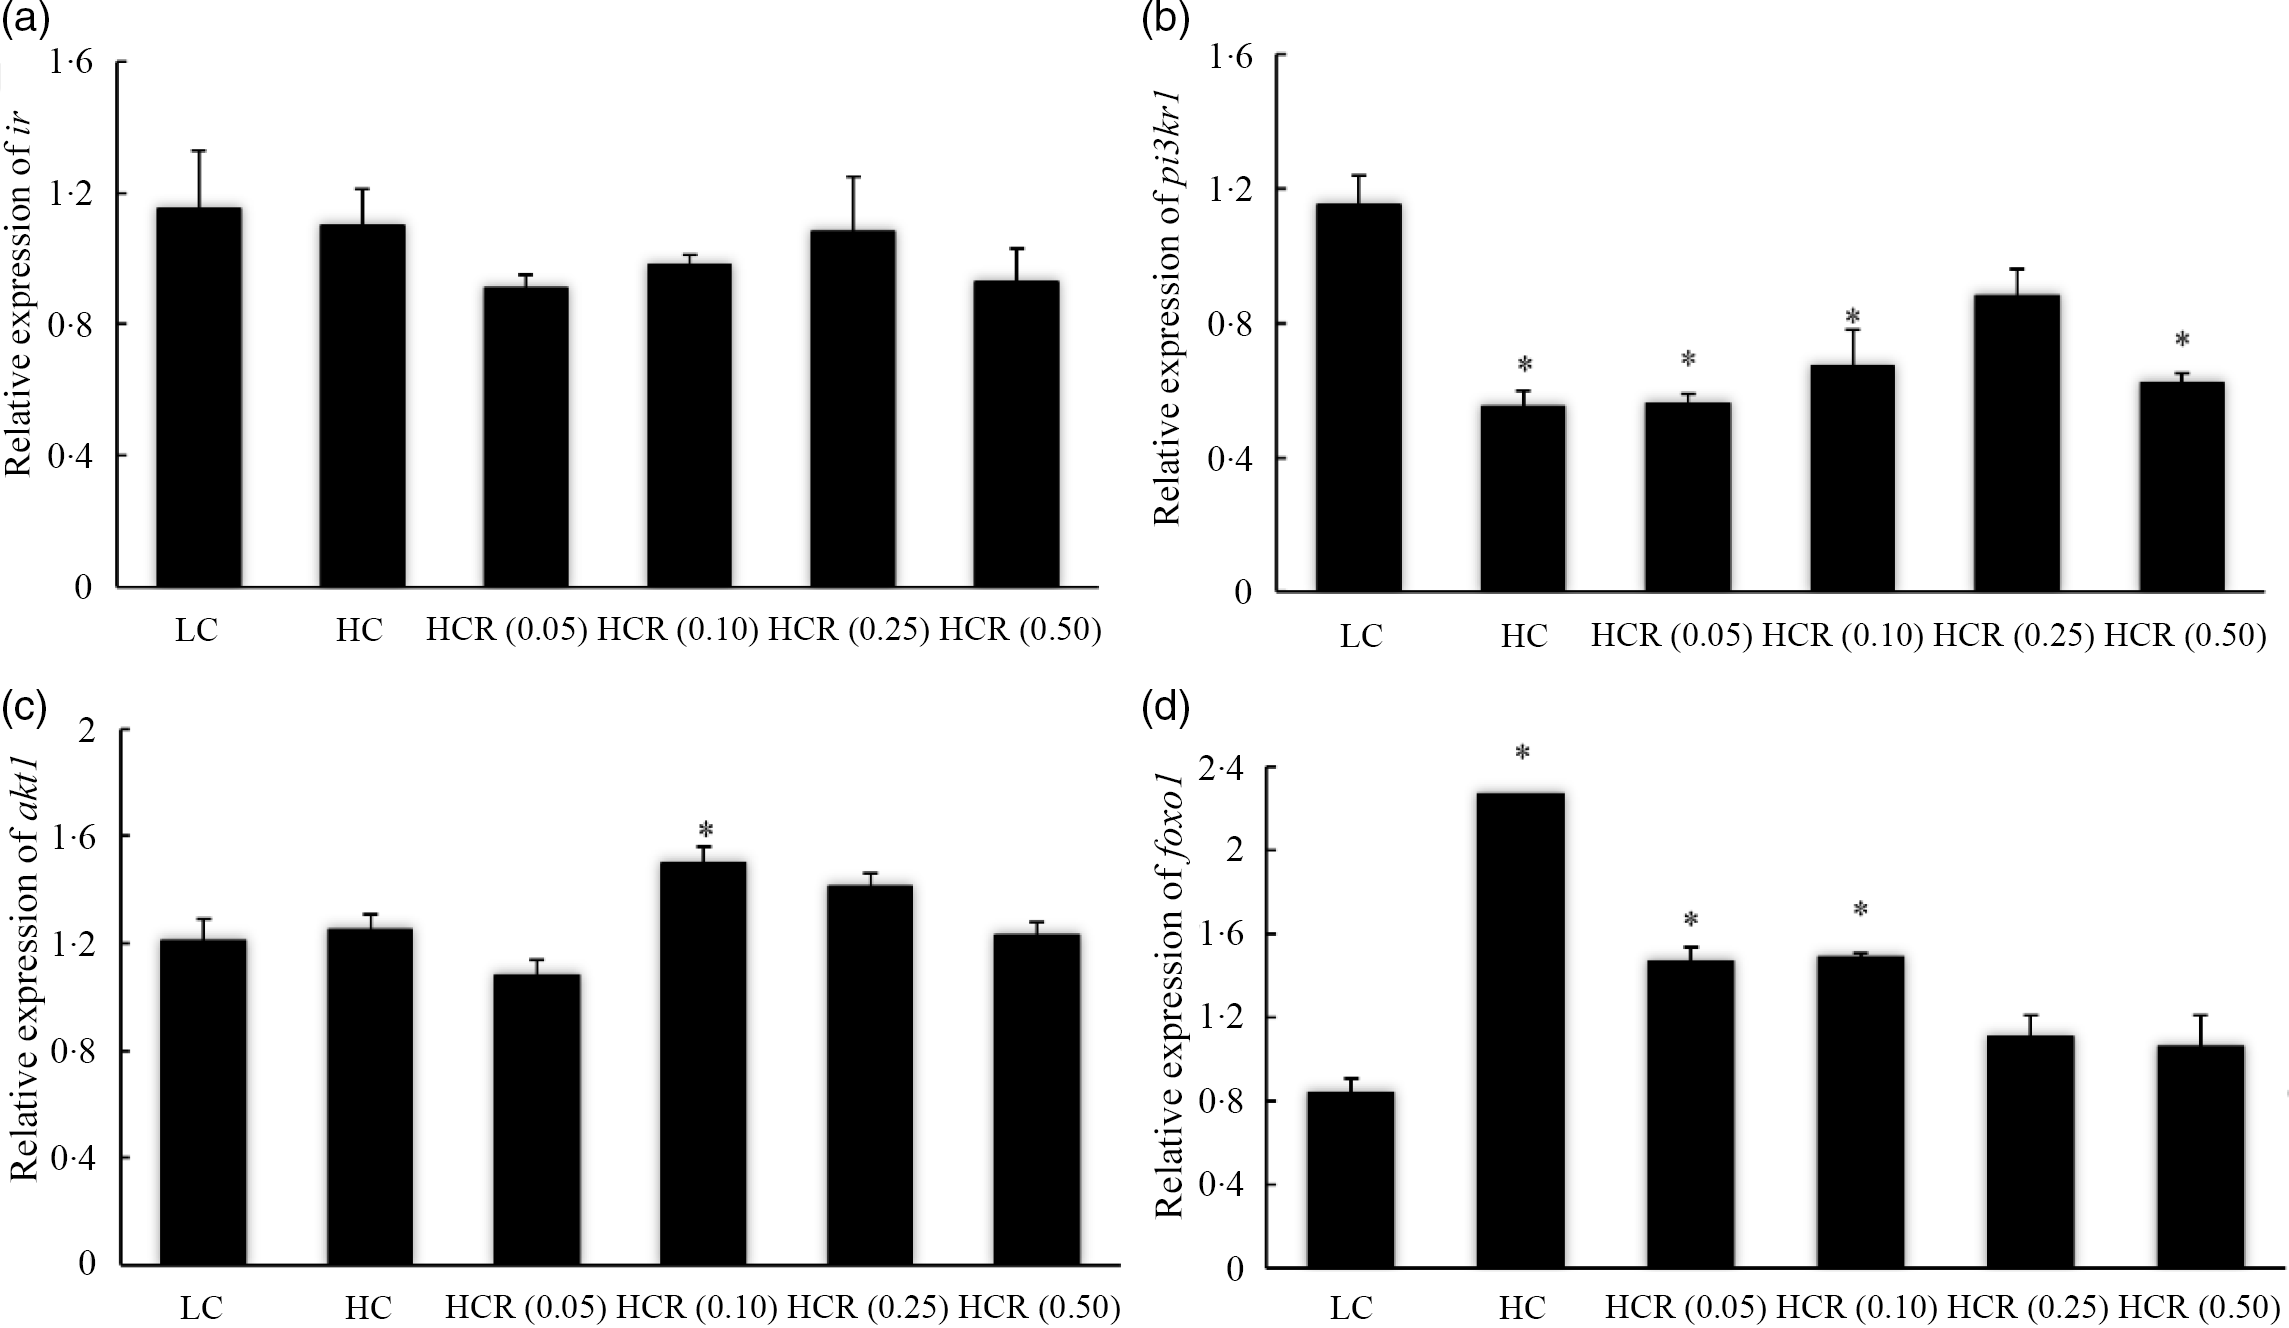
Fig. 4. The expression of insulin pathway-related genes, insulin receptor (IR) (a), phosphatidylinositol-3-kinase p85 alpha (pi3kr1) (b) and serine/threonine kinase 1 (akt1) (c), and transcription factor, Forkhead box O1 (foxo1) (d) in fish fed experimental diets for 9 weeks. Values are means (N 3), with their standard errors represented by vertical bars. The asterisks indicate significant difference compared with the LC group (Dunnett’s test, P < 0·05). Polynomial contrasts (linear, quadratic and cubic) were conducted within HC through HCR (0·50) groups. IR (a): P linear = 0·59; P quadratic = 0·84; P cubic = 0·42. pi3kr1 (b): P linear = 0·11; P quadratic = 0·11; P cubic = 0·02. akt1 (C): P linear = 0·37; P quadratic = 0·25; P cubic = 0·03. foxo1 (D): P linear < 0·01; P quadratic < 0·01; P cubic < 0·01. LC, low carbohydrate; HC, high carbohydrate; HCR, high carbohydrate diet supplemented with resveratrol.
Expression of genes involved in glucose metabolism
High dietary carbohydrate did not produce any significant effect on the expression of glucokinase (gk) (Fig. 5(a)). Meanwhile, the supplementation of RSV led to an elevated expression of gk in an L-shaped manner, and significant elevation was observed in 0·10, 0·25 and 0·50 % RSV groups compared with the LC group (Fig. 5(a)). The expression of phosphofructokinase liver type (pfkl) followed a similar pattern with that of gk, and meanwhile, its expression increased to a plateau in the 0·10 % RSV group in a cubic manner (Fig. 5(b)). Additionally, no significant difference was observed in the expression of pyruvate kinase (pk), and meanwhile, the inclusion of RSV caused a linear increased expression of pk (Fig. 5(c)).
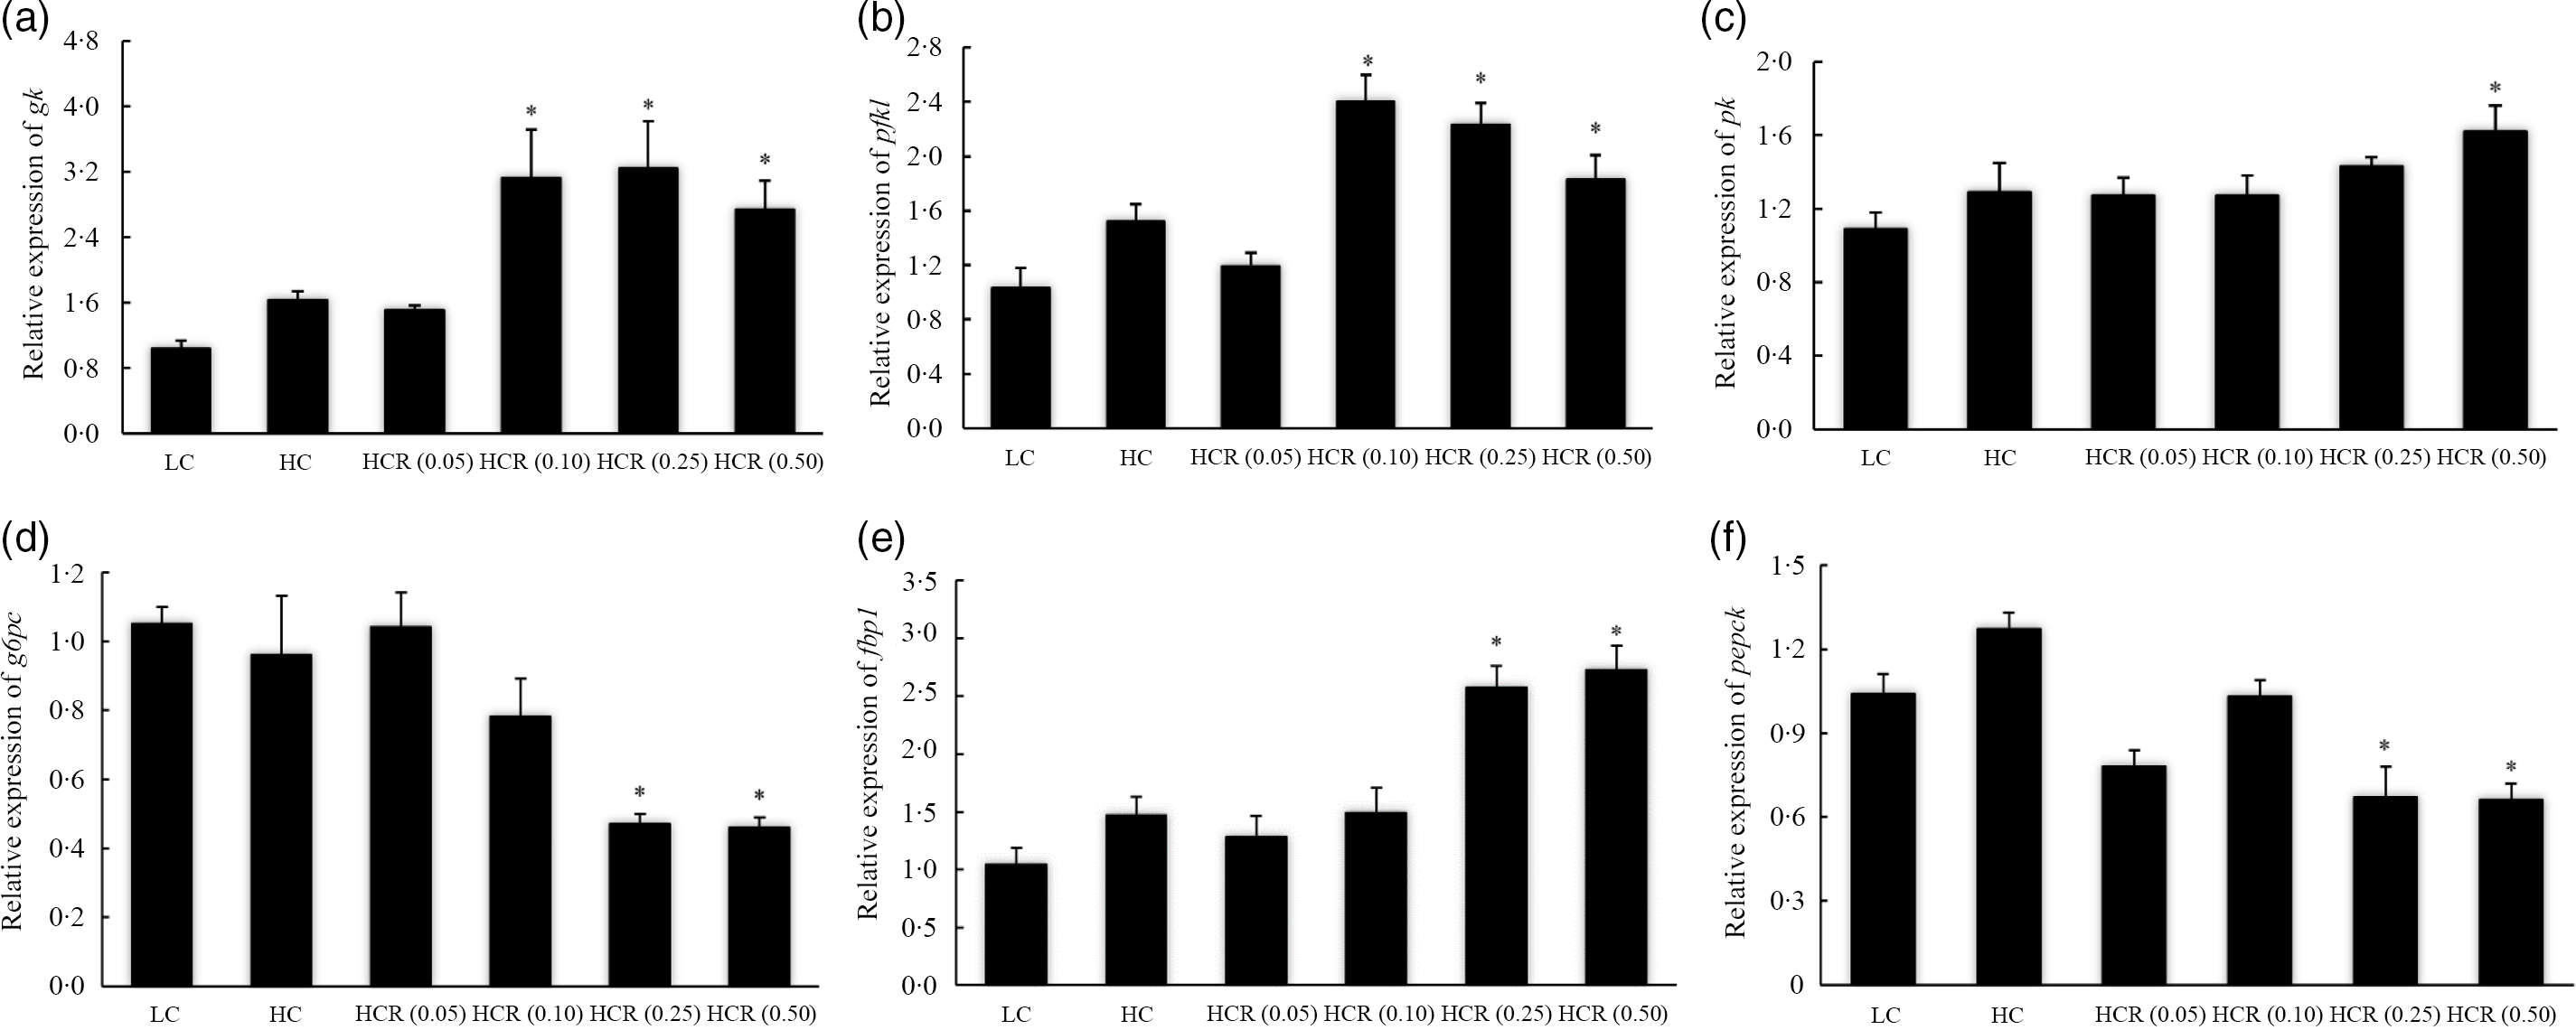
Fig. 5. The expression of glycolysis, glucokinase (gk) (a), phosphofructokinase liver type (pfkl) (b) and pyruvate kinase (pk) (c), and gluconeogenesis, glucose-6-phosphatase catalytic subunit (g6pc) (d), fructose-1,6-bisphosphatase-1 (fbp1) (e) and phosphoenolpyruvate carboxykinase (pepck) (f), related genes in fish fed experimental diets for 9 weeks. Values are means (N 3), with their standard errors represented by vertical bars. The asterisks indicate significant difference compared with the LC group (Dunnett’s test, P < 0·05). Polynomial contrasts (linear, quadratic and cubic) were conducted within HC through HCR (0·50) groups. gk (a): P linear = 0·02; P quadratic = 0·03; P cubic = 0·02. pfkl (b): P linear = 0·08; P quadratic = 0·07; P cubic = 0·01. pk (c): P linear = 0·04; P quadratic = 0·05; P cubic = 0·13. g6pc (d): P linear < 0·01; P quadratic < 0·01; P cubic < 0·01. fbp1 (e): P linear < 0·01; P quadratic < 0·01; P cubic < 0·01. pepck (f): P linear < 0·01; P quadratic < 0·01; P cubic = 0·01. LC, low carbohydrate; HC, high carbohydrate; HCR, high carbohydrate diet supplemented with resveratrol.
The increased dietary carbohydrate did not significantly influence the expression of gluconeogenesis-related genes, glucose-6-phosphatase catalytic subunit (g6pc), fructose-1,6-bisphosphatase-1 (fbp1) and phosphoenolpyruvate carboxykinase (pepck) (Fig. 5(d–f)). The inclusion of RSV caused an L-shaped decease of g6pc and pepck expression, and their expression in fish fed diets with 0·25 and 0·50 % RSV was significantly lower than the LC group (Fig. 5(d) and (f)). However, the variation of fbp1 expression followed an opposite pattern with that of g6pc in response to the inclusion of RSV (Fig. 5(e)).
Non-specific immunity response
The increased dietary carbohydrate significantly decreased the content of lysozyme in both serum and liver (Table 4). The inclusion of RSV produced an L-shaped increase in hepatic lysozyme content to a plateau in fish fed the diets with 0·25 % RSV (Table 4). Meanwhile, the serum lysozyme content increased significantly in a U-shaped manner as dietary RSV increased from 0·0 to 0·10 % and then decreased unsymmetrically (Table 4). Dietary treatments produced no significant effect on the content of serum complement C3 and C4, and meanwhile, complement C3 content in liver was also not significantly influenced by dietary treatments (Table 4). The increase in dietary carbohydrate significantly elevated complement C4 content in liver, while the inclusion of RSV attenuated high-dietary-carbohydrate-induced production of complement C4 in an L-shaped manner with significant difference observed in 0·25 % RSV group (Table 4).
Table 4. The lysozyme activity and complement (C3 and C4) content of largemouth bass fed experimental diets for 9 weeks
(Mean values with standard error of the mean)

LC, low carbohydrate; HC, high carbohydrate; HCR, high carbohydrate diet supplemented with resveratrol.
* Values (means with their standard error of the mean, sem) within a row with the asterisks are significantly different compared with that of the LC group (Dunnett’s test, P < 0.05). C3: complement C3; C4: complement C4.
In addition, the expression of inflammation-related genes in head kidney was used to evaluate inflammation response of largemouth bass to RSV inclusion (Fig. 6). No significant difference was observed in the expression of NF-κB p65 subunit (rela) in all treatments (Fig. 6(a)). The increased dietary carbohydrate significantly promoted the transcription of tnf-α (Fig. 6(b)) and slightly increased the expression of pro-inflammatory cytokines il-1β (Fig. 6(c)). However, RSV inclusion led to an L-shaped decrease of tnf-α and il-1β expression to a nadir in fish fed diets with 0·50 % and 0·10 % RSV, respectively (Fig. 6(b) and (c)). Compared with the LC group, the inclusion of 0·50 % RSV led to a significant decreased expression of tnf-α (Fig. 6(b)), and the expression of il-1β in fish fed diets with 0·10 and 0·25 % RSV was significantly decreased (Fig. 6(c)). High dietary carbohydrate slightly decreased the expression of anti-inflammatory cytokines il-10 (Fig. 6(d)) and transforming growth factor-β (tgf-β) (Fig. 6(e)). Meanwhile, the expression of il-10 increased significantly in an L-shaped manner with the inclusion of RSV from 0·0 to 0·10 %, and its expression in fish fed diets with 0·10 and 0·25 % RSV was significantly higher than that of LC group (Fig. 6(d)). The expression of tgf-β, in response to RSV inclusion, followed a similar pattern with that of il-10, and its expression in fish fed diets with 0·25 and 0·50 % RSV was significantly higher than that of LC group (Fig. 6(e)).
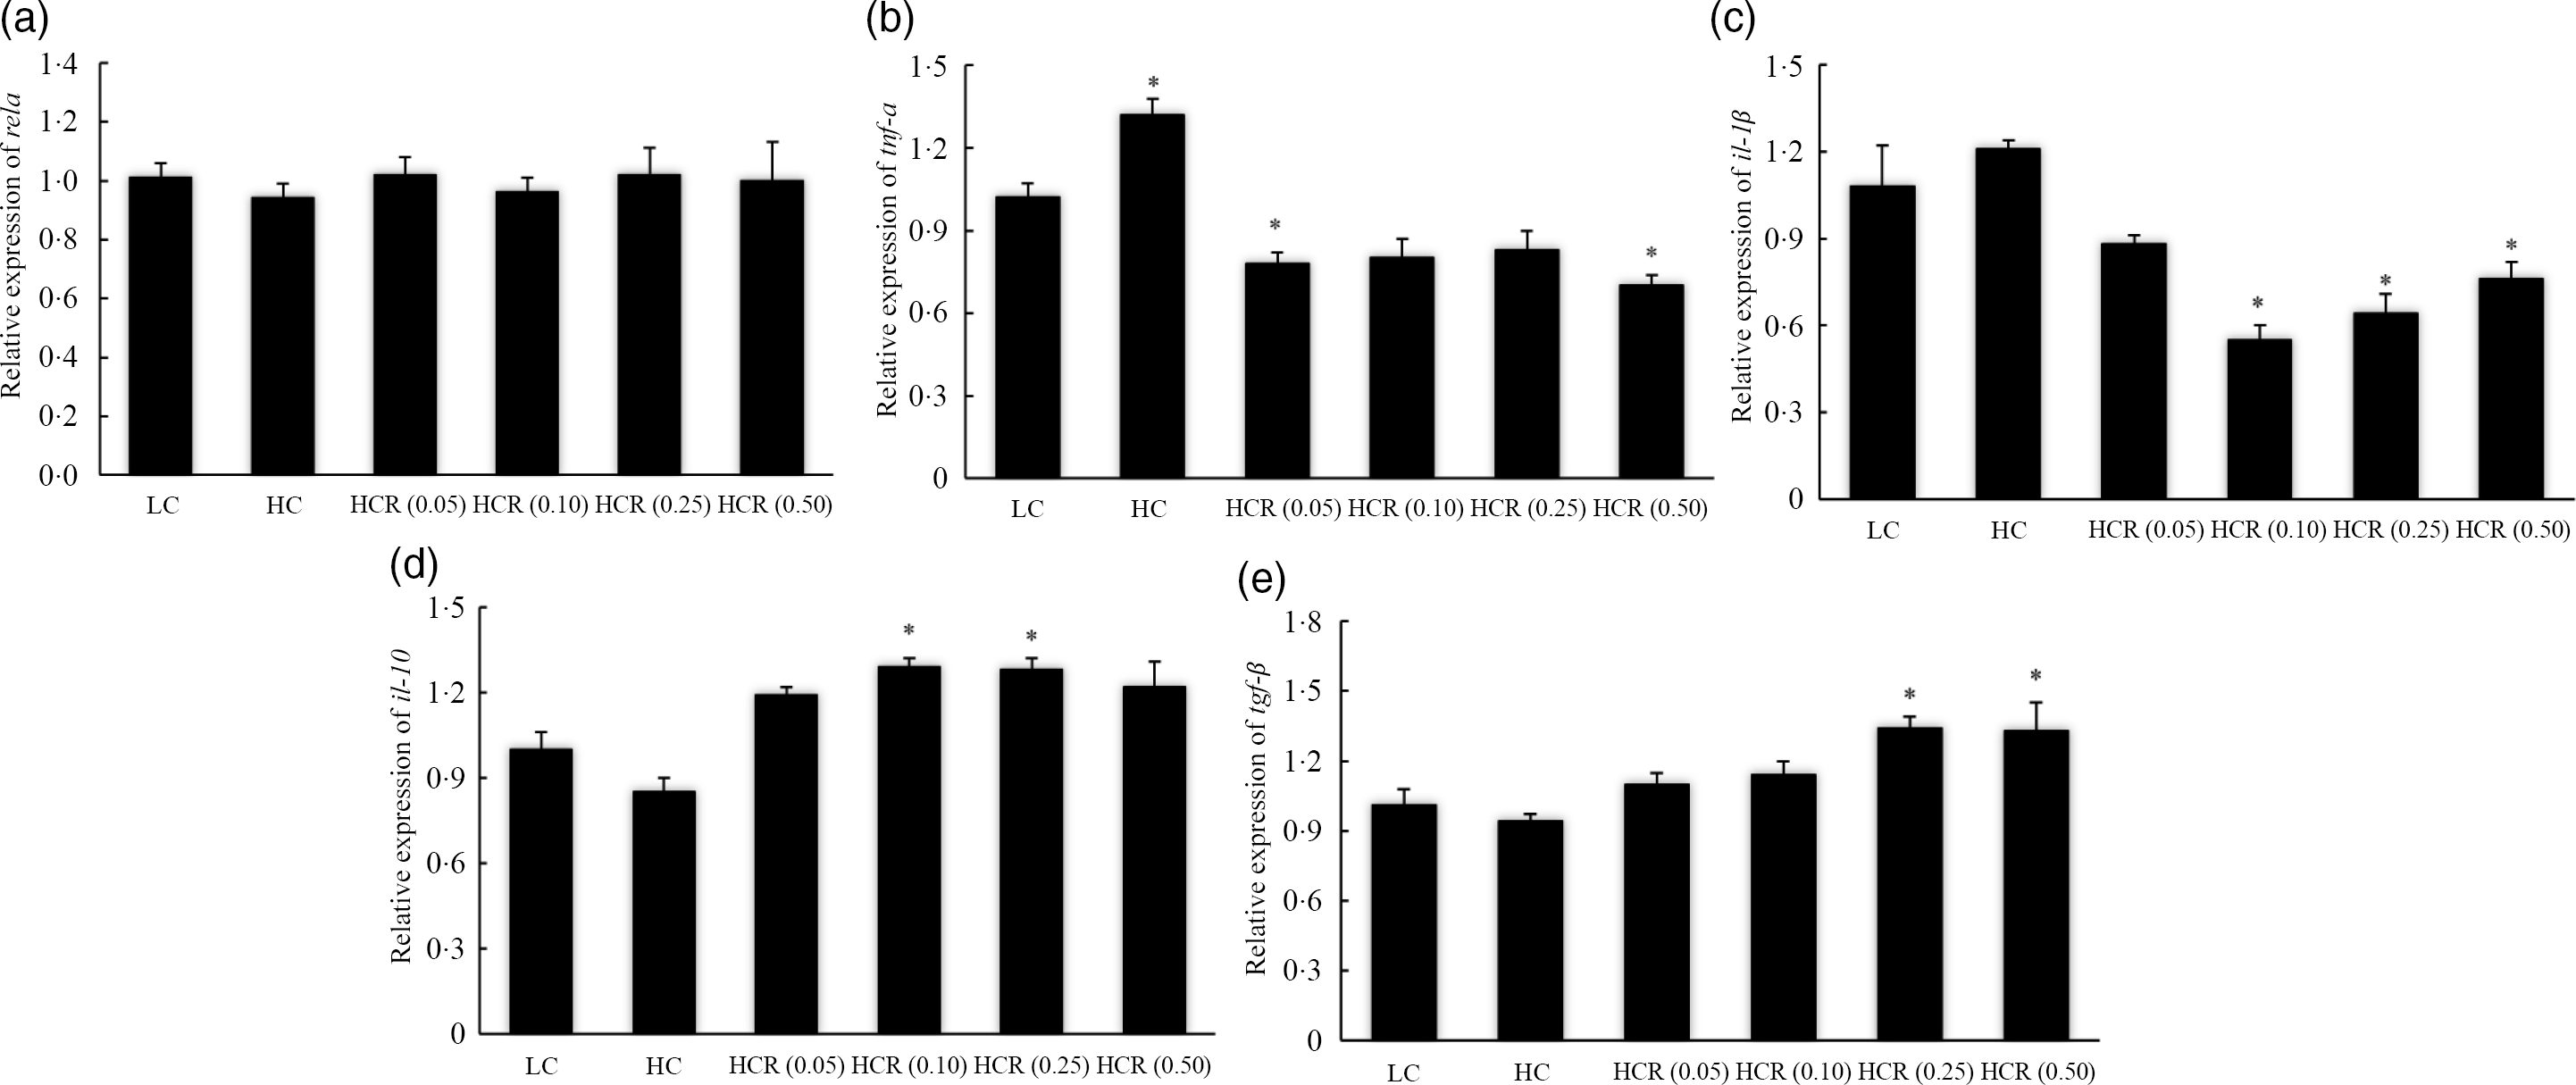
Fig. 6. The expression of inflammation response-related genes, NF-κB p65 (rela) (a), tnf-α (b), il-1β (c), il-10 (d) and transforming growth factor-β (tgf-β) (e) in head kidney of fish fed experimental diets for 9 weeks. Values are means (N 3), with their standard errors represented by vertical bars. The asterisks indicate significant difference compared with the LC group (Dunnett’s test, P < 0·05). Polynomial contrasts (linear, quadratic and cubic) were conducted within HC through HCR (0·50) groups. rela (a): P linear = 0·63; P quadratic = 0·85; P cubic = 0·95. tnf-α (b): P linear < 0·01; P quadratic < 0·01; P cubic < 0·01. il−1β (c): P linear < 0·01; P quadratic < 0·01; P cubic < 0·01. il-10 (d): P linear < 0·01; P quadratic < 0·01; P cubic < 0·01. tgf-β (e): P linear < 0·01; P quadratic < 0·01; P cubic < 0·01. LC, low carbohydrate; HC, high carbohydrate; HCR, high carbohydrate diet supplemented with resveratrol.
Discussion
The limited glucose utilisation of largemouth bass has been well demonstrated in some previous studies, where growth performance, FI and health status were negatively impacted by excessive dietary carbohydrate(Reference Ma, Mu and Pu5,Reference Gou, Chen and Xu45,Reference Li, Sang and Turchini46) . In the present study, final body weight and specific growth rate of largemouth bass were decreased as dietary carbohydrate increased. The FI of fish species is suggested to be adjusted to coordinate differences in total energy intake(Reference Li, Li and Zhang4,Reference Li, Sang and Turchini46) . Therefore, in the present study, the reduced FI of HC group, compared with the LC group, may be due to higher total energy content in HC diet. In mammals, RSV inclusion can improve health status(Reference Szkudelski and Szkudelska22,Reference Baur, Pearson and Price47) , and this plant extract has been also widely used as additives in aquafeeds to improve nutrients metabolism and health of fish species(Reference Zhang, Yan and Tian30,Reference Shi, Xu and Liu31,Reference Wilson, Baumgarner and Watanabe48–Reference Timmers, Hesselink and Schrauwen51) . The influence of RSV inclusion on growth performance of fish is seldom comparable and at times contradictory. The inclusion of RSV significantly elevated growth performance of southern flounder (Paralichthys lethostigma) (0·06 % RSV)(Reference Wilson, Baumgarner and Watanabe48), while produced no statistical difference on it in blunt snout bream (0·04 % RSV)(Reference Shi, Xu and Liu31). However, in the present study, the growth performance of largemouth bass fed the diet with 0·50 % RSV was reduced compared with other treatments, and consistently, depressed growth was observed in blunt snout bream (0·36 %(Reference Zhang, Yan and Tian30) and 0·50 %(Reference Jia, Yan and Zhou49) RSV) and Atlantic salmon (Salmo salar) (0·50 % RSV)(Reference Menoyo, Kühn and Ruiz-Lopez50). Accordingly, the inclusion dose of RSV produces different effects on fish performance, and high supplementation commonly produces a compromised effect on the growth of teleosts. RSV has been suggested to be involved in the regulation of cellular energy metabolism(Reference Timmers, Hesselink and Schrauwen51), and its inclusion can decrease energy storage efficiency and promote energy consumption rate of blunt snout bream(Reference Jia, Yan and Zhou49). Therefore, the regulation of RSV on energy metabolism may be partly responsible for the reduction in growth performance or feed efficiency of largemouth bass in 0·50 % RSV group.
In general, high dietary carbohydrate commonly results in hepatic glycogen accumulation and post-prandial hyperglycemia in carnivorous fish with diabetes-like features(Reference Wang, Li and Han3,Reference Li, Li and Zhang4,Reference Li, Sang and Turchini46) . In the present study, significantly increased hepatic glycogen content and post-prandial hyperglycemia were observed as dietary carbohydrate increased. The excessive hepatic glycogen deposition in fish commonly impairs hepatocyte functions and health status(Reference Goodwin, Lochmann and Tieman6–Reference Xu, Chen and Liu8). Previous studies have well illustrated that the supplementation of RSV can enhance insulin sensitivity(Reference Lagouge, Argmann and Gerhart-Hines21) and prevent hepatic pathological changes caused by the intake of high-energy diet(Reference Baur, Pearson and Price47). In the present study, the supplementation of RSV from 0·0 to 0·10% caused an L-shaped decrease in hepatic glycogen content to a plateau, and meanwhile, the post-prandial hyperglycemia was attenuated with the inclusion of RSV. Similarly, decreased serum glucose content caused by RSV inclusion was also observed in blunt snout bream(Reference Zhang, Yan and Tian30,Reference Shi, Xu and Liu31) . However, inconsistently, the inclusion of RSV significantly elevated hepatic glycogen content in blunt snout bream(Reference Shi, Xu and Liu31). Previous studies have confirmed that lower glucose utilisation capacity of carnivorous fish compared with herbivorous and omnivorous fish(Reference Stone52,Reference Polakof, Panserat and Soengas53) . In the study of Shi et al. (Reference Shi, Xu and Liu31), the increase of 10% dietary carbohydrate led to an increase of about 4% hepatic lipid content and 0·9% glycogen content, indicating that dietary carbohydrate tends to be converted to lipid rather than glycogen in blunt snout bream. However, the increase of 5% dietary carbohydrate resulted in an increase of 3·5% hepatic glycogen content with no significant influence on lipid content (LC, 1·42 (sem 0·03) % wt; HC, 1·49 (sem 0·09) % wt; P = 0·797) in the present study, which confirmed that dietary carbohydrate caused glycogen accumulation rather than lipid deposition in the carnivorous fish, largemouth bass. Therefore, the different ability of the two above fish species to utilise glucose may account for their distinct response of hepatic glycogen content to RSV supplementation.
The low capacity of fish, particularly carnivorous species, to effectively regulate glycolysis and gluconeogenesis has been suggested to be an important cause for the limited glucose utilisation(Reference Enes, Panserat and Kaushik54). In the present study, the increase in dietary carbohydrate slightly increased the expression of glycolysis-related genes such as gk and pfkl but did not depress the expression of gluconeogenesis-related genes including pepck, fbp1 and g6pc, as described in some previous studies(Reference Li, Li and Zhang4,Reference Panserat, Médale and Brèque55–Reference Panserat, Plagnes-Juan and Kaushik57) . Additionally, the expression of genes, such as ir, pi3kr1 and akt1, involved in the insulin pathway was not induced by increased dietary carbohydrate, and this partly indicated that this dietary carbohydrate content exceeds the glucose-tolerant capacity and impair insulin sensitivity. In mammals, the SIRT1 is considered as a potential molecular target for curing type 2 diabetes due to its role in improving insulin sensitivity(Reference Sun, Zhang and Ge15–Reference Yoshizaki, Milne and Imamura17). In the present study, the expression of sirt1 was significantly decreased with the increase in dietary carbohydrate, while the inclusion of RSV from 0·0 to 0·10 % produced an L-shaped increased expression of sirt1. The up-regulation of sirt1 expression was also observed in blunt snout bream with the inclusion of RSV(Reference Shi, Xu and Liu31). Meanwhile, the expression of pi3kr1 and akt1 was also remarkably up-regulated with the supplementation of RSV, with similar results in mammals(Reference Chi, Chen and Chi23–Reference Wang, Li and Xu25), and this confirmed the role of RSV in the activation of insulin pathway at least at the transcriptional level. SIRT1 was proved to promote the secretion of insulin in mice(Reference Moynihan, Grimm and Plueger58), and this may indicate that the activation of insulin pathway, with the inclusion of RSV, was mediated by SIRT1. The insulin pathway, in mammals, is involved in maintaining glucose homoeostasis through the stimulation of glycolysis and the depression of gluconeogenesis(Reference Saltiel and Kahn12,Reference Titchenell, Lazar and Birnbaum13) . In the present study, RSV inclusion significantly promoted the expression of glycolytic genes, gk and pfkl, which may partly relate to the activation of insulin pathway. The regulation of insulin pathway on gluconeogenesis was mediated by the transcription factor, Forkhead box O1 (FoxO1)(Reference Carter and Brunet59), in mammals, and the lack or suppression of FoxO1 was suggested to reduce the production of glucose(Reference Matsumoto, Pocai and Rossetti60,Reference Zhang, Li and Qi61) . In the present study, the increased foxo1 expression caused by dietary carbohydrate was significantly inhibited in an L-shaped manner with the inclusion of RSV, and meanwhile, the expression of gluconeogenic genes, pepck and g6pc, was significantly down-regulated following similar variation pattern with foxo1. Accordingly, the inclusion of RSV inhibited gluconeogenesis partly through regulation of insulin pathway-mediated FoxO1. However, negative correlation was not observed between the activation of insulin pathway and gluconeogenesis-related genes in some previous studies(Reference Li, Li and Zhang4,Reference Li, Sang and Wang14) , not consistently with the present study. The molecular mechanism for the regulation of RSV inclusion on gluconeogenesis should be further explored in this fish species. The increased glycolysis and decreased gluconeogenesis response to RSV inclusion may alleviate the hepatic glycogen deposition and lower the serum glucose content in the present study.
Impaired non-specific immunity caused by high dietary carbohydrate has been observed in some fish species, such as Black carp (Mylopharyngodon piceus)(Reference Wu, Ye and Gao62), Labeo rohita (Hamilton-Buchanan)(Reference Anand, Bhat and Varghese63), largemouth bass(Reference Lin, Shi and Mu10) and hybrid grouper (Epinephelus fuscoguttatus ♀ × E. lanceolatus ♂)(Reference Li, Wang and Li11). In the present study, high dietary carbohydrate significantly decreased the content of lysozyme, which was involved in mediating protection against pathogen infection(Reference Saurabh and Sahoo64). Consistently, lysozyme content was also significantly reduced with intake of high dietary carbohydrate in top-mouth culter (Erythroculter ilishaeformis)(Reference Liu, Xie and Ge65), golden pompano (Trachinotus ovatus)(Reference Zhou, Ge and Lin66) and Black carp(Reference Wu, Ye and Gao62). Complement is also an important component of the innate immune system with the function to kill pathogens, and most complements are mainly produced in liver(Reference Holland and Lambris67). Previous study in mice found that the aggravation of hepatic inflammation significantly increased the content of C3 and C4 complements(Reference Jin, Yan and Xiao68), and meanwhile, the expression of complement C3 was significantly elevated in necrotic liver sites of grass carp (Ctenopharyngodon idella)(Reference Meng, Shen and Wang69). Therefore, the high-dietary-carbohydrate-induced increased complements C4 also indicated the impaired non-specific immunity of largemouth bass. The inclusion of RSV significantly elevated hepatic lysozyme content and decreased complements C4 content in an L-shaped manner in the present study, indicating the benefit role of RSV in improving non-specific immunity. Besides the above humoral parameters, inflammation is a key element in the response of the innate immune system to a variety of challenges(Reference Han and Ulevitch70). In the present study, the expression of pro-inflammatory cytokines, tnf-α, was significantly up-regulated in fish fed high dietary carbohydrate. Meanwhile, the inclusion of RSV significantly decreased the expression of pro-inflammatory cytokines, tnf-α and il−1β, and this partly indicated that the inflammation caused by high dietary carbohydrate was alleviated with the inclusion of RSV. In mammals, the expression of pro-inflammatory cytokines is mainly mediated by NF-κB(Reference Pahl71). However, the expression of rela, a regulator subunit of NF-κB, was not changed in all treatments. SIRT1 physically interacts with the RelA subunit of NF-κB and inhibits transcription by deacetylating RelA(Reference Yeung, Hoberg and Ramsey72), and this may partly account for the not changed transcription of rela in the present study. It is well known that anti-inflammatory cytokines, such as IL-10 and TGF-β, possess positive effects in inhibiting inflammatory response, and the increased expression of il-10 and tgf-β gene expression are related to the alleviation of inflammatory response(Reference Krishnamurthy, Rajasingh and Lambers73,Reference Santana, Saxena and Noble74) . The opposite relationship between expression of pro-inflammatory cytokines and anti-inflammatory cytokines has been commonly observed in some fish species, such as blunt snout bream(Reference Yu, Liang and Ren75) and grass carp(Reference Wen, Feng and Jiang76). Accordingly, the up-regulated regulation of il-10 and tgf-β, in the present study, confirmed the reduced inflammatory response in fish fed the diet with RSV.
Specifically, the present study suggests that RSV inclusion in diets for largemouth bass alleviated the high-dietary-carbohydrate-induced hepatic glycogen accumulation and post-prandial hyperglycemia. The reason, it was suggested, was that the RSV inclusion promoted glycolysis and inhibited gluconeogenesis with the activation of insulin pathway. In addition, high-dietary-carbohydrate-induced immune response was attenuated with the inclusion of RSV.
Acknowledgement
The authors are grateful to Yan Huang and Min Dai for their contribution in the investigation through the experiments.
Financial support
This work was financially supported by ‘Chenguang program’ supported by Shanghai Education Development Foundation and Shanghai Municipal Education Commission (19CG56), China Agriculture Research System (CARS-46), National Natural Science Foundation of China (31802308), and Shanghai Talent Development Fund (No. 2 019 097).
Authorship
N. C. and S. L. designed the research; Y. L. and S. L. conducted the experiment and analysed the data; N. L., A. W. and S. Y. provided assistance on the chemical analysis; and Y. L. and S. L. wrote the paper.
Conflict of interests
The authors declare that there are no conflicts of interest.


