Human donor milk (HDM) is widely recommended for preterm babies when mother’s own milk (MOM) is unavailable(1–3) though clinical trials to date have failed to show benefit on neurodevelopment and other outcomes(Reference Quigley, Embleton and McGuire4–Reference Modi7). Although rapidly increasing(Reference Perrine and Scanlon8,Reference Parker, Barrero-Castillero and Corwin9) , use of HDM remains highly variable(Reference Hagadorn, Brownell and Lussier10,Reference Battersby, Marciano Alves Mousinho and Longford11) . Surveys of clinician practice suggest reduction of necrotising enterocolitis as the most important reason for feeding preterm babies HDM(Reference Hagadorn, Brownell and Lussier10) with initiation of HDM preferred over preterm formula to supplement MOM for those at high risk, such as growth restricted or extremely preterm babies(Reference Mills and Modi12). The optimal growth of preterm babies, especially for those born small for gestational age (SGA), remains to be fully described: observational, but limited interventional study data associate rapid or excessive postnatal catch up growth with long-term metabolic consequences, while postnatal growth restriction predicts adverse neurodevelopment(Reference Ong, Kennedy and Castaneda-Gutierrez13). Meta-analysis of trial data has shown lower rates of neonatal unit or short-term growth in preterm babies fed unfortified or fortified HDM compared with formula, but no difference in long-term growth in the two trials which assessed this(Reference Quigley, Embleton and McGuire4). Observational data have shown a dose–response decrease in short-term growth with increasing proportions of fortified HDM(Reference Brownell, Matson and Smith14,Reference Colaizy, Carlson and Saftlas15) . However, results have been inconsistent with a recent randomised trial of fortified HDM, demonstrating no negative impact on short-term growth(Reference O’Connor, Gibbins and Kiss5), and in a recent retrospective analysis comparing very low birth weight infants receiving MOM supplemented with fortified HDM with that with preterm formula, proportion of HDM was not associated with short- or long-term growth(Reference Hoban, Schoeny and Esquerra-Zwiers16). These inconsistencies may be related to different practices of fortification, which include the addition of protein supplement to standard multicomponent fortification(Reference Hoban, Schoeny and Esquerra-Zwiers16). Furthermore, lower birth weight adjusted for gestational age or z score at birth, and necrotising enterocolitis both independently predict lower z scores at discharge(Reference Griffin, Tancredi and Bertino17), and concerns persist regarding postnatal growth restriction attributed in part to protein content variability of human milk(Reference Hay and Ziegler18). Better understanding of this variation can potentially help limit this ‘growth failure’ seen in these babies.
A key challenge to this understanding is the relative variation attributed to between-subject differences (random effects) and that to within-subject differences (fixed effects), such as lactation stage. Nevertheless, accurate reference ranges of macronutrient content of preterm MOM over lactation stage have recently been described(Reference Mimouni, Lubetzky and Yochpaz19–Reference Gidrewicz and Fenton21), and a recent systematic review of studies analysing 24-h collections of MOM shows clear differences in macronutrient content between MOM of term and preterm infants(Reference Gidrewicz and Fenton21). Translation to HDM macronutrient content is however limited as donations typically represent surplus volumes of expressed milk after feeding, rather than 24-h collections. Furthermore, handling of human milk typical in the donation process, in particular frozen storage, is known to affect macronutrient content(Reference García-Lara, Vieco and De la Cruz-Bértolo22,Reference Lev, Ovental and Mandel23) . Available studies of HDM suggest differences in macronutrient content compared with that of MOM of both preterm and term babies, but limited information exists on how this variation is dependent on donor mother–infant characteristics, in particular the gestational age of the infant, and the birth weight z score. The Northwest Human Milk Bank (NWHMB) has a relatively high number of mothers of preterm babies donating their milk (18 % of all mothers contributing to 36 % of all samples 2011–2017). Controlling for random effects of mother–infant pairs, a multilevel model analysis of macronutrient content of milk donated to the NWHMB over 7 years is provided, examining the influence of maternal age, parity, lactation stage, volume of milk donated, infant sex, gestational age and birth weight z score.
Methods
The milk bank and donor mother–infant characteristics
The NWHMB is the regional milk bank for the northwest of England and Wales, with about 250 donors providing about 2500 l of milk a year. Donors can donate until their baby is 9 months old, and there is no limitation to the volume of milk delivered to the milk bank at any one time. From 2011 to 2017, the following baseline characteristics were routinely recorded for all mothers at registration to the milk bank: maternal date of birth, parity, date of birth, sex, gestation and birth weight of the infant of the donor mother.
Milk samples and stage of lactation
For all milk expressions for donation to the NWHMB, mothers date each bottle expressed and store the milk in their freezer, either straight away or after a maximum period of 24 h in their refrigerator. The frozen milk is collected from individual donors at regular 1–3 monthly intervals, pooled and pasteurised up to a maximum of 3 months after arrival to the milk bank. The date of the first day the milk is expressed for donation, the overall volume of milk expressed and the date the milk is pasteurised are routinely recorded in the database. From 2011 to 2014, the number of days from start of expression to day of milk collection was also recorded. The monthly lactation stage estimate (LSEm) was the postpartum month (or 30-d time interval) number. This time period was calculated using the number of days between the date of the first day of expression for donation and the date of milk collection. Milk was categorised into LSEm if this time period was less than or equal to 44 d or under 1·5 months. If this time period overlapped one postpartum month to the next, the milk was assigned the month number with the majority of the time period. The daily milk volume in litres expressed for donation (Vd) was calculated by dividing the total volume of milk collected from a mother by the number of days between start of expression and collection. There was one complete freeze–thaw cycle of the milk before pasteurisation. There was a small degree of thaw on transportation of the milk to the NWHMB, of about 1°C per h. On arrival to the NWHMB, milk was stored frozen at below –18°C. It was then defrosted in a refrigerator (5–8°C) and processed within 24 h of full defrost. Each batch of milk is decanted into stainless steel jugs, whisked and sieved as part of a thorough mixing regimen, and a sample is taken from the mixed batch. The sample is stored in the refrigerator until 30 min before analysis when it is warmed to 40°C and homogenised.
Milk analysis
At the NWHMB, all milk samples are analysed before pasteurisation for crude protein, fat and carbohydrate content and calculated energy content using the ‘MIRIS’ mid-IR spectroscopy human milk analyser (HMA). The MIRIS HMA has specific waveband filters for the major milk components and measures at four different wavebands within the mid-IR spectrum. The wavebands used are specific for the functional carbonyl groups (5·7 µm) for fat determination, amide groups (6·5 µm) for crude and true protein determination and hydroxyl groups (9·6 µm) for carbohydrate determination. Values are presented as g/100 ml of milk, and calculated total solids (g/100 ml milk) and energy (kcal/100 ml milk) are also presented. The HMA software processes the transmission data via an internal calibration made according to ISO 9622 using approved biochemical reference methods: Röse-Gottlieb for fat (ISO 1211) and Kjeldahl (nitrogen × 6·38) for crude protein (ISO 8968-1). The reference values for total carbohydrate content are obtained from reference analysis of dried total solids after subtracting reference fat, crude protein and a 0·2 g/100 ml mineral constant (drying oven ISO 6731). True protein represents the protein values in this analysis by applying a factor of 0·8 to the measured crude protein which contains non-protein nitrogen.
Several investigators have evaluated the MIRIS HMA, with variable and conflicting results in precision and accuracy compared with reference biochemical macronutrient determination techniques(Reference Giuffrida, Austin and Cuany24–Reference Menjo, Mizuno and Murase29). Many studies have demonstrated good precision with the MIRIS HMA in fat and protein but not in lactose determination(Reference Zhu, Yang and Ren25,Reference Fusch, Rochow and Choi26,Reference Silvestre, Fraga and Gormaz28) ; this may be due to the presence of oligosaccharides in significant numbers in human milk which cannot be differentiated from lactose by the IR technology(Reference Michaelsen, Pederson and Skafte30,Reference Fusch, Kwan and Kotrri31) . For this reason, values for carbohydrate content rather than lactose are presented here. Other reasons for the lack of consistency in studies evaluating the MIRIS HMA include discrepancies in the choice of chemical reference method for macronutrient measurement, the size and characteristic of the sample set and sample preparation before measurement(Reference Fusch, Kwan and Kotrri31). Differences in the model and software version of MIRIS HMA could also be a factor, as recently shown by Buffin et al.(Reference Buffin, Decullier and De Halleux32). In the present study, the same MIRIS HMA was used throughout the study period, with daily quality control using a check solution, and annual calibration by the manufacturer.
Birth weight z score
Birth weight standard deviation score or z score, adjusted for gestational age and sex, was calculated using lmsGrowth, a Microsoft Excel add-in written using Excel 2000 with Visual Basic for Applications, designed for use with the British 1990 growth reference based on the Lambda-mu-sigma method(Reference Pan and Cole33). In categorical analyses, SGA was defined as z score <–1·28 and appropriate for gestational age (AGE) as ≥–1·28.
Statistical analysis
Macronutrient content of HDM in relation to mother–infant characteristics for mothers donating over a 7-year period 2011–2017 was analysed using SPSS version 25 software. Since the dataset consisted of repeated-measures longitudinal data with unbalanced LSEm time points, the majority of mothers donating twice or less, an appropriate multilevel random intercepts model analysis was performed(Reference Cnaan, Laird and Slasor34,Reference Singer and Willett35) . Fixed coefficients included maternal age (years), parity (1 = primiparous; 0 = multiparous), infant sex (1 = male; 0 = female), gestation (decimal weeks), birth weight gestation and sex adjusted z score, Vd (litres), LSEm, both as a covariate variable (month no. 1–13) and a categorical variable, SGA status (SGA = 1; AGA = 0), preterm status (preterm = 1; term = 0), gestation z score factorial category (preterm SGA; preterm AGA; term SGA and term AGA) and gestation category (23–27 weeks, 28–32 weeks, 33–36 weeks, and term); mother–infant ID as the random intercept was used to assess between-subject effects. Models including fixed effects only, and fixed effects and random intercepts, with a variance component covariance structure, were sequentially assessed for overall fit using the χ 2 likelihood ratio test, with one parameter change from one model to the next, using a maximum likelihood estimation method. Significance was set at 0·05.
Results
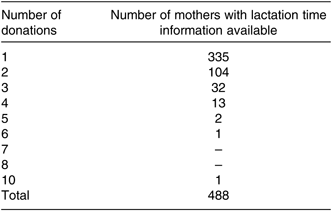
A total of 2966 samples from 1175 donor mother–infant pairs were analysed over the 7-year period. Mother–infant characteristics are shown in Table 1, and frequencies are shown in Figs. 1 and 2. Of the 1175 donors, 488 had information on start and end dates of expression, 335 of which donated once, 104 donated twice and forty-nine donated three or more times (see Table 2).
Table 1. Mother–infant characteristics
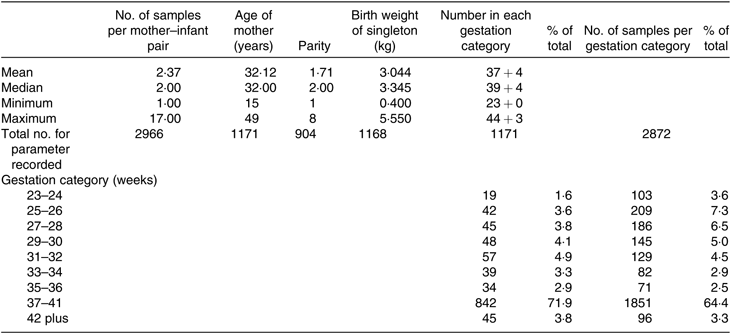
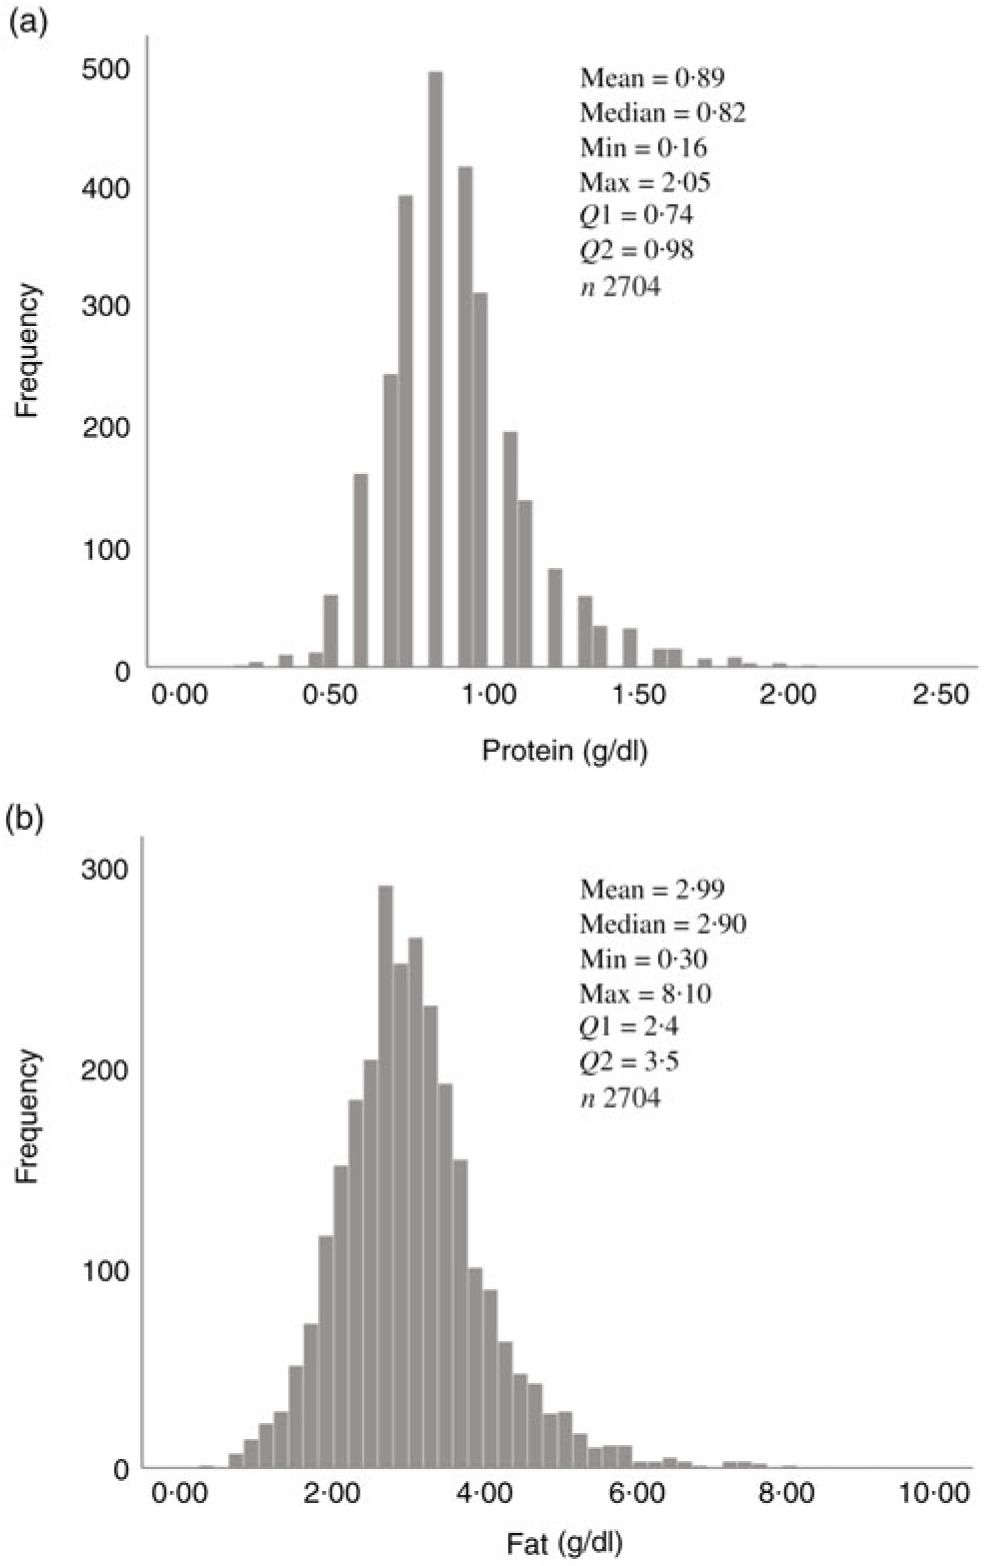
Fig. 1. Human donor milk mean macronutrient value frequencies for all samples: (a) protein (g/dl) and (b) fat (g/dl).
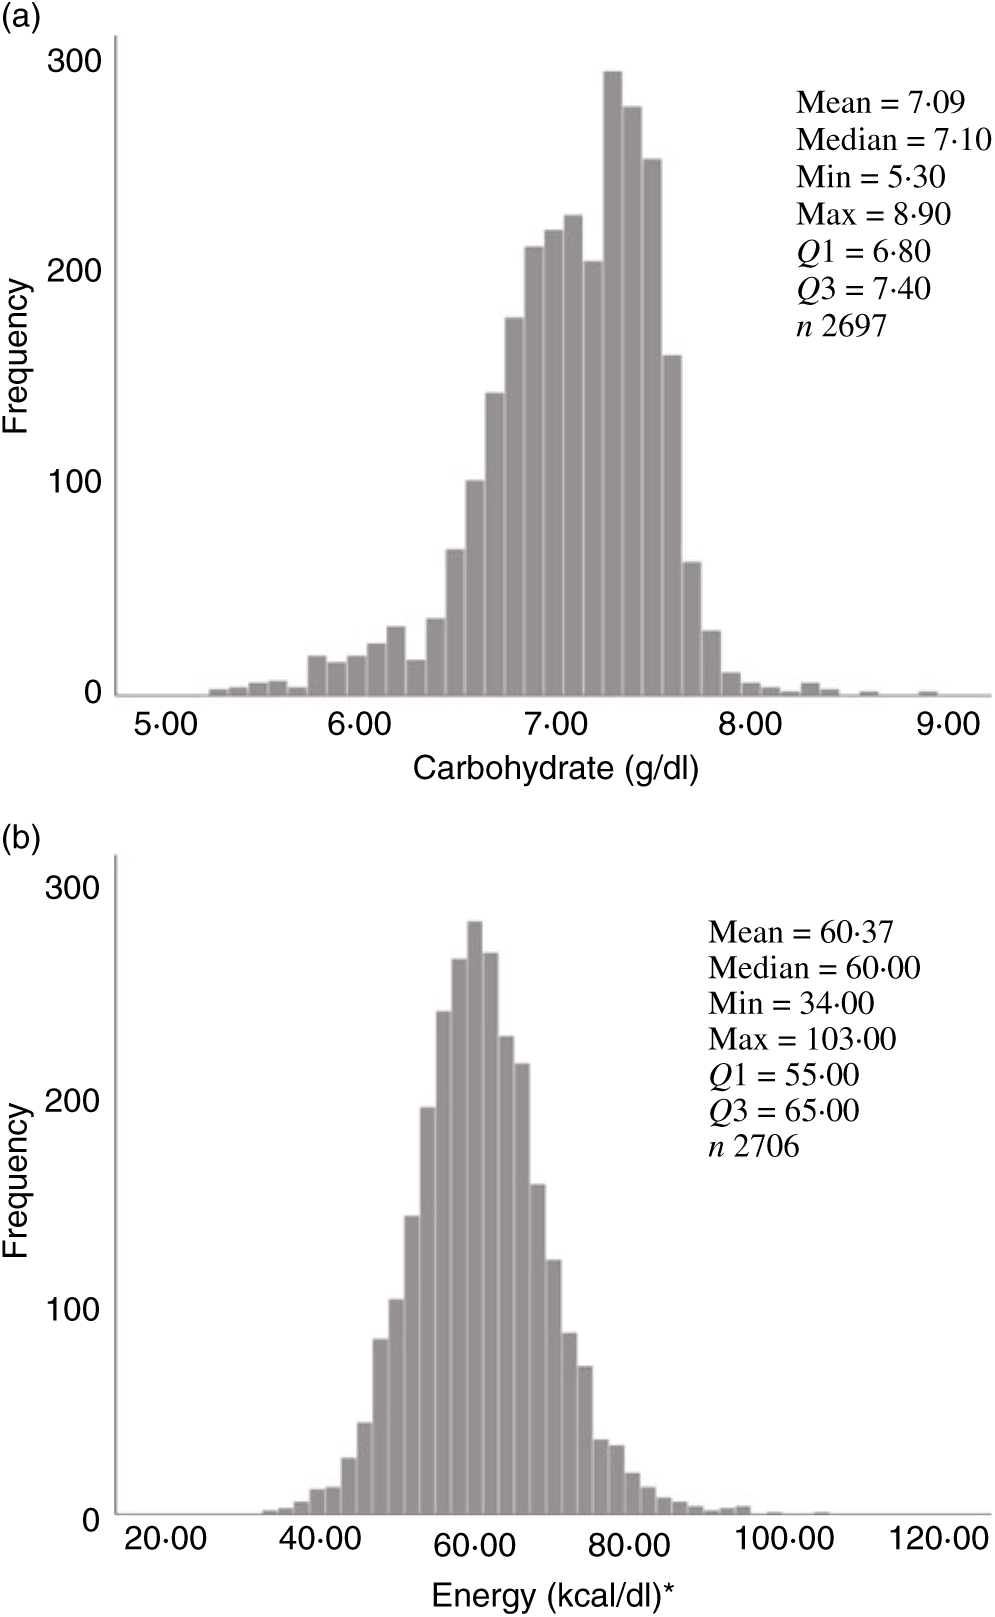
Fig. 2. Human donor milk mean frequencies for all samples: (a) carbohydrate (g/dl) and (b) energy (kcal/dl). * To convert kcal to kJ, multiply by 4·184.
Table 2. Number of milk donations analysed from each mother with lactation time information
Overall, mean protein concentration was 0·89 (SD 0·24) g/dl, fat 2·99 (SD 0·96) g/dl, carbohydrate 7·09 (SD 0·44) g/dl and energy 60·37 (SD 8·41) kcal/dl (252·59 (SD 35·19) kJ/dl). Mean protein, fat and energy content were significantly higher, and carbohydrate content significantly lower, in milk from mothers of preterm babies compared with that of term babies (see Table 3). Mean protein, fat and energy content were also significantly higher in milk from mothers of SGA babies compared with that of AGA babies (see Table 4).
Table 3. Human donor milk macronutrient and energy values from milk of mothers of term and preterm babies, with birth weight z scores
(Mean values and standard deviations; medians and interquartile ranges (IQR); numbers of samples; coefficients of variation)
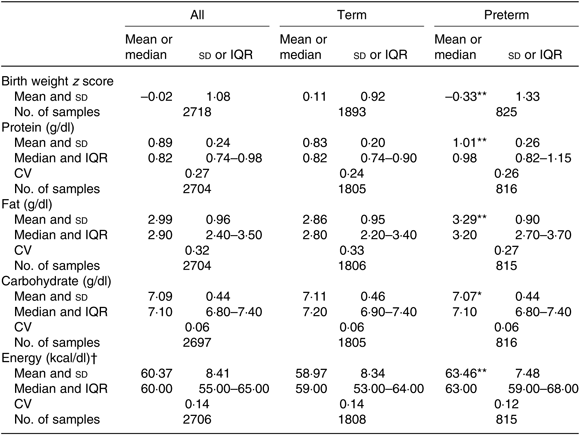
Mean value was significantly different from that of the term babies: * P < 0·05, ** P < 0·001 (independent-samples t test).
† To convert kcal to kJ, multiply by 4·184.
Table 4. Human donor milk macronutrient and energy values from milk of mothers of small for gestational age (SGA) and appropriate for gestational age (AGA) babies, with birth weight z scores
(Mean values and standard deviations; medians and interquartile ranges (IQR); numbers of samples; coefficients of variation)
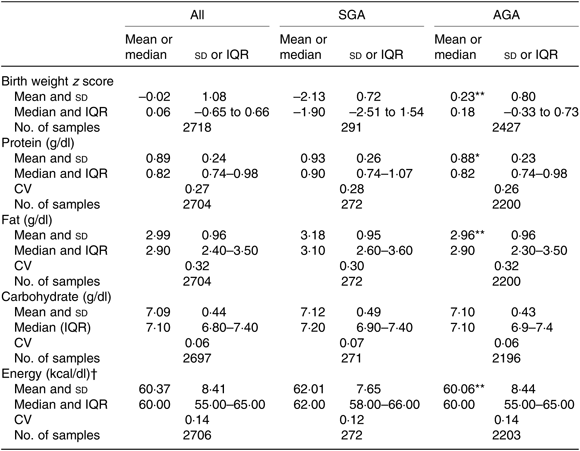
Mean value was significantly different from that of the SGA babies: * P < 0·05, ** P < 0·001 (independent-samples t test).
† To convert kcal to kJ, multiply by 4·184.
Table 5. Summary of estimates for macronutrient and energy mother–infant pair random intercept models with gestation and small for gestational age (SGA) status as factorial predictors
(b-Coefficients with their standard errors and 95 % confidence intervals)

Vd, daily volume of milk expressed; AGA, appropriate for gestational age.
* P < 0·05, ** P < 0·01, *** P < 0·001.
† Group estimates relative to reference term AGA group.
Multilevel models
In the best-fitting fixed-effects-only models, LSEm significantly predicted lower macronutrient and energy content. Gestational age and birth weight z score also significantly predicted lower protein, fat and energy and higher carbohydrate content. Vd was a significant predictor of higher carbohydrate content but did not significantly predict protein, fat or energy. With the exception of male sex significantly predicting higher protein content, infant sex, maternal age and parity did not significantly improve the overall fit of the macronutrient and energy content models (see online Supplementary Table S1(a)–(d)).
To assess between-subject or random effects, mother–infant pair ID random intercept multilevel models were then performed. The relationship between fixed predictors and macronutrient and energy content showed significant variance in intercepts across mother–infant pairs: protein, Var(u 0j) = 0·04, χ 2(1) = 149·16, P < 0·001; fat, Var(u 0j) = 1·11, χ 2(1) = 133·45, P < 0·001; energy, Var(u 0j) = 67·85, χ 2(1) = 100·48, P < 0·001; carbohydrate, Var(u 0j) = 0·09, χ 2(1) = 99·86, P < 0·001.
Controlling for these random effects, remaining significant fixed effects included LSEm predicting lower protein, fat and energy and gestational age predicting lower protein, fat and energy. Birth weight z score significantly predicted lower protein content, while Vd significantly predicted higher carbohydrate content. In the best-fitting models, LSEm remained as a non-significant predictor of higher carbohydrate, while birth weight z score was a non-significant negative predictor for fat and energy content (see online Supplementary Table S1(a)–(d)).
Using LSEm as a categorical variable, multilevel model mean predicted values of macronutrient and energy content were plotted against the first 10 months LSEm for a 39-week pregnancy, with infant birth weight z score = 0 and daily volume of milk expressed of 100 ml. Protein content was highest in the first month of lactation, with a steady decline in the first 7 months of lactation as seen in Fig. 3(a), before a slight rise from months 7–10. Similarly, fat and energy content gradually decreased in the first 7 months of lactation, before gradually rising from months 7–10. (Figs. 3(b) and 4(b)); carbohydrate content remained relatively consistent throughout lactation with a slight fall in months 9–10 (see Fig. 4(a)).
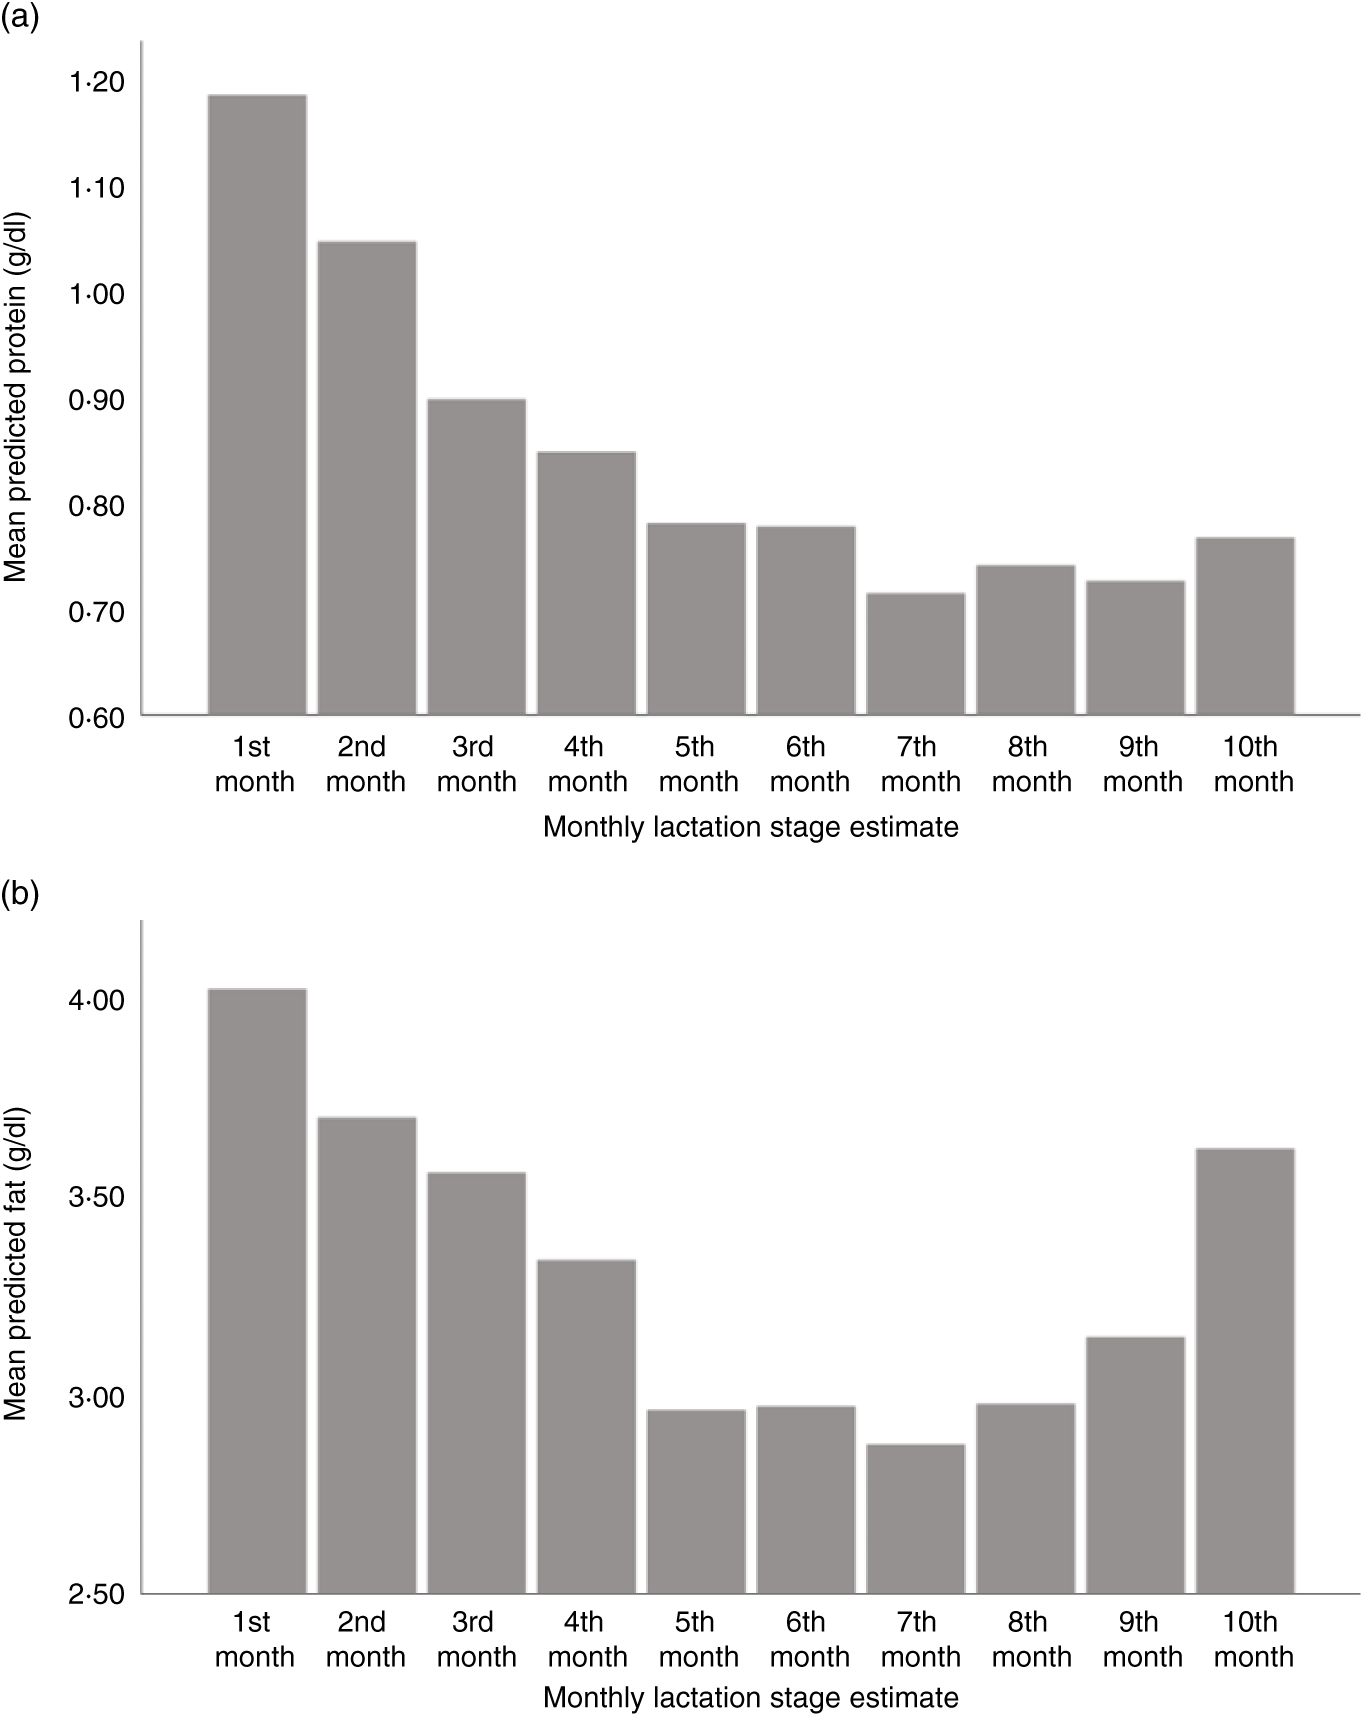
Fig. 3. Predicted human donor milk mean macronutrient value for each monthly lactation stage estimate: (a) protein (g/dl) and (b) fat (g/dl).
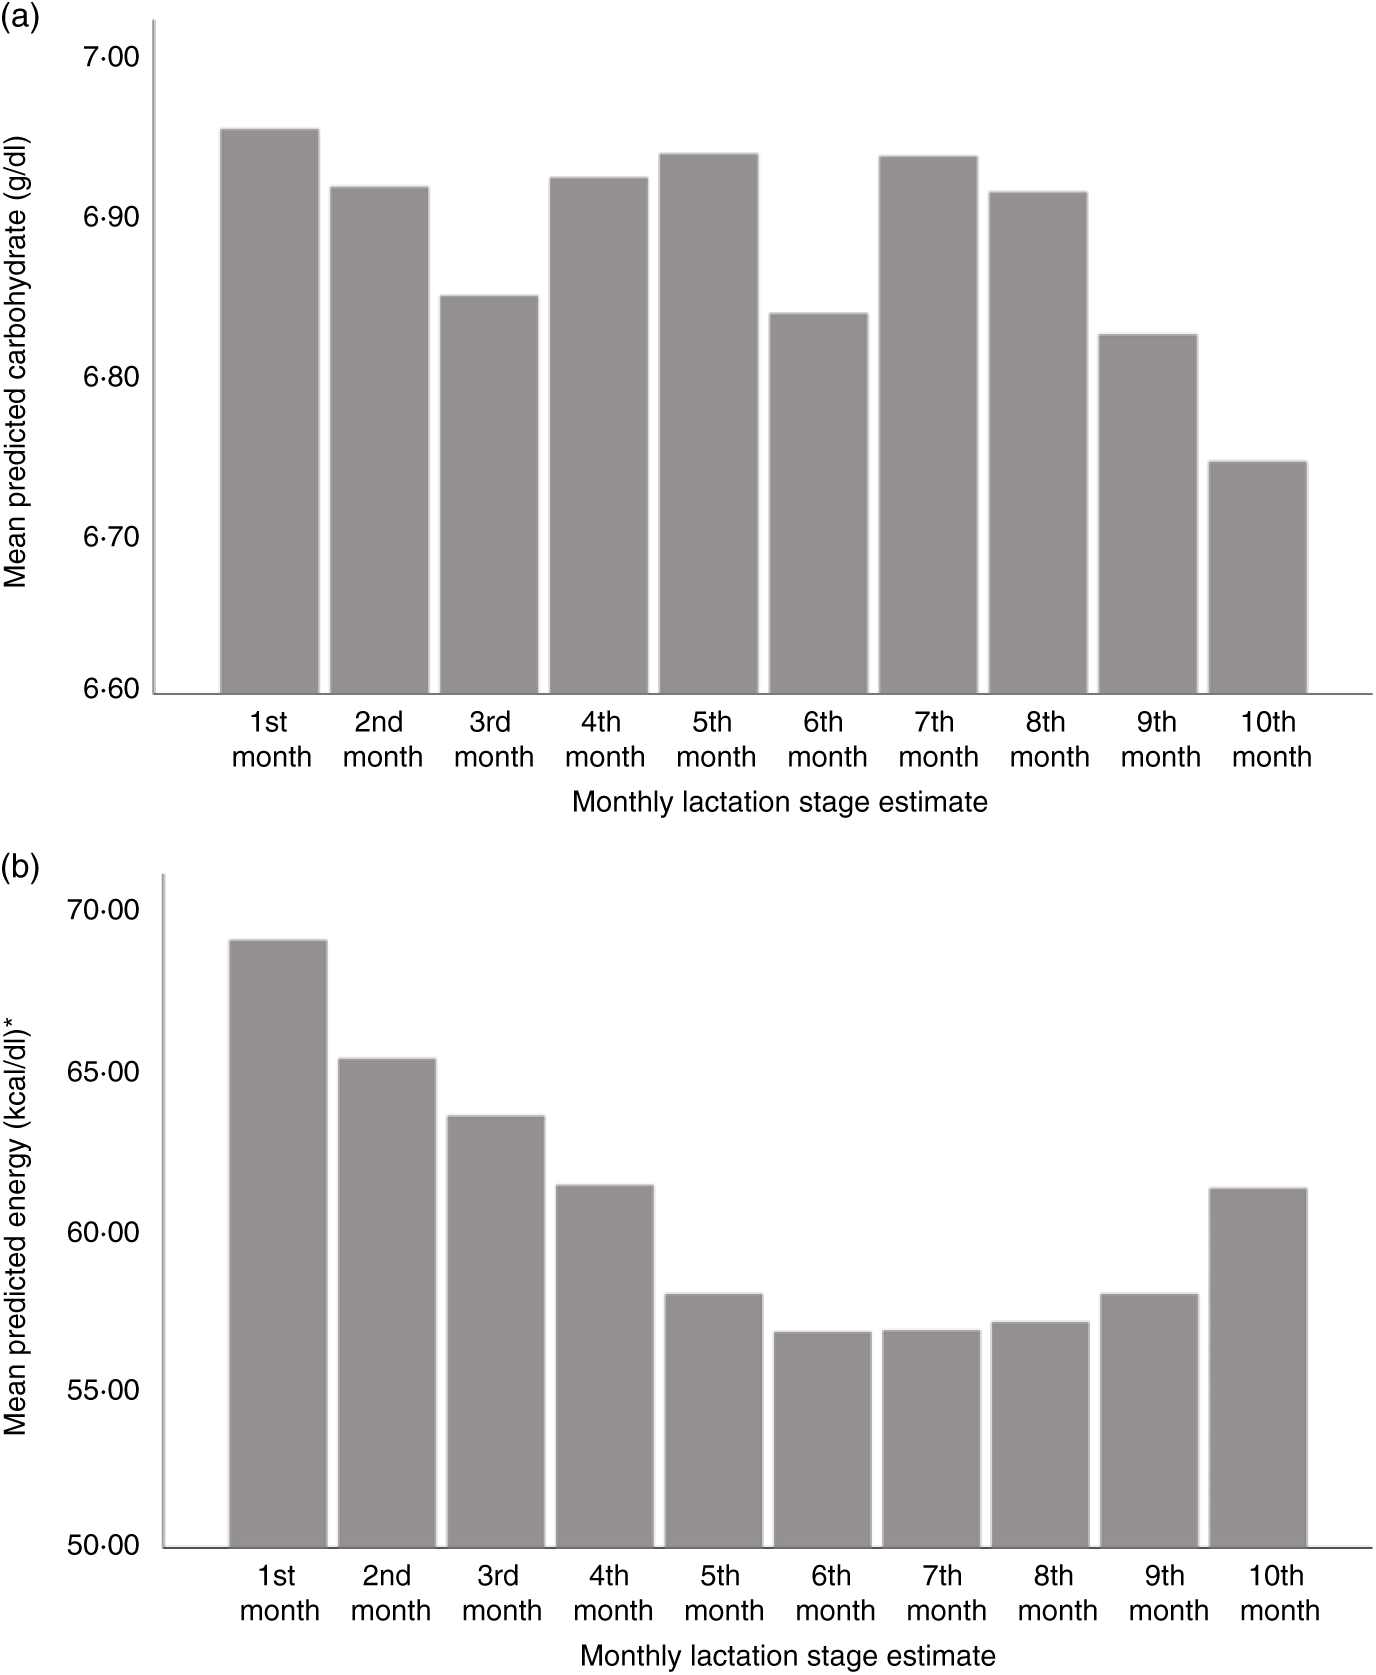
Fig. 4. Predicted human donor milk mean macronutrient and energy value for each monthly lactation stage estimate: (a) carbohydrate (g/dl) and (b) energy (kcal/dl). * To convert kcal to kJ, multiply by 4·184.
Macronutrient and energy content and preterm v. term monthly lactation analysis
To assess differences between preterm and term milk, each LSEm was analysed using t test. There were only minor differences all within 0·2 g/dl, between milk from mothers delivering preterm and term, with significantly higher mean protein in preterm milk than term milk in month 7 (preterm: 0·82 (SD 0·15) g/dl v. term: 0·69 (SD 0·15) g/dl, t(51) = 2·32, P < 0·05) and month 8 only (preterm: 0·86 (SD 0·12) g/dl v. term: 0·70 (SD 0·18) g/dl, t(29) = 2·30, P < 0·05). Mean fat and energy content were significantly higher in the third month of lactation only for preterm babies compared with term babies (fat preterm: 3·59 (SD 1·13) g/dl v. fat term: 2·82 (SD 1·11) g/dl, t(52) = 2·53, P < 0·05; energy preterm: 63·08 (SD 8·90) kcal/dl (263·93 (SD 37·24) kJ/dl) v. energy term: 56·89 (SD 10·32) kcal/dl (238·03 (SD 43·18) kJ/dl), t(52) = 2·35, P < 0·05). For carbohydrate content, there were no significant differences for any monthly lactation groups between preterm and term babies.
Macronutrient and energy content in relation to preterm and small-for-gestational-age status
To investigate the effect of gestation and birth weight z score further, preterm and term SGA and AGA groups were included as fixed factorial covariates in a mother–infant pair ID random intercept model for macronutrient and energy content controlling for the fixed effects of LSEm and also Vd for carbohydrate content (see Table 5).
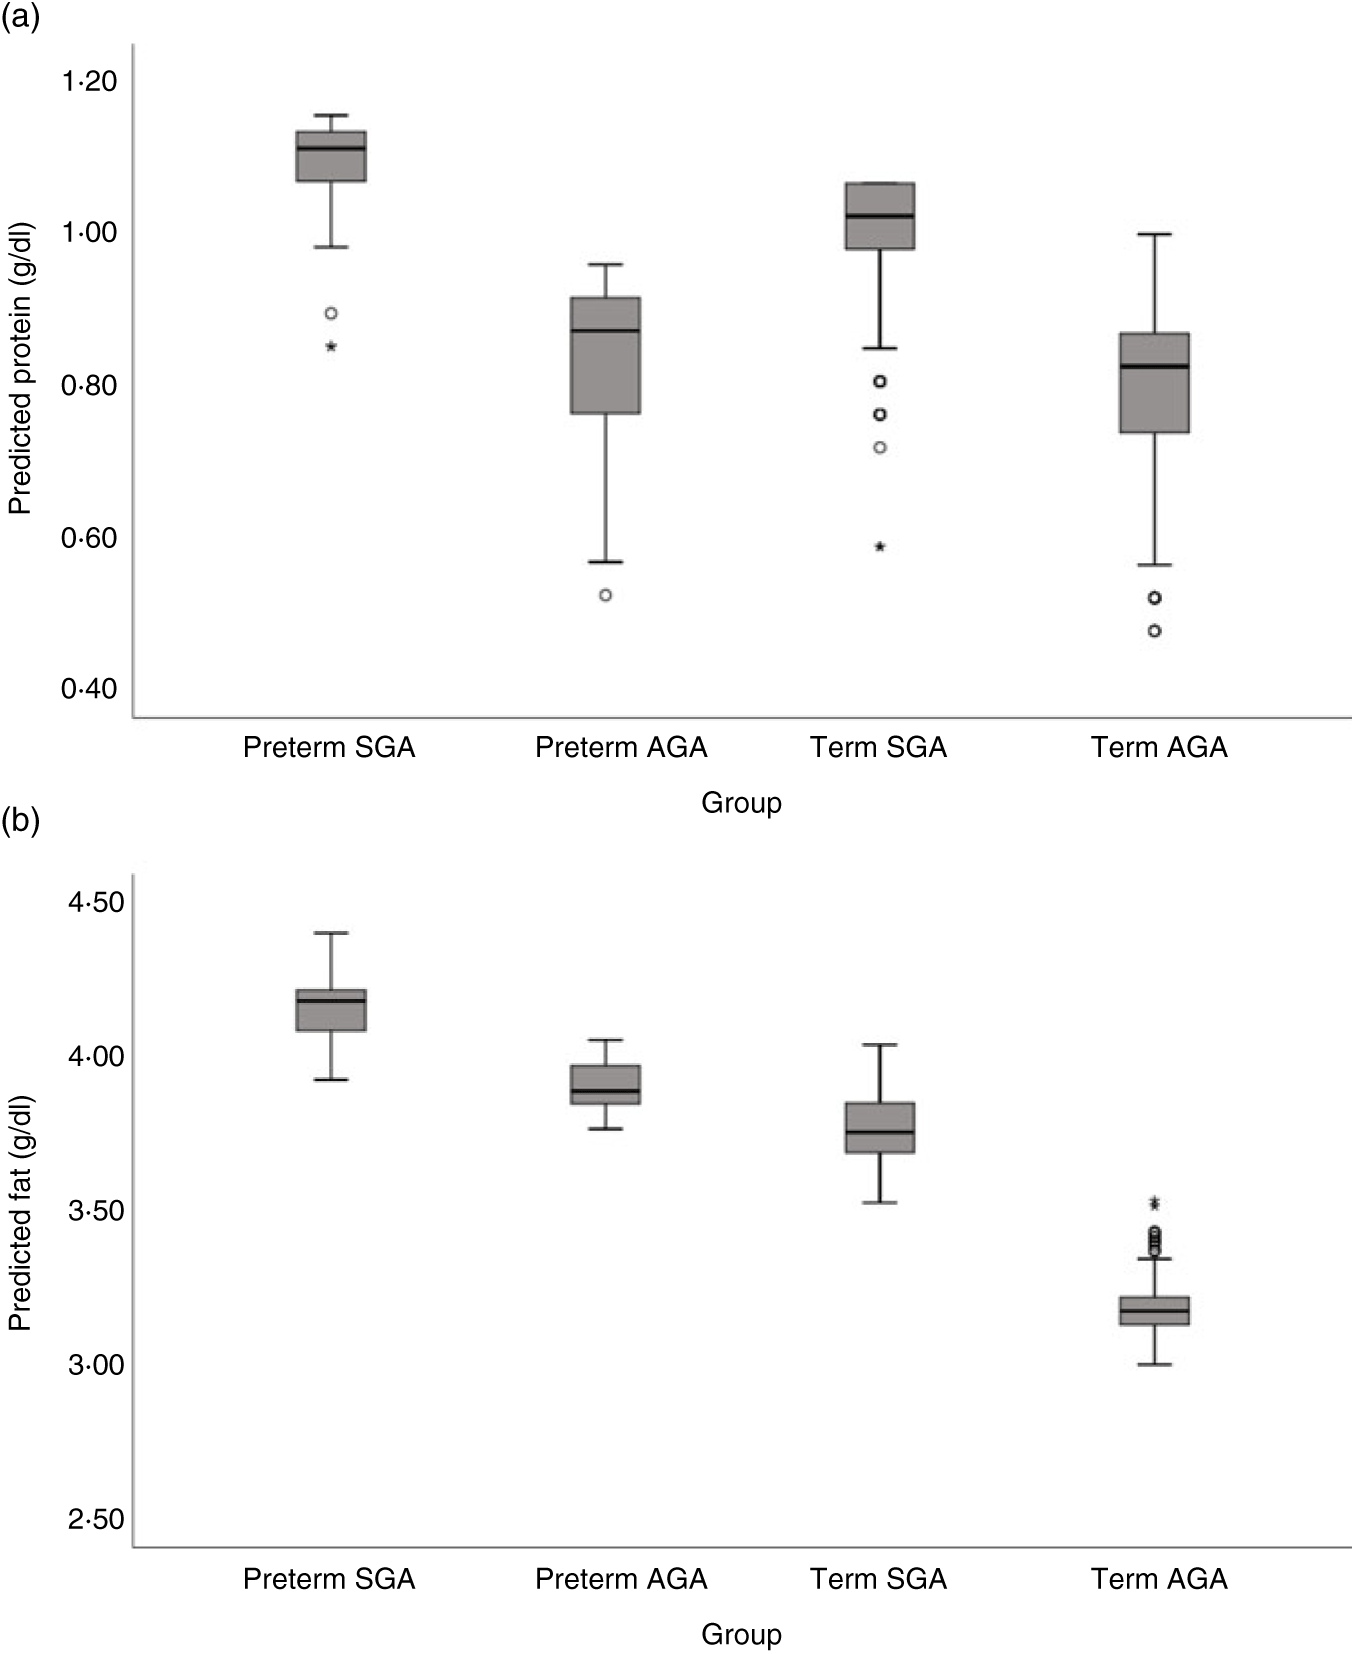
Milk from mothers of preterm and term SGA babies had significantly higher protein content than that from mothers of term AGA babies, with the biggest differences seen between preterm SGA and term AGA groups (mean difference 0·16g/dl higher in preterm SGA group). On the other hand, there was no significant difference in protein content between preterm AGA and term AGA groups. Recoding preterm SGA and then preterm AGA group as the reference group in the analyses revealed no other significant differences between groups (see Fig. 5(a)).
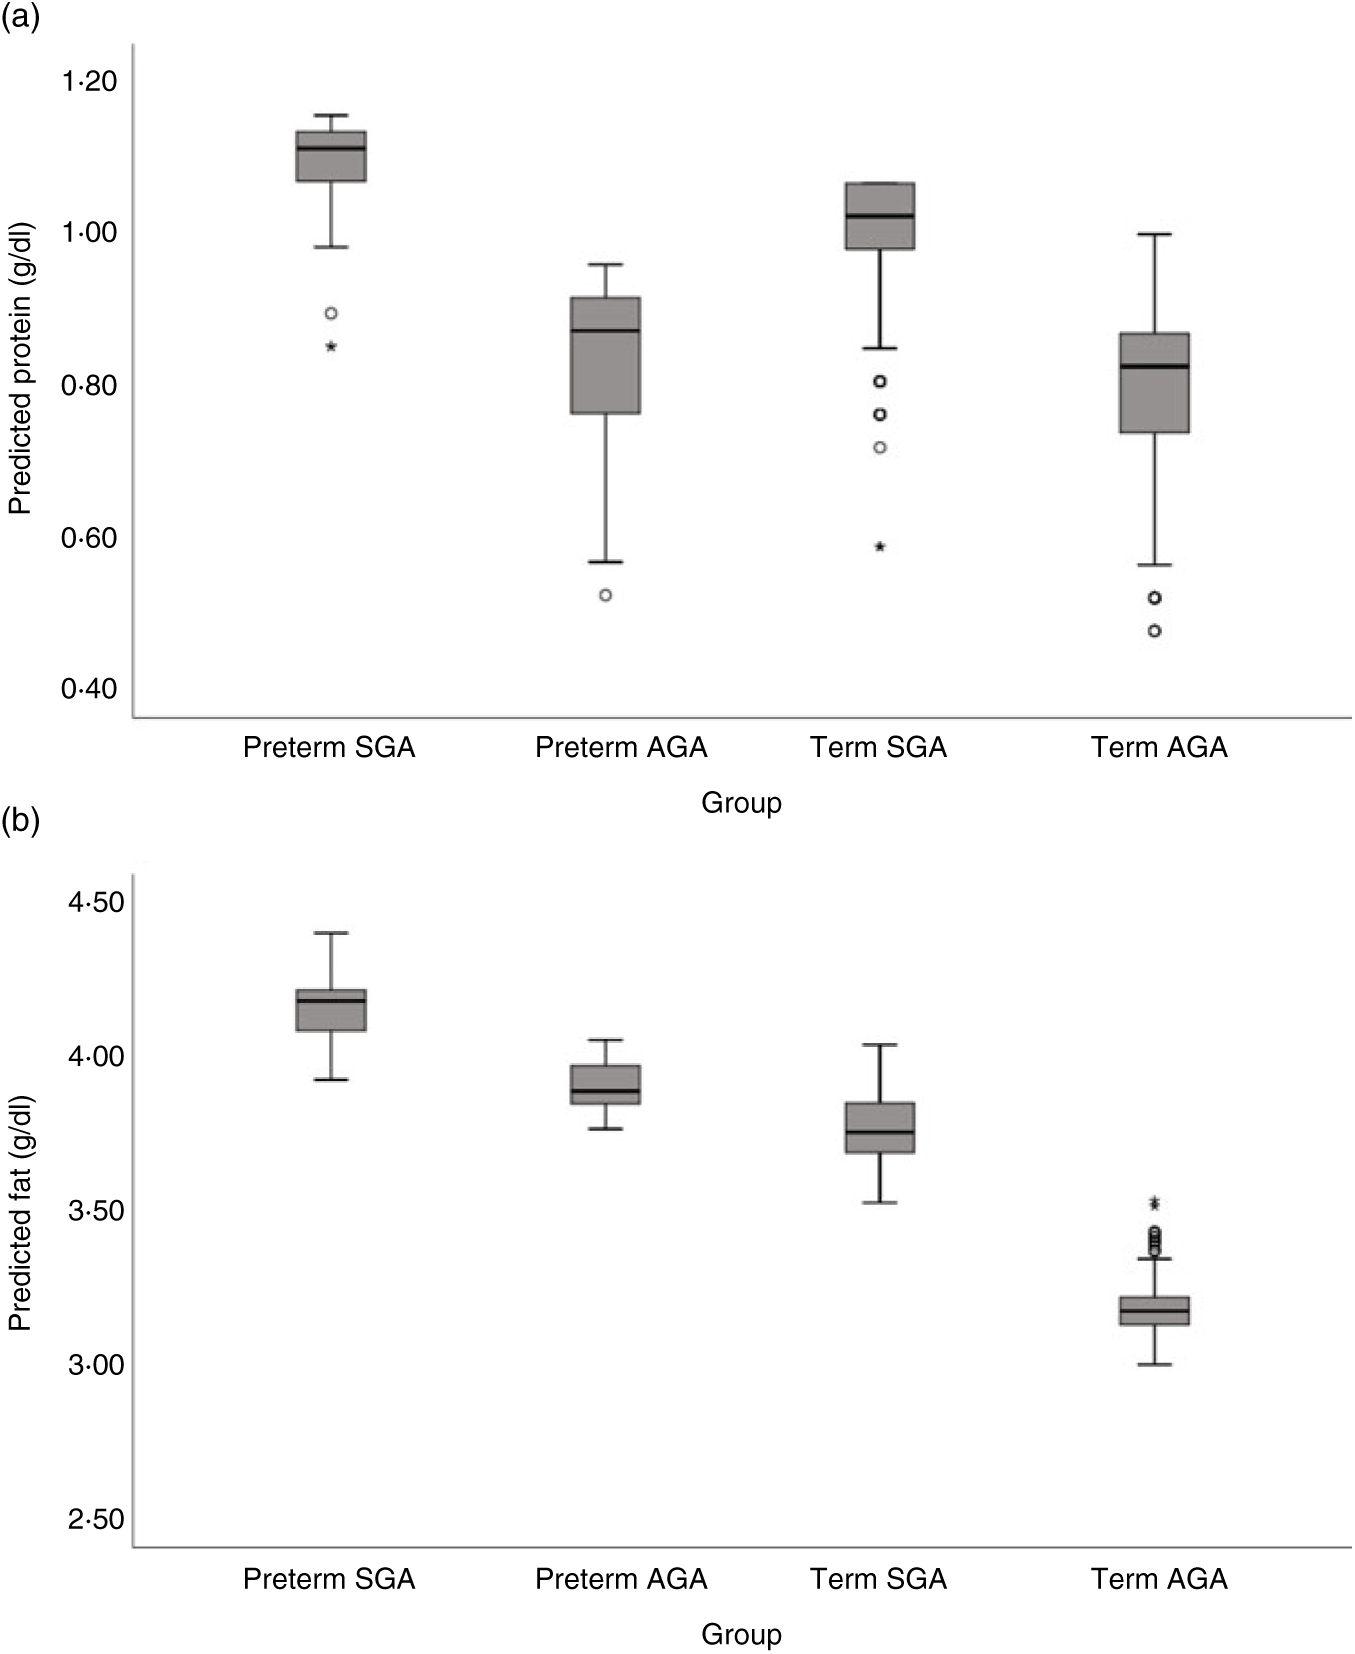
Fig. 5. Predicted human donor milk macronutrient box plot values for preterm small for gestational age (SGA), term SGA, preterm appropriate for age (AGA) and term AGA babies: (a) protein (g/dl) and (b) fat (g/dl).
Milk from mothers of preterm SGA, preterm AGA and term SGA babies each had significantly higher fat and energy content than that from mothers of term AGA babies, with the biggest differences seen between preterm SGA and term AGA groups (fat mean difference 0·82 g/dl and energy 7·14 kcal/dl (29·87 kJ/dl) higher in preterm SGA group). Recoding preterm SGA and then preterm AGA as the reference group in the analyses revealed no other significant differences between groups (see Figs. 5(b) and 6(b)).
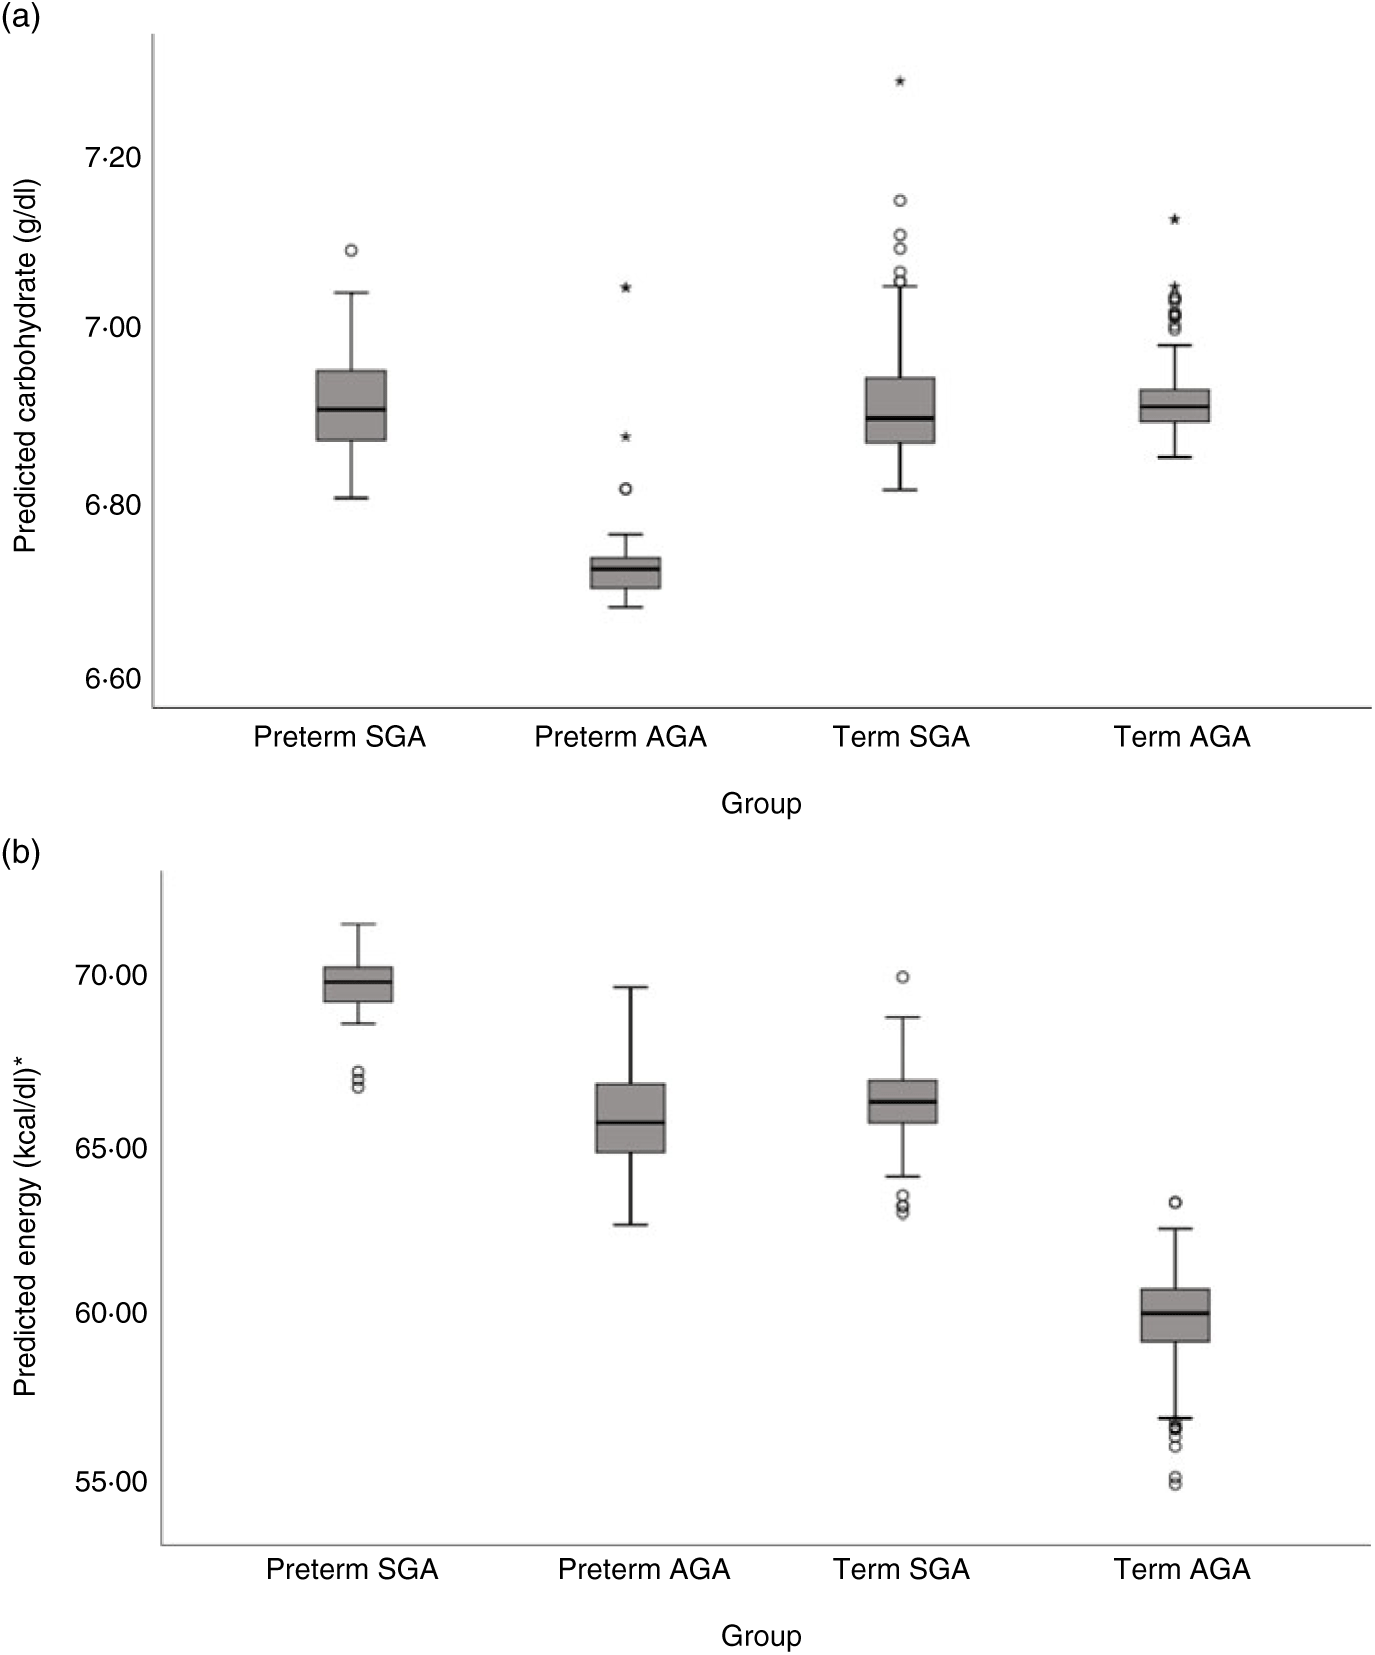
Fig. 6. Predicted human donor milk macronutrient box plot values for preterm small for gestational age (SGA), term SGA, preterm appropriate for age (AGA) and term AGA babies: (a) carbohydrate (g/dl) and (b) energy (kcal/dl). * To convert kcal to kJ, multiply by 4·184.
Milk from mothers of term SGA babies and preterm AGA babies had significantly lower carbohydrate content than that from mothers of term AGA babies, with the biggest differences between preterm AGA and term AGA babies (mean difference 0·24 g/dl higher in term AGA group). Recoding preterm SGA and then preterm AGA as the reference groups in the analyses revealed no other significant differences between groups (see Fig. 6(a)).
Degree of prematurity and macronutrient and energy content
Separate multilevel mother–infant pair ID random intercept models were also constructed to assess the influence of degree of prematurity with macronutrient content, using the gestation categories 23–27 weeks, 33–36 weeks, term and a reference 28–32 weeks as a factorial covariate in the model (see Table 6). To assess differences between the gestational groups, this factorial covariate was recoded with both the 23–27 week and term groups as the reference category. Controlling for the fixed effects of LSEm, birth weight z score, Vd and between-subject effects in the relationship of macronutrient content with LSEm, the following was found: for protein, the term group was significantly lower than the 28- to 32-week group and the 33- to 36-week group, but there were no significant differences between any of the other groups. For carbohydrate, the term group was significantly higher than the 28- to 32-week group. There were no significant differences between any other groups. For fat and energy, although there was a sequential decrease in values across groups up from 23 to 27 weeks to term, these differences did not reach significance between any of the groups.
Table 6. Summary of estimates for macronutrient and energy mother–infant pair random intercept models with gestational categories as factorial predictors
(b-Coefficients with their standard errors and 95 % confidence intervals)

Vd, daily volume of milk expressed.
* P < 0·05, ** P < 0·01, *** P < 0·001.
† Group estimates relative to reference 28- to 32-week group.
Between- and within-subject effects
Table 7 compares the coefficients of determination for the mother–infant pair ID random intercept null model with no fixed covariates with that with LSEm as the single fixed predictor and the best-fitting random intercept model with all fixed predictors included. The amount of variance explained by between-subject effects for macronutrient and energy content is between 67 and 79 % compared with only 6–24 % explained by a lactation time estimate effect and 8–27 % explained by inclusion of all fixed predictors in the best fitting models. Although the variance explained by between-subject effects does not change much after the first month lactation, the variance explained by lactation time effect and all fixed predictors in the best-fitting models falls even further at 0–15 % and 8–18 %, respectively.
Table 7. Coefficients of determination (R 2) for mother–infant pair random intercept-only models for macronutrient content*

HDM, human donor milk; LSEm, monthly lactation stage estimate; ICC, intra-class correlation.
* ICC = Var(u 0j )/Var(u 0j ) + Var(ɛ 0ij ), where Var(u 0j ) is the variance of the intercepts of the null model, and Var(ɛ 0ij ) is the variance of the residuals of the null model. R 1 2 = 1 – (Var(u 1j ) + Var(ɛ 1j )/Var(u 0j ) + Var(ɛ 0ij )), where Var(u 1j ) is the variance of the intercepts of the LSEm fixed covariate model and Var(ɛ 1j ) is the variance of the residuals of the LSEm fixed covariate model. R 2 2 = 1 − (Var(u 2j ) + Var(ɛ 2j )/Var(u 0j ) + Var(ɛ 0ij )), where Var(u 2j ) is the variance of the intercepts of the full model and Var(ɛ 2j ) is the variance of the residuals of the full model.
Discussion
In this analysis of HDM macronutrient content, we have shown that SGA status, as well as prematurity, influenced macronutrient and energy content after controlling for month of lactation, volume of milk expressed and between-subject effects. The biggest differences were seen between preterm SGA and term AGA milk with highest protein, fat and energy in preterm SGA milk. The highest carbohydrate content however was found in term AGA milk. Overall, milk from mothers who delivered preterm had higher protein and fat content and lower carbohydrate content than term counterparts, but degree of prematurity did not influence macronutrient content after controlling for the above covariates and between-subject effects. The between-subject effects remained the most important component of the variance in macronutrient and energy content, explaining twice to ten times the variance compared with fixed factors in the models.
This is the first study that we are aware of which has investigated the relationship between gestational age, birth weight z score and macronutrient content of HDM. Describing such relationships could potentially facilitate targeted selection of nutrient-rich donor milk for SGA and preterm babies in the neonatal unit.
Study strengths include the large number of samples, with a high number of samples from mothers of preterm babies (18 % of all mothers contributing to 36 % of all samples). Although data on number of samples from each mother were available, unfortunately information on when and how long a period the milk was expressed, from which the sample derived, was only available for under half of the mothers, very few of which donated three or more times. There were significant between-subject effects in the random intercept model, but it is likely that random effects also exist in the change of macronutrients and energy over time. Sadly, the lack of data on donations at repeated time points precluded an appropriate random intercept and slopes model to assess this. Although the present study focused on characteristics of the baby which influenced HDM macronutrient content such as gestational age and birth weight z score, maternal BMI is known to influence macronutrient content of HDM(Reference Michaelsen, Skafte and Badsberg36) and these data were not available for analysis as it is not routinely recorded at the NWHMB.
The overall mean protein and carbohydrate content are similar to previous MIRIS macronutrient analyses of HDM cohorts(Reference Michaelsen, Skafte and Badsberg36–Reference Cooper, Barnett and Gentles38). The mean fat content and calculated energy, although similar to that in the study by Wojcik et al.(Reference Wojcik, Rechtman and Lee37), are slightly lower than that reported by Michaelsen et al.(Reference Michaelsen, Skafte and Badsberg36) and Cooper et al.(Reference Cooper, Barnett and Gentles38). As with these previous studies, fat was the most variable macronutrient and carbohydrate the least (see online Supplementary Table S2).
Systematic reviews of term(Reference Gidrewicz and Fenton21) and preterm(Reference Mimouni, Lubetzky and Yochpaz19–Reference Gidrewicz and Fenton21) MOM macronutrient content show a steep decline in protein over the first few days and a more gradual decline thereafter in the first 3 months of lactation; increasing lactose concentration in the first 3–5 weeks before a levelling off and a gradual increase in fat content in the first 10–12 weeks. This is consistent with our findings of highest protein content in the first month of lactation with a gradual decline over the next few months and likely represents higher protein content in the colostrum and transitional milk in the first few days after birth. However, contrary to these studies, we found that fat and carbohydrate content were higher in the first 1–2 months compared with subsequent months. In the longitudinal cohort of HDM macronutrient content by Michaelsen et al.(Reference Michaelsen, Skafte and Badsberg36), a similar decrease in fat content over the first 4 months was found. It is unclear why these differences exist between HDM and MOM macronutrient changes with lactation, but it should be noted that the macronutrient content for a monthly lactation period is an estimate, as there is no information on the proportions of milk from a particular time point within that month which makes up the pooled sample.
Consistent with the systematic review by Gidrewicz & Fenton(Reference Gidrewicz and Fenton21) of MOM macronutrient content in preterm and term milk, we found higher protein and fat and lower carbohydrate content in preterm milk compared with term milk overall. However, these differences were in the first 3 months for protein and carbohydrate and the first 2 weeks for fat, while our analyses showed these differences in months 7 and 8 for protein, month 3 for fat, with no differences on monthly analysis for carbohydrate.
Although some investigators have found higher protein, but no difference in fat content in MOM of extremely preterm babies compared with that of higher gestation preterm babies(Reference Bauer and Gerss39), our finding that degree of prematurity had no effect on macronutrient content is consistent with two recent studies using the MIRIS analyser showing no difference in MOM protein or fat, between 24–30 weeks and 31–35 weeks gestation groups in the first 9 weeks of lactation(40), and between <28-week and >28-week gestation groups at 2-week intervals in the first 12 weeks of lactation(Reference Zachariassen, Fenger-Gron and Hviid41).
The finding that Vd positively predicted carbohydrate content after controlling for subject effects and LSEm is consistent with previous longitudinal studies of MOM macronutrient content(Reference Nommsen, Lovelady and Heinig42) and probably reflects the fact that lactose is the major contributor to milk osmolarity, and as such, its synthesis determines the volume of fluid secreted by the mammary gland(Reference Neville43). Mothers could only donate to the NWHMB up to the age of 9 months of their infant. Thus, the significant increases in protein(Reference Perrin, Fogleman and Newburg44) and fat(Reference Mandel, Lubetzky and Dollberg45) that have been observed in the second and third years of lactation in previous studies of MOM macronutrient content were unable to be assessed in this analysis. Increased protein and decreased lactose have also been demonstrated with infant weaning, associated with reduced volume of milk(Reference Dewey, Finley and Lönnerdal46). It is conceivable that the gradual rise in protein (and indeed fat and energy) and fall in carbohydrate observed in the predicted monthly estimates from months 7 to 10 as seen in Figs. 3 and 4 represent infant weaning. However, there was no corresponding fall in daily volume expressed for these months, and no relationship between Vd and protein, fat and energy was seen in the overall models. Indeed, Vd fell during the first 2 months and remained fairly constant thereafter (see online Supplementary Fig. S1). Given that the majority of mothers who had expression start date and end date information, donated only once, it is likely that donations did not capture the weaning period, in contrast to the longitudinal study by Michaelsen et al.(Reference Michaelsen, Skafte and Badsberg36) involving a number of mothers with repeated donations over a prolonged period of lactation.
Although derived from different statistical methods, the coefficients of determination for between-subject effects and lactation time effects are comparable with that described in the study by John et al.(Reference John, Sun and Maillart47) which analysed the macronutrient data of 1119 human milk samples from 443 individual donors to a milk bank (subject effects 67–79 % of the variance v. 51–82 % in the study by John et al.). Despite the amount of inter-individual variability in HDM, it is perhaps reproducible between cohorts. Our analysis shows a 46 % difference in the quartile 3 and quartile 1 mark for fat content, which is similar to the 48 % difference seen in the study by Michaelsen et al.(Reference Michaelsen, Skafte and Badsberg36) (see online Supplementary Table S2).
The results of this analysis suggest that SGA status, as well as preterm delivery, influences macronutrient content of breast milk especially in early lactation. Possible reasons for this may include increased levels of antibody, complement, cytokines and total protein in MOM associated with maternal hypertension and placental insufficiency(Reference Massmann, França and Souza48). Changes in breast milk macronutrient composition dependent on the needs of the infant rather than maternal physiology have also been postulated(Reference Bobinski, Mikulska and Mojska49). Quantitative differences in protein, but no other macronutrient, between SGA and AGA groups have inconsistently been reported previously in a handful of small studies, with some investigators finding higher protein content, in term SGA v. term AGA milk in the first 2 weeks of lactation only(Reference Grumach, Jeronimo and Hage50,Reference Pamblanco, Ten and Comin51) , while others have found no difference(Reference Garza, Johnson and Buttle52).
As with previous studies of HDM, the present study confirms not only the substantial variation in macronutrient content seen in donor milk but also the possible inadequacy of nutrient provision for preterm babies: for a baby fed 200 ml/kg per day of unfortified HDM, only one sample out of 2704 met current recommended daily protein requirements(Reference Agostoni, Buonocore and Carnielli53) for an extremely low birth weight baby, while only 0·5 % of samples met the protein requirement for a 1- to 1·8-kg baby, and just under half of the samples (46 %) would meet the current recommended fat intake for a preterm baby up to 1·8 kg. With multicomponent protein and carbohydrate fortification using commercially available products, 40 % of samples would meet current recommended protein intake for both categories of babies, but this would also result in 84 % of samples in excess of recommended energy intake, and all samples in excess of the recommended carbohydrate intake for preterm babies up to 1·8 kg.
The finding of higher protein and fat content in HDM from mothers of SGA babies, especially those born preterm, may have important consequences for the growth of these babies, who are most at risk of both continuing growth failure and catch up growth. However, little is as known currently about the bioavailability of macronutrients in human milk, hence before resorting to targeted selection of HDM, or routine fortification, studies of quality of growth are advisable. Analysis of body composition data from a randomised controlled trial of HDM or preterm formula to supplement any shortfall in maternal milk availability is currently underway (PREMFOOD trial NCT01686477).
Acknowledgements
We would like to thank all of the staff in the Northwest Human Milk Bank for their cooperation and organisation of the study data.
This research received no specific grant from any funding agency, commercial or not-for-profit sectors.
L. M. formulated the research questions, designed the study, carried out the analysis, and wrote the article. L. C. formulated the research questions, designed the study, collected data, and reviewed the article. E. S. collected data and reviewed the article. N. M. reviewed the article.
There are no conflicts of interest.
Supplementary material
To view supplementary material for this article, please visit http:// doi.org/10.1017/S0007114519002228


