


1. Introduction
There is a lack of understanding of language profiles in bilingual children with developmental language disorder (DLD) and how the profiles of those children differ from their typically developing (TD) peers. DLD is a high-incidence (7%–11%) neurodevelopmental disorder that is characterized by unexplained difficulties in understanding/speaking language(s) (Bishop et al., Reference Bishop, Snowling, Thompson and Greenhalgh2017; Norbury et al., Reference Norbury, Gooch, Wray, Baird, Charman, Simonoff, Vamvakas and Pickles2016). Children with DLD demonstrate heterogeneity regarding domains affected and levels of severity (e.g., Lancaster & Camarata, Reference Lancaster and Camarata2019; Stromswold, Reference Stromswold2000). Bilingualism is also shown to lead to variability in language learning, given the effect of environmental factors, such as language exposure and age of acquisition (e.g., Halpin et al., Reference Halpin, Prishker and Melzi2021; Su et al., Reference Su, Rojas and Iglesias2022). Bilinguals with DLD are historically understudied, given the challenges in identifying DLD in bilingual children (Bedore & Peña, Reference Bedore and Peña2008; Li’el et al., Reference Li’el, Williams and Kane2019). These children may present a high level of variability, given the interaction of bilingualism and DLD. To understand such variability, rather than categorizing children a priori, profiles can be determined using latent profile analysis (LPA), which are person-centered statistical analyses focused on subgroup characteristics within individuals of a population (McWayne et al., Reference McWayne, Green and Fantuzzo2009).
In this paper, we used LPA to examine the different language profiles in a group of Spanish–English bilingual children in terms of language (Spanish vs. English) and domain (morphosyntax vs. semantics). A child’s language profile in this paper concerns their relative performance across languages and domains. We included both children with and without DLD to (1) examine different profiles in children regardless of language ability status, which contributes additional evidence to the existing findings in bilingual profiles, and (2) investigate the distribution and characteristics of profiles in children with DLD, which presents novel evidence of profiles and variability in bilingual children with DLD. Additionally, environmental factors were investigated against profile characteristics to understand factors that contributed to the heterogeneity in bilingual development.
1.1. Importance of understanding bilingual profiles
Understanding bilingual profiles has important implications for both education policies and clinical decision-making. In education settings, understanding different bilingual profiles in general could potentially improve educational programming, as aligning children’s profiles of strengths and weaknesses across language domains and dominance with the language of instruction may reduce educational disparities and foster children’s success. It is often the case that developing bilinguals, or dual language learners, are all included together in the same English language programming within school systems as a homogeneous group, often called English language learners, referring to their status as learners of English as a second or new language. However, not all developing bilingual children have similar language backgrounds, experience and proficiency. As stated in the U.S. Every Student Succeeds Act (2015) and the Council of Chief State School Officers, students are classified as English language learners if they (1) include a language other than English in their current language use or language environment and (2) show low English-language skills, which result in a need of additional specialized linguistic and academic support services. This classification system leaves open a great deal of heterogeneity, and the use of a single terminology devalues the heterogeneity of children grouped into this category (López & Foster, Reference López and Foster2021). Children included in this category may have diverse language experiences and individual characteristics that shape differing language-based profiles of strengths and weaknesses. Subjectively, school-aged children may be described as “Spanish-dominant” because Spanish is used by the family in the home environment; however, terms like this one are superficial and can occlude important variations in language ability, including strengths in second language (English) domains. For example, a “Spanish-dominant” child may have strong Spanish morphosyntax skills, demonstrating dominance in that domain, while English phonological and semantic development is commensurate with Spanish – this example illustrates nuances in the language profile that are important for educational and clinical programming. Having appropriate educational placement of bilingual students would ensure that the language of instruction would support students’ strengths and their needs, as well as support the early identification of children who are struggling to learn language due to DLD (Su et al., Reference Su, Rojas and Iglesias2022).
In clinical settings, demonstrating the various profiles in bilingual language learning is important in clinical decision-making, as decisions made on assumptions of one single bilingual typical pattern (e.g., lower English than home language skills) could lead to misclassification. In the context of bilingual children, one primary challenge in diagnosing DLD is to accurately identify disorder within differences (different ways typical development shows in different bilingual populations or dialect communities; Oetting et al., Reference Oetting, Gregory and Rivière2016). Documenting the profiles and variability of bilingual development helps establish norms of typical and atypical patterns, and additionally helps identify disorders within typical differences. As such, changes in practices and policies regarding clinical and educational programming must reflect our understanding of students’ needs based on patterns or profiles. Currently, there are few systematic ways to describe individual variability within bilingual populations, as clinicians, educators and researchers must account for the normative interactions of individual factors unique to each child, language experience and language ability (e.g., Halpin et al., Reference Halpin, Prishker and Melzi2021; Kapantzoglou et al., Reference Kapantzoglou, Restrepo, Gray and Thompson2015; Su et al., Reference Su, Rojas and Iglesias2022).
Examining the language profiles of bilingual children also contributes to our understanding of how environmental factors are related to bilingual language development and may shape different profiles. This also provides an opportunity to examine the dynamic system theory (DST) on second language acquisition. The DST emphasizes the dynamic relationships among potential factors that affect bilingual language performance (de Bot et al., Reference De Bot, Lowie and Verspoor2007). De Bot et al. (Reference De Bot, Lowie and Verspoor2007) stated that heterogenous language outcomes could be observed among bilinguals in the long run, which could be explained by differences in the starting point (initial conditions) and growth patterns. Growth patterns are affected by different internal (e.g., child’s age and existing linguistic skills) and external forces (e.g., language exposure, language prestige and cultural/community practice), which further contribute to the individual differences in bilingual language performance. Examining the language profiles among bilingual children from preschool to school age in this study captures the commonalities and differences in language performance patterns within and across age groups, contributing to the examination of the dynamic nature of language performance within bilingual children. For example, children’s age (relating to schooling experience), socioeconomic status (relating to language experience such as resources and practices) and specific exposure to each of their languages may differentially affect children’s bilingual language proficiency and specific language profiles (e.g., Bohman et al., Reference Bohman, Bedore, Peña, Mendez-Perez and Gillam2010; Halpin et al., Reference Halpin, Prishker and Melzi2021; Hoff, Reference Hoff2013; Jia & Aaronson, Reference Jia and Aaronson2003; Oppenheim et al., Reference Oppenheim, Griffin, Peña and Bedore2020). The current study examines the internal (age) and external (experience) factors that may contribute to children’s language profile, with reference to DST, which could potentially inform the support needed for children to develop bilingual competency.
1.2. Bilingual language profile literature
Studies in the literature have examined the variability of bilingual development and documented different dual language profiles across language dominance and language domains for TD children. Lonigan et al. (Reference Lonigan, Goodrich and Farver2018) found three clear-cut profiles of language proficiency for Spanish–English bilingual preschoolers (recruited in California, United States) on language-based tests: (1) children with higher proficiency in Spanish than English; (2) children with relatively equal levels of proficiency in Spanish and English and (3) children with higher levels of English proficiency than Spanish. This finding is consistent with other studies with preschool-age children in the Southwestern region of the United States (Gonzalez et al., Reference Gonzalez, Pollard-Durodola, Saenz, Soares, Davis, Resendez and Zhu2016). However, describing bilingual profiles based on Spanish or English dominance may not be sufficient. Bilingual children may demonstrate uneven performances across language domains due to the diverse range of language experiences they have as they continue through elementary school (Su et al., Reference Su, Rojas and Iglesias2022). It may be possible that children also develop mixed profiles of proficiency, where skills across language domains have unequal development across languages (e.g., more advanced morphosyntax in Spanish and more advanced semantics in English; Peña et al., Reference Peña, Bedore, Lugo-Neris and Albudoor2020, Reference Peña, Bedore and Vargas2023).
Distinct profiles emerge within bilinguals related to both language exposure and language domain. A study by Halpin et al. (Reference Halpin, Prishker and Melzi2021) evaluated language profiles in Spanish–English bilingual preschoolers aged 3–5 years in New York City. Using reports of language exposure from caregivers and teachers and a standardized test, the Bilingual English–Spanish Assessment (BESA; Peña et al., Reference Peña, Gutiérrez-Clellen, Iglesias, Goldstein and Bedore2018), the researchers found four different profiles, including two profiles characterized by relatively balanced language skills (balanced bilinguals with low morphosyntax skills across both languages and balanced bilinguals with high scores across languages), one higher English than Spanish profile and one high phonology in both languages profile. Language profiles were also identified from language sampling measures (including subordination index, moving average type-token ratio, narrative structure scheme and words per minute) using LPA in Su et al. (Reference Su, Rojas and Iglesias2022) for TD Spanish–English bilingual children in Kindergarten through third grade. This study also identified four profiles: (1) balanced average where children had average scores in both English and Spanish and was the largest profile with 77.33% of the sample; (2) Spanish-dominant with 6.85% of the sample; (3) English-dominant, which was the smallest with 5.43% of the sample and (4) balanced high where children had high scores in both English and Spanish with 10.39% of the sample. These studies all included bilingual children in the United States and demonstrated that by the time children are in elementary school, the majority of children will have average expressive narrative language skills (as indicated by performance on the examined narrative measures) that were similarly developed in each language. Consistent with other U.S.-based studies (where most language profile studies were conducted) evaluating language profiles in Spanish–English bilinguals, distinct profiles of dominance, proficiency and ability will emerge (Gonzalez et al., Reference Gonzalez, Pollard-Durodola, Saenz, Soares, Davis, Resendez and Zhu2016; Halpin et al., Reference Halpin, Prishker and Melzi2021; Kapantzoglou et al., Reference Kapantzoglou, Restrepo, Gray and Thompson2015; Lonigan et al., Reference Lonigan, Goodrich and Farver2018; López & Foster, Reference López and Foster2021).
1.3. Language characteristics and profiles in children with DLD
General research in DLD has demonstrated that affected children show deficits in different language domains, including morphosyntax and semantics (e.g., Bishop et al., Reference Bishop, Snowling, Thompson and Greenhalgh2017; Leonard, Reference Leonard2014; Trauner et al., Reference Trauner, Wulfeck, Tallal and Hesselink2000). Grammatical difficulty (both morphology and syntax) is a hallmark deficit observed in children with DLD. Difficulties with morphosyntax have been documented cross-linguistically (Leonard, Reference Leonard2014). For example, English-speaking children show difficulties using past tense (e.g., walked) and verb agreement (e.g., third person singular -s, as in “the duck swims”; Leonard et al., Reference Leonard, Camarata, Brown and Camarata2004; Leonard, Reference Leonard2014; Rice et al., Reference Rice, Wexler and Hershberger1998; Rice & Blossom, Reference Rice and Blossom2013); and Spanish-speaking children show difficulties with articles, direct object pronouns and verb conjugations (Castilla-Earls et al., Reference Castilla-Earls, Auza, Pérez-Leroux, Fulcher-Rood and Barr2020). Children with DLD also demonstrate deficits in receptive (Bishop, Reference Bishop1997; Clarke & Leonard, Reference Clarke and Leonard1996) and expressive (Leonard et al., Reference Leonard, Miller and Gerber1999; Thal et al., Reference Thal, O’Hanlon, Clemmons and Fralin1999; Watkins et al., Reference Watkins, Kelly, Harbers and Hollis1995) vocabulary, as well as in novel word learning (Kan & Windsor, Reference Kan and Windsor2010) throughout preschool years. Children with DLD in early school age also demonstrate word retrieval and semantic processing deficits (Sheng, Reference Sheng2014).
Bilingual children with DLD are a historically understudied population, although a surge of interest and publications on this group has been observed in the past decade (e.g., Aguilar-Mediavilla et al., Reference Aguilar-Mediavilla, Buil-Legaz, López-Penadés, Sanchez-Azanza and Adrover-Roig2019; Castilla-Earls & Owen Van Horne, Reference Castilla-Earls and Owen Van Horne2023; Ebert et al., Reference Ebert, Pham and Kohnert2014, Reference Ebert, Rak, Slawny and Fogg2019; Govindarajan & Paradis, Reference Govindarajan and Paradis2019). A bulk of research focuses on children’s use of specific linguistic forms or error types. Studies using language sampling reveal that overall, bilingual children with DLD demonstrate the same error types as their monolingual counterparts (Paradis et al., Reference Paradis, Crago, Genesee and Rice2003). For example, Gutiérrez-Clellen et al. (Reference Gutiérrez-Clellen, Simon-Cereijido and Wagner2008) showed that both monolingual and bilingual Spanish–English children with DLD had difficulty with the use of finiteness and subject use in English compared to their typical peers. This aligns with the argument that the underlying impairment associated with DLD affects children similarly regardless of the number of languages being learned, and the difficulty should manifest in all language(s) children are exposed to (Håkansson et al., Reference Håkansson, Salameh and Nettelbladt2003; Kohnert, Reference Kohnert2010).
It is still unclear how profiles of bilingual development intersect with profiles of language ability for children with DLD. Existing analyses primarily focused on the profile of monolingual children with DLD. Friedmann and Novogrodsky (Reference Friedmann, Novogrodsky, Gavarró and Freitas2008) described different subtypes of DLD (referred to as specific language impairment (SLI) in the original study) based on the observation of the specific weaknesses shown in a group of Hebrew monolingual children with SLI (N = 45). The subtypes included syntactic SLI (N = 20), lexical retrieval SLI (N = 10), phonological SLI (N = 8) and linguistic-pragmatic SLI (N = 7). However, using a more advanced statistical approach (cluster analyses) and a much larger sample size (N = 505), Lancaster and Camarata (Reference Lancaster and Camarata2019) examined variability in children’s performance on different language tasks (e.g., picture vocabulary, grammatical completion and narrative retelling). Data from 505 monolingual English-speaking children with DLD (mean age = 72 months) were included. The results revealed 10 nonrandom clusters, many of which were not clinically interpretable. The authors interpreted the results as empirical support for the large individual differences within DLD and the possibility of conceptualizing DLD as a spectrum disorder. Tambyraja et al. (Reference Tambyraja, Schmitt, Farquharson and Justice2015) conducted an LPA to examine the language and literacy profiles of monolingual primary school children who were receiving school-based language therapy. They identified four different profiles, a low language profile (half of the total sample, overall low scores on all language measures), two average language profiles (one with low phonological awareness and the other with high phonological awareness) and a high language profile (23% of the sample, above average performance on all measures). These profiles are primarily differentiated by levels of overall severity (low, average and high), again illustrating the variability within children with DLD.
Focusing on Spanish–English bilinguals with DLD, Ebert et al. (Reference Ebert, Pham and Kohnert2014) examined children’s lexical profiles based on performance on a range of different vocabulary tasks (e.g., Spanish–English bilingual versions of the Expressive and Receptive One-Word Picture Vocabulary Test; Brownell, Reference Brownell2000a, Reference Brownell2000b, Reference Brownell2001a,Reference Brownell2001b; nonword repetition; automatic naming tasks). The authors identified heterogeneity in this group of children who showed L2 dominance, balanced language skills and L1 dominance profiles on lexical skills. To the best of our knowledge, there are currently no studies that have examined language profiles in bilingual children with DLD across languages and linguistic domains.
1.4. Current study and research questions
In the current study, we used LPA to examine the different profiles in a group of Spanish–English bilingual children in terms of language (Spanish and English) and domain (morphosyntax and semantics). Both TD children and children with DLD were included in the LPA to represent a general bilingual sample. The distribution of children with and without DLD across different profiles was then compared to examine the differences between TD and DLD profiles within a general bilingual sample. Specifically, we ask three research questions:
-
1. What are the different language profiles of Spanish–English bilingual children?
-
2. Is children’s language status (TD vs. DLD) associated with profile membership?
-
3. Are children’s demographic and language background (age, socioeconomic status (SES) and language exposure) associated with profile membership?
2. Method
2.1. Participants
This study involves secondary analyses of three de-identified datasets that included Spanish-English bilingual children with varying levels of bilingual exposure. Participants were recruited from school districts in Texas, Utah and Colorado that enroll a large number of Latino bilingual children. Children were included if they spoke both English and Spanish, aged below 10 years, had completed either the BESA (4–6 years old; Peña et al., Reference Peña, Gutiérrez-Clellen, Iglesias, Goldstein and Bedore2018) or the experimental version of the Bilingual English–Spanish Assessment – Middle Extension (BESA-ME; 7–10 years old; Peña et al., Reference Peña, Bedore, Gutiérrez-Clellen, Iglesias and Goldstein2008) depending on the child’s age, and had language ability status determined (TD or DLD). Children who had exposure to a third language other than English and Spanish were excluded.
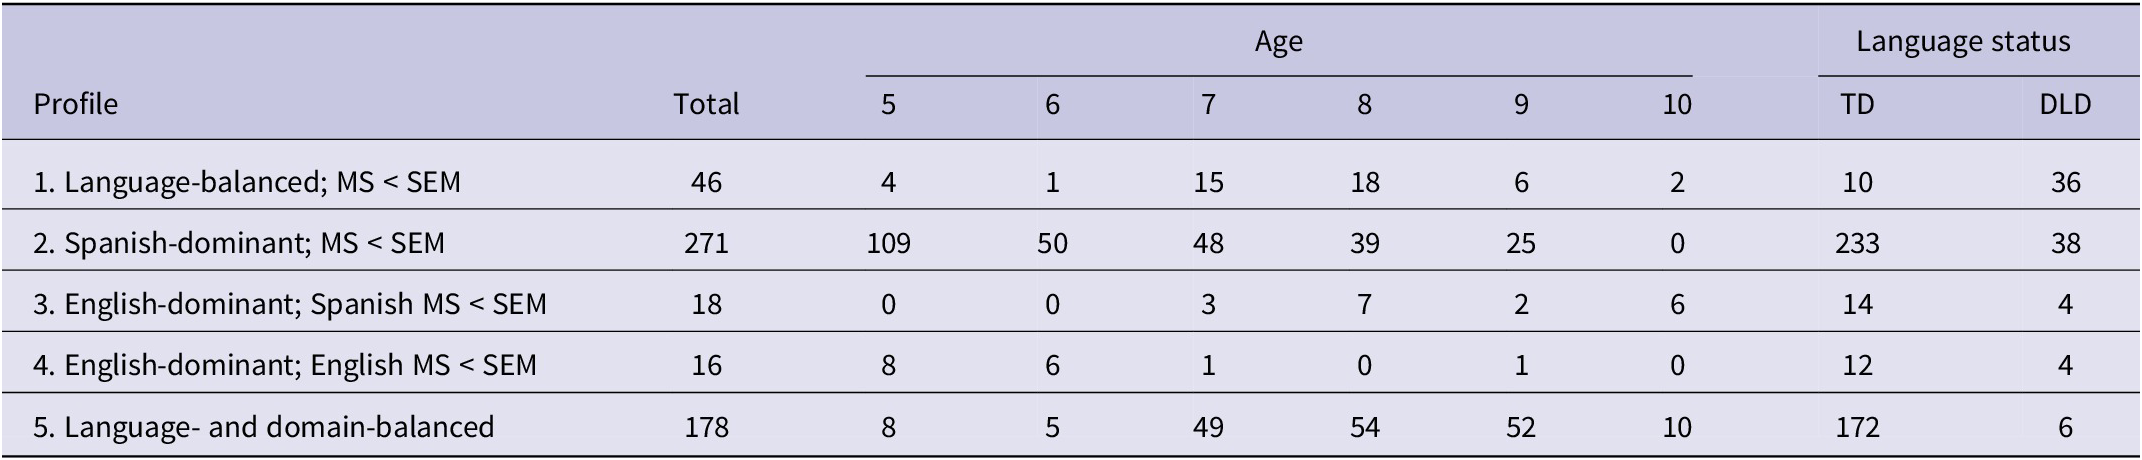
A total of 529 unique Spanish–English bilingual children (441 with typical development and 88 with DLD) between the ages of 5 and 10 years met the criteria and were included in the current study. One hundred and sixty-five children (21 with DLD) were drawn from the Diagnostic Markers of Language Impairment (DM; Peña et al., Reference Peña, Bedore and Gillam2006) dataset, which was a three-phase longitudinal study (phase two data were included in the current study when children were in kindergarten). One hundred and eighty-three children (32 with DLD) were selected from the Cross-Language Outcomes of Typical and Atypical Development in Bilinguals (CO; Peña et al., Reference Peña, Bedore and Griffin2010) dataset, which was a cross-sequential dataset (up to 4 years; year one data, when children were in kindergarten, second grade or fourth grade were included in the current study). The remaining 181 children (35 with DLD) were drawn from the Phenotype Assessment Tools for Bilingual (Spanish English) Children (PH; Peña and Bedore, Reference Peña and Bedore2006), which was a cross-sectional dataset including children from 7 to 9 years of age. The PH, CO and part of the DM (125 participants) datasets were collected in Austin, Texas in the United States, where community Spanish is present. The remaining 42 participants in the DM dataset were recruited around Salt Lake City, Utah in the United States, with less community Spanish. All parents completed a questionnaire to provide children’s demographic information, children’s exposure to English and Spanish, and parents’ ratings of their child’s language skills in each of the languages. Table 1 shows the breakdowns of age, percentage of Spanish input/output (reverse would be English input/output) and maternal education for the participants. See Supplementary Table S1 for more detailed participant information reported separately for the three datasets.
Table 1. Participants’ demographics
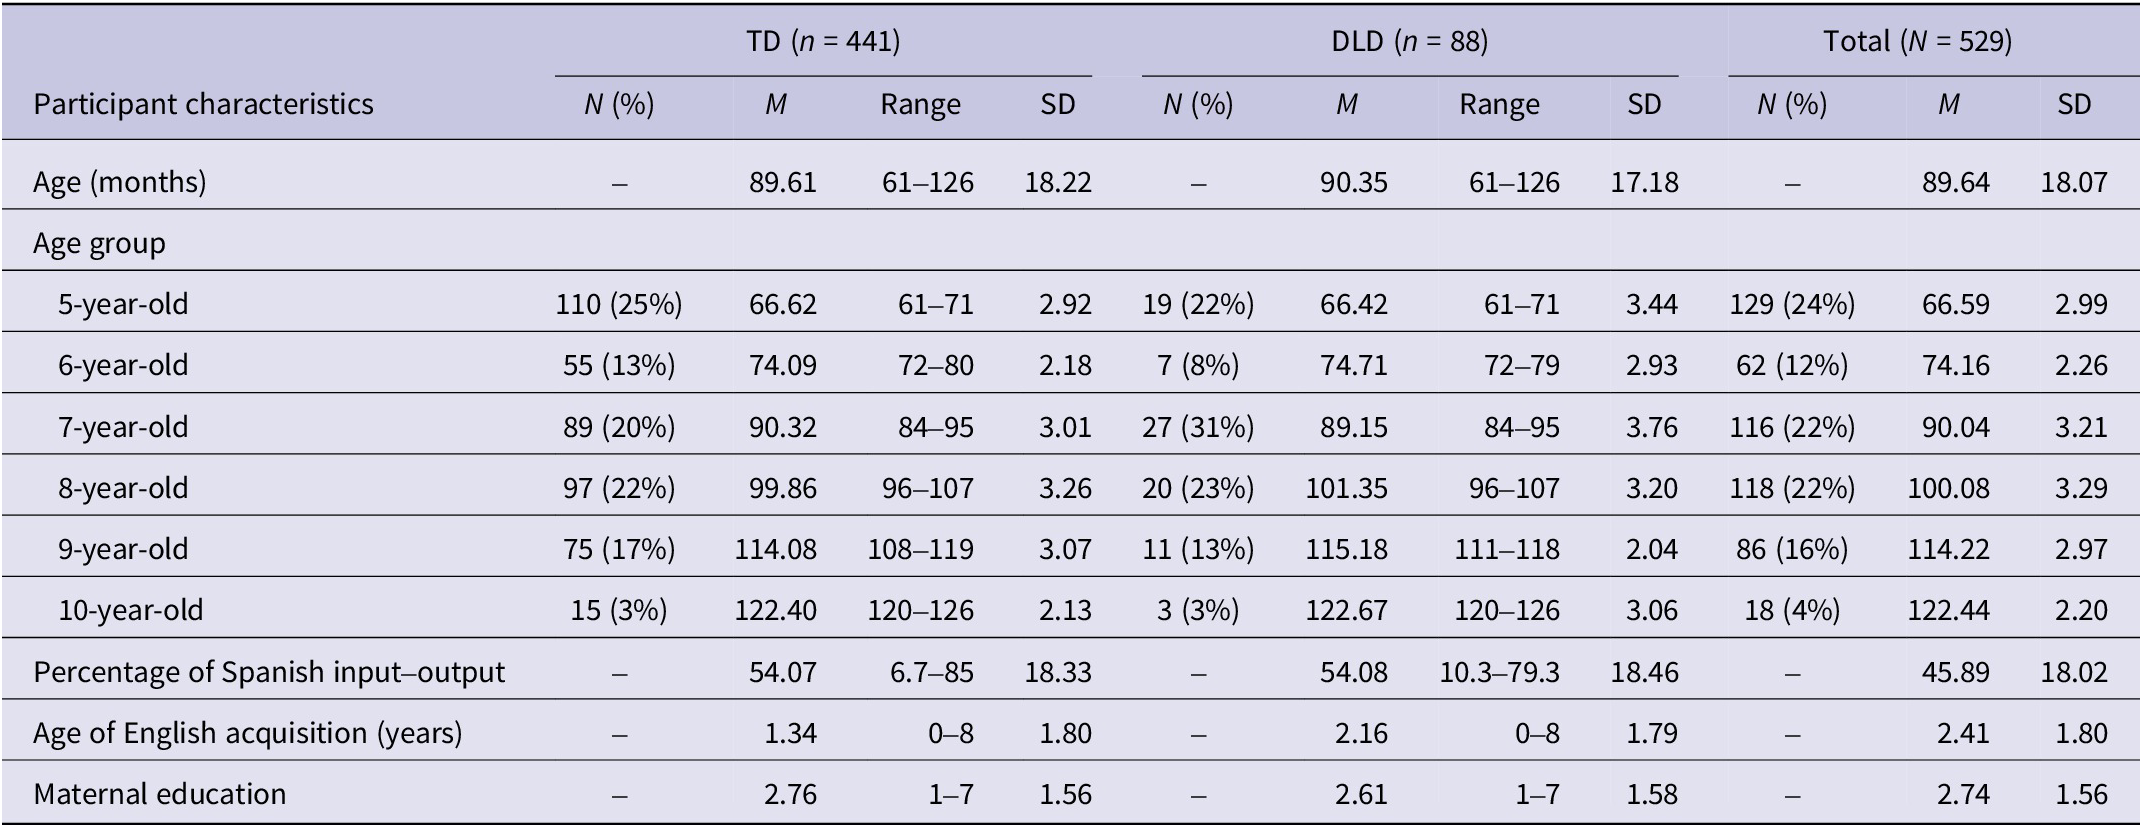
Note: Children with DLD were identified based on converging evidence considering standardized test scores, narrative language samples, clinician judgment, parent rating and school record (receiving special education or not). The percentage of Spanish input–output is derived from the Bilingual Input–Output Survey (Peña et al., Reference Peña, Gutiérrez-Clellen, Iglesias, Goldstein and Bedore2018). Maternal education: 1 = less than seventh-grade education; 2 = ninth-grade education; 3 = partial high school; 4 = high school, graduate; 5 = partial college or specialized training; 6 = college degree; and 7 = graduate degree. DLD = developmental language disorder; TD = typically developing.
Children’s DLD status was determined based on comprehensive sets of DLD indicators that differed slightly across the three datasets, including low performance on language tests, low parent/teacher ratings and clinician judgment of DLD. The clinician rating procedure for DLD identification in the DM dataset was described in detail in Wang et al. (Reference Wang, Choi-Tucci, Mendez-Perez, Gillam, Bedore and Peña2025), in which children’s performance in both languages was rated by three bilingual clinicians following a 6-point Likert scale. All studies, however, used morphosyntax, semantics and narrative samples, in conjunction with parent and teacher reports to determine DLD. Participants in the PH dataset were recruited using a two-gate design, with children with DLD recruited from SLPs’ caseloads. Children in the other two datasets were recruited using a one-gate design. All children completed the same test protocol, and children with DLD were identified based on their performance on a battery of language measures. The specific classification criteria for each dataset are presented in Table 2.
Table 2. DLD classification criteria used in the three datasets
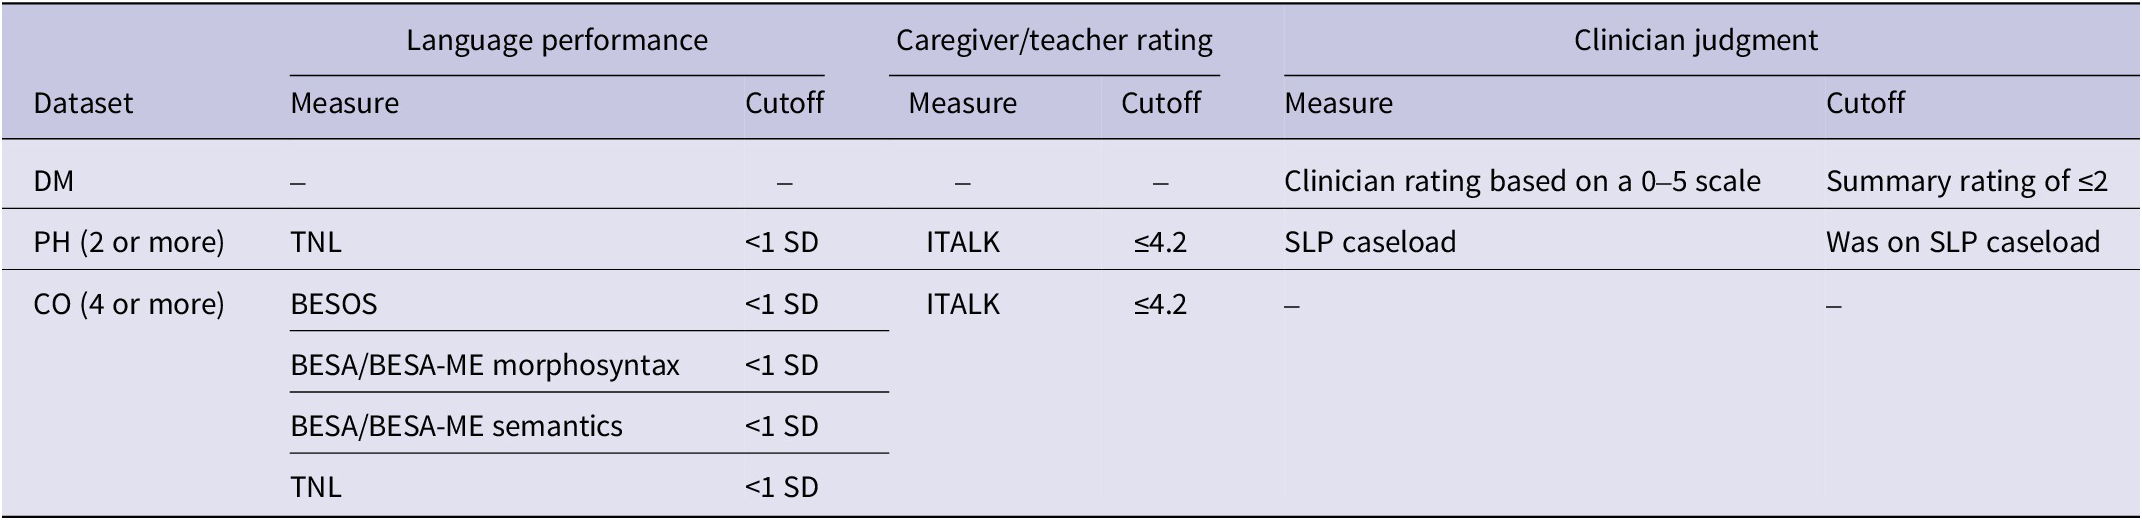
Note: Datasets include Diagnostic Markers of Language Impairment (DM; Peña et al., Reference Peña, Bedore and Gillam2006), Cross-Language Outcomes of Typical and Atypical Development in Bilinguals (CO; Peña et al., Reference Peña, Bedore and Griffin2010), and Phenotype Assessment Tools for Bilingual (Spanish English) Children (PH; Peña and Bedore, Reference Peña and Bedore2006). TNL is the Test of Narrative Language (Gillam & Pearson, Reference Gillam and Pearson2004). ITALK is the Instrument to Assess Language Knowledge (Peña et al., Reference Peña, Gutiérrez-Clellen, Iglesias, Goldstein and Bedore2018). BESOS is the Bilingual English–Spanish Oral Screener (Peña et al., Reference Peña, Bedore, Gutiérrez-Clellen, Iglesias and Goldstein2010). DLD = developmental language disorder. BESA = Bilingual English–Spanish Assessment.
2.2. Measures
In the current study, children’s language profiles were analyzed regarding their semantics and morphosyntax performance in Spanish and English. Depending on their age, children completed either the BESA or the experimental version of the BESA-ME as measures of their bilingual semantics and morphosyntax knowledge. Children below the age of 7 completed the BESA (N = 191), and children who were 7 and above completed the BESA-ME (N = 338). Both measures yield a standard score based on age, with a mean of 100 and a standard deviation of 15. In the CO dataset, the BESA/BESA-ME were involved as one of the DLD identification criteria (as seen in Table 2), and children also had to score low on other indications, including a narrative task, the screener and/or parent ratings. In the DM dataset, children’s qualitative responses to the experimental version of the BESA were reviewed by clinicians as one of the DLD identification sources. There may be potential circularity here given that the BESA/BESA-ME was involved in DLD identification and was the main measure examined in the profile analysis. However, the current study aimed to explore the within-participant patterns of performance on the morphosyntax and semantics domains across two languages; therefore, the overall low performance characterized by DLD does not interfere with the within-participant pattern-based profile characteristics.
The Spanish and English semantics subtests in the BESA have 25 items, each targeting both children’s receptive (e.g., Show me the picture with the ball) and expressive knowledge (e.g., Tell me all the animals you can think of). Various semantic skills are featured, including analogies, linguistic concepts, functions, similarities and differences, characteristics properties and categorizations. Home and school concepts are featured in the subtests, and the items are organized in increasing difficulty. The reported coefficient alpha for the Spanish and English semantics subtests are .88 and .86, respectively, illustrating good internal consistency among the items (Peña et al., Reference Peña, Gutiérrez-Clellen, Iglesias, Goldstein and Bedore2018).
The morphosyntax subtests in the BESA consist of two tasks, namely cloze and sentence repetition tasks. The cloze task requires children to complete the target sentence. For example, a cloze item targeting English possessives would be: Look, this is a dog and this is the dog’s ball. This is a baby, and this is the ___ (target: baby’s ball); and a cloze item targeting Spanish articles would be: Los niños tienen unos carros. Y aquí, ¿qué tienen los niños? Los niños tienen ___ (target: un/el carro). The sentence repetition task requires children to listen to sentences one at a time and repeat the sentence verbatim after the presentation (e.g., The boy who broke the window is crying; La niña que estaba jugando con la puerta se lastimó la mano). The English morphosyntax (24 cloze and 33 sentence repetition items) targets possessive, third-person singular present tense, regular and irregular past-tense verbs, plural nouns, copula verbs, negations with auxiliaries and passive-voice constructions. The Spanish morphosyntax (15 cloze and 37 sentence repetition items) targets article–noun agreement, preterite verb forms, clitics and subjunctive verb forms. The cloze task is scored based on the response, while sentence repetition is scored based on targeted morphosyntactic constructions (bolded in the above example). The reported coefficient alpha for the Spanish and English morphosyntax subtests are .96 and .95, respectively, illustrating very high internal consistency among the test items (Peña et al., Reference Peña, Gutiérrez-Clellen, Iglesias, Goldstein and Bedore2018).
The BESA-ME is structured in parallel with the BESA and involves the same types of subtests with the same test format targeting older children (seven and older). Spanish and English semantics subtests in the BESA-ME have 44 and 42 items, respectively, which cover seven subscales, including analogies, associations, categories, characteristics, definitions, functions and similarities and differences. All the items are presented in either a receptive or expressive format. The reported coefficient alpha for the Spanish and English semantics subtests are .89 and .87, respectively. The morphosyntax subtests (52 items in Spanish and 102 items in English) in the BESA-ME also consist of cloze and sentence repetition tasks, and the contents are similar to those in BESA. The reported coefficient alpha for the morphosyntax subtests is .96 for both languages (Peña et al., Reference Peña, Bedore, Gutiérrez-Clellen, Iglesias and Goldstein2008). Again, alpha across the measures used in this study supports the notion that the test items are consistent with each other in measuring the same construct (semantics or morphosyntax).
Language input/output measure A parent-reported questionnaire, the Bilingual Input–Output Survey (BIOS; Peña et al., Reference Peña, Gutiérrez-Clellen, Iglesias, Goldstein and Bedore2018), was completed to evaluate children’s dual language input/output. Caregivers reported their child’s use of each language from birth to the current age and the hour-by-hour (7 am to 11 pm) language input and output during a typical weekday and weekend. The percentage of English and Spanish input/output was calculated based on the manual (Peña et al., Reference Peña, Gutiérrez-Clellen, Iglesias, Goldstein and Bedore2018).
2.3. Procedure
The BIOS and the BESA or BESA-ME were given to children following the procedure specified in the test manual. Children in the DM dataset completed a field test version of the BESA that contained more items. For this study, the BESA semantics test scores were calculated based on the item set in the final version of the BESA, and the BESA morphosyntax test scores were calculated based on the field test version of the morphosyntax subtest. All BESA-ME scores were calculated based on the experimental version of the assessment. For the current analyses, children’s raw scores on each subtest in each language were recorded and converted to standard scores. Children’s background information (age, maternal education, English/Spanish input and output and DLD status) was compiled together with their morphosyntax and semantic standard scores to form the complete profile analysis dataset.
3. Data analysis
3.1. Research question one
To identify the different dual language profiles in this sample of Spanish–English bilingual children with and without DLD, an LPA was conducted using the standard scores of the four language measures (Spanish morphosyntax, Spanish semantics, English morphosyntax and English semantics). The LPA analysis included two sections: model enumeration and model selection.
3.1.1. Model enumeration
All LPA analyses were run using Mplus vr. 7 and the tidyLPA package in R (R Core Team, 2020). All LPA models were estimated following the default and recommended estimator for LPA in Muthén and Muthén (Reference Muthén and Muthén2017) using maximum likelihood estimation with robust standard errors: “Estimator = MLR.” We used the “Starts = 500, 20” command to specify 500 random starts and iterations at the final optimization stage in all models. Having multiple random sets of starting values helps avoid invalid parameter estimates resulting from a local solution commonly encountered in LPA analyses (Berlin et al., Reference Berlin, Williams and Parra2014; Hipp & Bauer, Reference Hipp and Bauer2006).
Masyn (Reference Masyn and Little2013) and Vermunt and Magidson (Reference Vermunt, Magidson, Hagenaars and McCutcheon2002) recommended that all different types of within-class variance–covariance structures (Σk) should be considered as the different specifications would affect the formation of the latent profiles. In other words, profile solutions may be different based on one’s specification of whether the mean and variance of each profile and whether the covariance across profiles is fixed or allowed to vary. Therefore, four types of Σk are specified from the most to the least restrictive: (1) class-invariant/diagonal (Model A, means allowed to vary, equal variances and covariances fixed to zero); (2) class-varying/diagonal (Model B, means allowed to vary, free variances and covariances fixed to zero); (3) class-invariant/non-diagonal (Model C, means allowed to vary, equal variances and equal covariances) and (4) class varying/non-diagonal (Model D, means allowed to vary, free variances and covariances). We refer interested readers to Su et al. (Reference Su, Rojas, de Villiers, Golinkoff and Iglesias2023) for a more detailed explanation of the four types of Σk and Masyn (Reference Masyn and Little2013, Figure 25.8) for a visual depiction of how specifications of Σk can influence the profile solution output. Following Masyn (Reference Masyn and Little2013) and Nylund-Gibson and Choi (Reference Nylund-Gibson and Choi2018), within each variance/covariance specification model, we started with a one-profile model and gradually increased the number of profiles one at a time until reaching the k-profile model that failed to be well defined (e.g., models fail to converge, small condition number and small size of the smallest profile). In this paper, we refer to each model considering both the variance/covariance structure specification (Models A–D) and the number of profiles (1 − k). For example, Model A2 refers to model A (Σk with equal variances and covariances fixed to zero) with two profiles.
3.1.2. Model selection
A set of model fit statistics were extracted for each model and were compared first within each Σk (i.e., compare Models A1, A2, …, Ak), then the four optimal models within each Σk (i.e., compare Models Ak, Bk, Ck and Dk) were compared to identify the final optimal model. LPA analysis provides a variety of model fit statistics, but those statistics rarely converge on one single model (Nylund-Gibson & Choi, Reference Nylund-Gibson and Choi2018). Consistent with previous studies on language profiles in bilingual children (Su et al., Reference Su, Rojas and Iglesias2022, Reference Su, Rojas, de Villiers, Golinkoff and Iglesias2023), we followed a four-step procedure to consider a combination of model fit statistics, model classification diagnostics, theoretical justifications and model interpretability to select the final optimal profile solution (Masyn, Reference Masyn and Little2013; Nylund-Gibson & Choi, Reference Nylund-Gibson and Choi2018).
In Step 1, we excluded models that were not well defined. A model was not well defined if it (1) failed to converge, 2) did not replicate across a set number of random starts, (3) had a small condition number (<10 to 6) or (4) a percentage of the minimum profile size <3% (Masyn, Reference Masyn and Little2013; Nylund-Gibson & Choi, Reference Nylund-Gibson and Choi2018; Su et al., Reference Su, Rojas and Iglesias2022).
In Step 2, we compared different profile number models within each Σk and selected one optimal model within each variance/covariance specification model (Models A–D). Three sets of model indices were used to guide the selection of models, including absolute model fit benchmark, information criteria fit indices and model relative fit indices. Following Masyn (Reference Masyn and Little2013), Model C with one profile (Model C1) was selected as the absolute model fit benchmark, so solutions with a log-likelihood (LL) value greater than the LL value in Model C1 were prioritized. Information criteria fit indices include the Bayesian information criterion (BIC), consistent Akaike information criteria (CAIC) and approximate weight of evidence (AWE). For those indices, lower values indicate better models. Lastly, model relative fit indices include the Vuong–Lo–Mendell–Rubin Likelihood Ratio Test (VLMR-LRT) (Lo et al., Reference Lo, Mendell and Rubin2001), Bootstrap Likelihood Ratio Test (BLRT), Bayes Factor (BF) and approximate correct model probability (cmP). Both VLMR-LRT and BLRT evaluate whether the K model significantly improves upon the K − 1 model. BF values above 10 illustrate strong evidence for model K over K + 1. Lastly, cmP was used to evaluate one model among a set of other models. The cmP value closest to 1 is associated with the optimal model within the models being compared.
In Step 3, we compared the four optimal models within each Σk with each other to select the final optimal model. The cmP final value was used as the guideline because it is the only relative fit index that would allow relative comparison of each model to an entire set of models within and across model types (A/B/C/D), whereas indices like VLMR-LRT and BF only compare one model against its previous or following model. A cmP value was calculated for each of the final four candidate models, and the cmP value closest to 1 is associated with the final optimal model. Step 4 considers theoretical justifications and the model interpretability to closely examine whether the selected final model was theoretically meaningful and can be interpreted. In addition to the model fit statistics used for model selection, we also reported a set of model classification precision values for each model, which was used to understand how well the profiles are separated but should not be used for model selection (Masyn, Reference Masyn and Little2013). Those classification precision values include (1) the entropy value, which reflects the overall precision of model classification for the whole sample (ranges from 0 to 1, and the higher value indicates better posterior classification); (2) average posterior probabilities (AvePP), which is calculated by averaging the posterior probability for each participant assigned (AvePP above .70 indicates well-separated profiles and adequate latent profile assignment; Nagin, Reference Nagin2005) and (3) minimum profile size, which is the size of the smallest profile. A minimum profile size of <3% can be an indicator of data over-extraction (Nylund-Gibson & Choi, Reference Nylund-Gibson and Choi2018).
3.2. Research questions two and three
To examine whether children’s language status (TD or DLD) (RQ2), as well as demographic and language background (RQ3), contribute to profile characteristics, the final optimal profile solution was analyzed and language status, age, SES (maternal education) and language input/output were examined for each profile in the final optimal model. With reference to the final optimal profile solution, two sets of multinomial regression models were conducted to examine whether profile membership was associated with (1) language ability status (TD vs. DLD) and (2) age, maternal education (used as the measure of SES) and English language input/output. For research question three, children’s age, SES, age of first exposure to English and English input/output were entered as independent continuous variables to examine whether each factor was able to predict children’s profile membership (dependent variable). Children’s maternal education was collected using a categorical system (7-point scale ranging from less than seventh-grade education to graduate degree). This system was recoded to a three-level system for the regression analyses: below high school (original coding of 1 and 2, N = 236), high school (original coding of 3 and 4, N = 168) and higher education (original coding of 5, 6 and 7, N = 62).
4. Results
4.1. RQ1. What are the different language profiles observed in Spanish–English bilingual children?
4.1.1. Preliminary analysis of statistical assumptions
Statistical assumptions were examined on the four language measures (Spanish morphosyntax, Spanish semantics, English morphosyntax and English semantics), including examining possible outliers, normality and multicollinearity. The results showed that there were no outliers, so all data points were reserved. Only one of the four variables was normally distributed (English semantics). In this case, robust estimation strategies (e.g., maximal likelihood with robust standard errors) are appropriate (Spurk et al., Reference Spurk, Hirschi, Wang, Valero and Kauffeld2020; Vermunt & Magidson, Reference Vermunt, Magidson, Hagenaars and McCutcheon2002). Lastly, the correlation coefficients among the four performance variables were all less than .80, which is not high enough to raise concerns for multicollinearity.
4.1.2. Latent profile analysis – model selection
A one-profile model was fitted for each within-class variance/covariance specification (Models A–D), and we increased the number of profiles until the model failed to be well defined. Table 3 shows the fit statistics for all LPA models that were estimated. Following Step 1, the enumeration of Model A stopped at six profiles as the seven-profile model failed to replicate across the set number of random starts. Models B and C stopped at five profiles as the six-profile Model B did not converge and the six-profile Model C has a minimum profile size of less than 3%, which is a sign of over-extraction. Model D stopped at two profiles and starting from the models starting from three profiles failed to converge. The rest of the well-defined models were further evaluated in Step 2.
Table 3. The fit statistics for all latent profile analysis models estimated

Note: K refers to the number of profiles in the fitted model. The box indicates the optimal model after applying all the model selection criteria. AvePP = Average posterior probabilities; AWE = approximate weight of evidence; BIC = Bayesian information criterion; CAIC = consistent Akaike information criteria; VLMR-LRT = Vuong–Lo–Mendell–Rubin Likelihood Ratio Test (VLMR-LRT).
In Step 2, the three sets of model indices were used to guide the selection of models (absolute model fit benchmark, information criteria fit indices and model relative fit indices). Model C1 was selected as the model fit benchmark, so solutions with a log-likelihood (LL) value greater than the LL value in Model C1 (−9,122) were prioritized and bolded in Table 3. Additionally, the lowest BIC, CAIC and AWE values, which indicate better information criteria fit, were bolded for each model. Lastly, model relative fit indices (VLMR-LRT, BLRT, BF and cmP) were evaluated, and the optimal values within each Ek are bolded in Table 3. All models have significant BLRT values, so BLRT was not included in the table to inform model selection. BF values above 10 illustrate strong evidence for model K over K + 1. None of the BF values were greater than 10 and were not shown in the table. cmP was used to evaluate one model among a set of other models. The cmP value closest to 1 is associated with the optimal model within the models being compared. Based on those model fit criteria, Models A6, B5, C5 and D2 were selected in Step 2.
The four selected models were then compared in Step 3 using the cmPfinal value. Again, the cmP value closest to 1 is associated with the final optimal model. Therefore, Model C5 (Model C with five profiles) was selected as the final optimal model for this dataset.
4.1.3. Interpretation of the final optimal model
The final optimal model (Model C5) indicates that there are five different language profiles in our sample of Spanish–English bilingual children. The original dataset was then mapped onto Model C5 to understand and characterize these five profiles. Figure 1 presents the average standard scores of the four language subtests for each identified profile (see Supplementary Table S2 for the exact scores in each subtest for each profile).
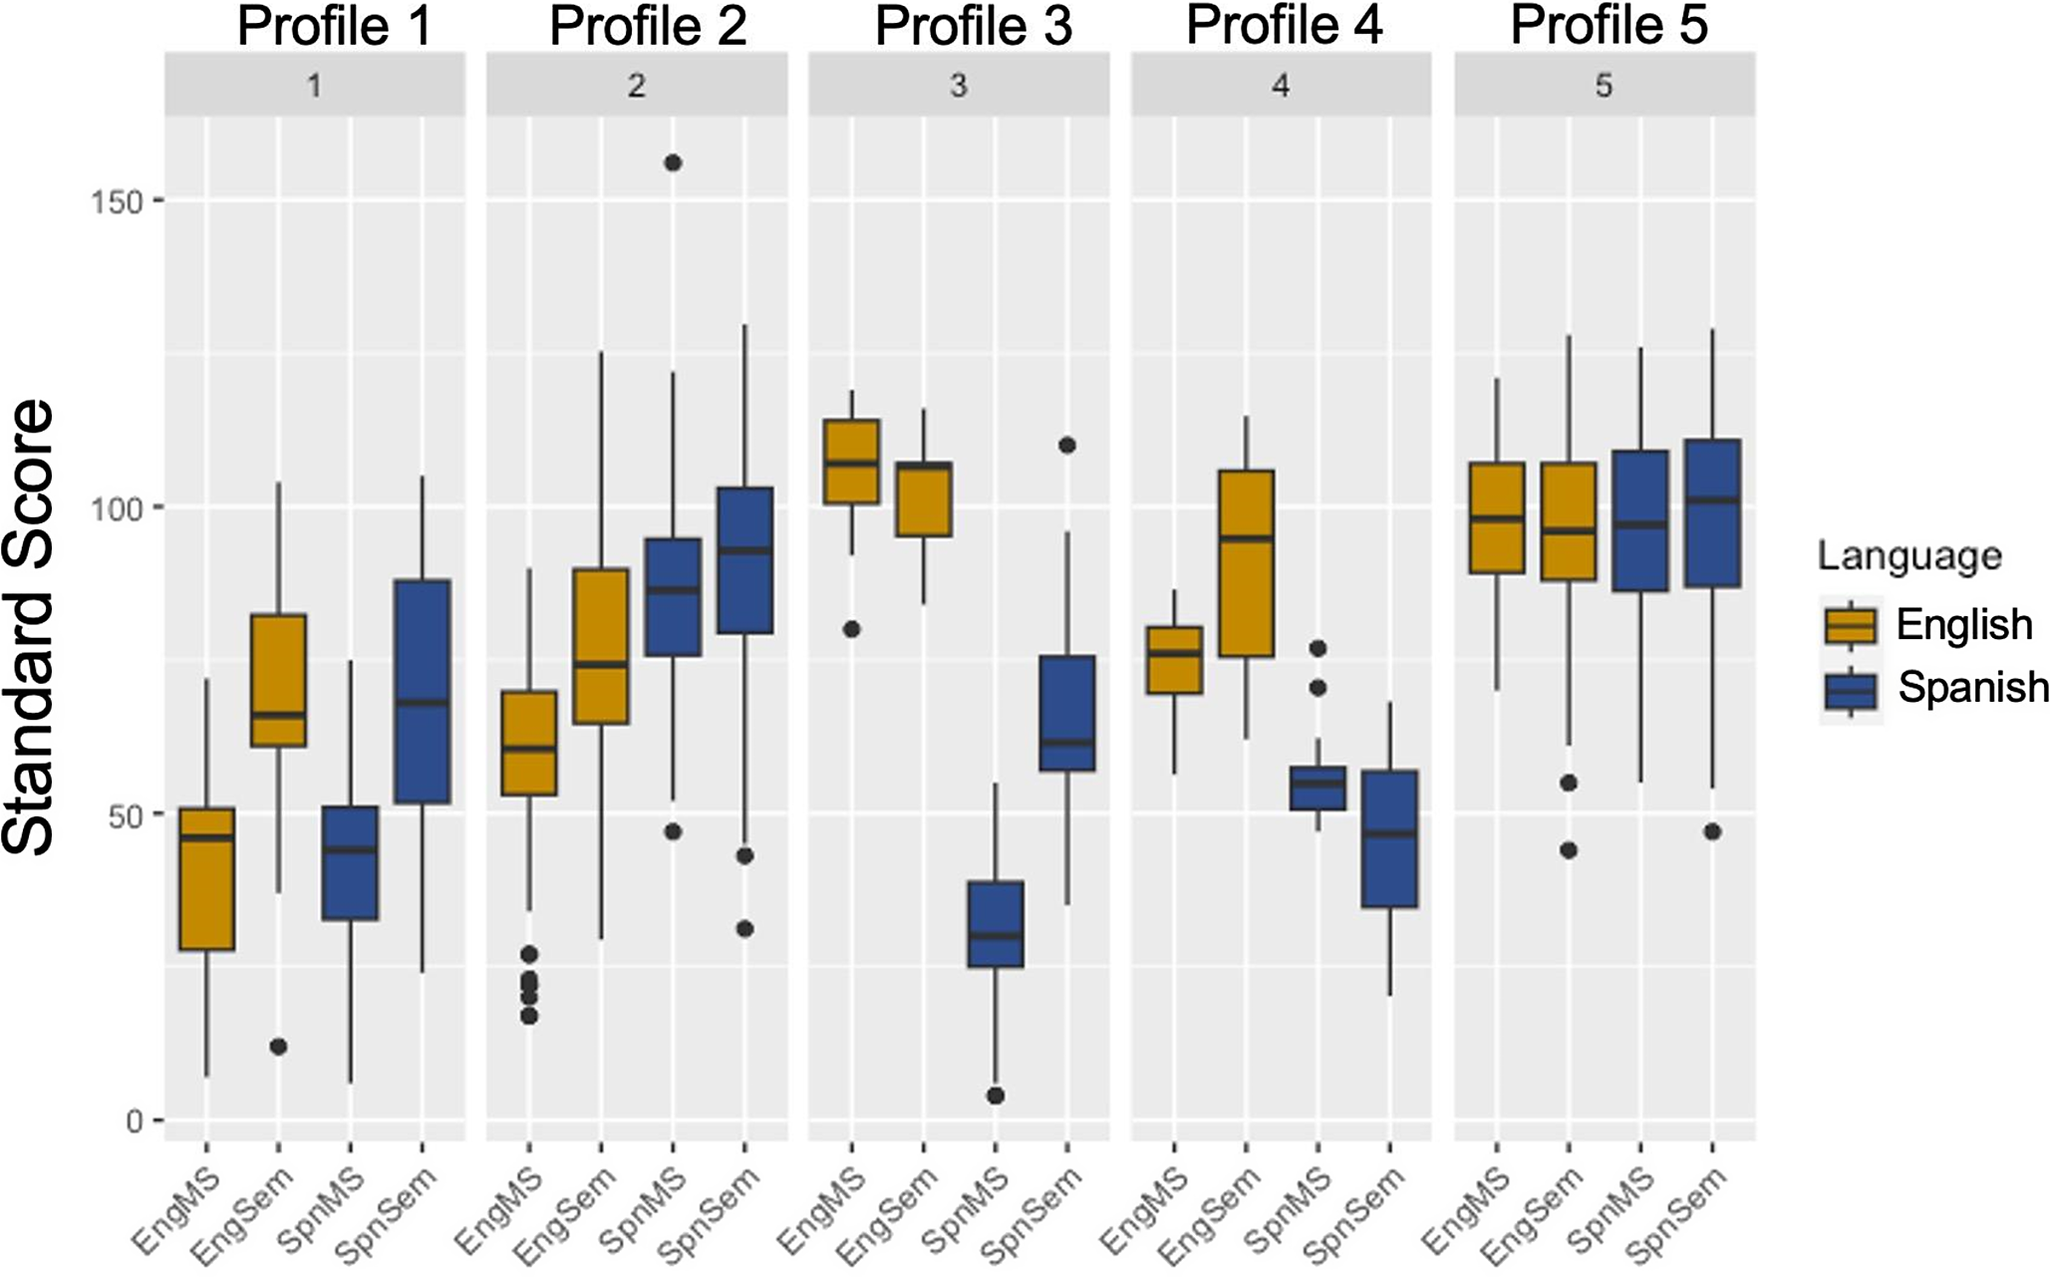
Figure 1. The five different profiles in 529 Spanish–English bilingual children with and without developmental language disorder. Note: Eng MS = English morphosyntax; Eng SEM = English semantics; Spn MS = Spanish morphosyntax; Spn SEM = Spanish semantics.
Profile 1 – Language balanced-low morphosyntax profile: Profile 1 includes 46 children, 8.69% of the whole sample. Children in this profile showed comparable performance in Spanish and English but lower morphosyntax than semantics scores in both English and Spanish.
Profile 2 – Spanish dominant-low morphosyntax profile: Profile 2 is the largest profile in size and included 271 children, 51.22% of the whole sample. Children in this profile showed higher performance in Spanish than English but lower morphosyntax than semantics scores in both languages as in Profile 1.
Profile 3 – English-dominant, low Spanish morphosyntax profile: Profile 3 is one of the smallest profiles in size and included 18 children, 3.40% of the whole sample (just above our criterion of 3% as specified in the analysis section). Children in this profile showed higher performance in English than in Spanish. Performance between morphosyntax and semantics was balanced in English, but children had lower morphosyntax than semantics performance in Spanish.
Profile 4 – English–dominant, low English morphosyntax profile: Profile 4 is the smallest profile in size and included 16 children, 3.03% of the whole sample. Children in this profile showed higher performance in English than in Spanish as in Profile 3. However, in this profile, children had lower morphosyntax than semantics in English and balanced domain performance in Spanish (the same pattern in a different language as in Profile 3).
Profile 5 – Balanced profile: Profile 5 is the second largest profile in size and included 178 children, 33.65% of the final sample. Children in this profile showed balanced performance in Spanish and English and in morphosyntax and semantics. Additionally, children in Profile 5 showed relatively higher performance overall compared with those in other profiles.
4.2. RQ2. Do children with and without DLD show different language profiles?
We first examined the distribution of children with and without DLD across the five profiles. Figure 2 shows the distribution of children with and without DLD in each profile (see Table 4 for the exact number of children with and without DLD in each profile). Profiles 1 and 2 included the majority of the children with DLD: 36 (40.9%) and 38 (43.2%), constituting over 80% of children with DLD. Profile 1 was a language-balanced group, and Profile 2 was a Spanish-dominant group. The common feature between Profiles 1 and 2 was lower morphosyntax than semantics performance in both languages, and those were the only two profiles with this pattern. Though children with DLD were primarily placed in Profiles 1 and 2, they were observed across all five profiles, including Profile 5, the high-performance balanced profile.
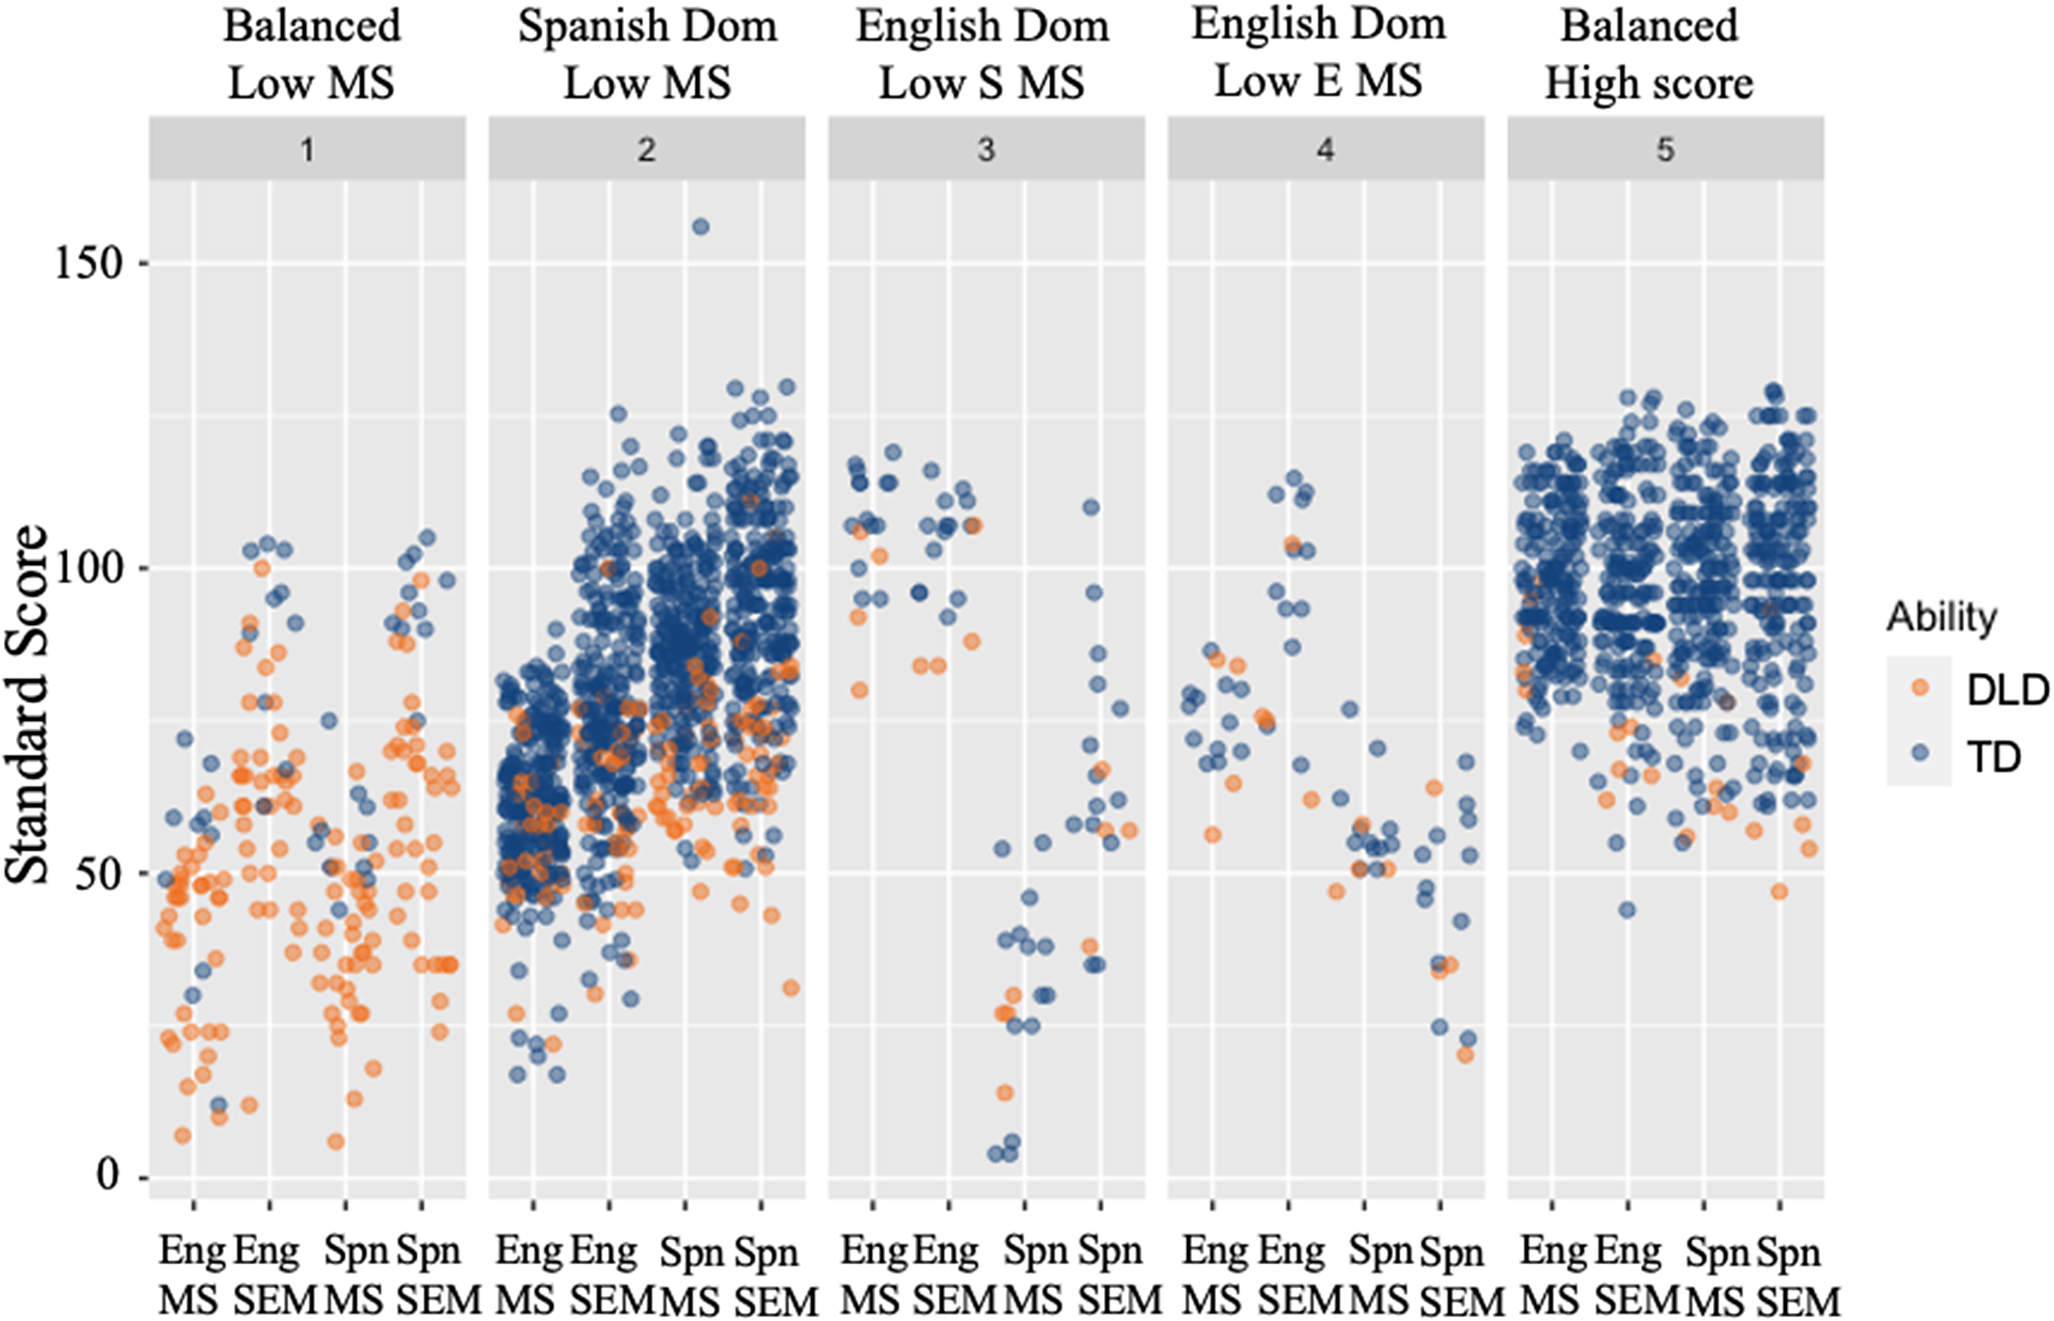
Figure 2. Distribution of children with and without developmental language disorder across the five profiles. Note: Eng MS = English morphosyntax; Eng SEM = English semantics; Spn MS = Spanish morphosyntax; Spn SEM = Spanish semantics.
Table 4. Number of children in each age group and language status group in each profile
Note: DLD = developmental language disorder; MS = morphosyntax; SEM = semantics; TD = typically developing.
Additionally, a multinomial logistic regression model was computed to examine whether language status is associated with profile membership. P-value and odds ratio (OR) were used to determine the significance and direction of the association. OR larger than 1 indicates that an increase in the independent variable is associated with a higher likelihood of being in that profile relative to the reference profile. OR smaller than 1 indicates that an increase in the independent variable is associated with a negative likelihood of being in that profile relative to the reference profile. Children are more likely to be in Profile 1 compared to all other profiles if they have DLD (Profile 2: p < .001, OR = 3.09; Profile 3: p < .001, OR = 2.53; Profile 4: p < .001, OR = 2.38; Profile 5: p < .001, OR = 4.64). Children are more likely to be in Profile 5 compared with all other profiles if they are TD (Profile 1: p < .001, OR = 4.64; Profile 2: p = .001, OR = 1.54; Profile 3: p = .003, OR = 2.10; Profile 4: p = .002, OR = 2.26). Note that language ability status was not significantly associated with group membership among Profiles 2–4.
4.3. RQ3. Do children’s demographic and language backgrounds align with profile characteristics?
First, we plotted children’s age, maternal education and English input/output in each profile. Figure 3 shows the distribution of the three variables in each profile. Table 4 shows the exact number of children in each age group in each profile. When examining the English input/output by profile figure (Figure 3A), we found that children’s input/output aligns with their profile characteristics, and children in the Spanish dominant profile (Profile 2) had less than 50% of English input/output, which corresponds to over 50% Spanish input/output. Children in the two English-dominant profiles (Profiles 3 and 4) had an average of 75% and 65% of English input/output (an average of about 25% and 35% of Spanish exposure). Children in Profile 5 (the balanced high-performance profile) had about the same input/output in English and Spanish (an average of 50.15% of English input/output).
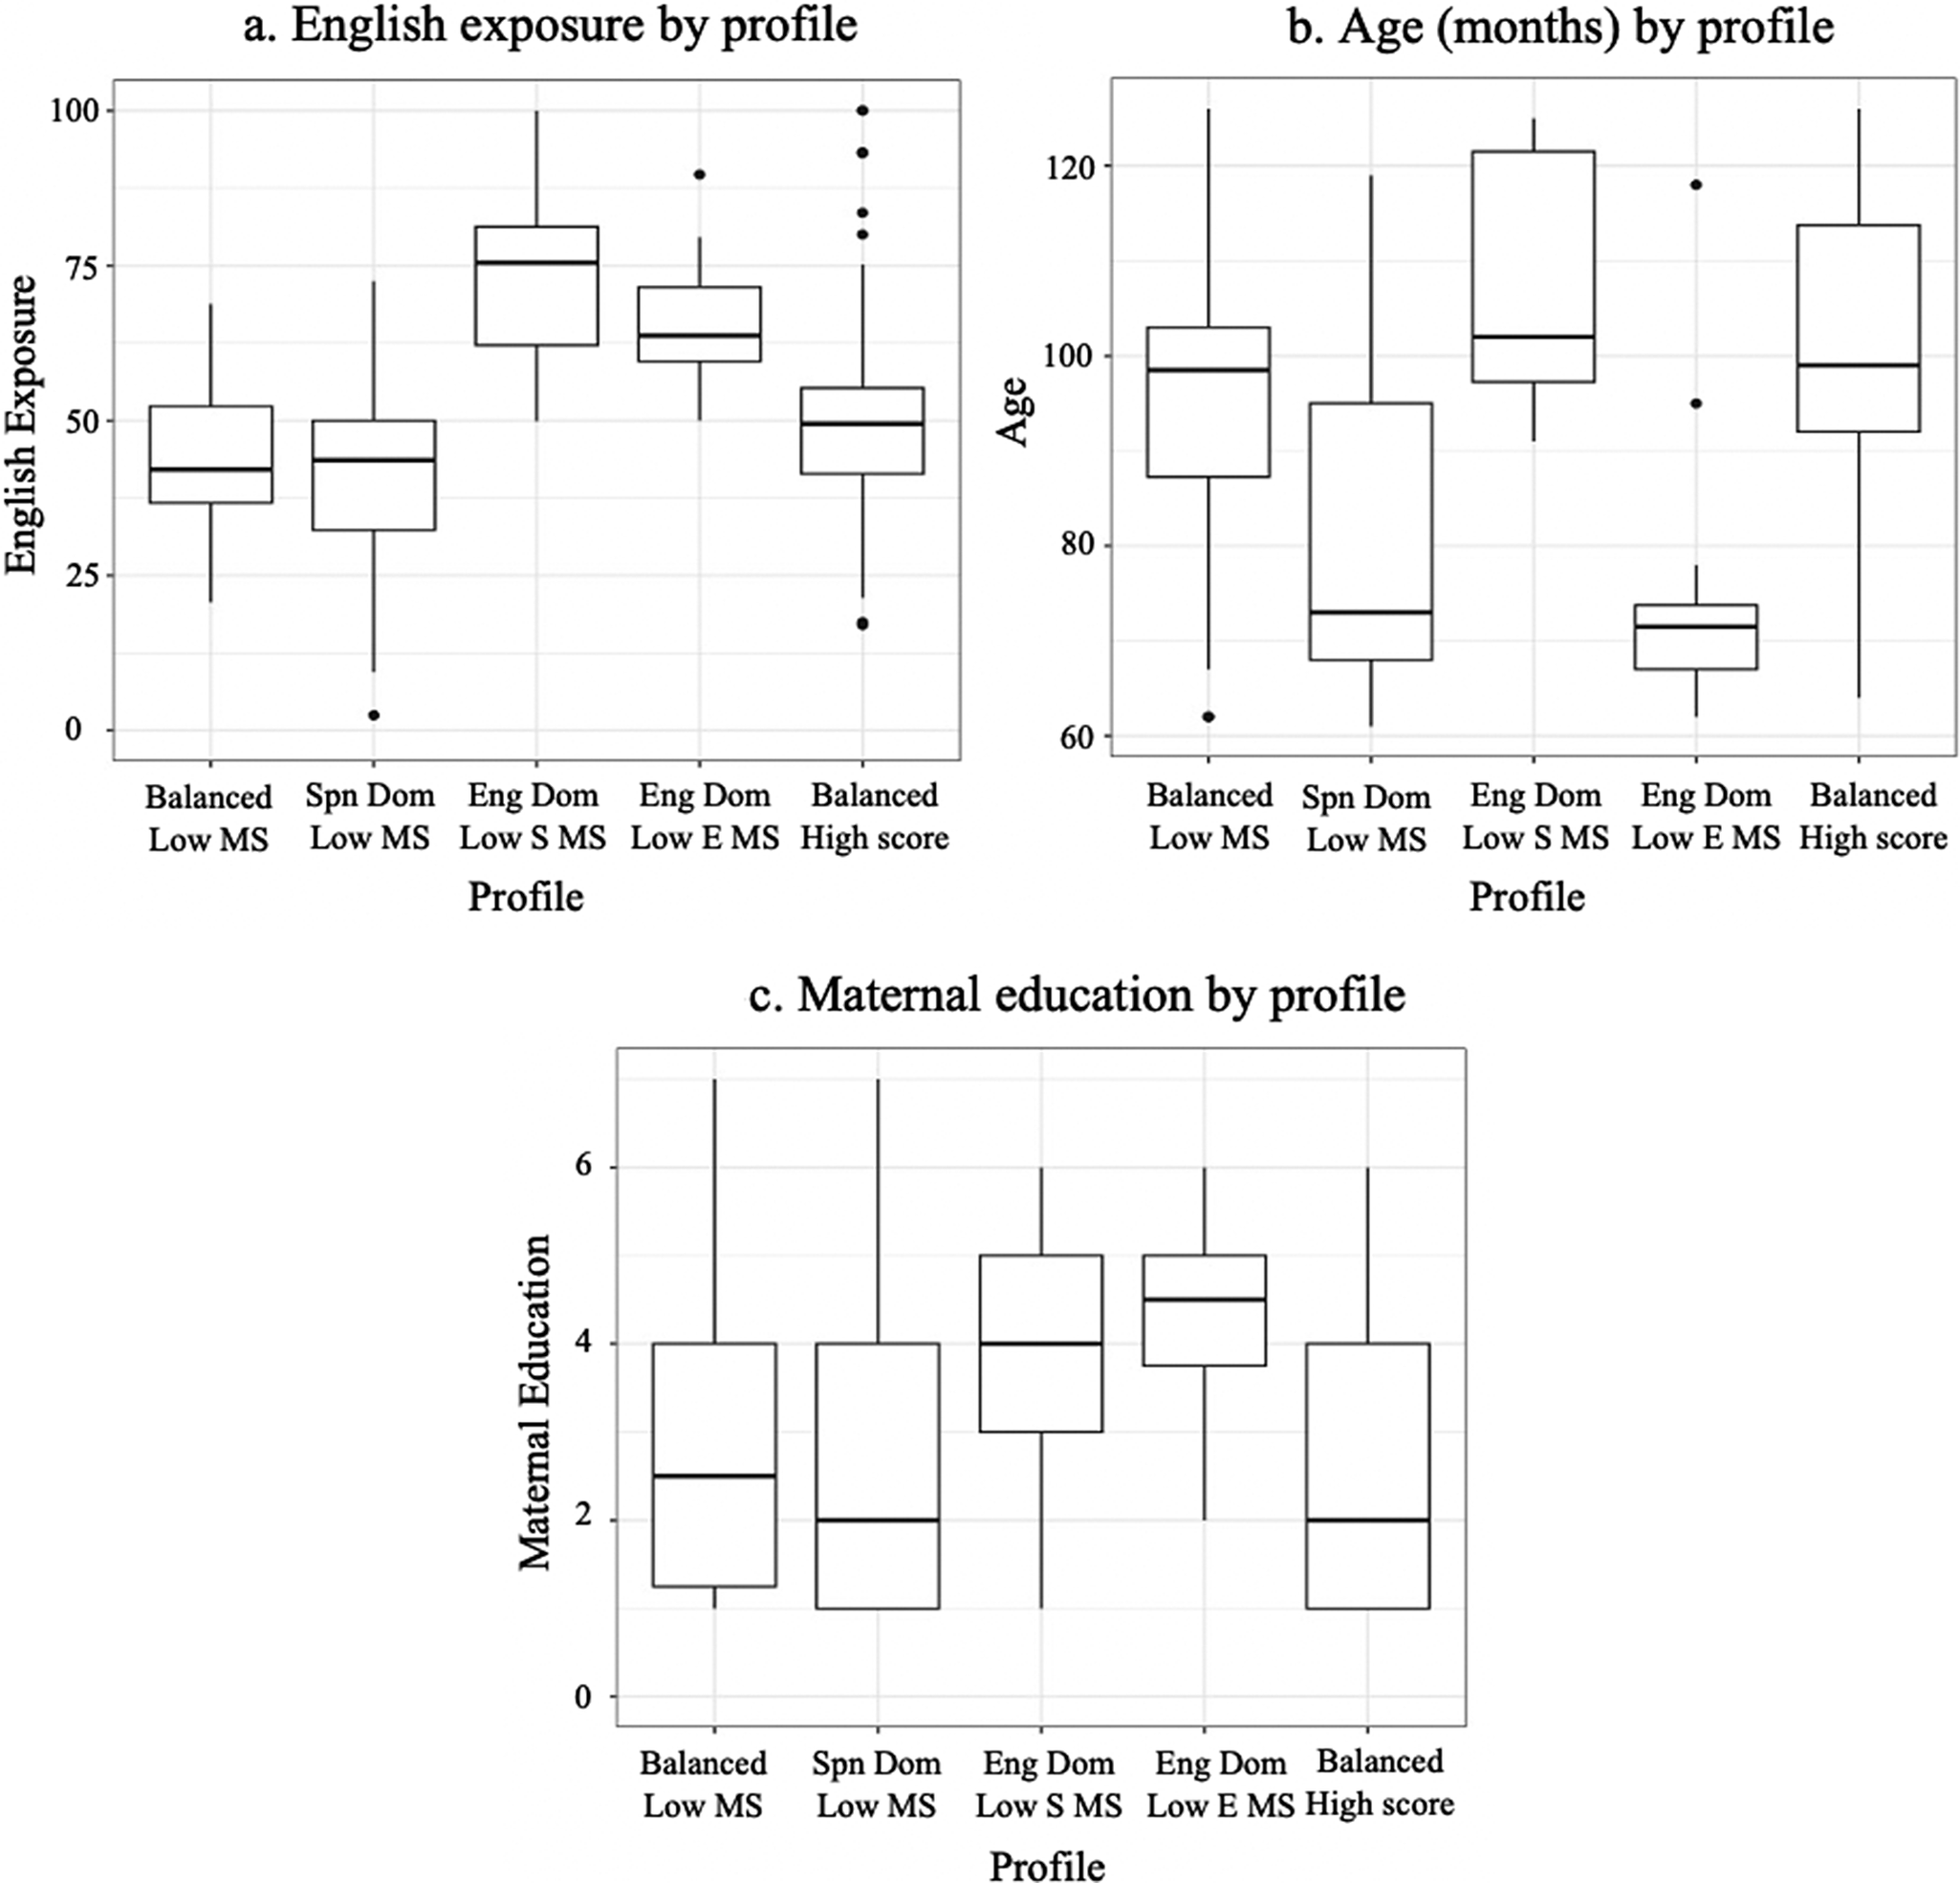
Figure 3. Distribution of background information (A: English exposure; B: age; C: maternal education) in each of the five profiles. Note: Balanced Low MS = balanced language, low morphosyntax profile; Spn Dpm Low MS = Spanish dominant, low morphosyntax profile; Eng Dom Low S MS = English dominant, low Spanish morphosyntax profile; Eng Dom Low E MS = English dominant, low English morphosyntax profile; Balanced High score = language balanced and high score across domains profile.
When examining age (Figure 3B), Profile 2, the only Spanish-dominant profile, included primarily young children, with the majority of the 5-year-olds being placed in this profile (109, 84.5% of 5-year-olds in the entire sample). Profile 5, the balanced high-performance profile, included mostly 7–9-year-old children. Profile 3 (English-dominant, low Spanish morphosyntax) included mostly older children, and Profile 4 (English-dominant, low English morphosyntax) included mostly younger children.
Children’s maternal education was also examined in the five different profiles (Figure 3C). The results showed that children in Profiles 1, 2 and 5 had similar maternal education, whereas children in Profiles 3 and 4, the two English-dominant profiles, had significantly higher maternal education compared with those in the other profiles.
Additionally, a multinomial logistic regression model was conducted to examine whether age, maternal education and English language input/output were associated with profile membership. Table 5 presents the results of the multinomial logistic regression. Similarly, p-value and odds ratio (OR) were used to determine the significance and direction of the association. OR larger than 1 indicates that an increase in the independent variable is associated with a higher likelihood of being in that profile relative to the reference profile. OR smaller than 1 indicates that an increase in the independent variable is associated with a negative likelihood of being in that profile relative to the reference profile.
Table 5 Multinomial logistics regression results for the models predicting profile membership from age, SES, first exposure to English and language exposure
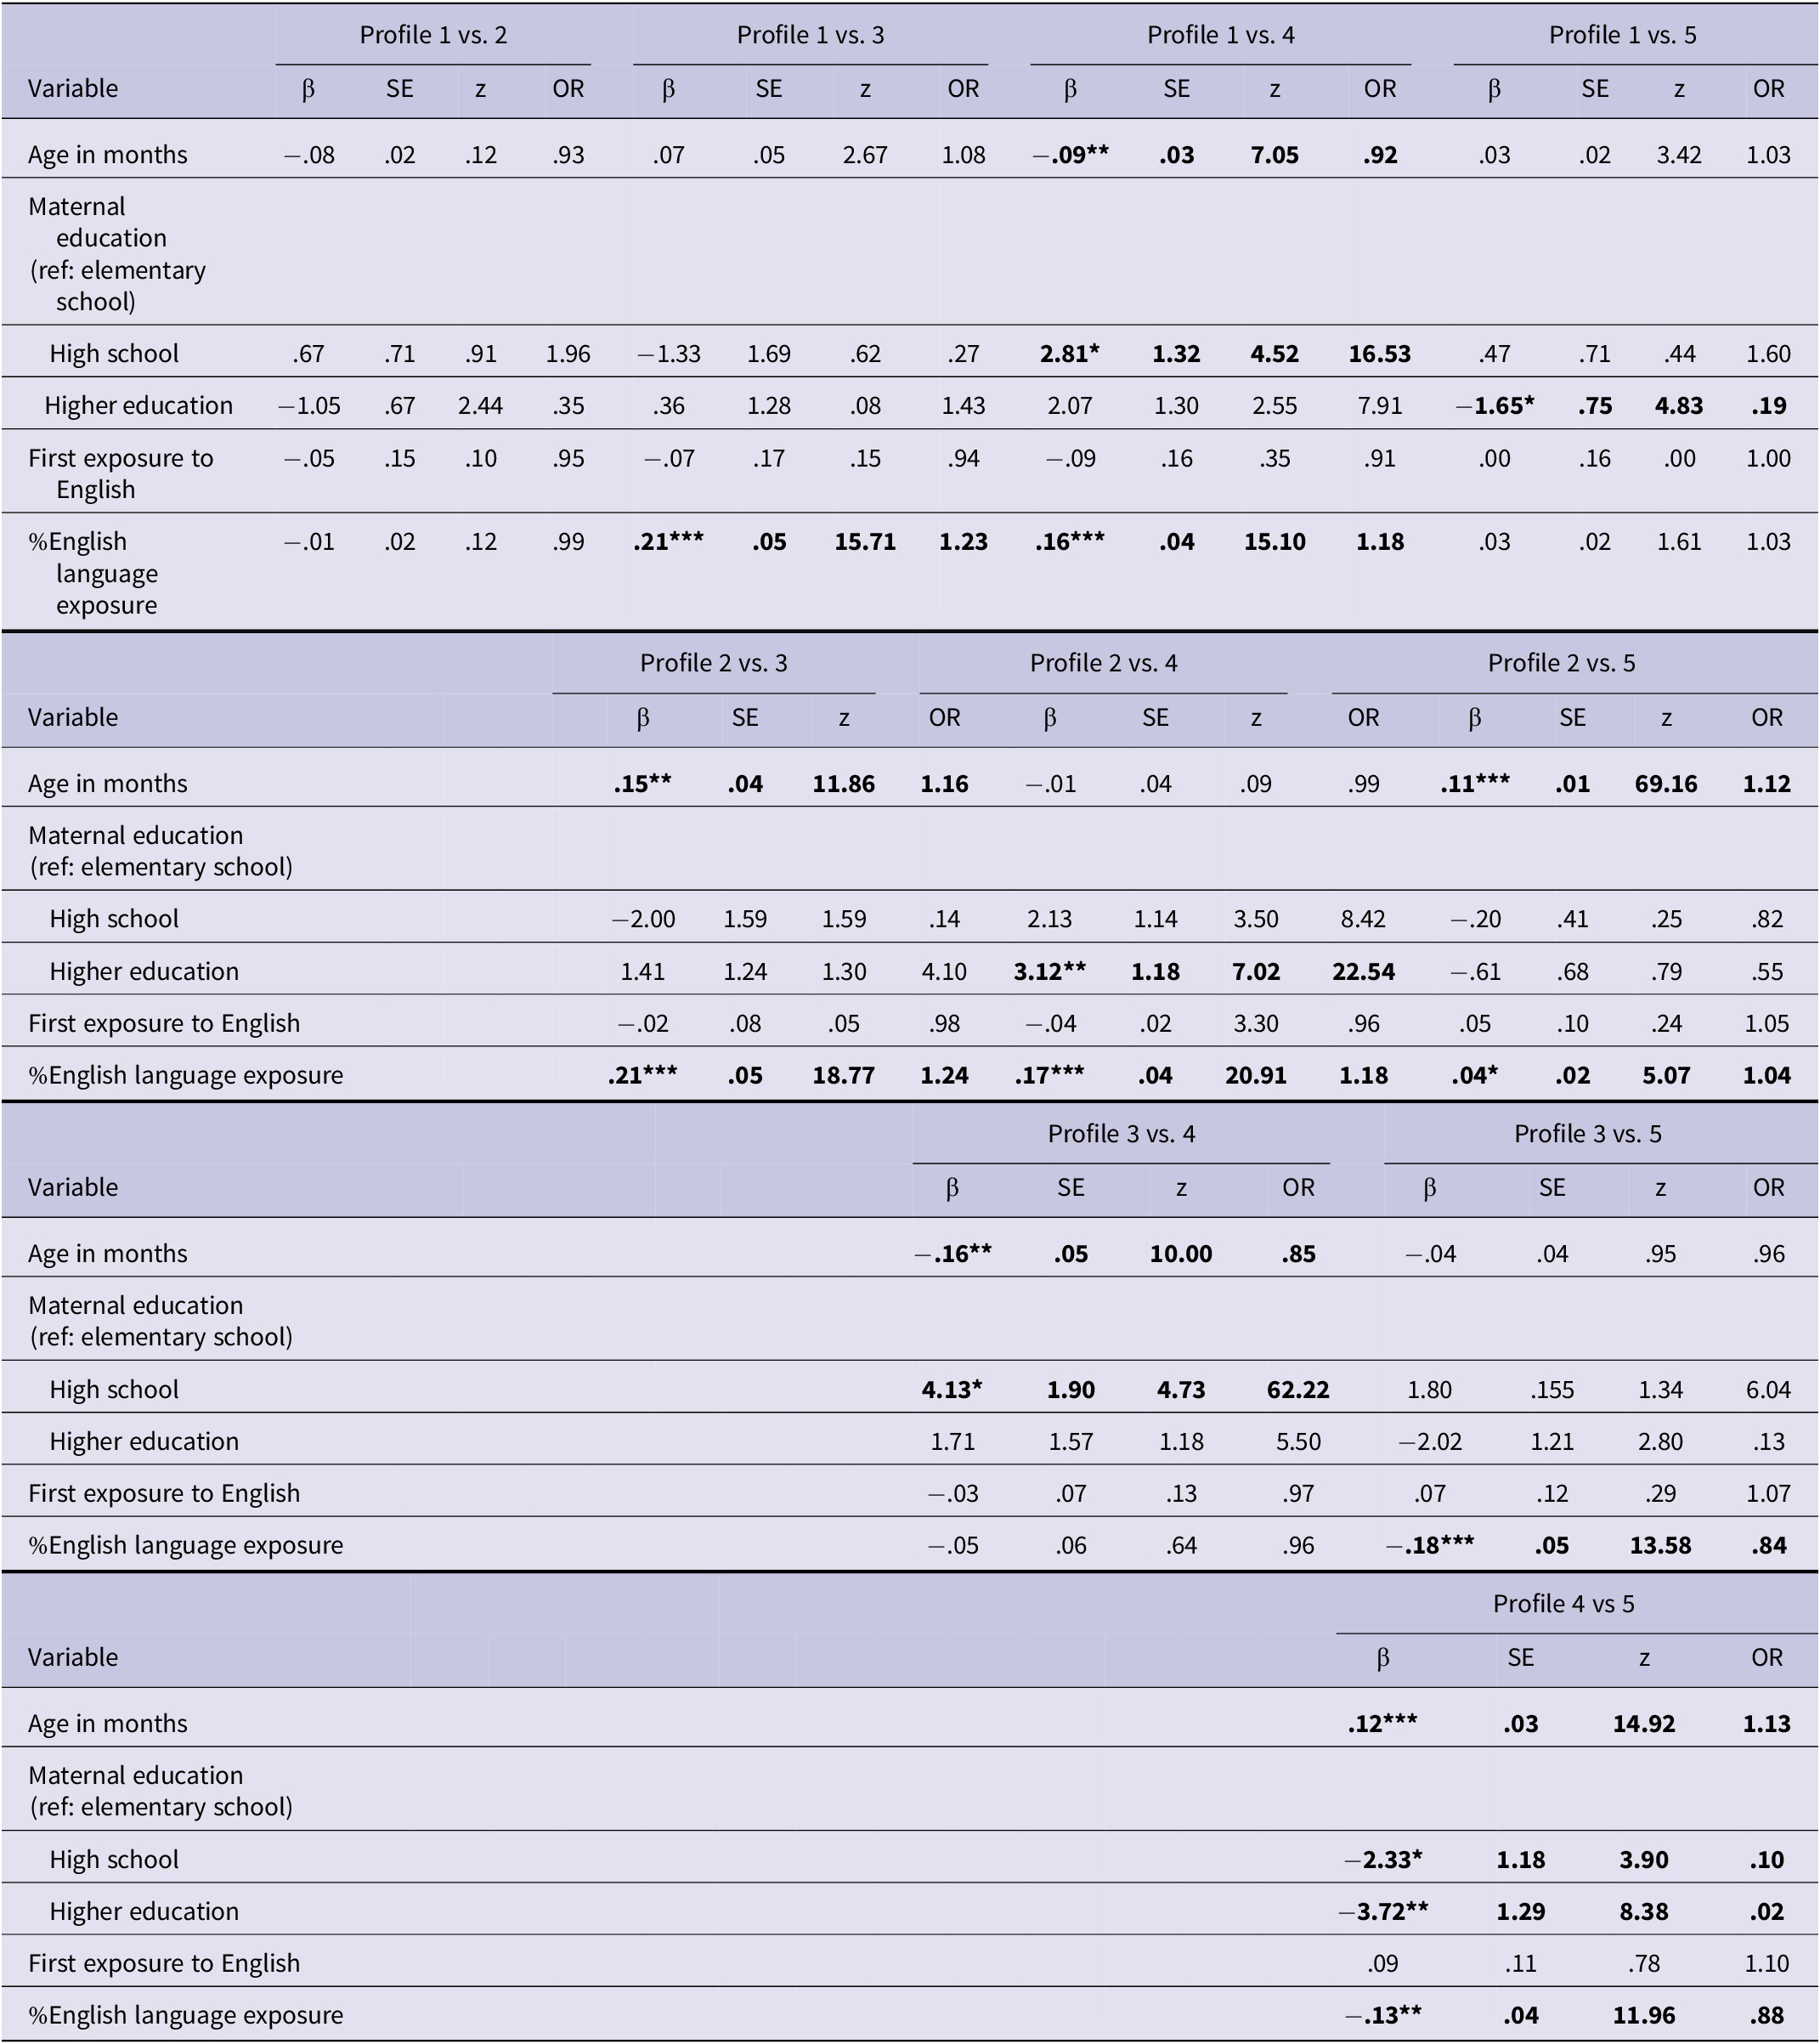
Note: *p < .05, **p < .01, ***p < .001.
Bold indicates the variable had p < .05 in the comparison.
Profile 1 versus Profile 3. Children are more likely to be in Profile 3 compared with Profile 1 if they have higher English input/output (p < .001).
Profile 1 versus Profile 4. Children are more likely to be in Profile 1 compared with Profile 4 if they are older in age (p < .01). On the other hand, children are more likely to be in Profile 4 compared with Profile 1 if they have a maternal education of high school (reference group below high school; p < .05) and if they have higher English input/output (p < .001).
Profile 1 versus Profile 5. Children are more likely to be in Profile 1 compared with Profile 5 if they have a maternal education of higher education (reference group: elementary school; p < .05).
Profile 2 versus Profile 3. Children are more likely to be in Profile 3 compared with Profile 2 if they are older in age (p < .01, OR = 1.16) and if they have higher English input/output (p < .001).
Profile 2 versus Profile 4. Children are more likely to be in Profile 4 compared with Profile 2 if they have a maternal education of higher education (reference group: below high school; p < .01) and if they have higher English input/output (p < .001).
Profile 2 versus Profile 5. Children are more likely to be in Profile 5 compared with Profile 2 if they are older in age (p < .001) and if they have higher English input/output (p < .01).
Profile 3 versus Profile 4. Children are more likely to be in Profile 3 than Profile 4 if they are older in age (p < .01). Children are more likely to be in Profile 4 than Profile 3 if they have a maternal education of high school (reference group: below high school; p < .05).
Profile 3 versus Profile 5. Children are more likely to be in Profile 3 compared with Profile 5 if they have higher English input/output (p < .001).
Profile 4 versus Profile 5. Children are more likely to be in Profile 5 than Profile 4 if they are older in age (p < .001). Children are more likely to be in Profile 4 compared with Profile 5 if they have higher English input/output (p < .01) and if they have a maternal education of high school (p < .05) and higher education (p < .01), both with a reference group of below high school.
5. Discussion
To understand the heterogeneity in bilingual children’s language development and examine how the variability in bilingual language learning intersects with DLD, we conducted an LPA on a group of Spanish–English bilingual children with and without DLD. Five different profiles were identified in the optimal LPA model in terms of language (Spanish and English) and domain (morphosyntax and semantics): a language-balanced, low morphosyntax (MS) relative to semantics (SEM) profile (Profile 1); a Spanish-dominant, low MS relative to SEM profile (Profile 2); two English-dominant profiles, one showing low Spanish MS relative to Spanish SEM (Profile 3) and the other showing low English MS relative to English SEM (Profile 4) and lastly, one balanced-language and high-performance across-domains profile (Profile 5). Children with DLD were primarily observed in Profiles 1 and 2, the two profiles that show lower morphosyntax than semantic scores across languages. Multinomial logistic regression further showed that language status (TD vs. DLD) was significantly related to membership of Profile 1, the balanced, low-performance, low-morphosyntax profile. Additionally, children’s background measures were examined in each of the five profiles, suggesting potential factors that contributed to the profile characteristics.
5.1. General language profile results
Our LPA results indicated five different profiles in a group of 529 Spanish–English bilingual children, suggesting the heterogeneity in bilingual language development. Seven studies were identified in the literature that examined language-related profiles in Spanish–English bilingual children, and three of them included oral language skills in Spanish and English (Halpin et al., Reference Halpin, Prishker and Melzi2021; Su et al., Reference Su, Rojas and Iglesias2022; Su et al., Reference Su, Rojas, de Villiers, Golinkoff and Iglesias2023).
Halpin et al. (Reference Halpin, Prishker and Melzi2021) conducted an LPA to examine the profiles of 161 Spanish–English children (3–5 years old) using the same standardized test as in the current study (BESA). All three subtests (morphosyntax, semantics and phonology) were included to form the profiles. There are some similarities observed between Halpin et al. (Reference Halpin, Prishker and Melzi2021) and our study. In Halpin et al. (Reference Halpin, Prishker and Melzi2021), the balanced bilinguals with low morphosyntax profile aligns with the characteristic of Profile 1 in our study; the high balanced bilinguals profile aligns with the characteristic of Profile 5 in our study; and the high English profile aligns with the characteristic of Profiles 3 and 4 in our study. However, Halpin et al. (Reference Halpin, Prishker and Melzi2021) did not observe two English-dominant profiles that differ from each other in morphosyntax versus semantics asymmetry as in Profiles 3 and 4 in the current study. Additionally, we did not include the phonology subtest and did not replicate the high Spanish and English phonology profile reported in Halpin et al. (Reference Halpin, Prishker and Melzi2021).
Su et al. (Reference Su, Rojas and Iglesias2022) and Su et al. (Reference Su, Rojas, de Villiers, Golinkoff and Iglesias2023) examined bilingual children’s language profiles using different measures, expressive (narrative measures) and receptive (QUick Interactive Language Screener: English-Spanish; de Villiers et al., Reference de Villiers, Iglesias, Golinkoff, Hirsh-Pasek, Wilson and Nandakumar2021), respectively. Both studies identified two balanced profiles: one with high language performance and the other with low language performance. In the current study, we also identified two language-balanced profiles, Profile 1 (low performance, balanced in language but not domain) and Profile 5 (high performance, balanced in language and domain). Of these three previous studies, Halpin et al. (Reference Halpin, Prishker and Melzi2021) and Su et al. (Reference Su, Rojas and Iglesias2022, Reference Su, Rojas, de Villiers, Golinkoff and Iglesias2023) only identified one English-dominant profile, and Halpin et al. (Reference Halpin, Prishker and Melzi2021) and Su et al. (Reference Su, Rojas and Iglesias2022) also identified one Spanish-dominant profile. Our study revealed one Spanish-dominant profile as well; however, two English-dominant profiles were observed. The two profiles differ from each other in whether children showed lower morphosyntax than semantics performance in English or Spanish. These two different English-dominant profiles contain the smallest number of children, 18 and 16, respectively, marginally over the 3% bar (a profile needs to contain at least 3% of the whole sample). This result may be specific to the participant sample in our study. Since LPA is a model-based method that generates profiles based on a probabilistic model describing the data distribution, even a small change in one part of the data distribution can influence the resulting profiles. All three previous studies only included TD children, and this study included both TD children and children with DLD. Thus, the additional data points from children with DLD may explain the two English-dominant profiles where children showed lower morphosyntax performance in either Spanish (Profile 3) or English (Profile 4).
5.2. Language profiles of bilingual children with DLD
By observation, children with DLD were primarily placed in Profiles 1 and 2, the only two profiles that are characterized by lower morphosyntax than semantics performance, which suggests that the bilingual children with DLD in our sample are characterized by unique difficulties in morphosyntax compared to semantics in both languages. This result aligns with the general findings in the literature that grammar is the hallmark deficit associated with DLD (Leonard, Reference Leonard2014) and is in line with the theoretical perspectives on the underlying mechanisms of DLD which manifest in grammatical learning (e.g., Ullman & Pierpont, Reference Ullman and Pierpont2005; Van der Lely, Reference Van der Lely2005). Our results corroborated that the underlying impairment and the hallmark morphosyntax deficit associated with DLD are manifested similarly in bilingual children. DLD affects children the same way regardless of the number of languages being learned and the difficulties should manifest in all languages children are exposed to (Håkansson et al., Reference Håkansson, Salameh and Nettelbladt2003; Kohnert, Reference Kohnert2010). Additionally, although the majority of children with DLD were placed in Profiles 1 and 2, they were observed across all five profiles (from low-performance to high-performance profiles, from language/domain-balanced to language/domain-unbalanced profiles), showing the variability in DLD. These results align with the study showing various profiles in children with DLD (Tambyraja et al., Reference Tambyraja, Schmitt, Farquharson and Justice2015) and the study emphasizing the individual differences and variabilities of language performance in children with DLD (Lancaster & Camarata, Reference Lancaster and Camarata2019).
The multinomial logistic regression results showed that children are more likely to be in Profile 1 compared with other profiles if they have DLD, and children are more likely to be in Profile 5 if they are TD. Profile 1 is characterized by low standard scores (a mean of 54.97 in English and a mean of 54.66 in Spanish) and lower performance in morphosyntax than semantics in both languages. Both are DLD characteristics documented in the literature. Children in Profile 1 might represent clear cases of DLD when examining their standardized test scores. Although children with DLD were also observed in Profile 2, the multinomial logistic regression showed that language status (DLD vs. TD) was not associated with membership in Profile 2. This could be attributed to the proportion of children with DLD in each profile: 78.2% of children in Profile 1 have DLD and 14% of children in Profile 2 have DLD. In addition, Profile 1 contained mostly older children with low performance (7–9 years old), whereas Profile 2 contained mostly younger children (5-year-olds). Children who are older and placed in the low language performance profile are more likely to have DLD; thus, DLD status is related to membership in Profile 1. Profile 5 is characterized by balanced performance across languages and domains, and children in Profile 5 have relatively higher performance compared with other profiles (a mean score of 97 in both Spanish and English). Children in Profile 5 could represent the clear-cut cases of typical development with high performance in both languages and in both morphosyntax and semantic scores when examining them using standardized tests.
5.3. Background factors
By observation, children’s background information aligns with profile characteristics, which includes different internal (e.g., age) and external (e.g., language experience) factors. Our youngest group (5-year-olds) was primarily placed in Profile 2, the only Spanish-dominant profile. The multinomial logistic regression also showed that children are more likely to be in Profile 2 if they are younger in age, specifically compared with Profiles 3 and 5. Age affects the social environment of children and has an impact on language via language exposure. For example, in the case of Spanish–English bilingual children in the United States, when bilingual children enter school, they have more exposure and formal instruction in English to meet academic and societal needs. Thus, children’s English competence may develop rapidly after school entry (e.g., Oller et al., Reference Oller, Pearson and Cobo-Lewis2007). Most of the 5-year-olds in the study had their first contact with English in the previous year during preschool and have not started systematically experiencing school environments that support English learning yet; thus, they were mostly home language (Spanish)-dominant. On the other hand, children are more likely to be in Profile 5 (balanced group across languages and domains) if they are older in age, specifically compared with Profiles 2 and 4. Older children (e.g., 7–10 years old) may have had experienced an English instruction environment for a longer time and exhibit more balanced English and Spanish skills.
Children’s language exposure also aligns with the profile characteristics in the current study, with the English-dominant profiles having the highest English exposure and the Spanish-dominant profile having relatively lower English exposure (which converts to more than 50% of Spanish exposure). In addition, children are more likely to be placed in Profile 5, the balanced high-score profile, compared with Profile 2, the Spanish-dominant profile, if they have higher English input/output. In addition, Profiles 3 and 4 are two English-dominant profiles. The multinomial logistics regressions showed that children are more likely to be placed in the two English-dominant profiles compared with Profiles 1 (balanced low-performance) and 2 (Spanish-dominant) if they have higher English input/output. These results align with the well-established association between exposure and proficiency in the literature (e.g., Jia & Aaronson, Reference Jia and Aaronson2003; Kim & Kim, Reference Kim and Kim2022).
Lastly, children in our two English-dominant profiles had higher maternal education compared with those in other profiles, especially Profile 4. The multinomial logistic regression showed that children are more likely to be placed in Profile 4 compared with Profiles 1, 2 and 5 if they have higher maternal education. This may potentially be explained by the fact that parents who were educated longer in an English-speaking country may have higher English skills and provide greater English input to their child, which leads to higher English proficiency in their children. However, specific data on parent’s English experiences and skills are needed to support this explanation. Results on the relationship between background factors and bilingual language profiles align with the DST, which emphasizes the dynamic relationships among potential internal (e.g., child’s age) and external (e.g., language experience) factors that affect children’s bilingual language performance.
5.4. Educational and clinical implications
In conjunction with other research, our study highlights the heterogeneity in bilingual language development. While the concept that bilingual children are not a linguistically uniform category is not a new idea, it is still, unfortunately, prevalent for professionals to view and address these children as a homogeneous group and employ uniform educational or clinical methods. The presence of these different potential profiles in language and domain emphasizes the need to establish differential support systems for bilingual children. In clinical settings, these results highlight the need to consider and evaluate bilingual children in all languages and all domains to get the totality of children’s language ability. For example, if a TD child in Profile 2 (Spanish-dominant low morphosyntax profile) is evaluated only in English morphosyntax, the child may be misdiagnosed as having a language disorder without considering performance in other domains and the other language. Lastly, as the children with DLD in our sample were characterized by lower morphosyntax than semantic performance, morphosyntax may be a better clinical marker of DLD in Spanish–English bilingual children, which has the potential to differentiate those with and without DLD.
6. Conclusions
We conducted an LPA on a group of 529 Spanish–English bilingual children with and without DLD. Five different profiles were identified, including one language-balanced low morphosyntax profile, one Spanish-dominant low morphosyntax profile, two English-dominant profiles and one language- and domain-balanced profile. The results indicated heterogeneity in bilingual language development. Children with DLD were primarily placed in the two low morphosyntax profiles, aligning with the notion that morphosyntax is the hallmark deficit associated with DLD, and it suggests that compared with semantics, morphosyntax may be a better clinical marker of DLD for Spanish–English bilingual children. Children’s age, language exposure and SES are associated with profile membership and could have been the factors that drove the different profiles in this sample. One limitation of this study could be the lack of detailed demographic characteristics to support the interpretation of results and future replication of this study (e.g., parent experiences and child’s detailed language-related experiences in different contexts).
Future studies could replicate these results in a different sample of Spanish–English bilingual children or in a different bilingual population to examine whether the profiles observed in the current study can be generalized across samples and language groups. In addition, future studies should evaluate the stability of the language profiles for bilingual children with and without DLD in different stages (e.g., kindergarten, third grade and fifth grade). The results will potentially inform educational programming and clinical decision-making for bilingual children.
Supplementary material
The supplementary material for this article can be found at http://doi.org/10.1017/S1366728925100102.
Data availability statement
Data are available upon request.
Funding statement
This work was supported by the grants R21 HD053223, R01 DC007439 and R01 DC010366 (Principal Investigators: Elizabeth D. Peña and Lisa M. Bedore) from the National Institute on Deafness and Other Communication Disorders (NIDCD). This report does not necessarily reflect the views or policy of NIDCD.
Competing interests
Elizabeth Peña, Aquiles Iglesias, and Lisa Bedore are authors of the Bilingual English Spanish Assessment (BESA) and receive royalties from its sales. The other authors have no competing interests to declare.


 Open access