


Highlights
-
• Assessment bias affects identification of developmental language disorder in bilinguals.
-
• Nonlinguistic cognitive processing tasks may reduce language assessment bias.
-
• Bilingual experience affected performance minimally on cognitive tasks.
1. Introduction
Bias can be defined as “any factor that distorts the true nature of an event or observation” (Kohnert et al., Reference Kohnert, Ebert and Pham2021, p. 153). In the context of language assessment, bias distorts the representation of an examinee’s true abilities, reducing the accuracy of results. In clinical settings, bias can lead to over-identification of a disorder, placing undue burden on the individual, family and systems of support that are often already scarce in resources. Bias can also lead to under-identification in these settings, potentially exacerbating symptoms and leaving the individual without much needed support. In research settings, bias reduces the accuracy and replicability of results, often in ways that systematically affect a demographic group (Heinrich et al., Reference Henrich, Heine and Norenzayan2010).
As bias is inherent in all human activities, it is not possible to completely eliminate it from assessment in clinical or research contexts. Instead, clinical professionals and researchers should work to reduce sources of bias in assessment. One population that may be particularly susceptible to assessment bias is bilingual children. Systematic bias is likely present in common approaches to the assessment of language abilities (e.g., Bedore & Peña, Reference Bedore and Peña2008; Castilla-Earls et al., Reference Castilla-Earls, Bedore, Rojas, Fabiano-Smith, Pruitt-Lord, Restrepo and Peña2020), leading to service inequities and knowledge gaps. One of the most notable areas of impact is in the identification of developmental language disorder.
1.1. Bias in the identification of developmental language disorder in bilingual children
Children with developmental language disorder (DLD; Bishop et al., Reference Bishop, Snowling, Thompson and Greenhalgh2017) are defined by impairments in spoken language in comparison to peers with similar language-learning experiences. DLD is a chronic condition with negative academic, occupational and socio-emotional impacts for affected individuals (Dubois et al., Reference Dubois, St-Pierre, Desmarais and Guay2020). Children with DLD are commonly eligible for educational or clinical services to address the disorder and its impacts, and it is therefore critical that identification be accurate. However, evidence indicates that DLD is both under-identified and inequitably identified across demographic groups (McGregor, Reference McGregor2020).
Sequential bilingual children, who learn a first language (L1) from birth and are exposed to a second (L2) in childhood, are particularly vulnerable to bias in DLD identification because of the variability in their language-learning experiences and subsequent language skills. Sequential bilingual children are heterogeneous in terms of the age of L2 exposure, the overall quantity of L1 versus L2 input and output, the contexts of L1 and L2 use, the quality of input and the extent of community support for each language (e.g., Paradis, Reference Paradis2023; Unsworth, Reference Unsworth, Nicoladis and Montanari2016). This variation in experience affects skills in both the L1 (e.g., Castilla-Earls et al., Reference Castilla-Earls, Francis, Iglesias and Davidson2019) and the L2 (e.g., Paradis & Jia, Reference Paradis and Jia2017). As a result, comparing a sequential bilingual child’s performance to monolingual normative standards in either language has limited diagnostic value (Bedore & Peña, Reference Bedore and Peña2008; Rose et al., Reference Rose, Armon-Lotem and Altman2022; Thordardottir et al., Reference Thordardottir, Rothenberg, Rivard and Naves2006). Such comparisons are inherently biased.
The difficulty in fairly assessing language ability among sequential bilingual children has attracted previous research attention. In particular, a large-scale European initiative, Language Impairment Testing in Multilingual Settings (LITMUS; see Armon-Lotem & Grohmann, Reference Armon-Lotem and Grohmann2021), developed and evaluated language assessment tools for the identification of DLD in bilingual populations. The LITMUS initiative has yielded multiple tasks that have successfully differentiated bilingual children with DLD from their unaffected bilingual peers, with particularly good evidence for nonword repetition (e.g., Chilla et al., Reference Chilla, Hamann, Prévost, Abed Ibrahim, Ferré, dos Santos, Zebib and Tuller2021; see Schwob et al., Reference Schwob, Eddé, Jacquin, Leboulanger, Picard, Oliveira and Skoruppa2021, for review and meta-analysis) and sentence repetition (e.g., Armon-Lotem & Meir, Reference Armon‐Lotem and Meir2016; Chilla et al., Reference Chilla, Hamann, Prévost, Abed Ibrahim, Ferré, dos Santos, Zebib and Tuller2021) tasks. However, even these promising tools remain best suited for comparing bilingual children to bilingual peers with similar experiences. For example, Armon-Lotem and Meir (Reference Armon‐Lotem and Meir2016) found that sentence repetition tasks were highly accurate for identifying DLD among Russian-Hebrew bilinguals, but only when separate cutpoints for bilingual and monolingual groups were used.
Given the tremendous variety of language pairs spoken by bilingual children worldwide, as well as the variability in exposure patterns noted above, it remains difficult to find a comparable peer group for many sequential bilingual children. There is value in investigating tasks that may be less sensitive to variations in bilingual experience than traditional linguistic measures, as they may offer a novel path to reducing assessment bias.
1.2. Rationale for nonlinguistic cognitive processing tasks in children’s language assessment
On the surface, nonlinguistic tasksFootnote 1 appear to offer little benefit for language assessment and the identification of DLD. However, a robust body of literature has indicated that children with DLD demonstrate weaknesses in basic cognitive processing abilities in comparison to unaffected peers, even when they are asked to process nonlinguistic information (such as visuospatial locations or auditory pure tones). More specifically, children with DLD show relative deficits on nonlinguistic assessments of processing speed (Ebert, Reference Ebert2021; Park et al., Reference Park, Miller, Sanjeevan, van Hell, Weiss and Mainela-Arnold2020; Zapparrata et al., Reference Zapparrata, Brooks and Ober2023), working memory (Everaert et al., Reference Everaert, Boerma, Selten, Gerrits, Houben, Vorstman and Wijnen2023; Vugs et al., Reference Vugs, Hendriks, Cuperus and Verhoeven2014) and sustained selective attention (Boerma et al., Reference Boerma, Leseman, Wijnen and Blom2017; Ebert et al., Reference Ebert, Rak, Slawny and Fogg2019; Ebert & Kohnert, Reference Ebert and Kohnert2011), among other skills.
It is possible that these cognitive processing difficulties contribute to DLD (Ladányi et al., Reference Ladányi, Persici, Fiveash, Tillmann and Gordon2020; Leonard et al., Reference Leonard, Weismer, Miller, Francis, Tomblin and Kail2007; Zapparrata et al., Reference Zapparrata, Brooks and Ober2023). For example, slowed processing speed might interfere with the intake and comprehension of verbal input, impacting language learning (Zapparrata et al., Reference Zapparrata, Brooks and Ober2023). Weaker sustained selective attention skills might similarly limit the processing of incoming linguistic stimuli (Boerma et al., Reference Boerma, Leseman, Wijnen and Blom2017). Thus, though there remains much to discover about the underlying causes of DLD, domain general processing weaknesses may contribute (Leonard et al., Reference Leonard, Weismer, Miller, Francis, Tomblin and Kail2007). Nonlinguistic cognitive processing tasks index these crucial underlying weaknesses and therefore provide important information in DLD assessment.
Nonlinguistic tasks also offer promise in reducing bias for bilingual children. Though many of the initial studies of cognitive processing in children with DLD were conducted in monolingual populations, more recent work has established that these weaknesses occur in bilingual populations with DLD as well (e.g., Boerma & Blom, Reference Boerma and Blom2020; Boerma et al., Reference Boerma, Leseman, Wijnen and Blom2017; Ebert, Reference Ebert2021; Ebert et al., Reference Ebert, Rak, Slawny and Fogg2019; Park et al., Reference Park, Miller, Sanjeevan, van Hell, Weiss and Mainela-Arnold2019; Park et al., Reference Park, Miller, Sanjeevan, van Hell, Weiss and Mainela-Arnold2020). In addition, the evidence to date has found that bilingual children with DLD perform similarly to monolinguals with DLD on cognitive processing skills (Boerma & Blom, Reference Boerma and Blom2020; Boerma et al., Reference Boerma, Leseman, Wijnen and Blom2017; Ebert et al., Reference Ebert, Rak, Slawny and Fogg2019; Park et al., Reference Park, Miller, Sanjeevan, van Hell, Weiss and Mainela-Arnold2019, Reference Park, Miller, Sanjeevan, van Hell, Weiss and Mainela-Arnold2020; cf., Ebert, Reference Ebert2021). These initial findings support consistent differences between children with DLD and their unaffected peers despite heterogeneity in language learning experiences (i.e., mono- versus bilingualism). In other words, performance on nonlinguistic cognitive processing tasks appears to be associated with language ability and dissociated with experiences learning a particular language.
The presence of group differences between children with DLD and typically developing peers on processing tasks is an important first step in the search for reducing assessment bias. However, group-level comparisons are insufficient to support their use for clinical identification. Beyond group-level comparisons, diagnostic accuracy analyses (including sensitivity, specificity and positive and negative likelihood ratios) are needed to indicate whether task performance can discriminate between individual children with and without DLD (Dollaghan, Reference Dollaghan2007; Ebert & Pham, Reference Ebert and Pham2019).
The potential for nonlinguistic cognitive processing tasks to contribute to DLD identification has been explored in two independent studies (Ebert & Pham, Reference Ebert and Pham2019; Park et al., Reference Park, Miller, Sanjeevan, Van Hell, Weiss and Mainela‐Arnold2021), with promising findings in both studies. Ebert and Pham (Reference Ebert and Pham2019) examined nonlinguistic assessments of visual processing speed and auditory working memory in two samples of children: one included 395 children aged 6 through 10 years, living in the United States and speaking either only English or both Spanish and English; the other included 55 children aged 5 to 6 years, living in Vietnam and speaking only Vietnamese. Both tasks showed the ability to discriminate between children with and without DLD in both samples, as evidenced by adequate sensitivity or specificity and moderate to highly informative likelihood ratios. Notably, diagnostic accuracy was generally maintained within the mixed sample that included both monolingual and bilingual children. However, there were few instances when the tasks achieved adequate sensitivity and specificity simultaneously (more commonly, one and not the other was obtained). In addition, the study was limited by retrospective analyses of data combined across separate studies.
Park et al. (Reference Park, Miller, Sanjeevan, Van Hell, Weiss and Mainela‐Arnold2021) also explored the utility of nonlinguistic processing tasks for identifying DLD in bilingual children. This study included 8- to 12-year-old children with DLD (n = 28 monolinguals, n = 12 bilinguals) and without DLD (n = 14 monolinguals, n = 12 bilinguals); all children spoke English, and children in the bilingual groups spoke a variety of L1s. Both nonlinguistic cognitive and linguistic measures were considered. As in Ebert and Pham (Reference Ebert and Pham2019), individual measures typically achieved adequate to good specificity or sensitivity, but not both. As a next step, Park et al. (Reference Park, Miller, Sanjeevan, Van Hell, Weiss and Mainela‐Arnold2021) conducted a binary logistic regression analysis to examine which combination of measures best predicted DLD status. In both bilingual and monolingual groups, a combination of linguistic and nonlinguistic measures yielded the best results, supporting the utility of nonlinguistic measures for DLD identification.
Thus, a robust literature supports the presence of domain-general cognitive processing weaknesses in children with DLD, within both monolingual and bilingual populations. An emerging literature suggests that these weaknesses may be able to assist in the identification of DLD, even within heterogeneous groups that include both monolingual and bilingual children. Presumably, nonlinguistic tasks would offer an advantage in heterogeneous groups by reducing assessment bias associated with differences in language-learning experiences. However, this claim is worthy of rigorous evaluation: are nonlinguistic tasks truly less biased for bilingual children?
1.3. Study purpose and questions
The purpose of this study is to examine potential bias in a set of nonlinguistic cognitive processing tasks, in comparison to more traditional language assessments. In this case, bias would exist if task results or task properties are influenced by language exposure. To provide a more rigorous test of this effect, we consider multiple aspects of language exposure, examining the impact of one language versus two, of different L1s in children learning two languages and of the amount of L1 versus L2 exposure.
It is unlikely that any task can be completely unbiased; therefore, we conduct parallel analyses of a traditional language assessment, sentence repetition, to index the extent to which bias is different in the nonlinguistic versus linguistic tasks. Sentence repetition was chosen because of its promise in identifying DLD in both monolingual and bilingual populations (Armon-Lotem & Meir, Reference Armon‐Lotem and Meir2016; Ward et al., Reference Ward, Polišenská and Bannard2024). It also appears to index overall language ability (Klem et al., Reference Klem, Melby-Lervåg, Hagtvet, Lyster, Gustafsson and Hulme2015), making it a reasonable choice for a linguistic comparison task.
This study addresses the following research questions:
-
1. Does exposure to more than one language influence performance on nonlinguistic cognitive processing tasks, in comparison to a language task?
-
2. Does exposure to more than one language influence key psychometric properties of nonlinguistic cognitive processing tasks, in comparison to language tasks?
-
a. Is internal consistency reliability adequate for both bilingual and monolingual children, and comparable across groups?
-
b. Is concurrent validity comparable across groups?
-
-
3. Do different aspects of bilingual experience influence task performance on nonlinguistic cognitive processing tasks?
-
a. Do bilingual children learning different L1s differ from each other in task performance?
-
b. Within a group of bilingual children, does the amount of L2 exposure influence task performance?
-
2. Method
The data for this study were collected as a part of a larger project and approved by the Institutional Review Board at the University of Minnesota. Written consent was obtained from parents and verbal assent was obtained from children prior to participation.
2.1 Participants
Participants were recruited from three data collection sites within the United States (Minneapolis, MN metropolitan area; San Diego, CA metropolitan area; Boston, MA metropolitan area). Participants were 5- to 7-year-old monolingual or bilingual children with typical development across all domains. More specifically, the eligibility criteria for participants included (1) age 5 years, 0 months through 7 years, 11 months; (2) exposed to English, Spanish, or Vietnamese at home, with school instruction in English and community exposure to English; (3) passed pure-tone hearing screening at 25 dB HL at 1000, 2000 and 4000 Hz in both ears; (4) passed near vision screening with or without corrective lenses; (5) scored within functional limits on a nonverbal IQ test, defined as a standard score at or above 70 on the Primary Test of Nonverbal Intelligence (PTONI; Ehler & McGee, Reference Ehrler and McGhee2008); (6) no history of any neurological deficits or disorders, such as head trauma, seizures or autism, per parent report; (7) no evidence of speech or language delays, defined by the absence of parent concern regarding speech or language as well as the absence of speech-language services per parent report and (8) no evidence of attention-deficit hyperactivity disorder (ADHD), defined as not meeting diagnostic criteria on the Vanderbilt ADHD Diagnostic Parent Rating Scale (Wolraich et al., Reference Wolraich, Lambert, Doffing, Bickman, Simmons and Worley2003).
These eligibility criteria matched those for the broader study, except for (7); in this study, we excluded children with speech or language concerns. For this study, we selected as many eligible participants as possible from the broader study to answer our specific research questions. All monolingual English-only (EO) participants who met eligibility criteria were included in the EO group, yielding a group of n = 66 children. For monolingual–bilingual comparisons, we set a minimum of 40% of home language input in the L1 (as measured by the Alberta Language Environment Questionnaire; see Measures for details); excluding children with less than 40% home language input maximized potential differences between monolinguals and bilinguals to create a more stringent test of possible group differences on our tasks of interest. We also included only Spanish-speaking children rather than both Spanish- and Vietnamese-speaking children, as the enrollment of Vietnamese-speaking children is substantially lower than Spanish-speaking children. The resulting Spanish-English bilingual (SBI) group included 70 children.
For questions about different aspects of bilingualism, including effects of the L1, we formed individually matched pairs of Spanish-bilingual and Vietnamese-bilingual children. Pairwise matching on an individual level (instead of a group level) provides stronger control for differences in background variables between groups (Czapka et al., Reference Czapka, Wotschack, Klassert and Festman2020). Because we had relatively few Vietnamese speaking children available but a larger group of Spanish-English bilinguals available for matching, this approach enabled us to include the Vietnamese speakers (and examine the effects of different L1s). We allowed a wider range of home language input (at least 10%) to examine the effects of variable L1 input and to enable greater inclusion of Vietnamese-speaking children. Each eligible Vietnamese-bilingual child was individually matched with a Spanish-bilingual child by chronological age (± 5 months), SES – as indexed by the highest reported parent education level (± 1 education level), and percentage of home language input in the L1 from the ALEQ (± 8%). We also examined sex and nonverbal IQ (NVIQ) as potential matching variables, but could not match on these two additional variables with the current sample. This process yielded a total of 20 matched pairs in the matched Spanish- and Vietnamese-bilingual groups (termed the VBI-match and SBI-match groups).
Thus, data from a total of 160 children were included in this study: 66 children in the EO group and 70 children in the SBI group for monolingual-to-bilingual comparisons in Research Questions 1 and 2), plus 20 children in the SBI-match (16 overlapping with the SBI group) and 20 VBI-match group for bilingual-to-bilingual comparisons in Research Question 3. Of the 205 children who had completed the broader study protocol, we ultimately excluded 27 due to the presence of parent concern about language development, 6 Vietnamese-English bilinguals who could not be matched, 11 Spanish-English bilinguals with <40% home exposure who could not be matched, and 1 child with missing data.
Descriptive statistics for each group of participants are provided in Table 1. For Research Questions 1 and 2, the EO and SBI groups differed in nonverbal IQ (NVIQ) and socioeconomic status (SES). For Research Question 3, VBI and SBI groups differed in NVIQ.
Table 1. Participant characteristics by group
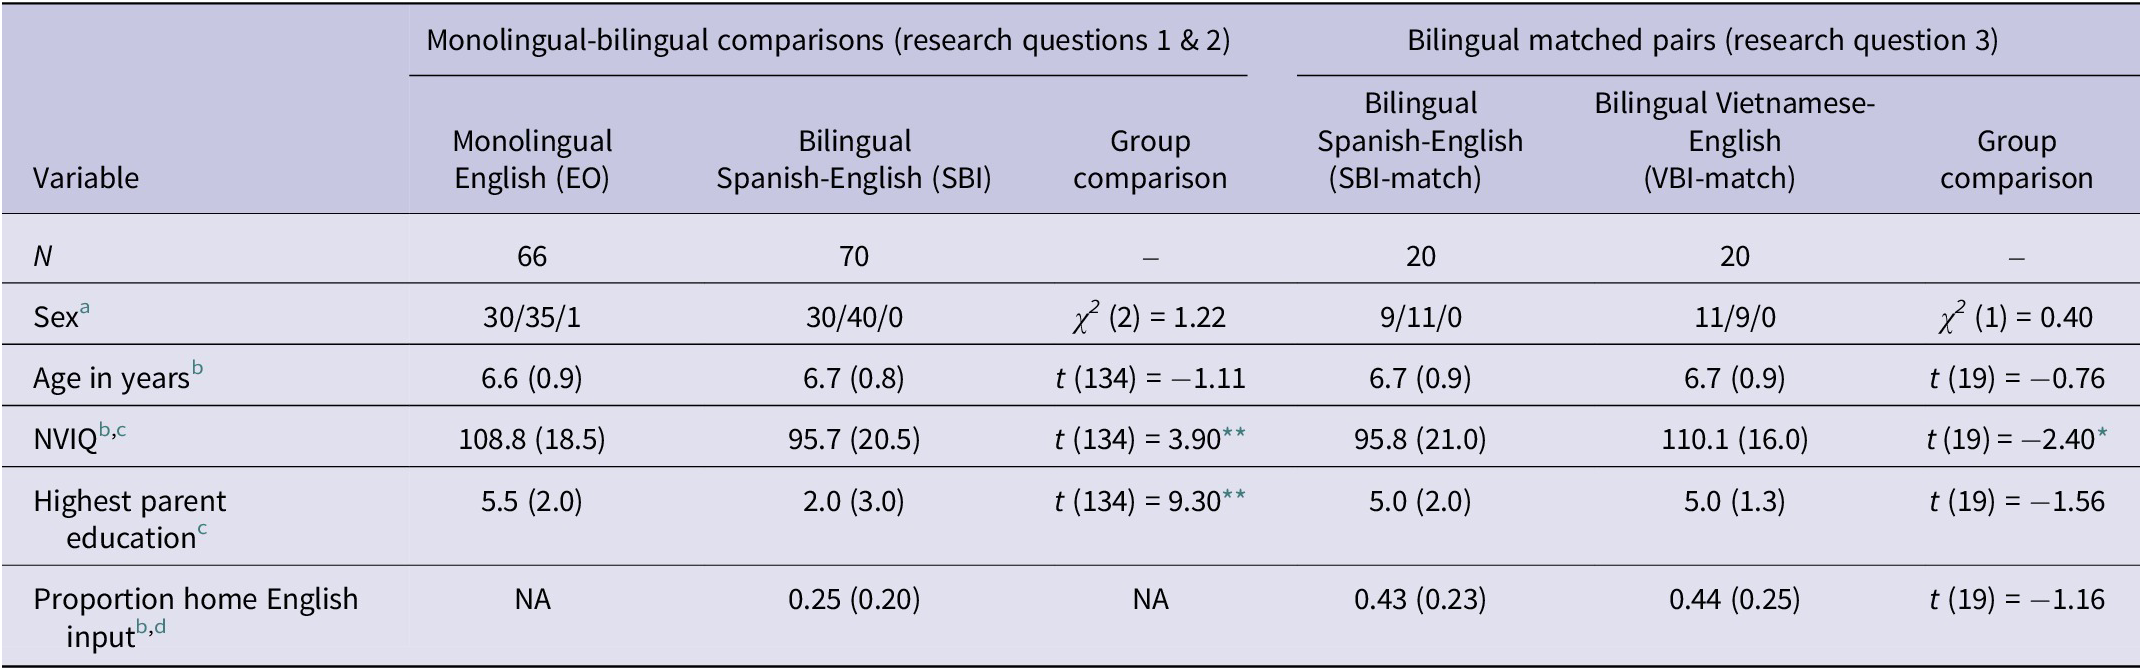
a Child’s sex as reported by the parent. Reported as male/female/other.
b Reported as Mean (SD).
c Highest level of education achieved by either parent. Reported here as median (interquartile range). Parent education was measured on an ordinal scale with the following values: 1 = Did not complete high school; 2 = High school graduate (or equivalent); 3 = Some college (1–4 years, no degree); 4 = Associate’s Degree (include occupational or academic degrees); 5 = Bachelor’s Degree (BA, BS, AB, etc.); 6 = Master’s Degree (MA, MS, MSW, etc.); 7 = Professional Degree (MD, JD, etc.); 8 = Doctorate Degree (PhD, EdD, etc.).
d Average input proportion score from the Alberta Language Environment Questionnaire.
* p < .05,
** p < .001.
2.2. Measures
Measures in this study include parent interview questionnaires, eligibility and language measures administered to children and the nonlinguistic cognitive processing assessments. Parent interviews contained three questionnaires. First, a researcher-generated background questionnaire included questions about parent’s education levels, children’s race and ethnicity, age, any significant health history and the presence or absence of speech-language services and parent concern regarding speech-language development. Next, parents completed one of two measures of language use. Parents of bilingual participants completed the Alberta Language Environment questionnaire (ALEQ; Paradis, Reference Paradis2010), which provides a comprehensive measure of home language input and output. In this study, we used the overall proportion of language input in the (non-English) home language from the ALEQ to index bilingual status. For children whose parents indicated that no languages other than English were used at home, a researcher-generated questionnaire was used to probe for any systematic exposure to non-English languages and to verify monolingual status. Finally, parents completed an abbreviated version of the Vanderbilt ADHD Diagnostic Parent Rating Scale (Wolraich et al., Reference Wolraich, Lambert, Doffing, Bickman, Simmons and Worley2003), which contained only the items included in diagnosing ADHD.
Parents completed these measures in their preferred language (English, Spanish or Vietnamese). For the Spanish version of the Vanderbilt measure, the University of North Carolina Spanish translation (American Academy of Pediatrics & University of North Carolina at Chapel Hill, 2005) was used. For the remaining measures in Spanish and for all measures in Vietnamese, research assistants fluent in the target language with educational backgrounds in speech-language pathology or related field conducted initial translations. Translations were then reviewed by lead researchers fluent in Vietnamese with doctoral degrees in speech-language pathology, with discussion regarding suggested adjustments.
Eligibility measures for children included hearing and vision screenings and a nonverbal intelligence test, the PTONI (Ehler & McGee, Reference Ehrler and McGhee2008). This study adhered to the published administration protocol for the PTONI and calculated standard scores for age with the published norms. All eligibility measures were completed in the child’s preferred language, following PTONI manual guidelines and corresponding instructions provided in English, Spanish and Vietnamese.
A more traditional language assessment measure, sentence repetition, was administered to compare the extent of bias across linguistic and non-linguistic tasks. All children completed a sentence repetition task in English, and this task was included in all study analyses. Task stimuli were from the Bilingual English-Spanish Assessment (BESA; Peña et al., Reference Peña, Gutiérrez-Clellen, Iglesias, Goldstein and Bedore2014) and the Bilingual English-Spanish Assessment: Middle Extension (BESA:ME; Peña et al., Reference Peña, Gutiérrez-Clellen, Iglesias, Goldstein and Bedore2018) with approval from the BESA authors. After combining the stimuli from these two assessments and eliminating duplicate sentences, there were a total of 12 English sentences. Stimuli were pre-recorded and presented via headphones, accompanied by PowerPoint slides that illustrated the child’s progress (see Pham & Ebert, Reference Pham and Ebert2020, for a detailed example). One practice item was given in the beginning and was repeated upon request. The testing items were only presented once.
Sentence repetition scoring followed an error-based scoring system, identical to the one used in the Clinical Evaluation of Language Fundamentals, Fifth Edition (Wiig et al., Reference Wiig, Semel and Secord2013; see also Pham & Ebert, Reference Pham and Ebert2020, for information about different sentence repetition scoring systems). If the sentence was repeated verbatim (i.e., with no errors), it was awarded 3 points; a sentence repeated with one to two errors was awarded 2 points; a sentence with three errors received 1 point and a sentence with four or more errors received 0 points. Points were summed across sentences in the task for a total score.
The task was scored in real time by the research assistant administering it; responses were also audiorecorded and research assistants were instructed to use the audiorecordings to confirm scoring decisions as needed. Once the initial scoring was completed, another research assistant conducted a second round of scoring using the audiorecording for all participants. Initial word-by-word agreement between the two scores was 98.7%. All disagreements were resolved through a consensus process between the original scorer and the second scorer.
2.2.1. Six nonlinguistic cognitive processing tasks
Participants completed six nonlinguistic cognitive processing tasks, including both visual and auditory assessments of processing speed, working memory and sustained attention. All tasks were presented on a computer through E-Prime 3.0 (Psychology Software Tools, 2018), and all responses were captured through a Chronos response box (Psychology Software Tools, 2019). Participants were asked to place the index finger of their preferred hand on a Velcro square placed in between the first two response buttons of the response box. They were instructed to return their finger back to the square after each response. Task instructions were provided in English, Spanish or Vietnamese language per participant preference.
The first pair of tasks assessed processing speed; these tasks were originally developed by Kohnert and Windsor (Reference Kohnert and Windsor2004). Both visual and auditory processing speed tasks follow a choice detection paradigm, in which participants must push an appropriate button based on what they heard or saw as quickly as possible. Participants first completed five practice trials with feedback. Each processing speed task consisted of 25 trials. For the visual processing speed task, either a red or blue dot appeared in the middle of the screen. For the auditory processing speed task, either a high- or low-frequency tone played through the headphones. The dependent variable of interest in both tasks is response time, calculated as the time in milliseconds from the onset of the stimulus to the completion of the button press. Each participant’s task score was calculated as the median response time for correct trials only.
The next pair of tasks, assessing working memory, were developed by Ebert (Reference Ebert2014) and Ebert et al. (Reference Ebert, Pham, Levi and Eisenreich2024). They utilize a paradigm that combines features of both the n-back and complex span tasks (for details, see Ebert et al., Reference Ebert, Pham, Levi and Eisenreich2024). Both visual and auditory tasks asked participants to compare two sequences of stimuli and judge whether they were the same or different. For the visual working memory task, the stimuli were butterflies that appeared within a six-square grid. Children were required to recall the position of each butterfly to determine whether the two sequences of positions matched. For the auditory working memory task, the stimuli were auditory pure tones, and the child was asked to determine whether the two sequences of tones matched. Children responded via button press to indicate whether the sequences were the same or different.
Each task began with two sets of demonstration items and three sets of practice items with feedback, which could be repeated at the examiner’s discretion. Following the practice phase, 16 trials were completed. For the first four trials, each sequence contained two stimuli; for example, the participant was asked to compare one two-tone sequence to a second two-tone sequence in the auditory task. If the participant answered the first four trials correctly, the sequence length increased to three. If not, the sequence length remained at two stimuli per sequence. Based on participants’ accuracy on previous trials, the task gradually increased up to a maximum of five stimuli.
The dependent variable from the working memory tasks is an accuracy score that accounts for the adaptive sequence length. The total number of items answered correctly at each sequence length is multiplied by the sequence length and then summed across all sequence lengths. For example, if a child got eight items correct with two items per sequence and two items correct with three items per sequence (but did not progress beyond this level), their score would be (8 × 2) + (2 × 3) = 22.
The final pair of tasks assess sustained selective attention. The auditory sustained selective attention task was adapted from Ebert (Reference Ebert2014) and the visual sustained selective attention task is detailed in Ebert et al. (Reference Ebert, Pham, Levi and Eisenreich2024). The tasks follow a go/no-go paradigm, which requires participants to attend a series of stimuli and choose a specific targeted stimulus over a lengthy period of time. For both attention tasks, participants were asked to push the response button every time they saw or heard a target stimulus while ignoring distractor stimuli. For the visual task, the target stimulus was a black square in the lower left quadrant of the screen. Distractor stimuli were black squares appearing in one of the other three quadrants. For the auditory task, the target stimulus was the sound of keys jangling and the distractor stimuli were other environmental sounds related to cars (a car starting, a car door opening and a race car engine revving).
For each task, a set of demonstration and repeatable practiced items with feedback were completed first, followed by the task trials. The auditory task contained 400 total trials and the visual task contained 320 total trials, with a 20% target rate in both tasks (i.e., 80 targets and 320 distractors for the auditory task, 64 targets and 256 distractors for the visual task).
The dependent variable for the sustained selective attention tasks is d’, an accuracy measure that combines hit rate (i.e., the proportion of targets the participant responds to) and false alarm rate (i.e., the proportion of distractors the participant responds to). A score of 0 indicates the participant is not discriminating between targets and distractors, whereas a score above 0 indicates the participant is more likely to respond to a target than a distractor.
2.3. Procedures
Parents completed the interview in person or over the phone at a time of their choosing. Children’s testing sessions were conducted in person in various settings (e.g., schools, libraries, homes and university labs) per participant preference and site permissions. The complete protocol for children, which contained additional tasks not included in the present study, lasted approximately 2–2.5 hours and was split across at least three sessions.
2.3.1. Analyses
For the six nonlinguistic cognitive processing tasks, computer-generated datafiles were compiled using Python scripts. Dependent variables were extracted using a custom R script for each task.
To index SES in analyses, we used the highest level of parent education. Parent education was reported on an ordinal scale from 1 = did not complete secondary school to 8 = completed doctorate-level degree. We used the highest level reported by either parent in the household. To index NVIQ in analyses, we used the standard score from the PTONI.
Our first research question considers whether exposure to more than one language influences performance on nonlinguistic cognitive processing tasks, in comparison to a language task. To answer this question, we conducted a multivariate analysis of covariance (MANCOVA) analysis with language group (monolingual versus bilingual) as a factor, and scores on the six nonlinguistic cognitive processing tasks plus the English sentence repetition task as dependent variables. Covariates in the model included age, SES and NVIQ. SES and NVIQ were included to control for between-group differences. Age was included to increase the precision of effects, given the expected impact of age on task performance. The multivariate analyses provided an indication of the overall bias based on language group membership. Subsequent examination of the univariate results provided results for each of the individual tasks.
To answer our research questions regarding the effects of bilingualism on the psychometric properties of the tasks (Research Question 2), we conducted two sets of analyses. First, we calculated the internal consistency reliability of each task, separately for the EO and SBI groups. Internal consistency reliability was calculated as split-half reliability using the Spearman-Brown prediction formula. Following Plante and Vance (Reference Plante and Vance1994), we interpreted reliability values above 0.8 as adequate and values above 0.9 as good. Because task reliability is important for all experimental tasks, we also calculated internal consistency reliability for the remaining two groups (SBI-match and VBI-match), although they were not included in this research question.
The second type of psychometric property we considered was concurrent validity. Because the tasks should assess underlying cognitive processing skills, scores on the tasks should be positively related. In particular, two tasks assessing the same construct (e.g., working memory) should be strongly related. Task scores would also be expected to increase with age, as the cognitive processing skills of interest should increase with development. To examine these relationships, we calculated Pearson correlations among the cognitive processing tasks, along with age, SES and NVIQ. English sentence repetition was included in the correlations to consider similarities and differences between this linguistic assessment task and our nonlinguistic assessment tasks. Correlations were conducted separately for the EO and SBI groups to enable comparison of concurrent validity across monolinguals and bilinguals.
Our final set of research questions (Research Question 3) considered whether different aspects of bilingual experience influenced performance on the nonlinguistic cognitive processing tasks. The SBI-match and VBI-match groups were the focus of these analyses. First, we considered whether the specific L1 for a bilingual child influences task performance. To do so, we conducted a MANCOVA comparing the two L1 groups (SBI-match versus VBI-match). Dependent variables again included scores on the six nonlinguistic cognitive processing tasks plus the English sentence repetition tasks. Because these groups were closely matched for age and SES but differed in NVIQ, only NVIQ was included as a covariate. Next, we examined whether the proportion of L2 input influences task performance by calculating correlations between task performance and home language input proportion from the ALEQ.
If some tasks show bias related to language experience (e.g., language assessments) and others do not (e.g., nonlinguistic cognitive processing assessments), then we would expect a mixture of significant and nonsignificant results. The multiple comparisons in our study increased the chances of a Type I error, yet over-correction for these comparisons would result in a lenient criterion for lack of bias. Therefore, we chose to apply a False Discovery Rate procedure (Benjamini & Hochberg, Reference Benjamini and Hochberg1995). We set the maximum False Discovery Rate at .05, meaning that the proportion of falsely rejected hypotheses is no greater than 5% across all hypotheses tested; this procedure controls for Type I error with a smaller loss of power than other methods (Benjamini & Hochberg, Reference Benjamini and Hochberg1995). Following these procedures, p values below .022 remained significant. In addition, we report effect sizes for all analyses to contextualize the magnitude of both significant and nonsignificant results.
3. Results
Before conducting analyses to answer our research questions, we examined group performance on each of the tasks of interest. Descriptive statistics for each of the six nonlinguistic cognitive processing tasks and the English sentence repetition task are displayed in Table 2 by group (EO, SBI, SBI-match, VBI-match).
Table 2. Task scores by group
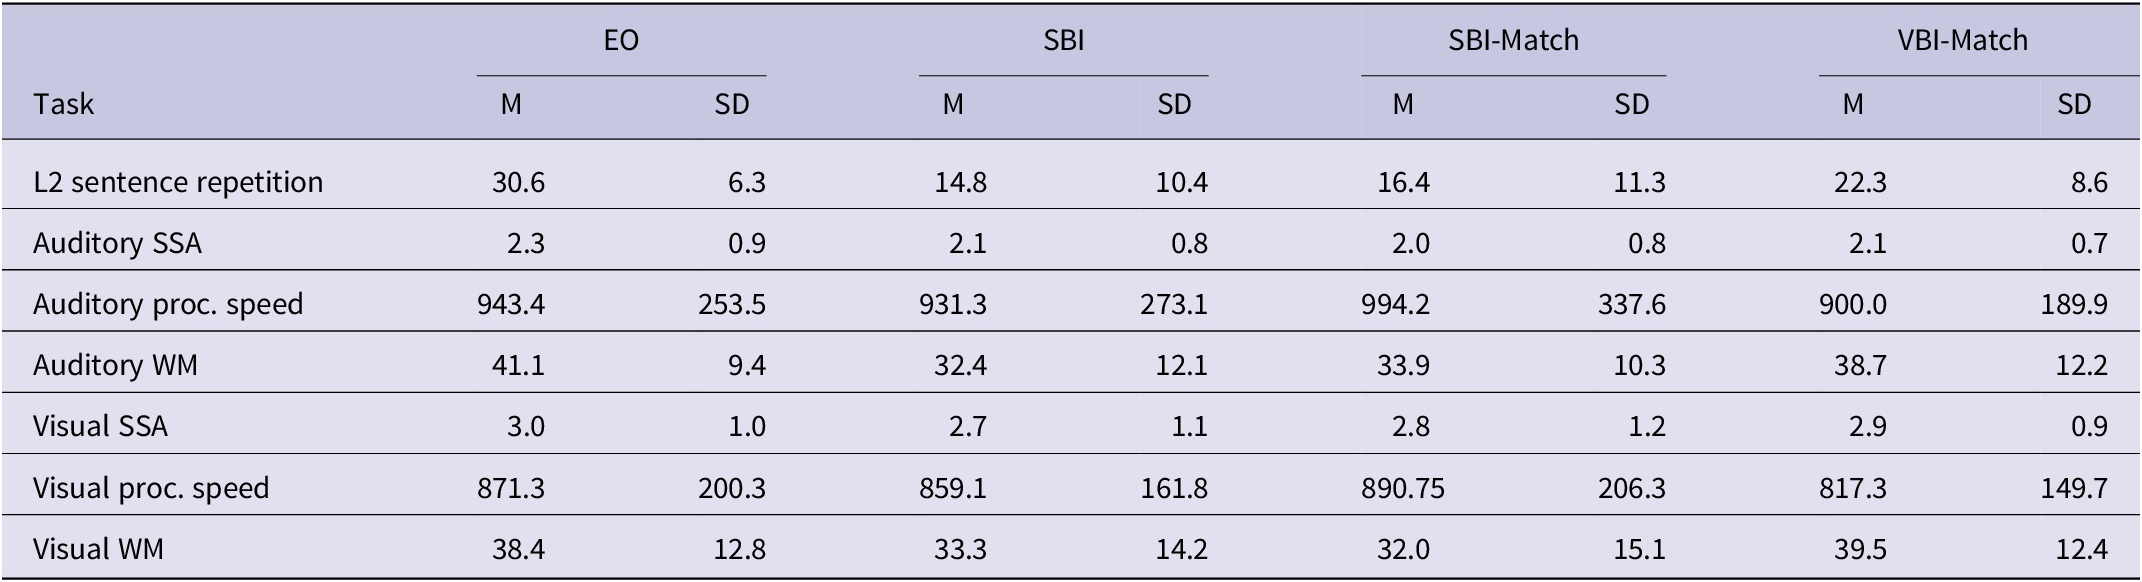
Note: L2 (English) sentence repetition is reported as total score; 36 is the task maximum. SSA (sustained selective attention) task results are reported as d-prime scores. Processing speed tasks are reported in milliseconds. WM (working memory) scores are weighted accuracy scores, with a maximum of 56.
For Research Question 1, we first verified that the data met assumptions for MANCOVA. Multivariate normal distributions were verified through visual analysis of P–P plots of residuals for each variable after inclusion of covariates. Correlations among residuals were all below r = .42, indicating minimal risk of multicollinearity. To examine equality of covariance matrices, we considered Box’s M (F(28, 62112) = 1.87, p = .003). Conventional guidelines indicate that Box’s M should be considered nonsignificant unless p < .001 (Tabachnick & Fidell, Reference Tabachnick and Fidell2019) and that MANCOVA analyses are robust against violations of the homogeneity of variance–covariance matrices assumption when group sizes are at least 30 (Allen & Bennett, Reference Allen and Bennett2008); therefore, we proceeded with the MANCOVA analysis.
The omnibus MANCOVA test using Pillai’s trace was significant for language group, V = .26, F(7, 125) = 6.34, p < .001. The SES covariate (V = .20, F(7, 125) = 4.46, p < .001) and age covariate (V = .50, F(7, 125) = 18.06, p < .001) were also significant, whereas the NVIQ covariate was no longer significant after the multiple comparison correction (V = .11, F(7, 125) = 2.26, p = .034).
Table 3 displays the univariate results for the MANCOVA. The age covariate was significant for all tasks, and the SES covariate was significant for all tasks except auditory working memory. The NVIQ covariate was significant only for the English sentence repetition task. The factor of interest, language group, was not significant for five of six nonlinguistic cognitive processing tasks, indicating no difference between bilingual and monolingual performance on visual and auditory processing speed, visual and auditory sustained selective attention and visual working memory. There was, however, one group difference found in auditory working memory. On this task, the EO group outperformed the SBI group, with language group explaining 6.7% of the variance in performance. Language group was also significant on the linguistic assessment task, English sentence repetition, with estimated marginal mean scores of 28.0 for the EO group and 17.3 for the SBI group. Language group accounted for 22.1% of the variance in sentence repetition performance.
Table 3. Univariate effects within the MANCOVA model comparing monolingual and bilingual children
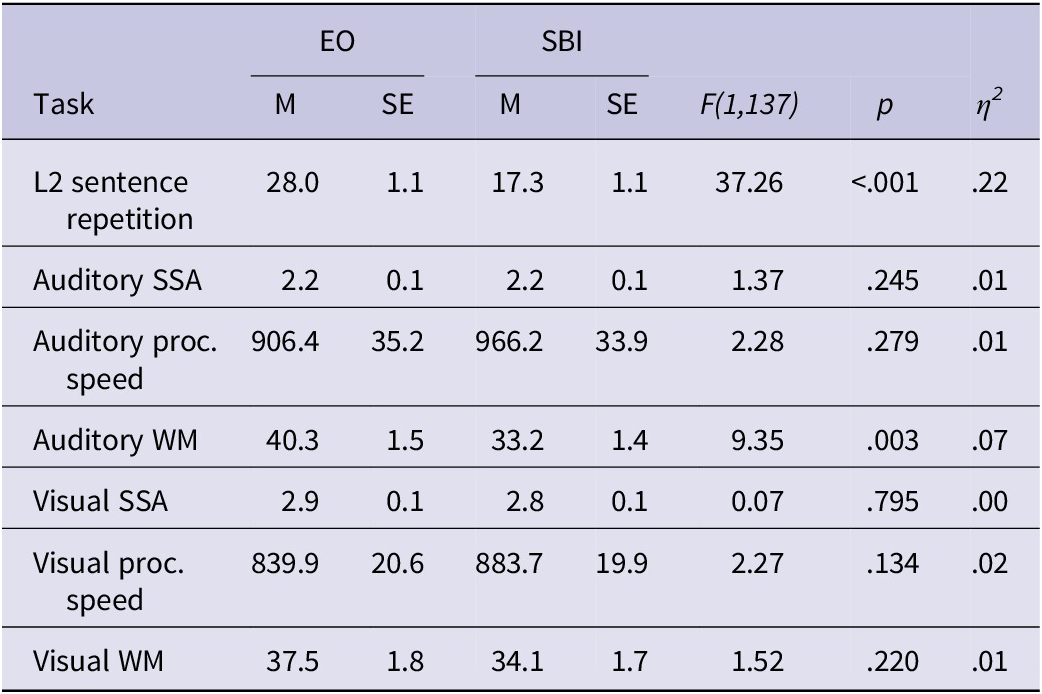
Note: Univariate models for each task included the following covariates: age, NVIQ, and SES. EO and SBI columns report group means and standard errors for each task, adjusted for covariates. SSA = sustained selective attention, WM = working memory.
To answer Research Question 2, we first calculated internal consistency reliability for each of the six nonlinguistic cognitive processing tasks and the English sentence repetition task. Figure 1 displays reliability scores for all four groups; only the two groups included in the research question (EO & SBI) are interpreted here. Reliabilities exceeded the good threshold for both the EO and SBI groups for both auditory and visual sustained attention as well as visual working memory and visual processing speed. For the auditory processing speed task, the reliability for the EO group was good but the reliability for the SBI group was slightly lower, falling in between the good and fair thresholds. For the auditory working memory task, reliability for the EO group fell below the fair threshold. Reliability for the SBI group neared but did not reach the good threshold. On the sentence repetition task, internal consistency reliability was fair for both EO and SBI groups.
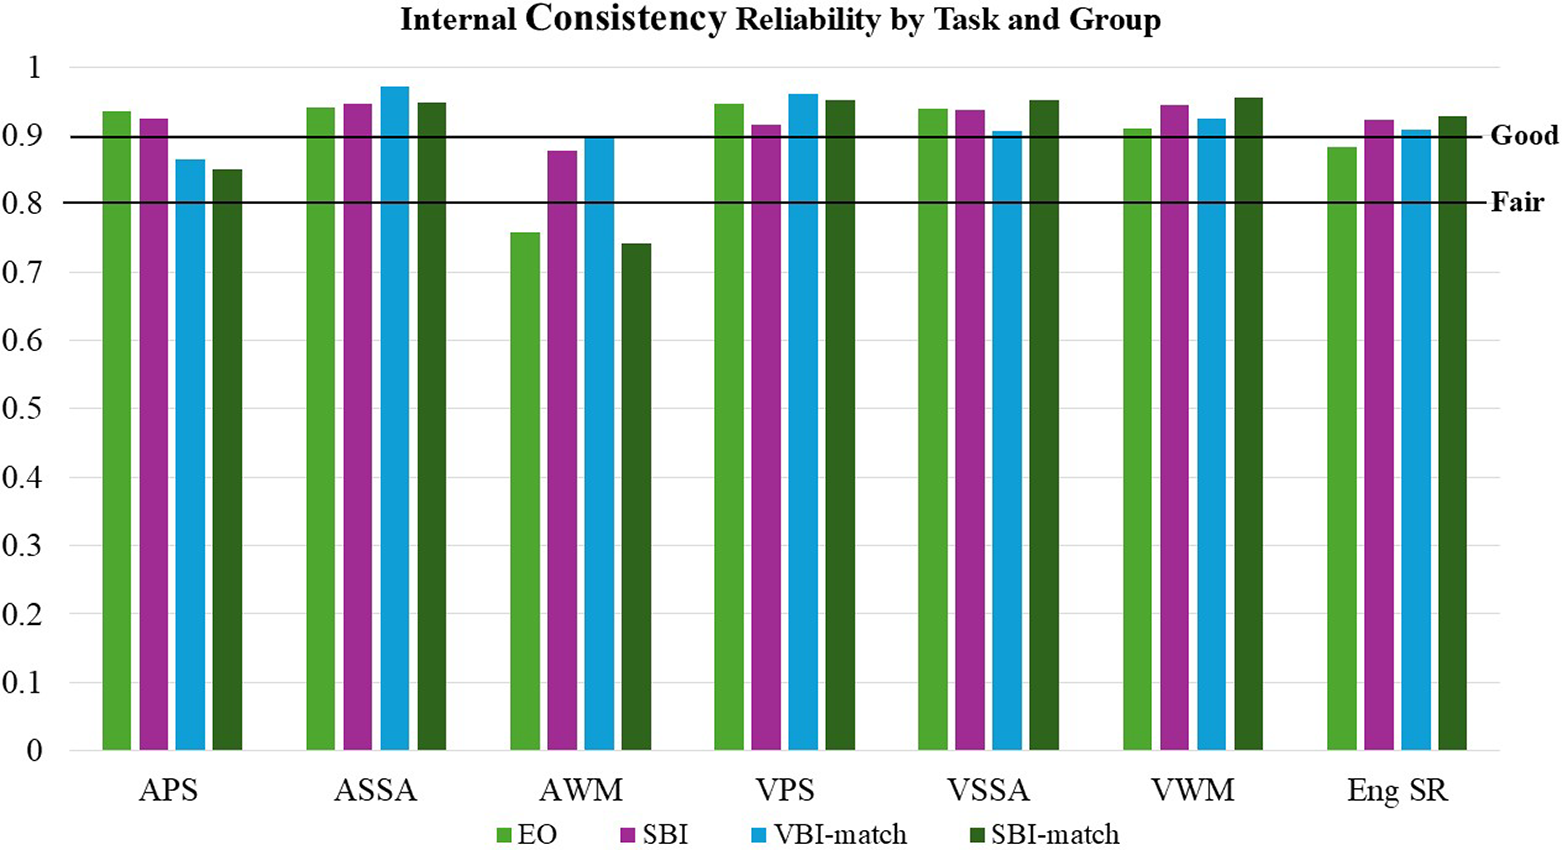
Figure 1. Internal consistency reliability on each task by group.
Table 4 displays the concurrent validity for the nonlinguistic cognitive processing tasks and linguistic assessment task, as measured by Pearson correlations. Within each group, tasks assessing the same construct (e.g., processing speed) in different modalities (visual and auditory) were strongly correlated. These within-construct correlations ranged from r = .39 to r = .60 in the EO group and from r = .40 to r = .53 in the SBI group, demonstrating medium to large effect sizes (Cohen, Reference Cohen1988) for these relationships. As anticipated, age correlated positively with the nonlinguistic cognitive processing tasks in both the EO and SBI groups; correlations with age were significant for all tasks except auditory processing speed in the SBI group and for all tasks other than auditory working memory in the EO group. The magnitude of these correlations reveals moderate to strong associations between age (an index of maturation) and performance on cognitive processing tasks. Finally, neither NVIQ nor SES correlated with performance on any of the six nonlinguistic tasks in either group, showing a lack of association between the processing tasks and a static cognitive assessment (NVIQ) as well as parental education. Again, results are consistent across EO and SBI groups.
Table 4. Pearson correlations among task scores and participant characteristics for monolingual and bilingual groups
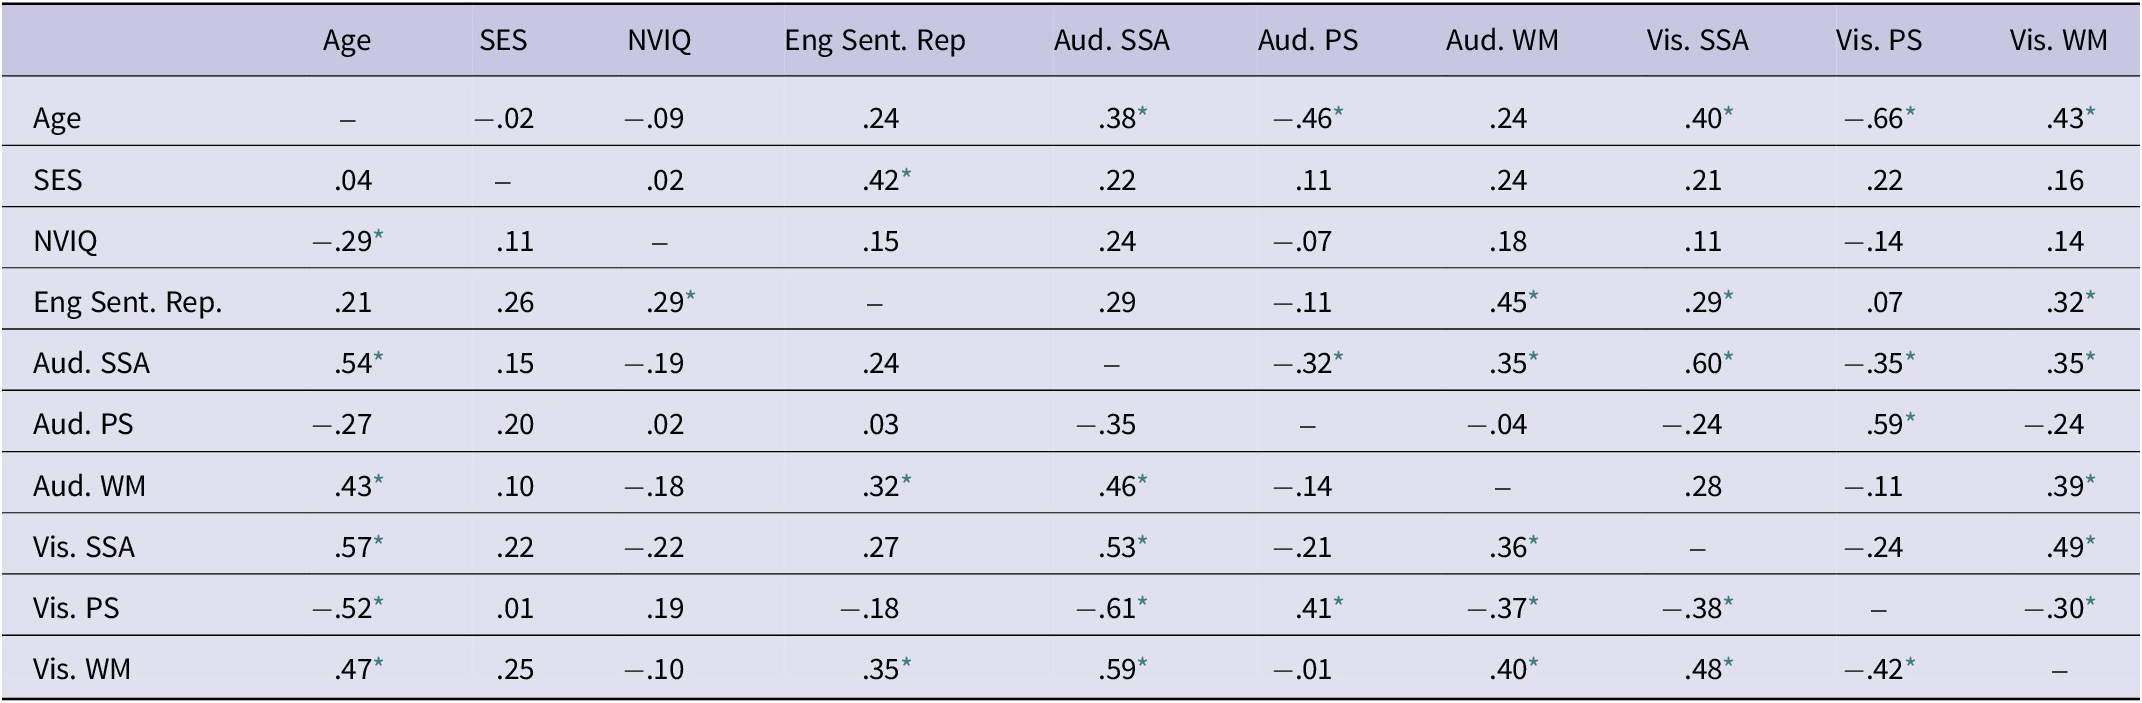
Note: Correlations for the EO group appear above diagonal. Correlations for the SBi group appear below the diagonal. PS = processing speed, SSA = sustained selective attention, WM = working memory.
* Significant correlation after controlling for multiple comparisons.
In contrast, the traditional language assessment, sentence repetition, correlated significantly with SES but not age or NVIQ in the EO group, and with NVIQ but not age or SES in the SBI group.
To answer Research Question 3a, we conducted a MANCOVA comparing the SBI-match and VBI-match groups. We again verified assumptions of MANCOVA before interpreting results, including multivariate normal distributions (verified by plotting residuals, as above), absence of multicollinearity (all correlations among residuals were at r = .67 or lower) and equality of covariance (Box’s M = 28.9, F(28, 5031) = 0.83, p = .73). The omnibus test using Pillai’s trace, was significant for the covariate, NVIQ: V = .54, F(7, 39) = 5.26, p < .001. The omnibus test for the factor of interest, language group, was not significant: V = .19, F(7, 39) = 1.03, p = .43. Univariate effects were not examined due to the multivariate test result.
Finally, for Research Question 3b, we tested whether there was a relationship between the amount of L2 (English) input and task performance for bilingual children. Pearson correlations between the proportion of L2 used in the home and task score were not significant after multiple comparison correction for any of the six nonlinguistic cognitive processing tasks (auditory sustained selective attention, r(38) = .26, p = .34; auditory processing speed, r(38) = −.22, p = .34; auditory working memory, r(38) = .36, p = .12; visual sustained selective attention, r(38) = .44, p = .05; visual processing speed, r(38) = −.19, p = .43; visual working memory, r(38) = .16, p = .50). In contrast, correlations between L2 input and the linguistic assessment task, English sentence repetition, were significant: r (38) = .60, p = .005.
4. Discussion
The evaluation of bias is critical for children’s language assessment, particularly for the identification of DLD among linguistically diverse populations. In this study, we conducted a rigorous evaluation of assessment bias related to language exposure within a set of six nonlinguistic cognitive processing tasks using bilingual-to-monolingual comparisons and bilingual-to-bilingual comparisons. We also examined bias in a more traditional language assessment, sentence repetition, as a comparison to the cognitive processing tasks.
Our first set of research questions compared monolingual versus bilingual children on the nonlinguistic cognitive processing and sentence repetition tasks, in terms of performance differences as well as psychometric properties. We found that language exposure did not influence performance on five of the six cognitive tasks, indicating comparable performance on these tasks across bilinguals and monolinguals. These same five tasks showed good internal consistency reliability for both monolingual and bilingual children. On the sixth task, auditory working memory, bilinguals performed below monolinguals and reliability differed between groups, pointing to bias in this task. However, the extent of bias is placed into context via comparison with the sentence repetition results: bilingual status explained 5.4% of variance in auditory working memory performance but 23.6% of variance in sentence repetition performance. Thus, the extent of bias against bilinguals appears small for one nonlinguistic cognitive processing task and nonsignificant for the five others.
These results do suggest additional examination of the auditory working memory task is warranted. This task is arguably the most complex for children to understand, as they must grasp the concept of tone sequences, group the tones they hear and determine whether the groups match. As such, children may be more reliant on the task instructions, or more likely to use verbal mediation to complete the task. As we noted earlier, no task is completely nonlinguistic, and this task may be “less nonlinguistic” than the remaining five (though clearly more nonlinguistic than the sentence repetition task). This explanation would address the lower performance and fair – rather than good – reliability in the bilingual group. It does not, however, address the poorer reliability in the monolingual group. Thus, there may be additional task-related factors at play. As the auditory working memory task has shown substantial promise for differentiating children with DLD from their unaffected peers (see Ebert & Pham, Reference Ebert and Pham2019), it is worthy of ongoing consideration to determine if the potential sources of bias can be addressed.
In addition, the remaining analyses provide promising support for a lack of bias in the six nonlinguistic cognitive processing tasks. Concurrent validity analyses showed expected correlations with age, as well as strong within-construct correlations (e.g., auditory working memory with visual working memory), confirming that the nonlinguistic cognitive processing tasks assess their intended constructs. Again, the consistency of these correlations across monolingual and bilingual groups indicates minimal task bias. Moreover, the lack of association between SES and nonlinguistic cognitive processing task performance in both groups is notable, even though SES was not the main focus of our analyses. SES is another potential source of assessment bias, and the disassociation between SES and these nonlinguistic processing tasks underscores their potential to contribute to a less-biased assessment. In contrast, the English sentence repetition task is correlated with SES in both groups, suggesting class-related disparities in performance.
Finally, we found no differences in nonlinguistic cognitive processing task performance between children who hear Spanish at home and those who hear Vietnamese at home, as well as no relationship between nonlinguistic cognitive processing task performance and the proportion of L1 spoken at home. These results suggest that the nonlinguistic cognitive processing tasks are measuring equivalent skills across bilinguals of two distinct L1 typologies and that performance is not dependent on language experience. In contrast, the proportion of home L1 was significantly correlated with the traditional language assessment measure of sentence repetition in the L2. The association between language exposure and a traditional language assessment task was anticipated. It can go without saying that English language experience influences performance on an English sentence repetition task. Using sentence repetition as a comparison point serves to highlight how performance on the nonlinguistic tasks has the potential to contribute to less biased assessment.
4.1. Study limitations
We conducted several analyses and included multiple groups of bilingual children to thoroughly explore potential assessment bias. Nonetheless, it is not possible to completely eliminate any chance of bias. Our explorations would have been enhanced by a larger group of Vietnamese-English bilingual children, which would have enabled us to include this group in all analyses. A larger number of Vietnamese-English bilingual participants might also have enabled us to include NVIQ as a criterion when constructing matched pairs; we were not able to match on this variable with the existing dataset and instead included it as a covariate. Considering additional bilingual populations – including children who speak different L1s as well as those who reside outside the United States and speak different L2s – would also strengthen the claim that the nonlinguistic cognitive processing tasks have minimal assessment bias.
This study also included only one language assessment task, sentence repetition, which may not represent all language assessment measures. Sentence repetition appears to be a robust language assessment, but the extent to which task performance indexes purely language versus language plus working memory is debated (e.g., Frizelle et al., Reference Frizelle, O’Neill and Bishop2017; Klem et al., Reference Klem, Melby-Lervåg, Hagtvet, Lyster, Gustafsson and Hulme2015; Riches, Reference Riches2012). Including a more diverse set of language assessment measures would provide additional context regarding the range of potential assessment bias related to language exposure in these tasks.
Finally, the scope of our examination of bias is limited by including only children without language concerns in the study. Ultimately, it will be important to compare rates of identification of DLD across linguistically diverse groups to fully evaluate bias in nonlinguistic tasks.
4.2. Implications and future directions
On the whole, our analyses indicate minimal bias related to language experience in the nonlinguistic cognitive processing tasks. Although it may not be possible to completely remove the role of language experience in an assessment task, it is greatly reduced in these tasks. The consistent contrast between the nonlinguistic cognitive processing tasks and the language assessment task (sentence repetition) across most analyses illustrates the reduction in bias in comparison to more traditional language assessment approaches.
These results lay the foundation for considering nonlinguistic cognitive processing tasks in the identification of DLD in bilingual children. Of course, their ability to effectively distinguish between children with and without DLD must also be clearly established before they could be included in identification batteries for the disorder. As such, a clear next step is to build upon previous work (e.g., Ebert & Pham, Reference Ebert and Pham2019; Park et al., Reference Park, Miller, Sanjeevan, Van Hell, Weiss and Mainela‐Arnold2021) that has suggested nonlinguistic cognitive processing tasks can contribute to accurate identification of DLD. Rigorous diagnostic accuracy studies that include diverse groups of bilingual and monolingual children are needed.
If the nonlinguistic cognitive processing tasks indeed prove to be effective at identifying DLD, they could potentially be used across linguistically diverse groups as a complement to language-specific assessment tasks. For example, performance on cognitive processing tasks could be used as part of an initial step to confirm or rule out DLD, reducing costly misidentification of the disorder. If DLD is confirmed, additional language tasks – such as language sampling, vocabulary testing and sentence repetition – could be used to identify the child’s strengths and weaknesses, leading to the development of goals and the focus of clinical services.
The prospect of reducing assessment bias in the identification of DLD holds exciting implications. As clinical and research professions seek to confront systemic inequities related to race, ethnicity and national origin (e.g., Ellis & Kendall, Reference Ellis and Kendall2021), accurate identification of DLD in heterogeneous populations is critical. Advances in this area will improve the allocation of clinical resources, providing services to those who need it most and ameliorating the negative academic and social impacts of DLD. Reductions in assessment bias will also enhance the accuracy of DLD research, generating conclusions that are applicable across populations (rather than restricted to a small demographic; Heinrich et al., Reference Henrich, Heine and Norenzayan2010).
Data availability statement
Data for this study were collected through R01DC019613 at the University of Minnesota-Twin Cities and San Diego State University. Data are available on request from the corresponding author.
Acknowledgments
This research was funded by the National Institute on Deafness and Other Communication Disorders R01DC019613. We thank Benjamin Eisenreich, Kristie Gonzalez, Tatiana Ramos-Gallardo, Sophie Levi and Ngoc Do and the research assistants of the University of Minnesota Child Language Disorders across diverse Contexts lab and the San Diego State University Bilingual Language Development in Context lab.
Competing interests
The authors declare none.


 Open access