Introduction
Glacier meltwater in the Tibetan Plateau (TP) is considered an important contributor to global sea-level rise (Reference MeierMeier and others, 2007), but the glaciers and surrounding lakes play an important role in the discharge of headwaters of many Asian rivers (Reference Immerzeel and BierkensImmerzeel and Bierkens, 2012), which are sensitive to global change. The TP boasts the greatest concentration of high-altitude inland lakes in the world (Reference Zhang, Xie, Duan, Tian and YiZhang and others, 2011a), and these lakes are the subject of complex efforts to quantify how their mass balance changes. Lakes on the central TP have expanded significantly in recent decades, and the causes of the lake growth are still not well understood (Reference Phan, Lindenbergh and MenentiPhan and others, 2012). Because inland lakes often contain glaciers in their catchment, their stability is closely associated with surrounding glacier and permafrost change, with glacial meltwater increase contributing significantly to inland lake level rise. Global water-mass variations are estimated using lidar and gravitational satellite measurements of Earth’s gravitational field (Reference Moiwo, Yang, Tao, Lu and HanMoiwo and others, 2011). Ice, Cloud and land Elevation Satellite (ICESat) altimeter data are a valid source of information on surface elevation change and the mass balance of mountain glaciers (Reference Kropáček, Neckel and BauderKropáček and others, 2013). The glacier mass balance was validated by comparison with another geodetic approach based on the subtraction of two digital elevation models (DEMs) from 2000 and 2009. In the Hindu Kush–Karakoram–Himalaya region, a paucity of appropriate glacier data has prevented a comprehensive assessment of current regional mass balance (Reference Kääb, Berthier, Nuth, Gardelle and ArnaudKääb and others, 2012).
In addition, data from spaceborne altimeter missions, such as Topex/Poseidon, the Geosat Follow-On (GFO) satellite, European Remote-sensing Satellite-2 (ERS-2), Jason-1, Jason-2, Envisat and ICESat, have been available since 1993 (Reference CrétauxCrétaux and others, 2011). It is possible to infer the mass balance from some proxy estimated using a number of remote-sensing approaches. The Geoscience Laser Altimeter System (GLAS) instrument carried on ICESat has provided a new, precise and global view of the vertical dimension of the Earth’s surface and atmosphere. The accuracy of GLAS data is a few centimeters over flat surfaces (Reference Herzfeld, McBride, Zwally and DimarzioHerzfeld and others, 2008) but is much lower over rough terrain (Reference AbshireAbshire and others, 2005). Lake level data, which constitute one of the most important and fundamental datasets used in hydrologic analysis, are obtained through gauge measurements and ICESat altimeter data (Reference Zhang, Xie, Kang, Yi and AckleyZhang and others, 2011b). The ICESat GLAS data reveal that 30 of the lakes in the TP show a significant upward trend (0.2-0.6 m a–1) in water level during 2003-09, particularly those inland lakes that are supplied with a large proportion of glacial meltwater (Reference Song, Huang and KeSong and others, 2013). Accurate quantification of the lake water input and output for Nam Co lake is hindered by the limited number of ground measurements (Kropaček and others, 2012).
Given the heterogeneity of water level stations, remote-sensing imagery and laser altimeter data are useful complementary techniques for monitoring lake water level variations. Airborne and spaceborne remote sensing is the most practical approach for deriving a wide-area, regional assessment of lake level and glacier mass-balance change. In addition to spatial or temporal coverage and sampling rates, one of the most relevant criteria for inland water level change based on satellite altimetry data is the accuracy of the elevation data. The proportion of glacier meltwater in August every year was estimated to be -56% at Bow River, Banff, Alberta, Canada (Reference Hopkinson and YoungHopkinson and Young, 1998). The accuracy of ICESat altimeter data was assessed in a study of water level variation in the Great Lakes, North America, and an overall bias of -4.6cm (underestimation) was computed (Reference Abdallah, Bailly, Baghdadi and LemarquandAbdallah and others, 2011). Mass-balance observations on Ürümqi river glacier No. 1 and Tuyuksu glacier in the Tien Shan show a large deficit during the 1980s compared with previous decades. Qinghai lake water level variation in the northeastern TP is consistent with glacier mass balance, but the specific variation in the relevant period is not known (Reference ShiShi, 1990). The trend in water level change in Nam Co lake varied increasingly (at a rate of 0.62 ma–1) during 2003-09, probably due to snow or glacier meltwater under climatic warming (Reference WangWang and others, 2013).
However, these new observation technologies reveal unexpected complexities in the glacier mass-balance response to Nam Co lake water level. In this paper, we apply ICESat/GLAS footprint data and Landsat multispectral remote-sensing imagery to Nam Co lake and Nyainqentanglha range glacier mass-balance in situ data. The aim is to find excellent basin-scale agreement of their temporal mass variations and trends, based on remote-sensing, GIS and mass-balance analysis. Finally, we discuss how climatic changes and glacier mass loss influence the inland lake water level on the central TP, and how the dataset could be exploited more fully.
Study Area
Nam Co lake (the highest lake in the TP) is located in the west of the Nyainqentanglha mountains (29 °56’–3187’N, 89 °21-91823’E), with an elevation of 4723 ma.s.l. and an area of 1998.78 km2 (in 2003). Figure 1 shows the location of glaciers and Nam Co lake in the study area. Nam Co basin is a closed catchment with an area of -10 970 km2. The average elevation of the western Nyainqentanglha mountains is -~5500ma.s.l., and there were 1020 glaciers on the mountains in the 1970s. About 90% of the glaciers are situated on a 0-40° slope. The elevation of the glacier-covered area ranges from 4870 to 7162 ma.s.l. and the total area was 832.34±30 km2 in 2002. Meltwater from 267 glaciers flows into Nam Co lake, and the glacier area in the catchment was 201 ± 11 km2 in 2002. The annual precipitation is focused on May-September (Reference Zhou, Kang, Gao and ZhangZhou and others, 2010) and is dominated by westerlies. The glacier area is at the margin of the dominant Indian monsoon, with an average annual precipitation of 414 mm at Nam Co station (30846.44’ N, 90859.31’E; 4730 ma.s.l). The catchment is little affected by human activities, so the lake and glaciers evolve mainly by adapting to natural conditions and climate change.
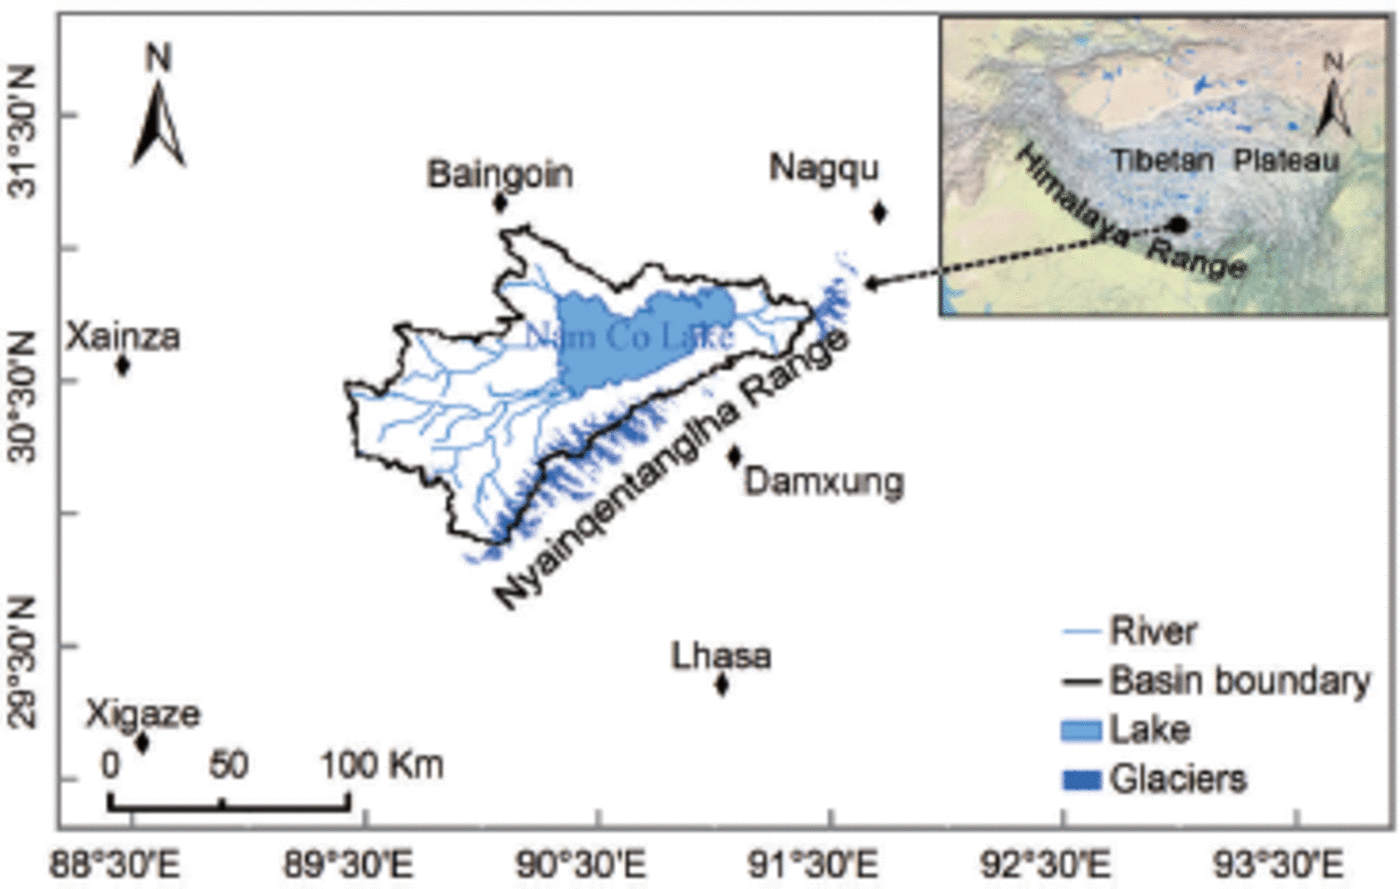
Fig. 1. The location of Nam Co lake basin and glaciers covered in the western Nyainqentanglha range, Tibetan Plateau. The altitudes of Baingoin, Xianza, Damxung, Lhasa, Xigaze and Nagqu meteorological stations are 4700, 4672, 4200, 3648, 3836 and 4507m a.s.l., respectively. The distance from Nam Co basin to these stations ranges from 30 to 150 km.
Dataset
ICESat GLAS data acquisition
ICESat is a scientific satellite launched by NASA on 13 January 2003 with the primary objective of measuring changes in ice-sheet elevation and sea-ice freeboard (Reference Schutz, Zwally, Shuman, Hancock and DiMarzioSchutz and others, 2005). The accuracy of GLAS altimeter data is ~2-14cm (Reference ZwallyZwally and others, 2002). GLAS laser footprints on the ground are - 7 0 m in diameter at -170 m intervals (sampling at 40 Hz) along the sub-satellite track. ICESat/GLAS orbited three times per year during 2003-09, and 18 campaigns (-33 days per campaign) of data have been obtained. ICESat/GLAS offers 15 products (GLA01, GLA02, ..., GLA15 data), which can be downloaded from the US National Snow and Ice Data Center (NSIDC) website (http://nsidc.org/data/icesat). In this study, the GLA01 product (1064nm) was used to record the full waveform data, and GLA14 (Elevation Data Product) was applied to visualize the location of the corresponding ICESat/GLAS footprints. The GLA01 and GLA14 products were acquired from 23 February 2003 to 1 October 2009 (release Nos. 31 and 33), and 6095 waveforms of elevation data (4480 shots in glaciers) are used in this study (Table 1). The GLA14 elevation data, referenced to the World Geodetic System 1984 ellipsoidal elevation (WGS84) coordinate system, are computed using the centroid of the received pulse, as well as the centroid of the transmitted pulse. The pulse peak location of Gaussian fitted to the waveform is used to determine the centroid of the surface return and its range (Reference Yi, Sun and ZwallyYi and others, 2003). However, ICESat elevation data are corrected by Gaussian and centroid elevation correction (G-C) for each of the ICESat laser campaigns; these G-C correction files are provided by the NSIDC (http://nsidc.org/data/icesat/correction-to-product-surface-elevation.html"). In Figure 2, the green circles depict the GLAS footprint distribution in the glacier and lake areas.
Table 1. Details of the ICESat altimeter data available for this study. Date format is yyyy-mm-dd
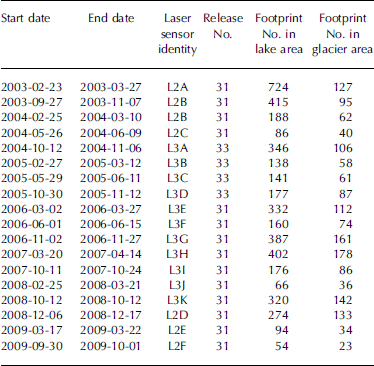

Fig. 2. Map of Nam Co lake catchment in the western Nyainqentanglha mountains on the northern slopes of the Himalaya. Distribution of ICESat GLAS footprints in the lake and glaciers is shown. The green circles are footprints available from GLA14 data from 2003 to 2009. Color composite images are synthesized with the TM 7, TM4 and TM2 bands of the Landsat ETM image of 15 May 2002.
Multispectral image and DEM
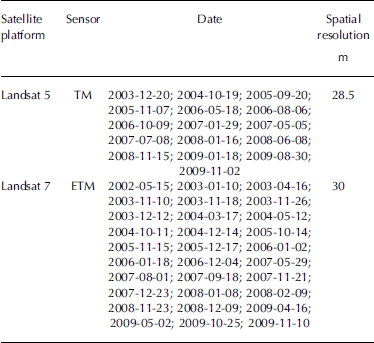
For cloud cover <25%, 46 scenes of remote-sensing data are available, including Landsat Thematic Mapper/Enhanced Thematic Mapper (TM/ETM) data from the period 2002-09, which are navigated by the United States Geological Survey (USGS) GloVis website (http://glovis.usgs.gov/ Table 2). After multispectral image correction and orthorectification, the lake or glacier boundary is extracted by the supervised classification method, and its accuracy is assessed with observation data. As for the lake boundary and area variations, we used a Landsat ETM image of 15 May 2002 as a reference, and the following 45 scenes to make the lake area or increased water volume changes on the basis of 2002. Nam Co lake and the surrounding glaciers are mostly covered by one scene, the path/row of which is 138/39 in the Worldwide Reference System-2.
Table 2. Details of remote-sensing dataset used to estimate the Nam Co lake area during 2002–09. Date format is yyyy-mm-dd
The Shuttle Radar Topography Mission (SRTM) DEM was obtained in February 2000 and acquired C-band (5.6cm) synthetic aperture radar (SAR) images of the Earth’s surface at 60° N, 56° S, which can be downloaded from the USGS website. Both ICESat elevation and SRTM DEM data can be used to identify abnormal areas, such as cloud cover, cliffs, ridges and dams. The pixel resolution is -90 m, and the 1 standard deviation error of the SRTM DEM over Nam Co lake basin is 6.4 m in terms of the absolute geo-reference, absolute height and relative height (Reference Hirt, Filmer and FeatherstoneHirt and others, 2010). The SRTM DEM can be derived from the slope and elevation data in order to correct the ICESat altimeter data.
Meteorological data
Meteorological observation data from Baingoin, Xianza, Damxung, Lhasa, Xigaze and Nagqu meteorological stations were used to analyze climate change in the region (Fig. 1). We obtained air temperature and precipitation data from 2003 to 2009, and calculated the evaporation (Reference Zhang, Liu, Tang and YangZhang and others, 2007). The observation meteorological data sources are the China Meteorological Administration’s modeling precipitation P and evaporation EP. Precipitation in the middle zone of the Nam Co basin was then calculated by interpolating between the six stations using an inverse distance weighted (IDW) method in ArcGIS software (Fig. 2).
As there were significant differences in the observed precipitation at the six meteorological stations, Nam Co basin was assumed to be uniform with a value of 615 mm. The amount of precipitation falling at the lake was found to be -600 mm (Reference Zhou, Kang, Chen and JoswiakZhou and others, 2013).
Figure 3 shows the summer precipitation and summer temperature variations for Nam Co lake basin, interpolated by the IDW method at the six observation stations, during the period 1 May-30 September 2003-09 (referred to as the summer period). There are larger differences in monthly precipitation among the stations in the Nam Co basin, but precipitation at each station ranges from 300 to 600 mm. When considering an expanded region including six stations, the summer average temperature displays an increasing trend during 2003-09, except for 2008.

Fig. 3. Summer precipitation and average summer temperature variations in Nam Co basin. The brown line indicates average temperature and the blue line is summer precipitation from 1 May to 30 September 2003–09.
Methods
Lake area estimation
The TM/ETM images provide information about changes in maximum lake area extent. Lake boundaries were extracted by the supervised classification method based on true color synthesizing images in ERDAS 9.1 software. All the vector format boundary and image data were projected into the Universal Transverse Mercator (UTM) coordinate system Zone 45 under the WGS84 datum. The modified normalized-difference water index (MNDWI) was used to map the lake water bodies (Reference McFeetersMcFeeters, 1996). The area of Nam Co lake on 16 April 2009 was 2022.7 ± 10.7 km2, which is consistent with the lake area finding (Reference Zhang, Xie, Yao and KangZhang and others, 2013) on the same date.
We then establish the statistical relationship between the lake surface area and the water level, to reconstruct a lake water area time-varying series from Landsat images of 2003-09 (Reference Krause, Biskop, Helmschrot, Flügel, Kang and GaoKrause and others, 2010). Next we estimate lake water increased storage variations and the changes therein, combined lake area and water level time-varying series data estimated by the TM/ETM images and the GLAS/ICESat L2 Global Land Surface Altimetry Data (GLA14). The River and Lake Project of the European Space Agency (ESA) and De Montfort University, Leicester, UK, is based on altimeter data (i.e. ERS-2, Envisat and Jason-2) to provide lake, reservoir and river water level observation data. The dataset, available at the ESA/De Montfort University River and Lake website (http://tethys.eaprs.cse.dmu.ac.uk/RiverLake/shared/main) , validated the Nam Co lake water level and area variations. As shown in Figure 4, the lake surface elevation record shows apparent spatial differences in observation data and GLAS footprint data, reflecting the varying character of climate change on the central TP. Full details of product generation procedures are provided in the River and Lake Product Handbook v3.5 (2009).

Fig. 4. (a) Comparison of lake water surface elevation based on GLA14 product, and corrected GLAS footprint elevation estimated by geoid height (in the geoid EGM2008 model) in Nam Co lake basin from February 2003 to October 2009. (b) The difference in corrected GLAS footprint elevation and in situ observation data (red points). Error bars denote standard deviations of GLAS corrected footprint elevation along the ascending or descending track.
Lake water increased volume variation
All GLAS footprints in the latitude direction on different campaigns could be satisfied with the lake water level monitoring. Taking the locations of both maximum and minimum as ends, we can calculate the GLAS footprint elevation average value as lake level at that time. Because detailed bathymetric maps are lacking, we estimated the variation of lake water storage increased volume based on lake water level rise and lake area expansion (Reference Lei, Yao, Bird, Yang, Zhai and ShengLei and others, 2013). Lake increased volume variation is
where ΔV is lake water increased volume (km3), the variables S 1 and S 2 are lake area at two stages (km2), and Δh is the absolute change in water level height (m) estimated by ICESat altimeter data between the two campaigns. The total lake water volume (Vt) depends on a previous storage capability of Nam Co lake or reservoir (V con) and lake water increased volume (ΔV) owing to the water level rise, so the lake total volume can be expressed as (Reference Duan and BastiaanssenDuan and Bastiaanssen, 2013)
Considering the glacier meltwater flowing into the lake, the water mass balance of a closed lake can be expressed as
where ΔVis the increased lake storage volume (km3), Pand E P are annual precipitation (mm) and annual evaporation (mm) on the surface, respectively, S lake and S c are lake water area and lake catchment area (km2), respectively, R is the runoff depth (mm) in the theoretical model (i.e. the difference between precipitation and evapotranspiration on the land surface) and G is groundwater input or output, including deep groundwater, hot springs and groundwater exchange among other basins. The surface groundwater inflow produced by atmospheric precipitation is also included in the equation, because R is calculated through precipitation minus land evapotranspiration. The deep groundwater exchange is discounted as having a negligible impact on lake water mass balance. The variable Mg = 0.6 is the glacial runoff coefficient generated by glacier meltwater in the catchment, which is closely related to glacier surface ablation height and mass loss.
Glacier mass-balance estimation
The Earth Gravitational Model 2008 (EGM2008) geoid data (Reference Pavlis, Holmes, Kenyon and FactorPavlis and others, 2012) are applied to interpret SRTM elevations (in 30 m resolution) and GLAS footprint elevation and locations. The gauges or in situ GPS instruments measured (Reference Bamber and RiveraBamber and Rivera, 2007) were converted into the GLAS data referenced WGS84 datum and EGM2008 geoid system. For example, in GLA14, these data provide a high-accuracy (10cm) dataset for comparison. As will be illustrated below, they can be combined with raster-based SRTM DEM data to produce elevation change (dh/dt) estimation (Reference Kern, Schwarz and SneeuwKern and others, 2003; Reference Sauber, Molnia, Carabajal, Luthcke and MuskettSauber and others, 2005). The variances from the least-squares regression as weights are used to estimate the dh/dt value from the corrected GLAS laser footprint elevation. The elevation errors present the tangent relationship with the slope in the terrain (Reference Nuth and KääbNuth and Kääb, 2011), in case that slope value can be calculated by any standard ArcGIS software. The observed geometric rates are corrected for laser footprint elevation changes not related to ice mass changes, including firn compaction, vertical bedrock movement and ICESat laser inter-campaign elevation bias (Reference SørensenSørensen and others, 2011). The uncertainty of the GLAS laser mass balance is estimated by sampled cross-track elevation (Reference Moholdt, Nuth, Hagen and KohlerMoholdt and others, 2010).
The ICESat-measured surface elevation E ie is referenced to an Earth ellipsoid, although GLAS surface elevations have instrument corrections (Reference Yi, Zwally and RobbinsYi and others, 2011). Thus, we define the elevation h above the geoids as
where E sat is the corrected GLAS footprint elevation and hg is the reference geoid height in the gravitational geoid model (EGM2008). Note that the influence of △E ib, E sat and hg is removed from E ie, but there is still an effect from other factors (i.e. dynamic topography and the residuals; Reference Berthier, Arnaud, Kumar, Ahmad, Wagnon and ChevallierBerthier and others, 2007).
At each footprint, we calculate the elevation difference in two stages:
where t 1 and t 2 are the times at which the ascending and descending track acquired data at the same spot. The time span At= t 1 - t 2 ranges from -40 to -140 days.
The glacier ice, firn and snow density differ in the surface covered; the mass balance of glacier density P i varies. If P i is not a measured value, the density is estimated instead as an ice-snow average density. The glacier mass balance at an altitude interval of 200 m was calculated as
where b is the mass balance of each altitude interval zone, including glacier ice, snow and affiliated ice variation, so we define ice-snow average density as pi = 900 kg m–3, and si is the glacier projected area at a 200 m altitude interval under the WGS84 coordination reference system. The mass balance of the glaciers is calculated as
where the variable s is the glacier area under the WGS84 coordinate reference system.
Uncertain error and validation
Uncertain error
The uncertainty errors of elevation data, whether high-resolution DEM data or individual points, are commonly checked by fieldwork data or satellite ground-control points (GCPs). Combined photogrammetry and measured GCP data should ensure a reliable representation of the glacier surface (Reference Keutterling and ThomasKeutterling and Thomas, 2006). An average vertical error ɛv is calculated as
where θ is the glacier surface slope value. At a topographic map scale of 1 :10 000, the GCP dataset is employed to geo-reference the aerial topographic map with a root-mean-square error (RMSE) of 3.5 m. The same GCPs can ensure that all the multispectral satellite images match precisely.
With smaller glaciers, glacier terrain errors cannot be ignored, as they easily lead to glacier area and length uncertainty error (Reference KulkarniKulkarni and others, 2007). Thus, the accuracy of the glacier boundary uncertainty error depends on the spatial resolution and geo-reference error in the remote-sensing imagery (Reference Williams, Hall and ChienWilliams and others, 1997). The glacier or lake boundary uncertainty error (Reference Nuth and KääbNuth and Kääb, 2011) is calculated as
where l is the uncertainty error value in the glacier or lake area, λ is the original image spatial resolution or individual pixel size (m) and ɛ is the image of geo-reference errors in different periods. As the multiphase data error in glacier area uncertainty, Reference Hall, Bayr, Schöner, Bindschadler and ChienHall and others (2003) proposed
where a is glacier area error, λ is the spatial resolution of the remote-sensing images used (m) and ɛ is the geo-reference error images and should be controlled within <5 m. The glacier boundary uncertainty error for TM data is ±21.2 m and the uncertainty error of the glacier area is ±5.04 km2.
Validation
Validation of the ICESat altimeter-derived water level generally requires comparison with in situ measurements at gauging stations (Reference Birkett and BeckleyBirkett and Beckley, 2010). The overflying tracks are usually some distance away from the ground gauging stations, but the ICESat altimeter data-derived water level rise is very significant. Yet it has to be noted that these GLAS footprints exhibit systematic intercampaign and inter-laser biases at two stages. Figure 4a shows that the two curves form a good match for the lake water level of ICESat GLAS footprint-corrected data and the in situ measurements; both have a Pearson’s correlation coefficient r=0.91. The standard deviation of GLAS-derived lake water elevation is >0.11, which might be attributed to floating ice or thin cloud backscattering.
Results and Discussion
Lake area and volume changes
The GLA14 product datasets provided useful information and curves of water level variations in Nam Co lake. The time-series curves show an obvious trend of water level rise and area expansion. Figure 5a presents the linear or quadratic models used to fit the water level rise and lake area data. There is significant correlation between lake water level elevation and lake water area, with a multiple correlation coefficient of >0.85. Linear regression of all measurements indicates the lake level increased by 2.4 ±0.12 m during 2003-09, which means an average annual rise of 0.33 m (t test value = 3.47, p<0.05). Correspondingly, the water storage volume increased by - 4 . 9± 0.5 km3 (Fig. 5b), which is equivalent to the lake water level increasing at an average rate of 0.6978 ±0.11 km3 a–1. As shown in Figure 5b, Nam Co lake area expanded dramatically from 1998.78±5.4 to 2023.8±3.4km2, at an average annual rate of 3.6 km2 a–1, but has increased slowly since 2008.
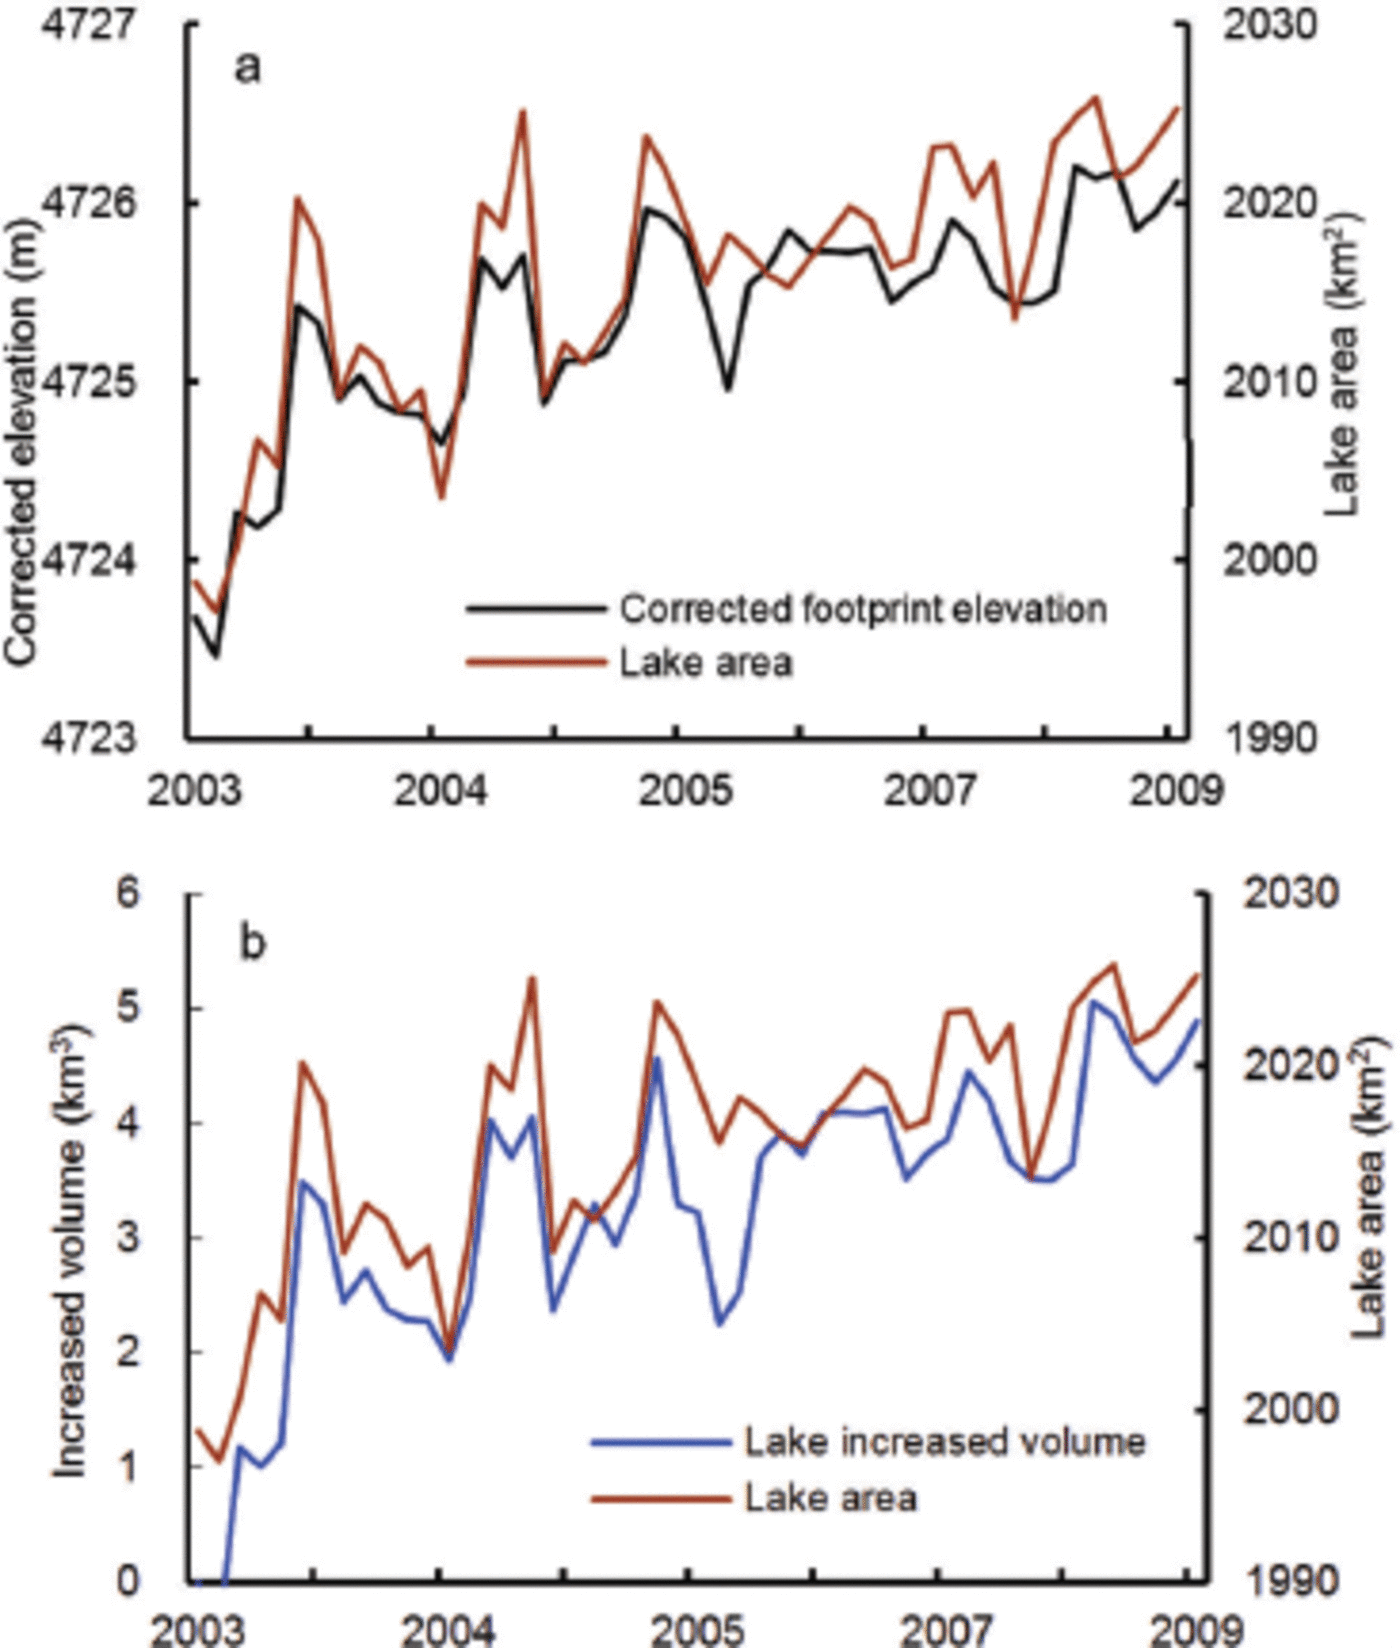
Fig. 5. The curves of lake water elevation derived from GLA14 product data, lake area and lake increased volume (km3 w.e.) during 2003–09. (a) Lake area is estimated from the Landsat TM/ ETM dataset, and the lake water elevation is the corrected ICESat elevation derived from GLA14 product. (b) Nam Co lake increased volume calculated from lake area and water level change height (equivalent water height), from February 2003 to October 2009.
In summary, in the absence of an associated obvious increase in precipitation, the recent trend in lake water level may be closely associated with increased summer temperature in the basin. Therefore, the inland lakes into which high-altitude mountain glacier meltwater flows are more likely to be influenced by climatic warming. Thus, the summer temperature rise results in glacier meltwater increase, and has also contributed to lake water level rise and an increase in water mass storage (Fig. 5b).
Glacier mass-balance change
Figure 6 shows annual water level variations associated with glacier mass-balance trends from 2003 to 2009. It is impossible to identify their relationships in the Nam Co lake catchment. As shown in Figure 6a, the total glacier ice volume loss in the western Nyainqentanglha mountains is 1.69±0.12km3w.e. in the past 7 years at a rate of 0.2413 ±0.08 km3 a–1. However, the average glacier mass loss for the past 7 years is 0.49 m w.e., and the trend in mass loss is slowing. In Figure 6a and b, glacier mass balance and summer temperatures have a positive correlation, indicating glacier sensitivity to summer air temperature, but there is no obvious correlation with summer precipitation. As summer temperature increases, there should be a large increase in glacial runoff. Whereas water level rose in 2007, it declined in 2008. In fact, in summer 2008, annual precipitation increased by 19.6%, drainage basin runoff decreased by 33.3% and glacial meltwater decreased by 53.8%. The reason for this is that solid precipitation (e.g. snow, sleet, hail), which is determined along with air temperature, is equivalent to accumulation on the glacier, and glacial meltwater should then decrease.

Fig. 6. (a) Comparison of water level and glacier mass-balance changes from 2003 to 2009. (b) The curves of average summer temperature and summer precipitation during 2003–09, interpolated from six observation stations by the IDW method.
The quality of the DEM potentially could have been improved by additional smoothing and systematic bias corrections. This linearity is captured by the GLAS footprint data due to the fixed gaps along with the elevation. In order to estimate trends in surface elevation change, a linear regression was fitted with all GLAS footprint elevation change A h values. The elevation changes dh/dt (<2 ma–1) are the assumed GLAS footprint elevation change rates in Nyainqentanglha mountain glaciers (Fig. 7). In order to demonstrate trends in glacier change spatially, we applied a low-pass filter to reduce small-scale noise, but it did not improve the overall precision of the SRTM DEM data. In Figure 7, the mass balance seems slightly more negative in the southern (-0.53 to -0.92 m w.e. a–1) than in the northern area (-0.37 to -0.65 m w.e.a–1), but these differences are insufficient to offset uncertainty error in the evaluation. Employing the GIS analytical method, the glacier surface region below 5800 ma.s.l. was estimated as -1.03 ± 0.4 m a–1 during 2003-09. Similar differences were found for glaciers at the equilibrium-line altitude (ELA), which was 5800 m a.s.l. in 2009.
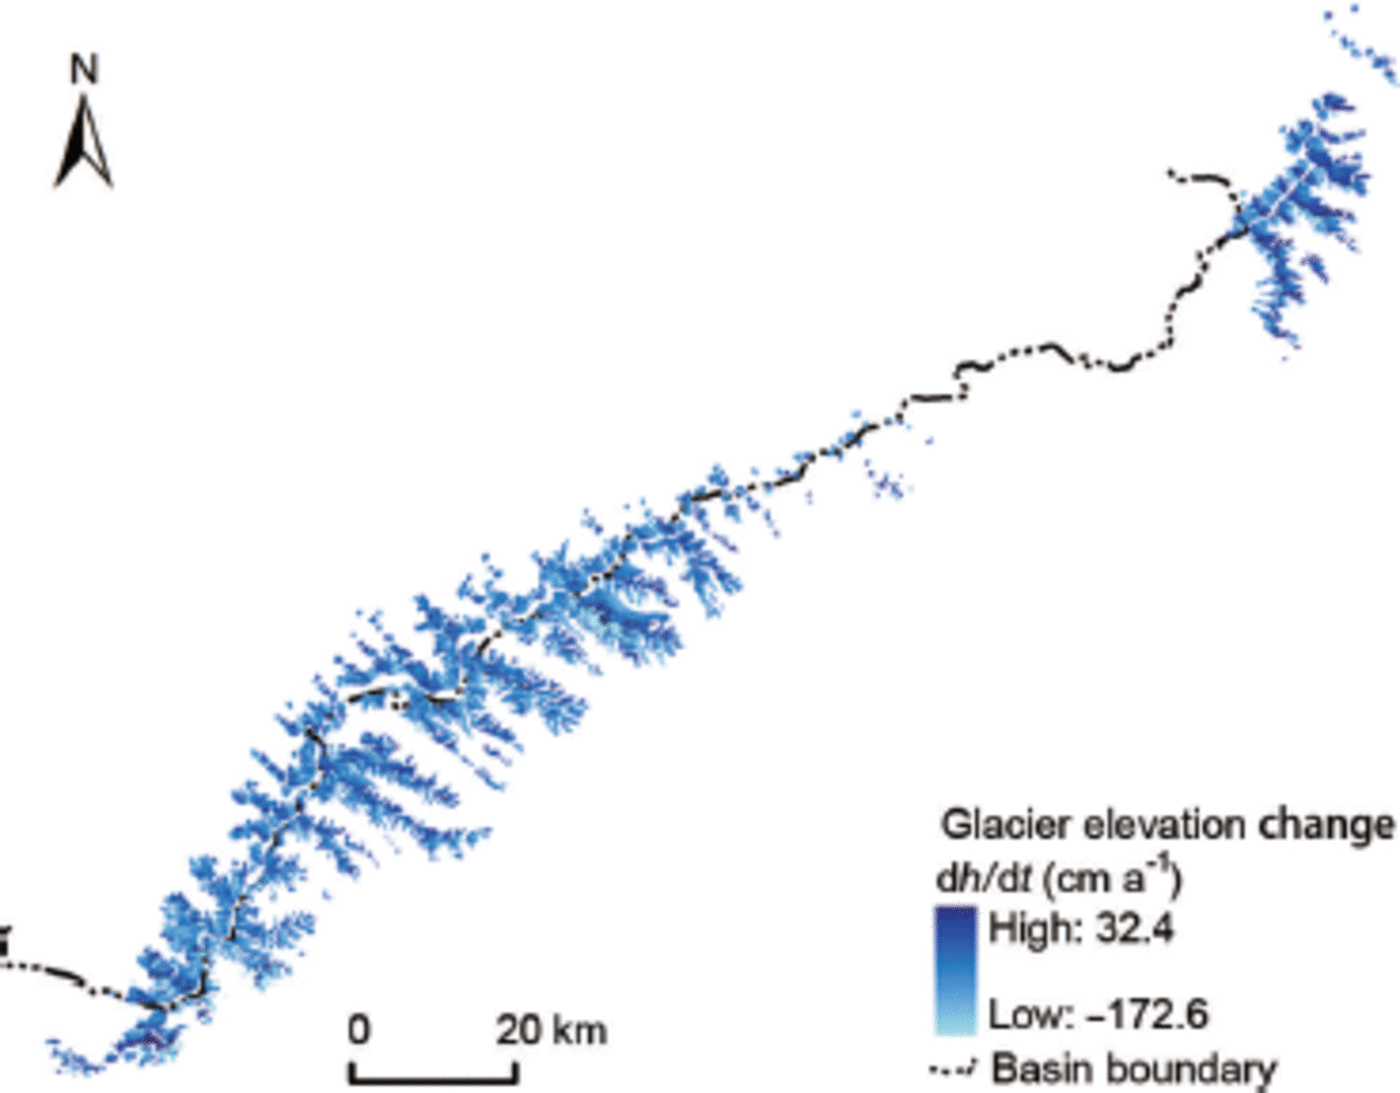
Fig. 7. Surface elevation changes (dh /dt, cma–1) from February 2003 to October 2009 for the glaciers in the western Nyainqentanglha mountains.
Analysis of increased lake volume and glacier surface elevation change
The results of Reference Wu and ZhuWu and Zhu (2008) show that during 1970-2000 the area of Nam Co lake increased from 1942.34 to 1979.79 km2 at a rate of 1.27 km2 a–1, while glacier area decreased from 167.62 to 141.88 km2 at a rate of 0.86 km2 a–1. In the basin, glaciers continued to shrink during 2002-09. No advancing glaciers were detected (Reference BolchBolch and others, 2010). However, in the western Nyainqentanglha mountains, ~960 glaciers covering an area of 832.2 ±5.04 km2 shrank by 11.34 km2 during 2003-09 (at a rate of 1.61 km2 a–1), with glaciers in the Nam Co lake catchment also decreasing, from 201.1 ±4.3 to 196.1 ±2.3 km2 at a rate of 0.71 km2 a–1, in this period.
Figure 6a shows lake water level rise or area expansion resulting from glacier meltwater inflow. Assuming a glacial runoff coefficient of 0.6, the volume of inflow into the lake is 1.01 km3. The glacial meltwater inflow (510 mm lake water depth) contributes at least 20.75% to lake water level rise. Thus, glacial meltwater indeed makes an important contribution to the positive water mass balance of Nam Co lake in the past 7 years, which is associated with the increase in summer temperature.
Figure 8 depicts the relationship between Nam Co lake water level and precipitation in interseasonal change, with May-September defined as the warm season and October-April in the next year as the cold season. Based on the glacier mass-balance results (Fig. 6a), annual precipitation during 2003-09 was estimated to contribute 50.75% of lake level rise. As there is a significant correlation between precipitation and lake water level on an interseasonal scale (Fig. 8), there is no clear evidence that the ratio of meltwater to the other mass-water input is known. However, continual lake water level rise is a direct response to summer temperature increase during 2003-09, and the slowing glacier mass loss indicates a sensitive response to this high-mountain precipitation increase.
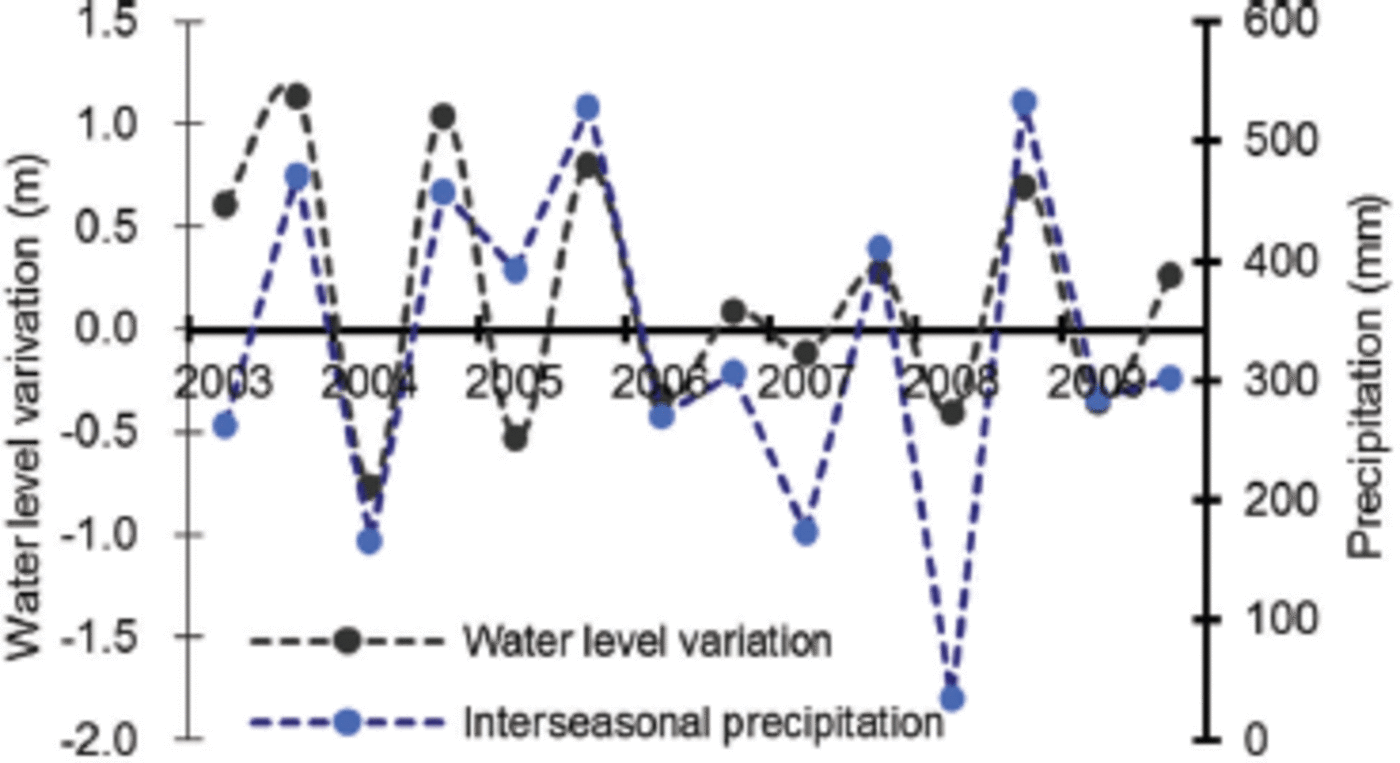
Fig. 8. Nam Co lake water level and precipitation interseasonal variation curves for 2003–09.
Conclusions
Our results indicate that the Nam Co lake water level, area and annual increased volume variations during 2003-09 can be monitored using ICESat altimeter data and Landsat TM/ ETM imagery. Comparing lake level rise and glacier mass loss during this period, the contribution of glacier mass loss to Nam Co lake water level rise is relatively slight. It is consistent with a decrease in mountain glacier mass loss, indicating an increase in high-mountain regional precipitation. The following points have been addressed in this study:
-
1. During 2003-09, Nam Co lake water level increased continually, while mountain glaciers retreated. Nam Co lake water level rise and area expansion were dramatic, but have slowed. The lake area increased from 1998.78 ±5.4 km2 in 2002 to 2023.8 ±3.4 km2 in 2009, and the lake level increased by 2.4 ±0.12 m (0.33 ma–1) over the same period. Accordingly, lake water volume growth is 4.9 km3, increasing at a rate of 0.6978 km3 a–1.
-
2. In 2002, there were -960 glaciers in the western Nyainqentanglha mountains, covering an area of 832.2 ±5.04 km2, and recession occurred at a rate of 1.61 km2 a–1 during 2003-09. In the catchment, the glacier-covered area was 201.1 ±4.3 km2 in 2003, and decreased to 196.1 ±2.3 km2 in 2009, at a rate of 0.71 km2 a–1. We consider the summer temperature rise to be a major influence on glacier ice melt. With regard to glacier mass loss, the glacier meltwater is caused by rising air temperature. Precipitation appears to be related to the slowing of glacier mass loss during 2003-09.
-
3. Lake water level increase or area expansion is induced by glacier meltwater, and increased precipitation directly affects water runoff generation. Assuming a glacial runoff coefficient Mg = 0.6, the glacial meltwater inflow volume is at least 1.01 km3 during 2003-09. The glacial meltwater inflow (~510 mm water depth) contributes a lake water level rise of 20.75% over the corresponding time span. The results also show that information on transient water level elevation can be usefully applied to determine increased lake volume variations.
Acknowledgements
This work was supported by the National Key Basic Research Development Program of China (grant No. 2010CB951404), the Strategic Science and Technology Program of the Chinese Academy of Sciences (grant No. XDB03030204) and the National Natural Science Foundation Project of China (grant No. 40930526 and No. 41190084). We thank the Nam Co lake stations and the Laboratoire d’Etudes en Géophysique et Océanographie Spatiales for providing Nam Co lake water level monitoring and for validating the data and methods, Jianchen Pu for providing in situ glacier boundary and GCPs, and Yanqiu Xing for the processing methods of the ICESat altimeter data. We also thank the China Meteorological Data Sharing Service System of the China Meteorological Administration (CMA) for providing meteorological observation data for this study.


