Introduction
Retreating glacier tongues and shrinking glacier areas are among the most obvious evidence of ongoing climate change. Glaciers affect human activities in mountainous regions, and through impacts on streamflow further downstream where glacier meltwater can be an important source of hydropower, drinking water or irrigation systems. Despite differences in local conditions and response times, glaciers worldwide show an overall trend of retreat since 2000 (IPCC, 2013; Reference ZempWGMS, 2013). Ongoing climate change also exerts a large impact on the runoff regime from glaciers. In the Swiss Alps, increased runoff from highly glacierized catchments between 1974 and 2004 is linked to increased air temperatures rather than increased precipitation (Reference Pellicciotti, Bauder and ParolaPellicciotti and others, 2010). As glaciers are considerable water reservoirs acting on different timescales (Reference Jansson, Hock and SchneiderJansson and others, 2003), long-term changes of glacierization impact water resources and are important for hydroelectricity production (Reference Finger, Heinrich, Gobiet and BauderFinger and others, 2012).
In Norway, 98% of electricity is generated by hydropower (Reference Gebremedhin and De Oliveira GranheimGebremedhin and De Oliveira Granheim, 2012) and 60% of the total glacier area is situated in catchments regulated for hydropower (Reference Andreassen and WinsvoldAndreassen and Winsvold, 2012). Many Norwegian glaciers are projected to retreat significantly (e.g. Reference Laumann and NesjeLaumann and Nesje, 2009) or even to disappear by the end of the 21st century (e.g. Reference Jóhannesson, Sigurðsson, Einarsson and ThorsteinssonJóhannesson and others, 2006a; Reference Giesen and OerlemansGiesen and Oerlemans, 2010). Long-term projections for western Norway indicate a rise in summer temperature by ~2°C by the end of the 21st century (Reference Hanssen-BauerHanssen-Bauer and others, 2009). This will first result in a distinct increase in glacier melt periods (e.g. Reference Andreassen and OerlemansAndreassen and Oerlemans, 2009) and eventually in a reduction of the total glacier area by ~34% by 2100 (Reference Nesje, Bakke, Dahl, Lie and MatthewsNesje and others, 2008). Because of decreasing ice volumes, the runoff from glacierized catchments is expected to increase by 25–50% within the next few decades (Reference JóhannessonJóhannesson and others, 2006b), before the reduced glacier area leads to a reduction in meltwater runoff.
Hydrological models are often calibrated exclusively using runoff measurements. As the runoff of glacierized catchments is linked to the glacier mass balance, both glaciological and hydrological applications require a good understanding of mass-balance variations. Runoff is the sum of liquid precipitation and melt of snow and ice. Since errors from calculating runoff from its individual components could compensate each other, mass-balance modeling is a prerequisite for more accurate calculation of streamflow from glacierized catchments (e.g. Reference Finger, Pelliccotti, Konz, Rimkus and BurlandoFinger and others, 2011; Reference Schaefli and HussSchaefli and Huss, 2011). This is especially important in high-mountain areas, where precipitation measurements are sparse and difficult to extrapolate (e.g. Reference Engelhardt, Schuler and AndreassenEngelhardt and others, 2012).
Glaciers are very sensitive to climate variations (Reference Kaser, Cogley, Dyurgerov, Meier and OhmuraKaser and others, 2006). Both seasonal mass balances of a glacier and annual runoff from its catchment present large year-to-year variabilities (e.g. Reference Engelhardt, Schuler and AndreassenEngelhardt and others, 2013), mainly due to variability from glacier melt contribution to runoff (e.g. Reference Engelhardt, Schuler and AndreassenEngelhardt and others, 2014). To explore the causes of these variabilities, this study evaluates the seasonality of glacier mass balance and runoff sensitivities to temperature and precipitation changes of four glacier catchments in Norway containing the glaciers Engabreen, Ålfotbreen, Nigardsbreen and Storbreen.
Study Sites and Data
The study was carried out on four highly glacierized catchments in Norway, of which one (Engabreen catchment) is situated in northern Norway and the other three (Ålfotbreen, Nigardsbreen and Storbreen catchments) are situated along a west–east profile in southern Norway (Fig. 1). From Ålfotbreen to Storbreen, the climate becomes more continental, indicated by the continentality index k, defined by Reference ConradConrad (1946) as where A is the difference between the mean temperatures of the warmest and coldest months, and Φ is the latitude of the location.
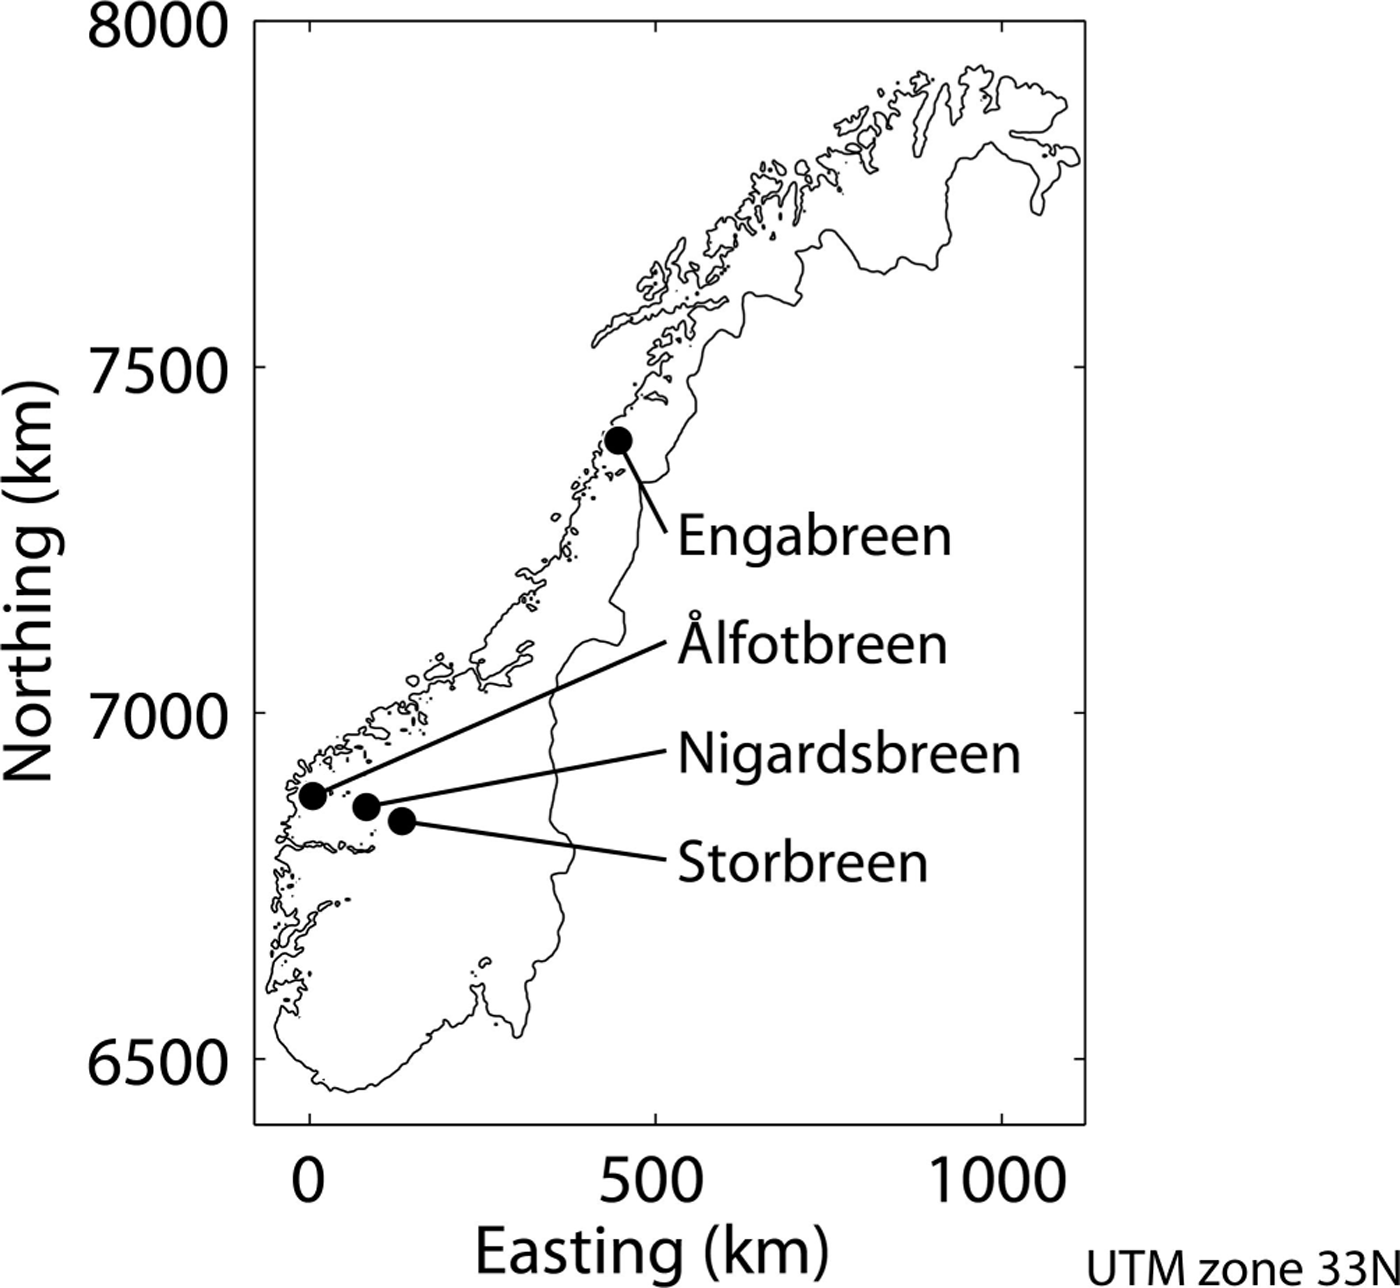
Fig. 1. Outline of Norway with the location of the four glacier catchments used for this study.
The continentality index increases from 6 to 20 between the Ålfotbreen and Storbreen catchments, with intermediate values of 10 for the Nigardsbreen and Engabreen catchments (Table 1). Since the three catchments in southern Norway are at similar latitudes, the continentality index depends solely on the temperature difference A. Using the seNorge dataset (www.senorge.no), the variable A increases between the Ålfotbreen and Storbreen catchments from 11 K to 19 K, whereas the catchment-averaged annual air temperature T a decreases from +0.5°C to –5.0°C and the annual precipitation sum P a decreases from 6.2 m to 1.6 m (Table 1). At all catchments, precipitation shows a minimum in spring and a maximum in autumn (Fig. 2). In the Ålfotbreen catchment, seasonality in precipitation is most pronounced, with very high precipitation occurring from September through January, which is associated with the prevailing westerly winds during this period. From November through April, the mean precipitation sum in the Ålfotbreen catchment is more than three times higher than in the Storbreen catchment (Fig. 2), although the two catchments are located only ~130 km apart. The Engabreen and Nigardsbreen catchments show climate settings that are quite similar to each other and values that are between the respective values of the other two catchments (Table 1).
Table 1. Overview of the studied catchments with name of the containing glacier, catchment area, degree of glacierization, mean annual air temperature, T a, mean annual precipitation sum, P a, difference between the mean temperatures of the warmest and coldest months, A, latitude, Φ, index of continentality, k, and mean runoff for the period of available measurements. The climate data are based on the seNorge dataset and averaged for the study period (1961–2012)

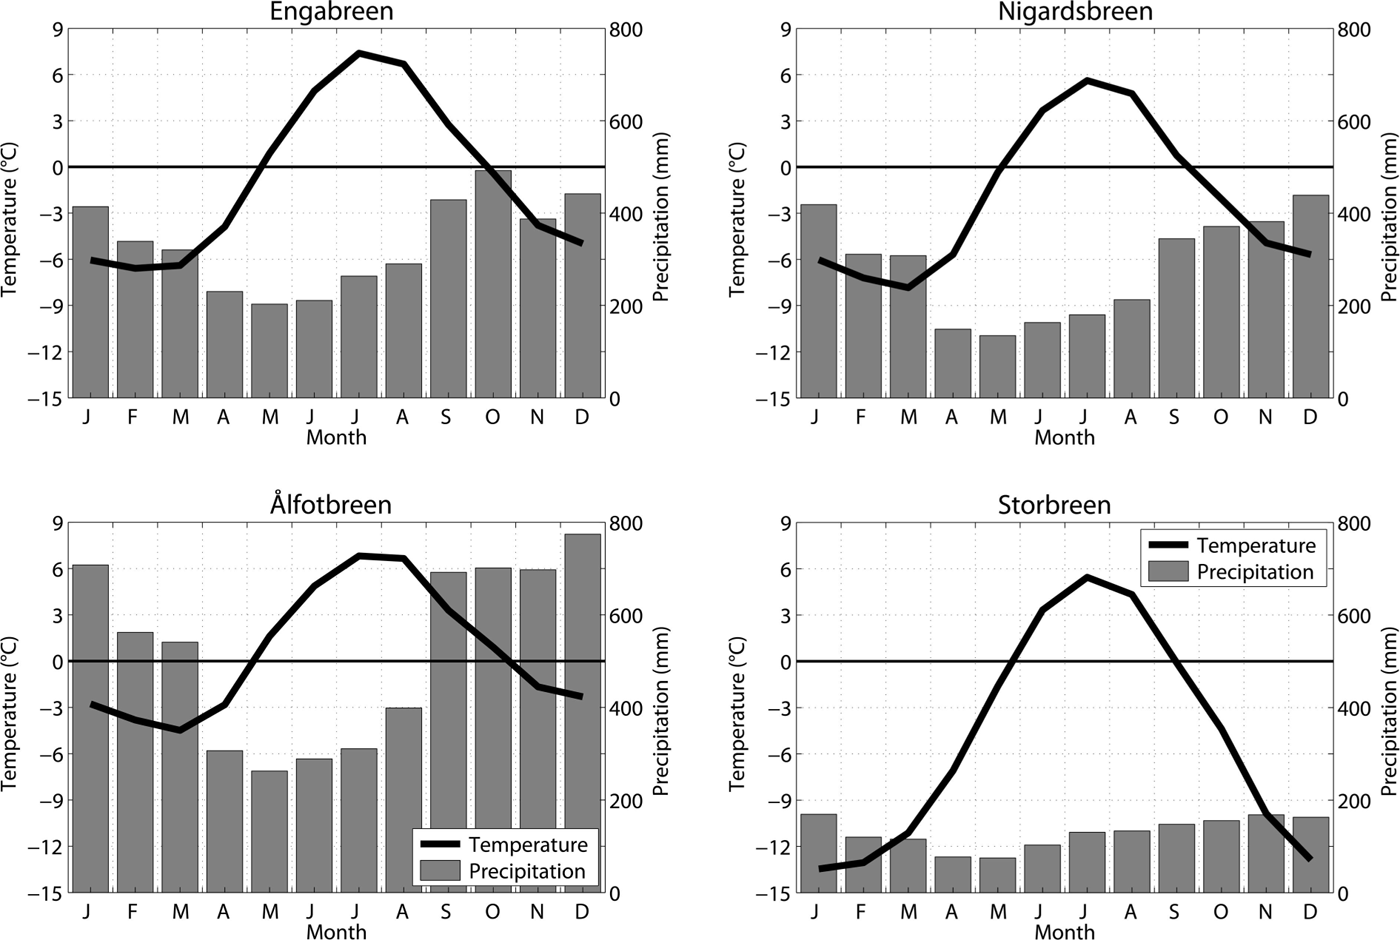
Fig. 2. Climographs for the four studied catchments (averaged seNorge data for the period 1961–2012).
The glaciers within the investigated catchments differ in area and elevation range (Table 2). The degree of glacierization of the catchments is 54–73%. On all four glaciers, continuous direct glacier mass-balance measurements from interpolated stake readings for winter and summer balances have been performed for >40 years (e.g. Reference Kjøllmoen, Andreassen, Elvehøy, Jackson and GiesenKjøllmoen and others, 2011). For the period of available mass-balance measurements (which are slightly different for each glacier; Table 2), mean seasonal mass balances for these glaciers from interpolated stake measurements vary between +1.4 and +3.8 m w.e. for the winter balances and –1.7 and –3.6 m w.e. for the summer balances. In line with the increase in continentality, the largest and smallest mass turnovers occur at Ålfotbreen and Storbreen, respectively, the westernmost and easternmost of the selected glaciers in southern Norway. For the period of available measurements, Storbreen is the only glacier that experienced a mass loss, whereas the largest mass gain is observed at Engabreen. However, the mass-balance record at Engabreen is most likely too positive, as geodetic calculations indicate a glacier in balance for the period 1985–2002 (Reference Haug, Rolstad, Elvehøy, Jackson and Maalen-JohansenHaug and others, 2009). Therefore, the Engabreen mass-balance record is currently being homogenized and re-evaluated by the Norwegian Water Resources and Energy Directorate (NVE).
Table 2. Overview of the glaciers within the studied catchments with area, associated mapping year, glacier elevation range, equilibrium-line altitude (ELA) and seasonal mass balances (B W, B S) for the period of available measurements (data based on Reference KjøllmoenKjøllmoen and others, 2010)

For the study we used the gridded temperature and precipitation data from seNorge. The data are based on station measurements which are interpolated on a 1 km horizontal grid for all of mainland Norway on a daily basis from 1957 to the present (Reference MohrMohr, 2008). Despite some weaknesses with the inter- and extrapolation of precipitation in mountainous regions, different evaluation studies (Reference MohrMohr, 2009; Reference DyrrdalDyrrdal, 2010; Reference Engelhardt, Schuler and AndreassenEngelhardt and others, 2012; Reference SalorantaSaloranta, 2012) found the gridded data of seNorge suitable for mass-balance modeling especially due to their high spatial resolution. Following Reference Engelhardt, Schuler and AndreassenEngelhardt and others (2014), the precipitation data of seNorge were adjusted by using a precipitation correction factor for each catchment. The factor was set in order to comply with the catchment-wide water balance consisting of precipitation, evaporation, runoff and accumulated mass balance over the period of available runoff data.
Methods
The mass-balance and runoff model used in this study is a conceptual model that calculates snow accumulation, melt and runoff at a 1 km horizontal resolution. To account for the glacier area at the glacier margins, gridpoints which represent areas that are only partly covered by ice were weighted depending on the glacier ratio of the representing grid area. With this technique, the seasonal mass balance of even the smaller glaciers was modeled in good agreement with the measurements (Reference Engelhardt, Schuler and AndreassenEngelhardt and others, 2014). The model was run on a daily basis using the gridded data from seNorge. The transition from rain to snow was determined by a threshold temperature (T s) which was surrounded by an interval of 2 K where the precipitation linearly shifts from rain to snow. Daily melt rates of snow or ice M snow / ice (mm d−1) were obtained from a distributed temperature-index approach including potential solar radiation (e.g. Reference HockHock, 1999).
For T sn (seNorge air temperature) > T 0 (threshold temperature for melt), daily melt is calculated as
where Θ is the melt factor, C snow / ice are the radiation coefficients for snow and ice, and I is the potential clear-sky solar radiation (kW m−2). Model parameters for each catchment are given in Table 3.
Table 3. Parameter sets and model performance for the catchment areas. Model performance is expressed by the coefficients of variation (root-mean-square error divided by the average) between modeled and measured seasonal mass balances, and the Nash–Sutcliffe coefficient, which is calculated using modeled and measured daily runoff values

The model calculates the reference surface glacier mass balance (Reference Elsberg, Harrison, Echelmeyer and KrimmelElsberg and others, 2001). The glacier area on which the calculations were based is the same area for which the available glacier mass-balance measurements have been performed (e.g. Reference Kjøllmoen, Andreassen, Elvehøy, Jackson and GiesenKjøllmoen and others, 2011). For Nigardsbreen, for example, this reference area was 47.8 km2 from 1984 to 2008 and was updated to 47.2 km2 in 2009, when a new glacier outline was available (Reference KjøllmoenKjøllmoen and others, 2010). Glacier area changes during the model period were not larger than 6% of the respective glacier area. To account even for such small area changes in the model, the glacier melt contribution of the gridpoint representing the lowest glacier altitude was changed by adjusting the glacier ratio of this gridpoint. For the area outside the glacier outline, the model calculates daily values for snow accumulation, snowmelt and runoff.
The parameters of the used mass-balance and runoff model were taken from Reference Engelhardt, Schuler and AndreassenEngelhardt and others (2014), where the model parameters were adjusted for each catchment by minimizing the root-mean-square error (rmse) between measured and modeled seasonal glacier mass balances and maximizing the Nash–Sutcliffe coefficient between modeled and measured daily runoff values. The model performance of that study is reported in Table 3, where the coefficient of variation c v (rmse value divided by the average) is provided to better compare model performance between the sites. Additional information, such as parameter space of all model parameters and a detailed uncertainty analysis of this parameter set, can be found in Reference Engelhardt, Schuler and AndreassenEngelhardt and others (2014).
The climate sensitivity of a glacier catchment can be expressed in changes of mean annual mass balance (mass-balance sensitivity β) or mean annual runoff (runoff sensitivity R) in response to temperature and precipitation changes. Following Reference OerlemansOerlemans and others (1998), the sensitivities of the annual glacier mass balance B a to variations in temperature and precipitation (β T and βP ) were defined as

In the same way, we defined the sensitivities of the seasonal glacier mass balances (winter balance β W and summer balance β S) and sensitivity of the mean annual runoff (R) to climate forcing. The seasonal mass balances were determined between the days when the glacier-wide mass reached its maximum in spring and its minimum in autumn.
The sensitivities represent the so-called static sensitivities since they do not account for dynamic responses of the glacier (e.g. area changes due to mass-balance variations). Model parameters such as threshold temperatures or melt coefficients (Table 3) were kept constant. Changes in precipitation patterns would very likely be accompanied by different meteorological conditions (e.g. cloud cover or wind speed) and thus affect several terms in the energy balance, although air temperature remains unchanged. Therefore, the climate sensitivities represent idealized values to (relatively) small perturbations.
To calculate the climate sensitivities of the four studied glaciers, the temperature and precipitation values of the model period (1957–2012) were changed and the impacts on the seasonal mass balances (for the glacier areas) and the mean annual runoff (for the whole catchments) were evaluated for the study period (1961–2012). In two different experiments, the input changes were performed first for annual values, and secondly for monthly values individually for each month, since monthly perturbations in temperature and precipitation reveal seasonalities of the climate–mass-balance and climate–runoff relations. The range for these variations was ±3 K for temperature and ±30% for precipitation values. Although many previous studies have used perturbations of monthly precipitation of 10% (e.g. Reference De Woul and HockDe Woul and Hock, 2005; Reference Andreassen, Elvehøy, Jóhannesson, Oerlemans, Beldring and Van den BroekeAndreassen and others, 2006), a value of 30% was chosen for this study since it has about the same impact on annual mass balance as a 1 K temperature change (see, e.g., Reference Andreassen and OerlemansAndreassen and Oerlemans, 2009).
Results
Mass-balance sensitivity
As expected, annual glacier mass balance was negatively correlated with changes in mean annual air temperature and positively correlated with changes in mean annual precipitation sums (Fig. 3). However, at higher temperatures, sensitivity to temperature changes increases, whereas sensitivity to precipitation changes decreases. Differences between the four glaciers occur in the magnitude of these correlations and the range of how much precipitation change would be necessary in order to compensate the effect of a temperature increase or decrease on the glacier mass balance. For Engabreen, the effect of a 1 K change in annual air temperature would be more than compensated by the effect of a 30% change in annual precipitation sum, whereas for the other three glaciers such a precipitation increase would not be sufficient to compensate the effect of a 1 K temperature increase (Table 4).
Table 4. Absolute seasonal and annual mass-balance sensitivities (β W, β S, β N; m w.e.) and relative changes (%) of the seasonal mass balances for the studied glaciers using perturbations in mean annual air temperature (index T ) and precipitation sum (index P )

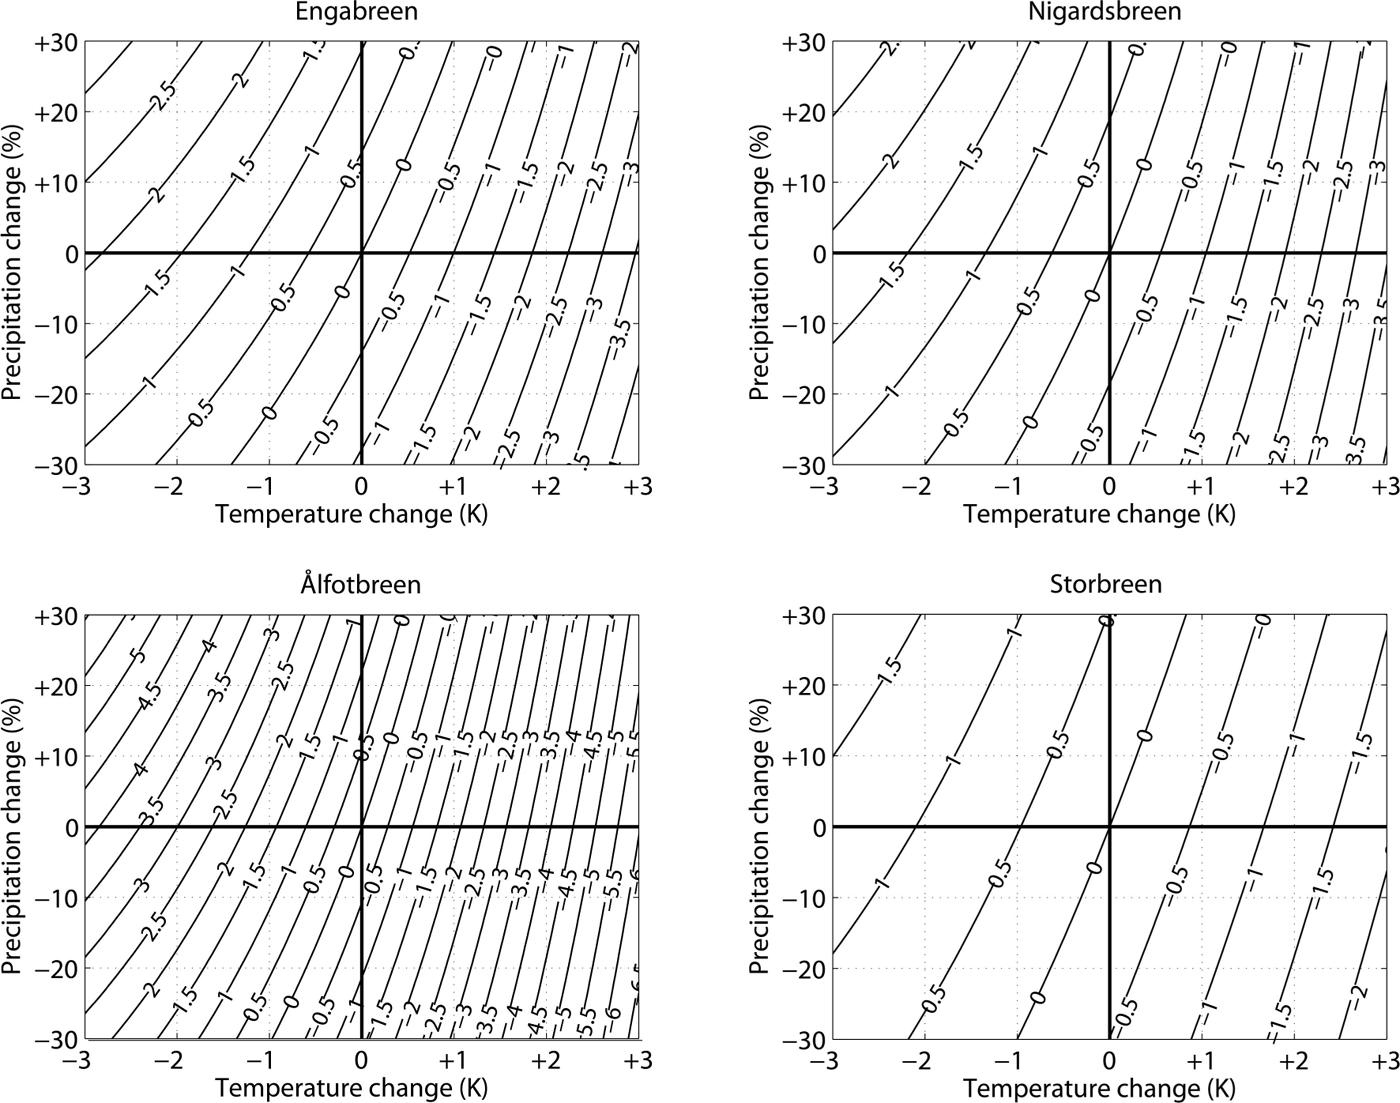
Fig. 3. Sensitivity of annual mass balance (m w.e.) to changes in annual temperature and precipitation.
Ålfotbreen, the most maritime glacier in the study, shows the largest mass-balance sensitivity to both temperature and precipitation changes of all four studied glaciers. At 1.74 m w.e. K−1, the mass-balance sensitivity of Ålfotbreen to temperature change is about twice as large as for Engabreen and Nigardsbreen, and more than three times as large as for Storbreen (Table 4). Though less pronounced, the mass-balance sensitivity to precipitation change is also largest at Ålfotbreen. However, considering not the absolute but the relative seasonal mass-balance sensitivities, Ålfotbreen differs from the other glaciers only for the summer balances (Table 4).
Analysis of monthly mass-balance sensitivities reveals that November and April are the months when Ålfotbreen shows largest winter mass-balance sensitivity to precipitation change among the studied glaciers (Fig. 4). In the other months, sensitivity of winter mass balance to precipitation change is similar in the four studied glaciers. The sensitivity of annual mass balance to a temperature rise is highest at Ålfotbreen for all months. The most striking difference between Ålfotbreen and the other glaciers is the extremely high winter mass-balance sensitivity to temperature changes for the period September through January (Fig. 4), with the highest sensitivity in September.
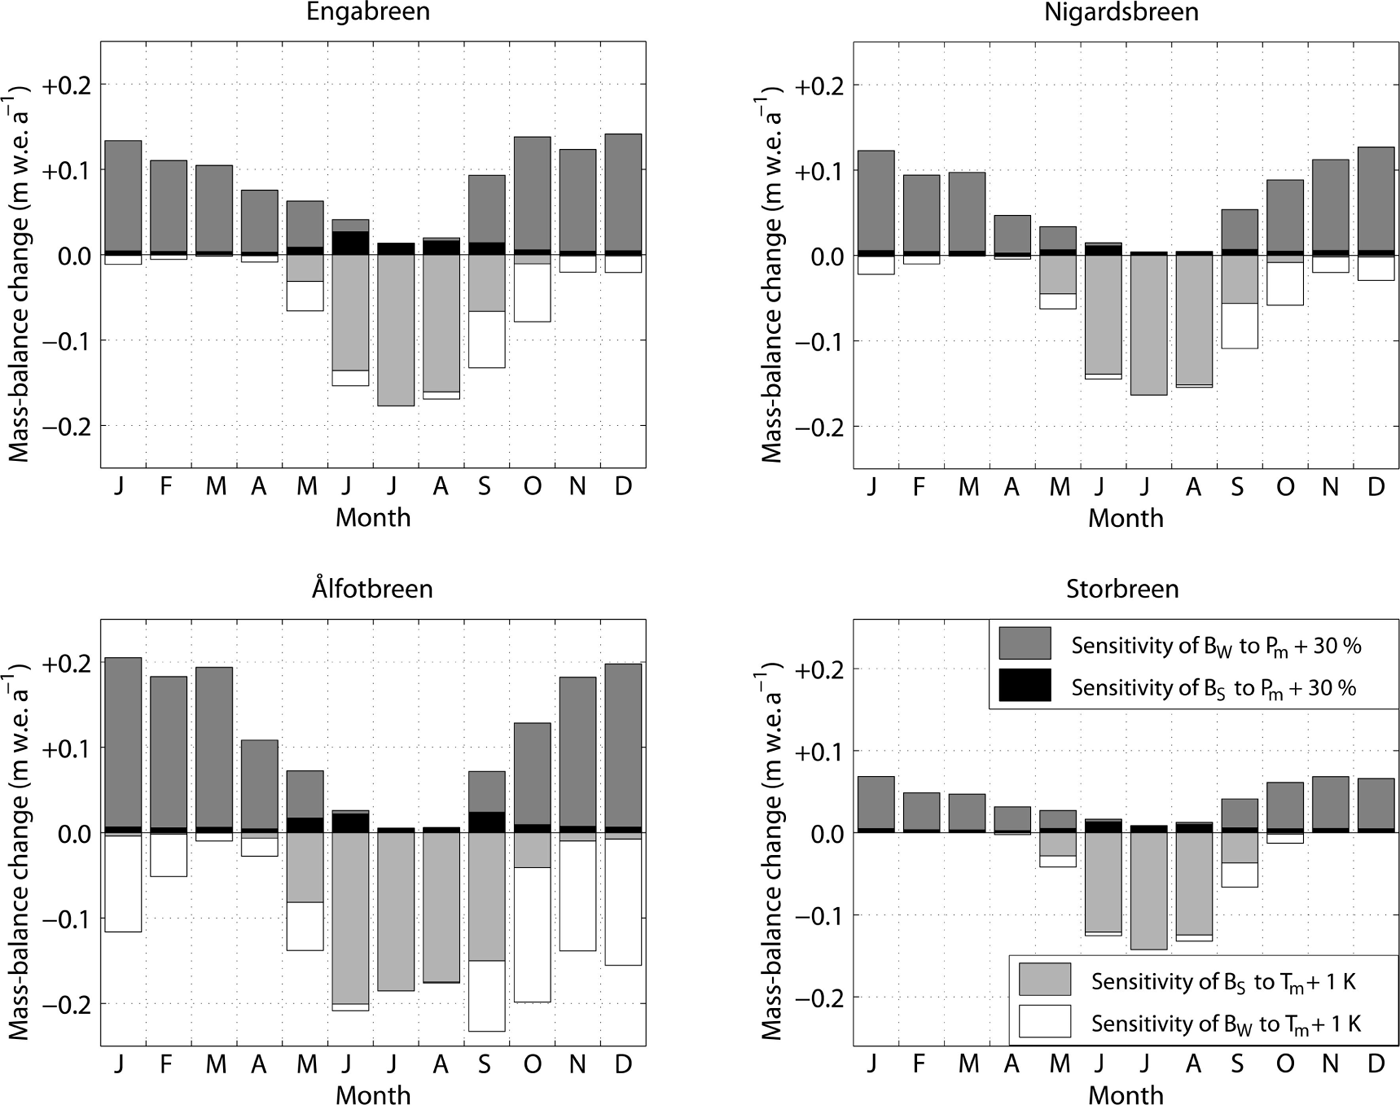
Fig. 4. Sensitivity of winter mass balances (β W) and summer mass balances (β S) to increases in monthly temperature (T m) by 1 K and increases in monthly precipitation (P m) by 30%.
Monthly mass-balance sensitivities for Engabreen and Nigardsbreen are quite similar (Fig. 4). However, for temperature changes in May to October, Engabreen shows a higher mass-balance sensitivity than Nigardsbreen. For June to August, the higher mass-balance sensitivity at Engabreen is due to higher sensitivity of the summer mass balance, and in May, September and October, due to higher sensitivity of the winter mass balance to temperature changes. In September and October, Engabreen shows the highest mass-balance sensitivity to precipitation changes of all the studied glaciers.
Storbreen has the lowest mass-balance sensitivity of the four glaciers for both temperature and precipitation changes. At this glacier, the sensitivity to monthly changes reveals no changes in glacier mass balance due to temperature variation between November and March. In addition, the mass-balance sensitivity to a temperature rise in summer is smaller than for the other studied glaciers, and the sensitivity to precipitation varies less throughout the year than at the other glaciers.
Runoff sensitivity
A 1 K increase in mean annual air temperature leads to a 20–25% increase in the annual runoff sum from the catchments (Fig. 5). However, a temperature decrease in the same range only reduces the runoff by 14–23% (Table 5). This asymmetry in temperature sensitivity is strongest for the Nigardsbreen catchment, where a 3 K temperature increase is modeled to almost double the runoff.
Table 5. Mean modelled runoff, absolute (m3 s−1) and relative (%) runoff sensitivities (R) for the studied catchments (1961–2012) using perturbations in mean annual air temperature (index T ) and precipitation sum (index P )
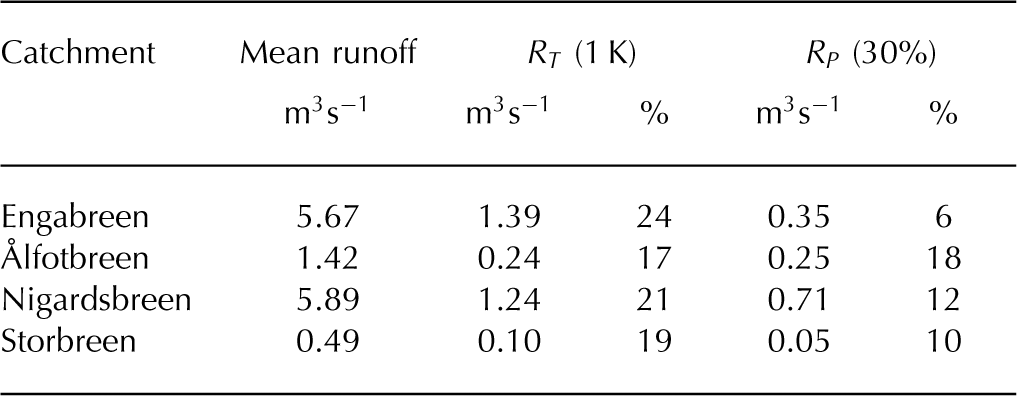
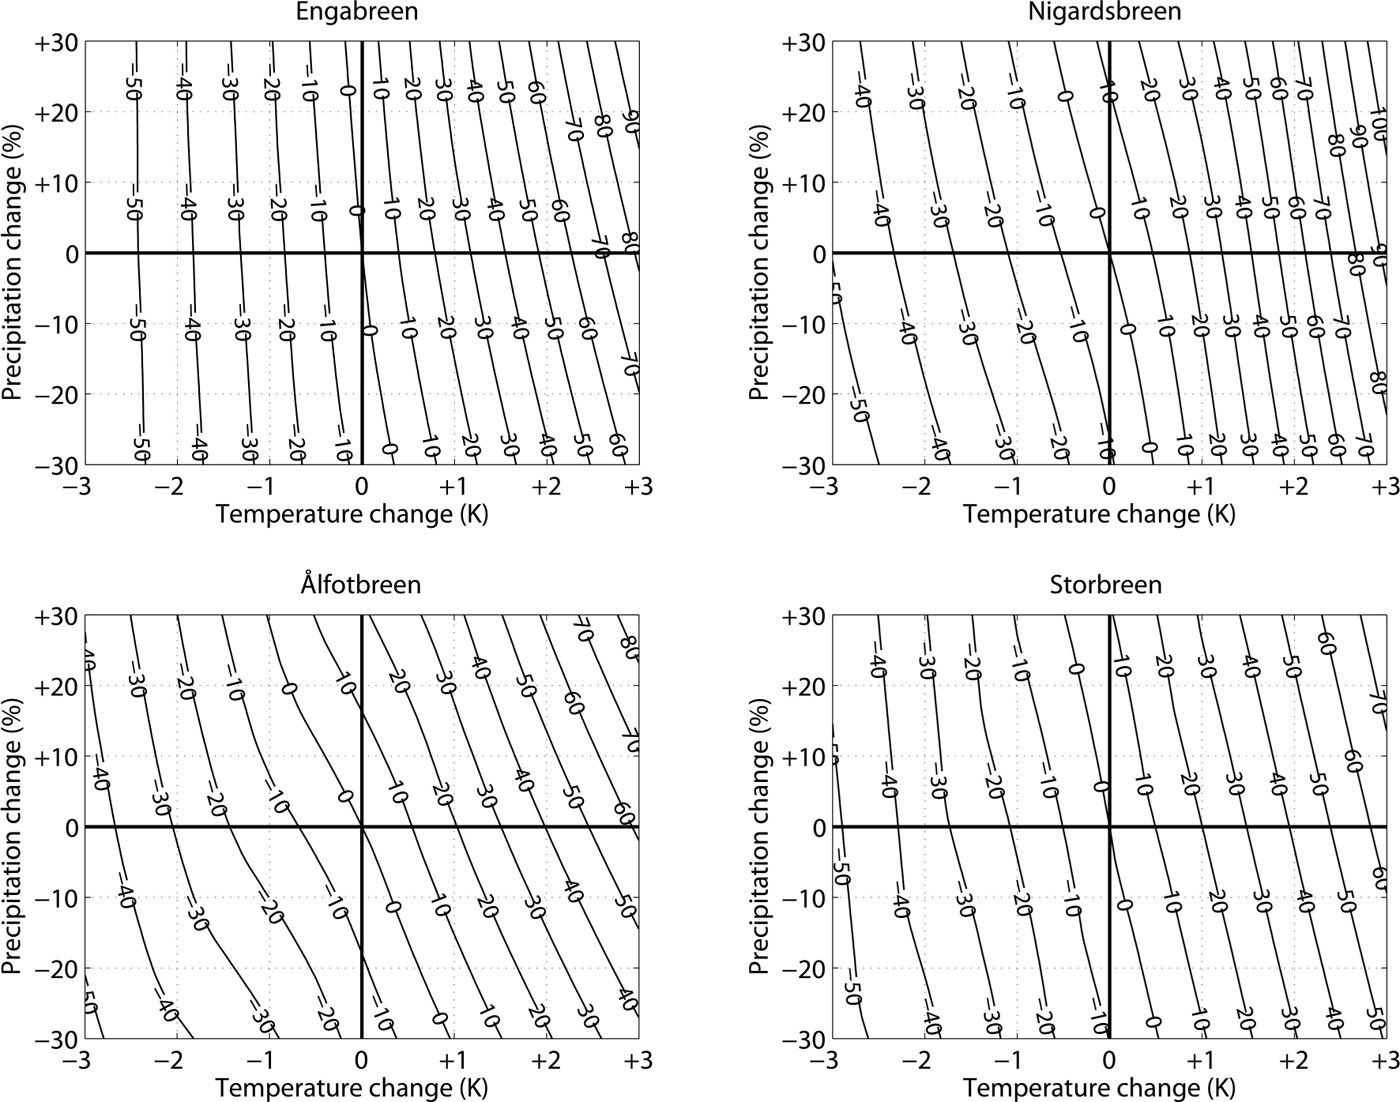
Fig. 5. Sensitivity of annual runoff (%) to changes in annual temperature and precipitation.
Whereas a 30% precipitation increase would approximately compensate a 1 K temperature increase for the annual mass balances, the combination of such temperature and precipitation changes would lead to a 31–38% increase in annual runoff from the catchments (Fig. 5). A precipitation decrease in the catchments can be compensated by enhanced meltwater release from the glacier storage, accomplished by a temperature increase. To compensate for a 30% precipitation decrease, the necessary temperature increase in the Ålfotbreen catchment is 1 K, but only ~0.5 K in the Nigardsbreen and Storbreen catchments. For the Engabreen catchment, a 0.35 K temperature increase is enough to compensate a 30% precipitation decrease. Whereas a 30% precipitation change leads to a runoff change of ~10% at the Nigardsbreen and Storbreen catchments, this impact is about twice as large at Ålfotbreen, where the rain contribution to runoff is much higher than at the other two catchments (Reference Engelhardt, Schuler and AndreassenEngelhardt and others, 2014).
The runoff sensitivities to monthly perturbations of air temperature (by +1 K) and precipitation sum (by –30%) are, in terms of seasonality, similar to the mass-balance sensitivities (Fig. 6). Runoff is least sensitive to temperature changes in March, when temperatures in the Ålfotbreen catchment are still low (Fig. 2). Due to low temperatures, for the Storbreen catchment a 1 K temperature increase between November and March has no influence on the annual runoff sum. For the Ålfotbreen catchment, the runoff sensitivities to temperature changes are fairly constant from May to January, whereas the Nigardsbreen and Storbreen catchments show a clear maximum in the runoff sensitivity to a temperature rise in June to September. For the Ålfotbreen catchment, runoff is most sensitive to a precipitation decrease for the period August to December, when both precipitation and the relative contribution of rain to runoff are high. The compensation of a 1 K warming with a 30% decrease in precipitation for the Ålfotbreen catchment as seen for annual mean values is also visible for such changes in most months. However, in late winter/early spring it is mostly precipitation changes, and in spring/early summer mainly temperature changes, that affect annual runoff. In the Nigardsbreen catchment, precipitation changes in summer and early fall have the largest impact on annual runoff. In the Storbreen catchment, sensitivity to precipitation changes is narrowed down to the three summer months.

Fig. 6. Sensitivity of annual runoff (%) to an increase in monthly temperature (T m) by 1 K and a decrease in monthly precipitation (P m) by 30%.
Discussion
Although a simple melt-index model has been applied in this study, the calculated mass-balance sensitivities correspond well with results of similar studies with different model approaches and for different glaciers in Norway (e.g. Reference De Woul and HockDe Woul and Hock, 2005; Reference Rasmussen and ConwayRasmussen and Conway, 2005; Reference SchulerSchuler and others, 2005; Reference Andreassen and OerlemansAndreassen and Oerlemans, 2009).
Generally, the glacier mass balance is affected by temperature changes during the ablation period and by precipitation changes during the accumulation period. However, temperature also affects the winter balance through the snow/rain threshold temperature T s. Higher temperatures shorten the accumulation period and therefore reduce the amount of precipitation falling as snow. This effect is most pronounced in late spring and early fall, when temperatures on the glaciers are close to freezing point and precipitations frequently shift between rain and snow. For glaciers in a more continental setting, the effect of monthly mean temperature changes during winter months is negligible.
High temperatures at Ålfotbreen throughout the year not only yield the highest melt efficiency compared to the other glaciers, but also the highest mass-balance sensitivity to both annual and monthly temperature changes. The negligible mass-balance sensitivities to temperature changes at Storbreen during winter (November to March) are due to low air temperatures that remain below freezing point even with 1 K higher monthly temperatures. In the Engabreen and Nigardsbreen catchments, winter temperatures are low enough that an increase in air temperature has little effect on the snow/rain ratio, whereas at the most maritime catchment of Ålfotbreen, winter temperatures are often close to freezing point. The high sensitivity of winter balance to temperature changes at Ålfotbreen between September and January can be explained by the high precipitation values and relatively high air temperatures during this period (Fig. 2). The temperatures are close to the melting point and the snow/rain threshold temperature. In addition to stronger melt, small temperature increases will have a considerable effect on the snow/rain ratio of the large precipitation sum and thus on the winter balance. Consequently, at Ålfotbreen, the annual mass-balance sensitivity to a temperature rise in a single month is highest, when temperature is changed in September. In this month, temperature variations influence both summer and winter mass balances. The high mass-balance sensitivity to temperature changes at Ålfotbreen is also found for maritime glaciers in other parts of the world (e.g. Reference Rasmussen and ConwayRasmussen and Conway, 2004; Reference Rasmussen, Conway and RaymondRasmussen and others, 2007).
Mass-balance sensitivity to annual temperature changes is not linear. As shown by Reference Oerlemans and FortuinOerlemans and Fortuin (1992), increased melt at higher temperature values is mainly the result of changes in melt-season duration, and to a lesser extent due to a shift of precipitation from snow to rain. However, with increasing temperature perturbations, the calculated sensitivity values are less reliable, as dynamic adjustments of the glaciers would strongly alter sensitivity values. The results of this study are based on a model using a degree-day approach. Such a model becomes increasingly unreliable when simulating the effect of large temperature changes (Reference Gardner and SharpGardner and Sharp, 2009), since the empirical model parameters are adjusted to unchanged temperature and precipitation conditions.
Although the Engabreen and Nigardsbreen catchments are located in different climatic settings in terms of latitude and distance to the coast (Fig. 1), both glaciers show similar temperature and precipitation sensitivities. Engabreen’s slightly higher mass-balance sensitivities to temperature changes during the summer months can be explained by the high daily solar radiation values during summer at this latitude, which enhance the melt potential (Eqn (2)).
The influence of precipitation changes on the summer balance is generally small. However, fresh snow from cold weather events on a glacier almost shuts down melt due to the high albedo (Reference Brock, Willis, Sharp and ArnoldBrock and others, 2000; Reference Oerlemans and KlokOerlemans and Klok, 2004). Summer mass balances are also affected by an increase in winter precipitation through prolongation of the snowmelt period and delaying the onset of the more efficient melt of firn or ice.
Reference Anderson and MackintoshAnderson and Mackintosh (2012) show that mass balance of maritime glaciers is mainly sensitive to precipitation changes, but also to topographic characteristics (e.g. debris cover and topography). Thus, the asymmetric runoff sensitivities to temperature (Fig. 5), which are more pronounced at Engabreen and Nigardsbreen than at the other two catchments, may be explained by the hypsometry of the glaciers, which cover >50% of the respective catchment areas. At Engabreen and Nigardsbreen, a rise in the average equilibrium-line altitude (ELA) by 200 m, compared to the 1970–2012 average, would reach the elevation of the main plateaus at both glaciers and lead to a doubling of the ablation area. Mass-balance measurements reveal that at all four studied glaciers, the ELA for the period 2001–10 was on average ~100 m higher than for the period 1970–2000 (Reference Kjøllmoen, Andreassen, Elvehøy, Jackson and GiesenKjøllmoen and others, 2011). For the same periods the seNorge data show an increase in mean summer temperature by ~1 K. For the period 2001–10, annual runoff from the Nigardsbreen catchment was ~20% higher than for 1971–2000 (Reference Engelhardt, Schuler and AndreassenEngelhardt and others, 2014), although the mean annual precipitation sum in the catchment decreased by ~10%.
The elevation range between the average ELA and the maximum glacier elevation at Ålfotbreen is 214 m (Table 2), much smaller than for Engabreen or Nigardsbreen, where it is more than twice as large. Thus, at Ålfotbreen, a further rise in the ELA would surpass the maximum glacier elevation faster than at the other glaciers. This would cause the loss of most of the accumulation area and a fast shrinkage of the glacier area. For Hardangerjøkulen, an ice cap in southern Norway with an elevation range <800 m, Reference Giesen and OerlemansGiesen and Oerlemans (2010) showed that the annual mass balance is projected to become negative at all elevations and the glacier will disappear by the end of the 21st century assuming a 3 K linear temperature increase during this period.
Long-term forecasts for western Norway project a rise in summer temperature by ~2°C by the end of the 21st century (Reference Nesje, Bakke, Dahl, Lie and MatthewsNesje and others, 2008). For glaciers in a more continental climate setting like Storbreen, such an increase will double the period of potential glacier melt (Reference Andreassen and OerlemansAndreassen and Oerlemans, 2009). At all glaciers in Norway, such a temperature change would probably lead to a dramatic decrease in annual glacier mass balance and increase in runoff, before reduced glacier areas lead to a reduction in runoff, especially in late summer.
Conclusion
It was found that the sensitivities of both glacier mass balance and catchment runoff to temperature and precipitation changes show distinct seasonalities. Mass-balance sensitivities are generally smallest at Storbreen, the most continental glacier in this study, whereas Ålfotbreen, the most maritime, shows notably large mass-balance sensitivities to precipitation variations in October to January. Engabreen and Nigardsbreen show similar mass-balance sensitivities, with those of Engabreen being slightly the larger.
Although catchment size and degree of glacierization are similar for the Ålfotbreen and Storbreen catchments, the difference in climatic conditions yields large differences not only in mass-balance sensitivities but also in runoff sensitivities to changes in temperature and precipitation. Whereas runoff sensitivities to monthly temperature or precipitation changes from the Ålfotbreen catchment are high throughout the year, for the Nigardsbreen and Storbreen catchments they become concentrated towards the summer. In addition, from Ålfotbreen to Storbreen, runoff becomes more sensitive to temperature changes and less sensitive to precipitation changes. The Nigardsbreen catchment, located between these two catchments, shows intermediate runoff sensitivities, similar to those in the Engabreen catchment. However, due to its geometry and large glacier size, runoff from the Nigardsbreen catchment is likely to show the largest relative increase as the ongoing temperature rise continues.
Although the Norwegian mainland has a large north–south extent, the increasing continentality from west to east in southern Norway yields larger differences in mass-balance and runoff sensitivities to changes in temperature or precipitation than between northern and southern Norway. The calculated glacier mass-balance sensitivities as well as the runoff sensitivities may assist in analyzing impacts of both observed and projected annual and seasonal temperature and precipitation changes in Norway.
Acknowledgements
We thank the glacier group of the Norwegian Water Resources and Energy Directorate (NVE) for providing both mass-balance and runoff data for this study. We also thank the scientific editor Guðfinna Aðalgeirsdóttir and especially R. Giesen and an anonymous referee who contributed constructive comments that significantly improved the manuscript. This publication is contribution No. 61 of the Nordic Center of Excellence SVALI, ‘Stability and Variations of Arctic Land Ice’, funded by the Nordic Top-level Research Initiative (TRI).


