


Nomenclature
- AAIB
-
Air Accident Investigation Branch (UK)
- ARM
-
Accident Route Matrix
- ARM-UAS
-
Accident Route Matrix adapted for uncrewed aerial systems
- ATOL
-
Automatic Take-off and Landing
- BVLOS
-
beyond visual line of sight
- CAA
-
Civil Aviation Authority (UK)
- EASA
-
European Union Aviation Safety Agency
- FAA
-
Federal Aviation Administration
- GA
-
general aviation
- GCS
-
ground control station
- HFACS
-
Human Factor Analysis and Classification System
- IATA
-
International Air Transport Association
- LOC
-
loss of control
- LOC-I
-
loss of control in flight
- RPAS
-
remotely piloted aircraft system
- UAS
-
uncrewed aerial system
- UAV
-
uncrewed aerial vehicle or ‘drone’
- VLOS
-
visual line of sight
1.0 Introduction
According to the US Department of Defence, accidents involving uncrewed arial vehicles (UAVs or ‘drones’) may be up 30 times greater than those for crewed aircraft [Reference Nisser and Westin1,Reference McCarley and Wickens2]. Previous research has confirmed that loss of control in flight (LOC-I,deviation from intended flight path) is the most prominent category of fatal accident for commercial, business and general aviation [3,4]. Causal and contributory factors have been previously analysed to identify safety interventions and post-event recovery methods to help prevent future accidents [Reference Bromfield and Landry5,Reference Jacobson6]. A recent report suggests that LOC-I (UAV unresponsive to operator control inputs, erratic or uncommanded responses) is also the most prominent category of accidents (36%) for UAVs [7]. Causal and contributory factors leading to UAV accidents have not been previously investigated to the same degree as commercial, business and general aviation accidents. UAVs are aircraft operated remotely without direct human intervention onboard the aircraft [8]. When referring to uncrewed aerial systems (UAS) the UAV aircraft is considered with all associated components: operator, ground control station (GCS), cameras etc. [Reference Qassim9]. Sometimes these systems are also referred to as remotely piloted aircraft systems (RPAS) [8]. In this paper we will use the term UAV to describe the aircraft and UAS to describe the holistic system.
There is no current definition of LOC-I specifically for UAVs, therefore to categorise accidents caused by LOC-I definitions for general/commercial aviation from different aviation authorities, EASA (European union Aviation Safety Agency), FAA (Federation Aviation Administration) and IATA (International Air Transport Association) were used (Table 1). For this research the definition used is a combination of EASA and FAA, being ‘Loss of Control in Flight is the unintended departure of an aircraft from controlled flight by deviating from the intended flight path’, hence considering recoverable accidents to further investigate if recovery mechanisms were used, be they successful or unsuccessful.
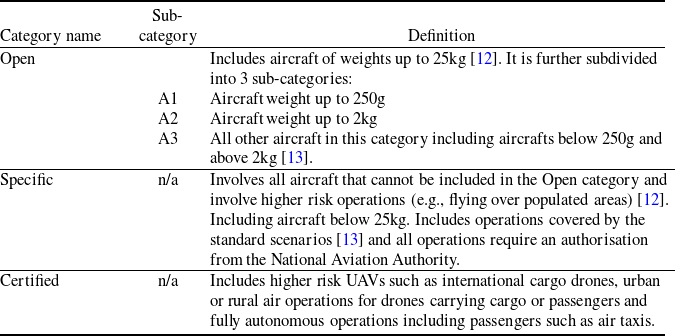
Detailed EASA and Civil Aviation Authority (CAA) regulations were introduced in June 2019 [12] dividing UAVs into categories according to size and weight, applying different regulations per category. UAVs are divided into three main categories: Open, Specific, and Certified [13] (Table 2).
This categorisation is only relevant to accidents after June 2019 [12], when these regulations were first introduced. Prior to this, permission from the CAA was required to fly any drone [14], however there were no details to differentiate between drone sizes or types. Furthermore, stricter operations were only applied to drones with mass above 20 kg and operators were required to follow a full range of regulatory requirements [14]. It is evident that the publication of the EASA’s regulations provided more detail regarding smaller aircrafts despite them having the less strict regulations.
Defining causal and contributory factors is necessary to identify them within the individual accident reports. The causal factors were identified as actions, omissions, events, conditions or a combination thereof, that led to an accident or incident [Reference Council15]. Previous research loosely defined causes to LOC-I [Reference Kevin16] without using any set methodology and hence the frequency of each category and the sequence of events leading to LOC-I has not been defined. This research herein uses a methodology to categorise UAV accidents more accurately and provides a framework to characterise LOC-I for UAVs.
Table 1. LOC-I definitions from three different aviation authorities for general/commercial aviation
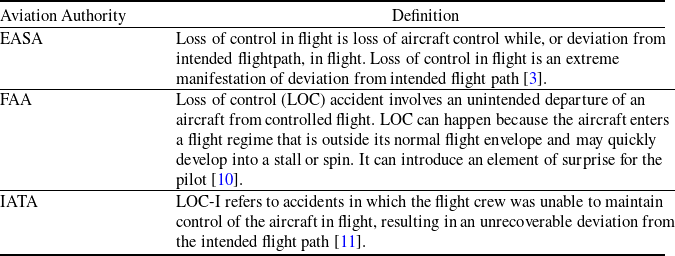
Table 2. UAV categories specified by EASA by weight and operation type (post June 2019)
Causal and contributory factors related to UAV accidents often involve human factors and these have been previously analysed for three different flying modes [Reference Kevin16]:
-
• External pilot
-
• Transfer of control
-
• Fully autonomous
Analysis concluded that external pilot control problems are related to inconsistency of the remote-control box (e.g. unresponsive equipment, not providing correct warnings or being affected by interference) to the aircraft [Reference Kevin16]. For transfer of control, communication problems between the operators were the main causes for LOC-I [Reference Kevin16]. Finally, that autonomous systems are not capable of predicting all circumstances [Reference Kevin16]. The findings indicated how automation problems could also cause further human errors due to operators losing situation awareness, operator mis-trust in automation or inability to resume manual control [Reference Nisser and Westin1]. It was therefore evident that for all flying modes the system used was problematic leading to poor human decisions, further discussed in this research.
Previous research in the general aviation (GA) sector analysing pilot situation awareness, concluded that with increasing of age situation awareness reduces [Reference Barr17], however there was no relationship identified between pilot’s situation awareness and flying experience [Reference Nilsson18]. This research will analyse the number of total flying hours, flying hours on type, operator’s age with respect to the number of accidents and recovery methods used, to understand the implication of these parameters in pilot’s situation awareness with UAVs. The relationship between age and experience of operators is also investigated to understand if they are connected.
UAVs can operate in two control modes: autonomous control or manual control [Reference Stevenson, O’Young and Rolland19]. Autonomous control relies on automation systems such as the autopilot, sensors and operating features such as ATOL [Reference Stevenson, O’Young and Rolland19]. The level of automation of a UAS is based on the complexity of the operation to minimise human errors [Reference ProttI and Barzan20] and UAV autonomy reduces the need for human interaction focusing more on essential tasks [21]. On the other hand, manual control modes allow the operator to have full control of the aircraft maintaining it within visual line of sight [Reference Stevenson, O’Young and Rolland19]. In this paper, when referring to autonomous or automated control, it is intended that from departure or when selecting this input from the ground control station, the pilot is not in control of the aircraft. Control modes could be interchangeable, and there can be different automation levels, such as autonomous flying but manual take-off and landing, hence there can be a period between control modes where the operator can be in control of the aircraft. In this research, the two control modes are considered as separate and independent of each other to identify the causal and contributory factors of the accidents, however if an accident occurs when changing control modes, factors is analysed based on pilot’s commands and response of the aircraft. The impact of the control mode on the number of accidents is analysed. The level of automation of UAVs as well as the relationship between the operator’s flying experience and the reliability on automation is analysed to understand its impact on the number of UAV accidents.
Recovery methods used in UAVs could be considered as part of the autopilot autonomy to identify failure and deploy a safety approach. Some recovery methods can be controlled manually by the operator [Reference Prisacariu, Pop and Cîrciu22]. In this research the recovery methods are analysed to understand if LOC-I is recoverable or irrecoverable.
Previous work by the authors yielded promising preliminary results [Reference El Safany and Bromfield23] and this was used to shape aims and objectives of the research contained in this study.
The aims of this research were:
-
• To identify the main causal and contributory factors leading to LOC-I for UAVs
-
• To understand how causal and contributory factors may lead to LOC-I and to highlight any patterns
The corresponding objectives were:
-
• To analyse the relationship between causal, contributory factors and the number of accidents
-
• To understand the main recovery methods applied to UAV accidents and if they prevented LOC-I
-
• To understand the impact of human error on UAV operations by analysing the relationship between flying experience, age, and interface with automation with respect to the number of accidents
-
• To create a framework to be used for education and training for UAV operations to assist in preventing accidents due to LOC-I
-
• To create a framework to aid in investigation of UAV LOC-I accidents
2.0 Methodology
A two-phased approach (Fig.1) was adopted for the research study, UAV Accident Analysis (Phase 1) followed by Framework Development (Phase 2).
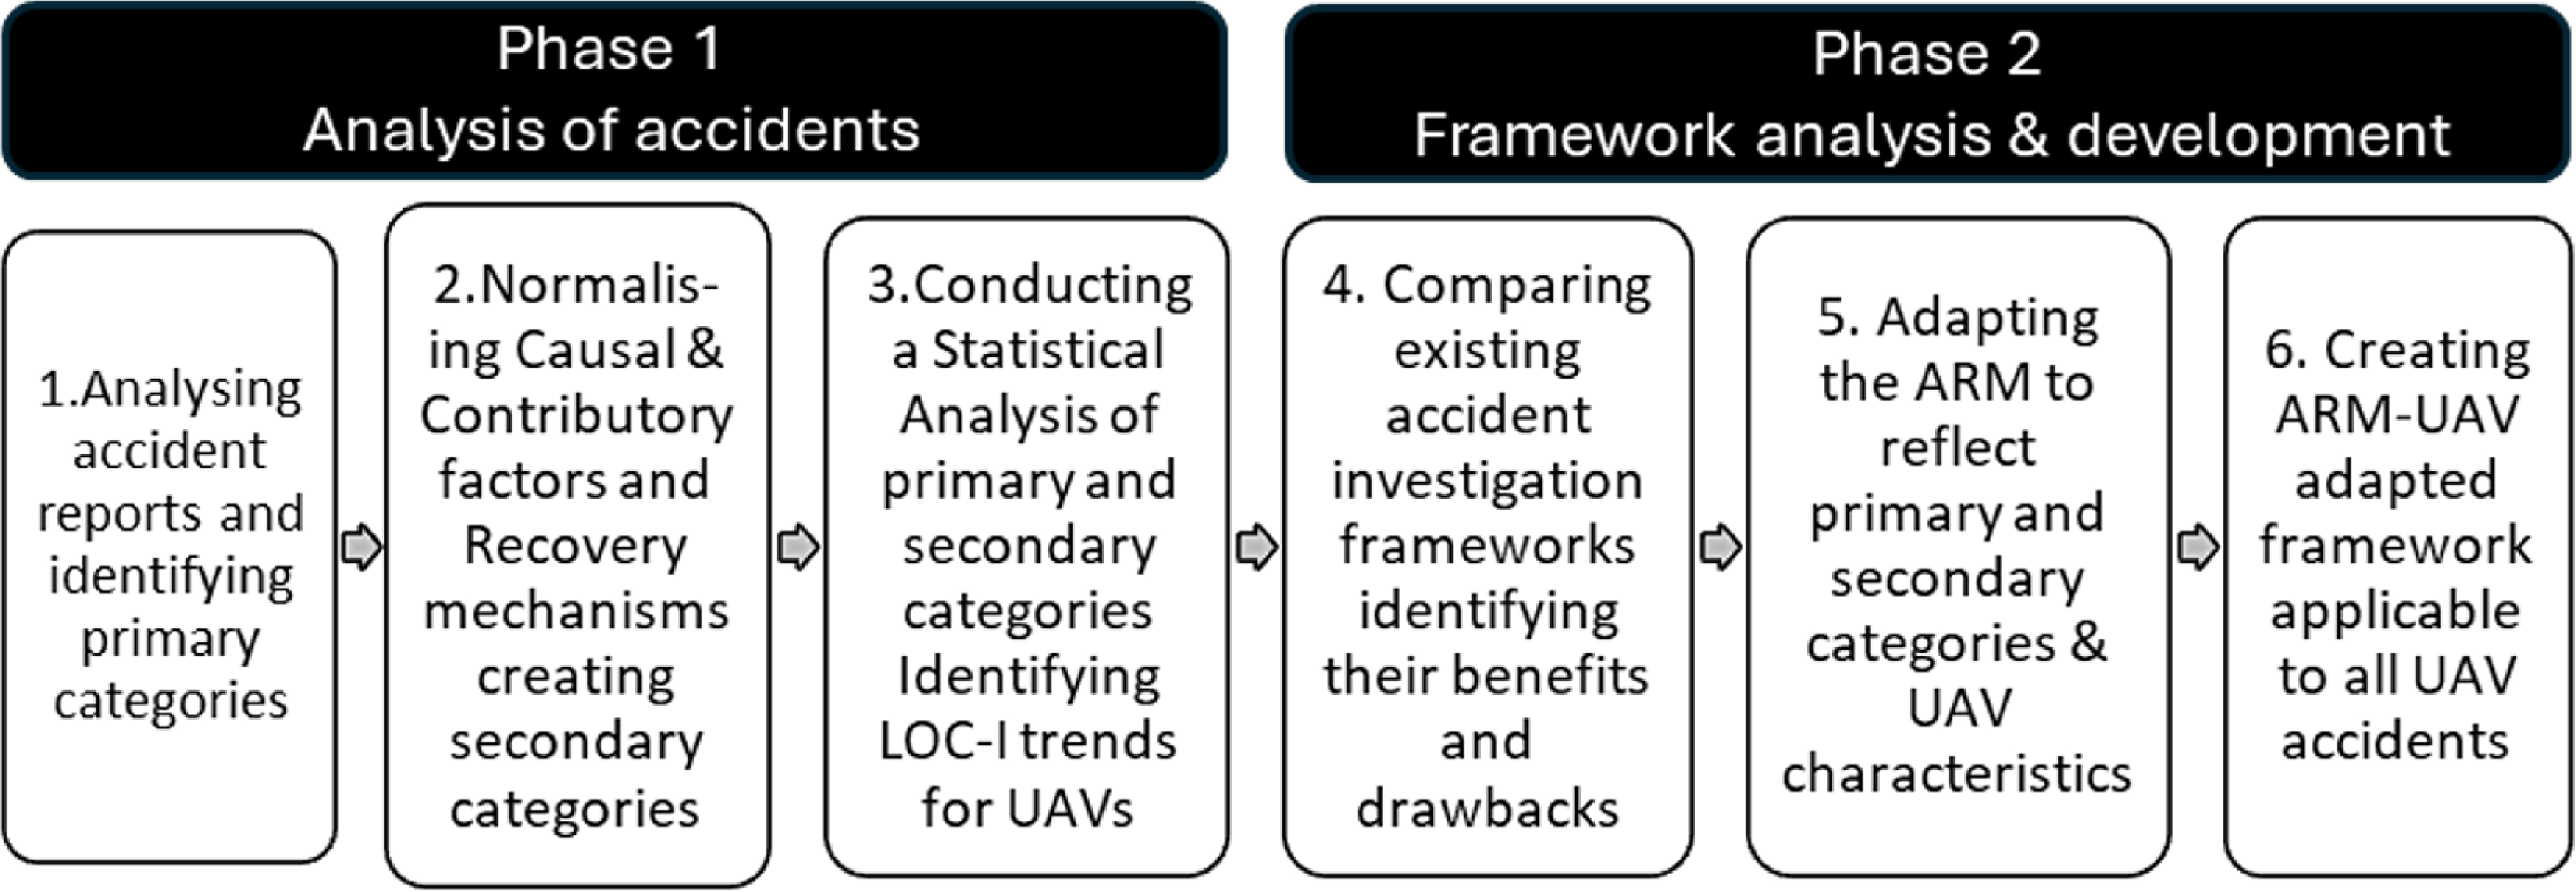
Figure 1. Methodology.
2.1 UAV accident analysis (phase 1)
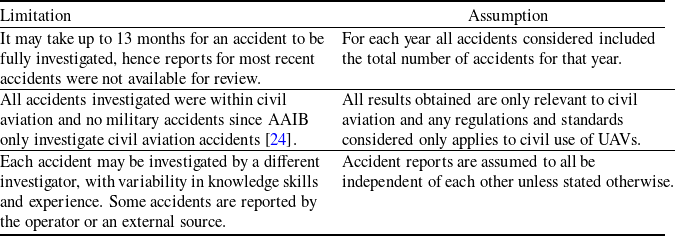
Accident reports were analysed to identify primary accident categories. The causal and contributory factors and recovery mechanisms were then normalised and secondary or sub-categories defined. A basic statistical analysis of primary and secondary categories was then conducted, identifying LOC-I trends for UAVs. The Air Accident Investigation Branch (AAIB) website [24] was used to obtain all accident reports involving UAVs for the period between April 2015 and July 2021 (64 events in total). Preliminary analysis of these reports indicated that 60 events (93.8%) were loss of control in flight events. These events included uncontrolled descent into terrain and uncontrolled mid-air collision with an object/structure/vehicle (Appendix A1). Assumptions were made to respond to the limitations of the analysis (Table 3). Before analysing each accident in detail, preliminary information was taken from each report to confirm the number of accidents suitable for analysis, including preliminary information such as pre-operating conditions that do not alter before or during flight but may have an impact on commander’s response. This was essential to categorise accidents and understand the common factors in accidents, specific types of flights and operator age etc. These categories were defined as primary categories.
Table 3. Limitations presented by analysing AAIB reports and key assumptions
Further analysis was completed for each accident to identify and categorise the main causal and contributory factors, these categories were defined through a normalisation process by allocating accidents in each category based on the similarity of the causal and contributory factors leading to an accident. The causes of the accidents were identified as the first event that occurred leading to an accident whether or not they were mitigated. They were then categorised by including accidents occurring for similar causes under the same category. Further to that, all other events leading to an accident after the primary causal factor were considered as contributory factors and categorised similarly. Similar accidents were then allocated to each contributory factor category and if more than one contributory factor is present in the same accident, the accident is allocated to each different category. The categories created were defined as secondary categories. This will create a larger number of contributing factors than causes however it will help to understand the frequency and likelihood of each contributory factor at different stages of operations. The definition of accidents included in each category was defined (Table5).
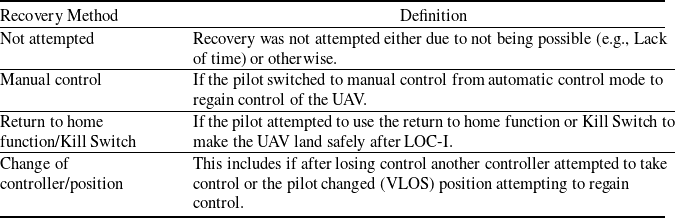
Statistical analysis was conducted on the primary categories (Table4) and secondary categories (Table 5), identifying the main trends in UAV accidents presented later in the results section. Recovery methods were investigated in relation to age, flying experience and experience on type. The same method was used to categorised recovery methods. The main recovery methods used in each accident were also defined (Table 6).
Table 4. Primary categories analysed and significance
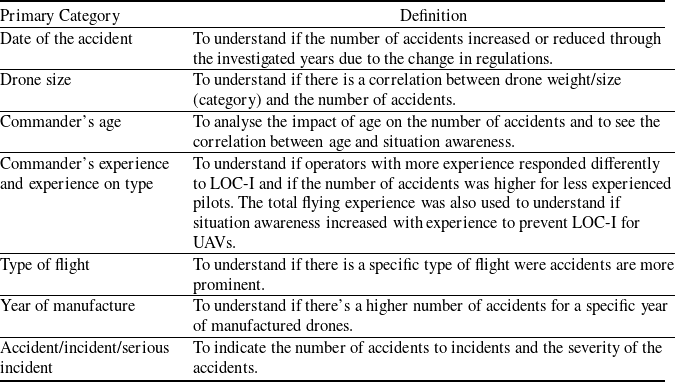
Table 5. Secondary categories of causal and contributory factors
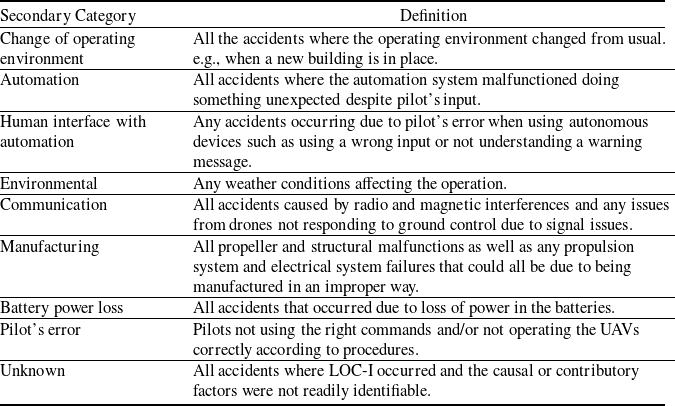
Table 6. Main recovery responses to LOC-I identified and their significance
2.2 Framework development (phase 2)
Causal and contributory factors were normalised and primary and secondary categories identified. The suitability of three of the most commonly used human factors analysis frameworks was then considered for more detailed analysis of UAV LOC-I accidents: Human Factors Analysis and Classification System (HFACS), AcciMap and the Accident Route Matrix (ARM).
2.2.1 Human factors analysis and classification system (HFACS)
The HFACS framework was developed to identify active and latent failures occurring due to causal categories [25] with the aim to understand the main factors leading to an accident caused by human decisions [25]. This framework compares events by the psychological origin of the unsafe acts as well as by the latent conditions within the organisation allowing for these acts to happen [25] which helps to identify common trends when comparing a large number of accidents and how to mitigate them. The framework is divided in levels and each level is categorised involving all possible failures so that one would occur at each level leading to the accident [25]. Figure 2 shows the HFACS framework containing all possible causal factors.
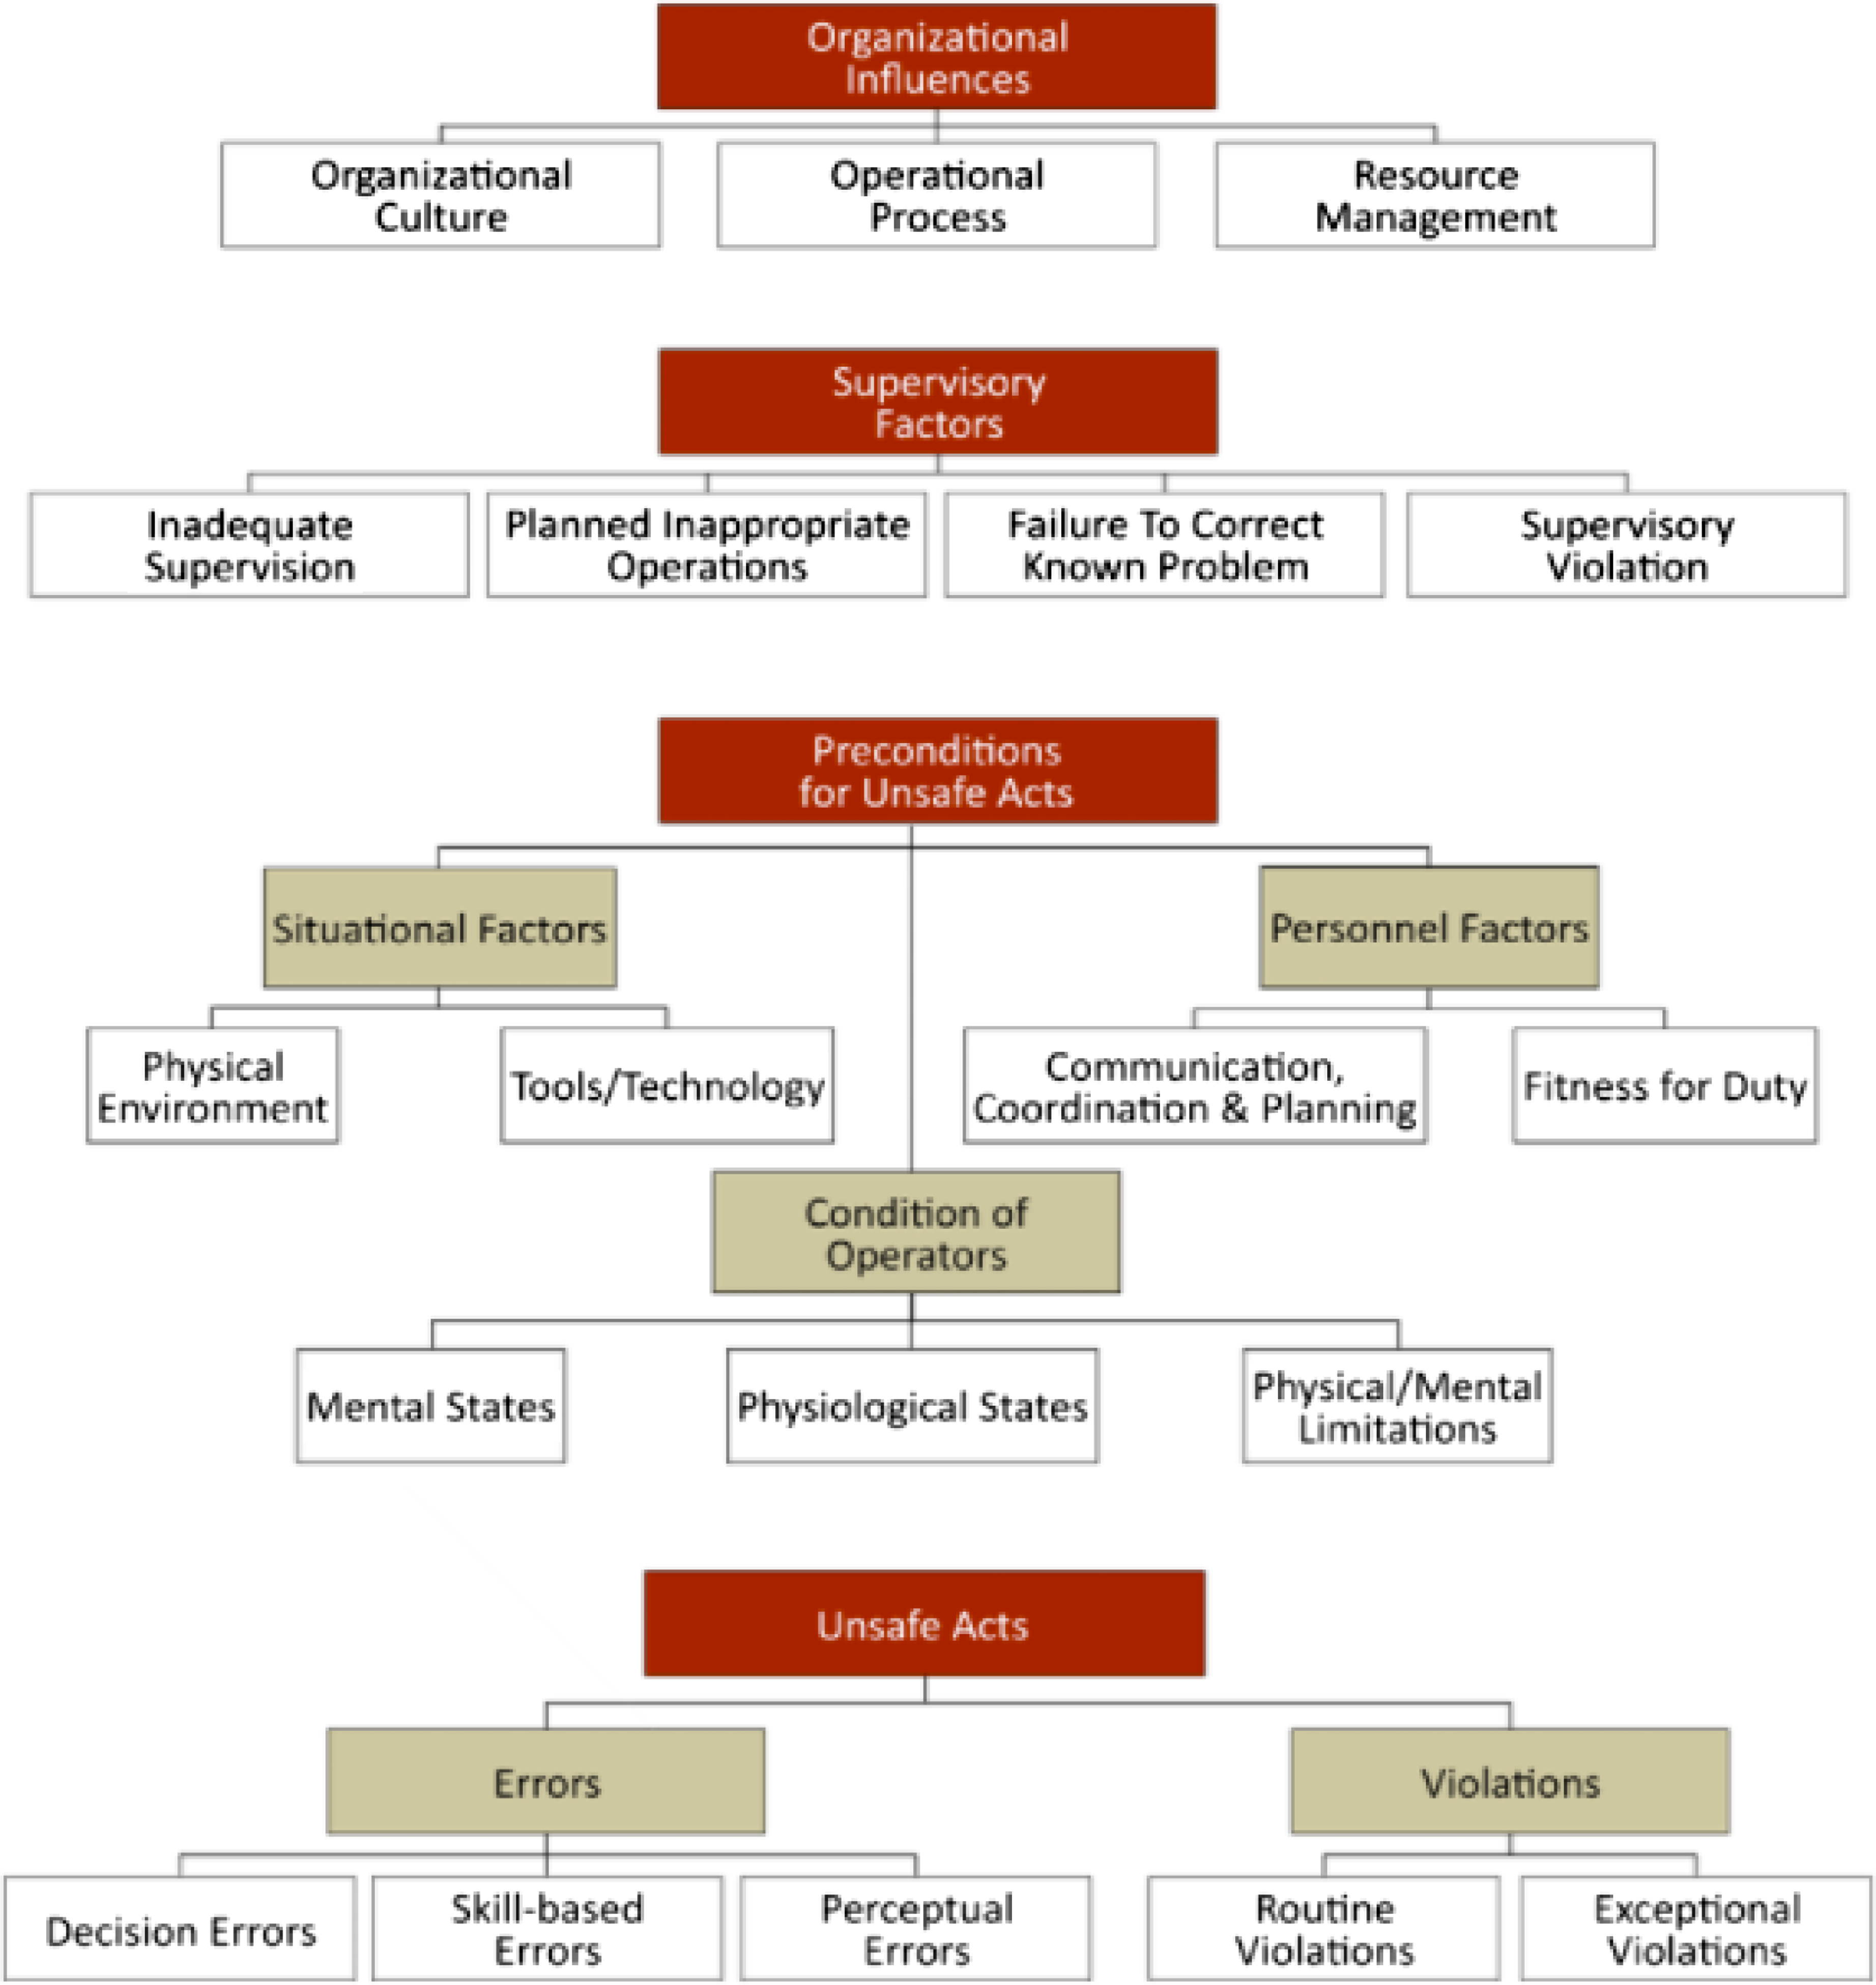
Figure 2. Generic HFACS framework [25].
This framework enables to present causal and contributory factors leading to an accident due to its hierarchical form whilst still considering events happening simultaneously. Furthermore, it shows when failure is prevented as it does not lead to the next event [25] considering the success of recovery methods. HFACs, however, only considers human factors as causes and does not include automation, manufacturing malfunctions and system or communication failures. Due to the nature of UAVs being highly autonomous vehicles a framework comprehensive of these factors is necessary.
The ARM was created by considering this framework and adapting it to military accidents [Reference Harris and Force26] which implies that HFACS was essential in creating the ARM.
2.2.2 Accident map (AcciMap)
The AcciMap framework maps the multiple contributory factors to an accident and their inter-relationships onto six levels [27]. This diagram was developed to identify a combination of events and decisions leading to an accident [27]. Decisions made at higher levels in the framework will lead to the lower-level decisions and actions [27] whilst still considering events occurring simultaneously. Despite the flexibility of this framework, it does not have predefined taxonomies of failures within each level [27]. This therefore limits the ability to categorise accidents and to identify trends and repetitions within them as every detail will be considered. This, however, makes the AcciMap framework ideal to represent one accident as it would provide all the detail necessary to understand the leading causal and contributory factors for LOC-I rather than being used for 60 or more accidents. This because it would not respond to the purpose of having a framework to schematically identify the main LOC-I causes in a succinct manner. An analysis of the accident involving the “DJI Inspire 2” UAV was done using AcciMap (Fig.3). The diagram clearly represents the stages in which each cause and contributory factors occurred, and which led to LOC-I. Despite this framework being very well indicative of the causal and contributory factors that lead to LOC-I, all information in the diagram is very specific to the accident, resulting in a large level of detail, hence, they can’t be used to mitigate future accidents unless they occur in the same manner. Due to the lack of specific taxonomy, the level of detail added when considering more than one accident would defeat the purpose of creating a framework to generally represent the main causal and contributory factors leading to LOC-I. This therefore concludes that the use of the AcciMap framework would not be ideal to include all 64 accidents but rather, it is more fitting to a single accident analysis when more detail is required.
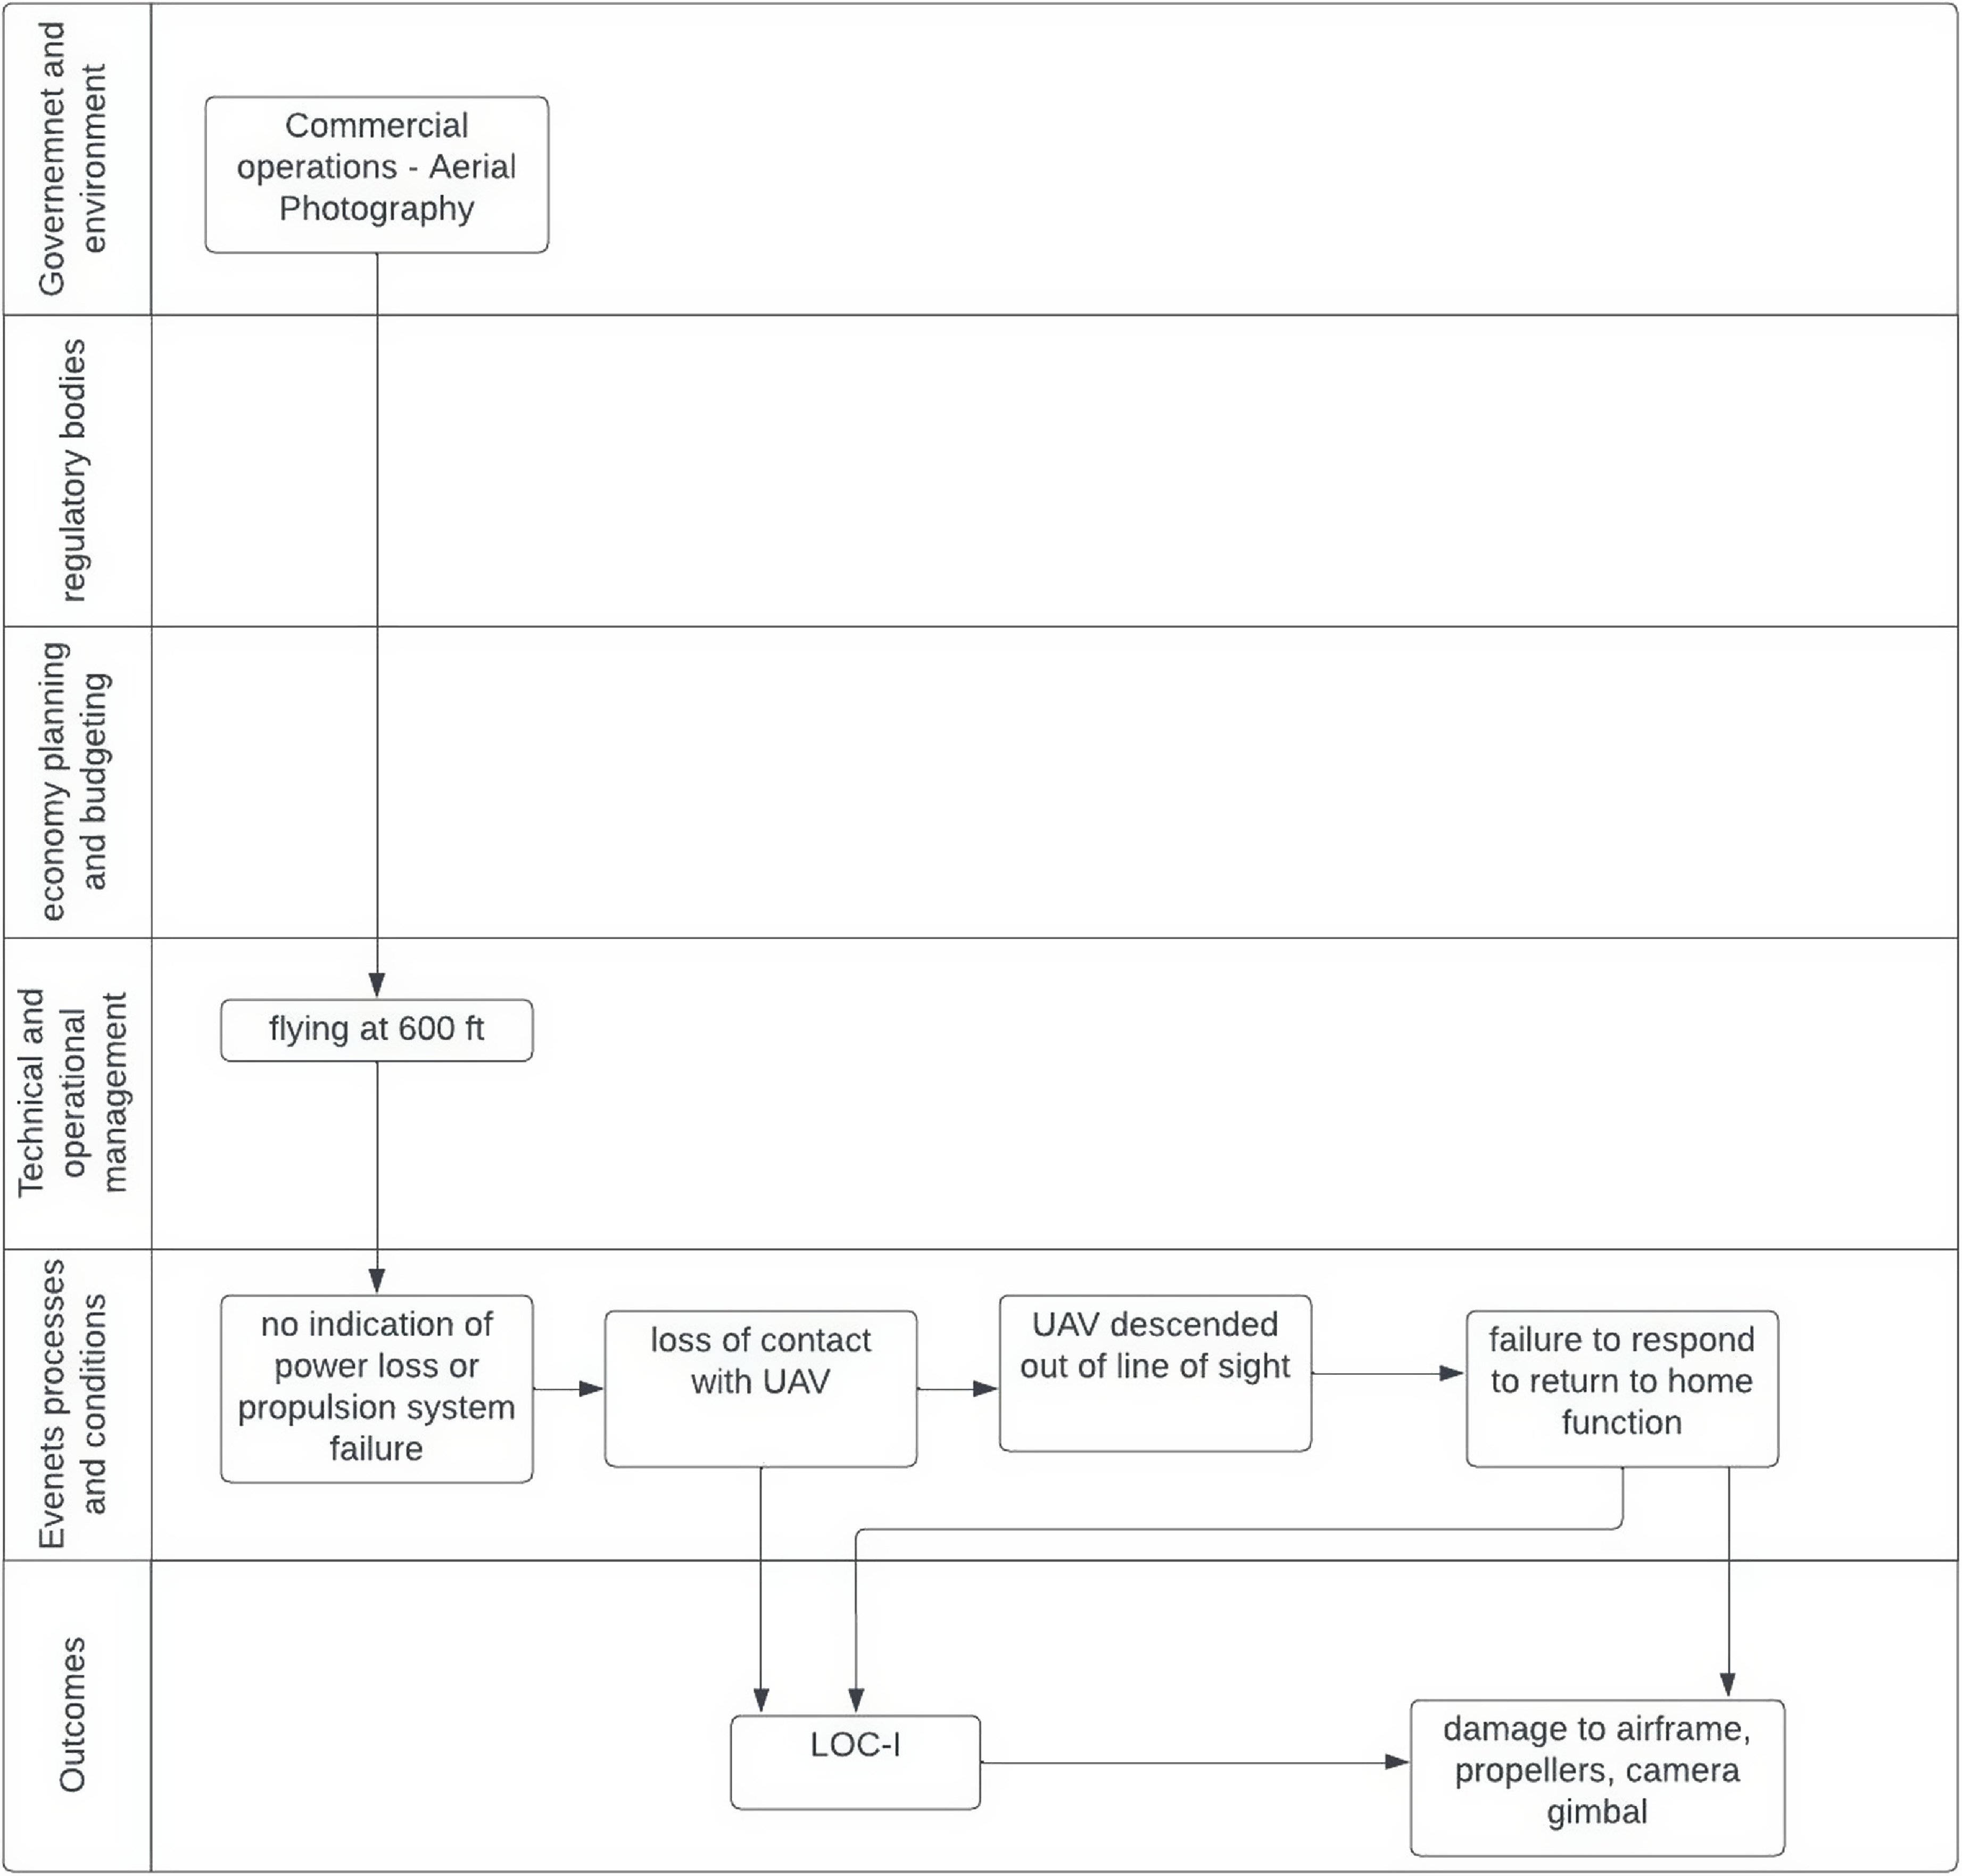
Figure 3. AcciMap framework representing example event (DJI inspire 2 LOC-I accident).
When comparing AcciMap to the ARM, the ARM is more succinct containing all required details to understand how LOC-I could occur and what order of events could make it happen including all 64 accidents. A limitation of using a framework however is that some more detailed information may not be included but rather considered as a subcategory and in providing this sort of detailed information AcciMap is more adequate. In conclusion the ARM is a result of a combination between AcciMap and HFACS, by using HFACS terms and definition to create specific categories in AcciMap whilst adding a timeline to represent the sequence of event.
2.2.3 Accident route matrix (ARM)
The ARM framework was developed by using the high levels from HFACS on the Y-axis and adapting them to military accidents whilst including a timeline on the X-axis [Reference Harris and Force26] creating an investigation matrix [Reference Weedon, Cutler and Revell28]. This generic framework (Fig. 4) includes equipment and environmental categories [Reference Harris and Force26] considering hence all automation, system failures, manufacturing and communication categories.
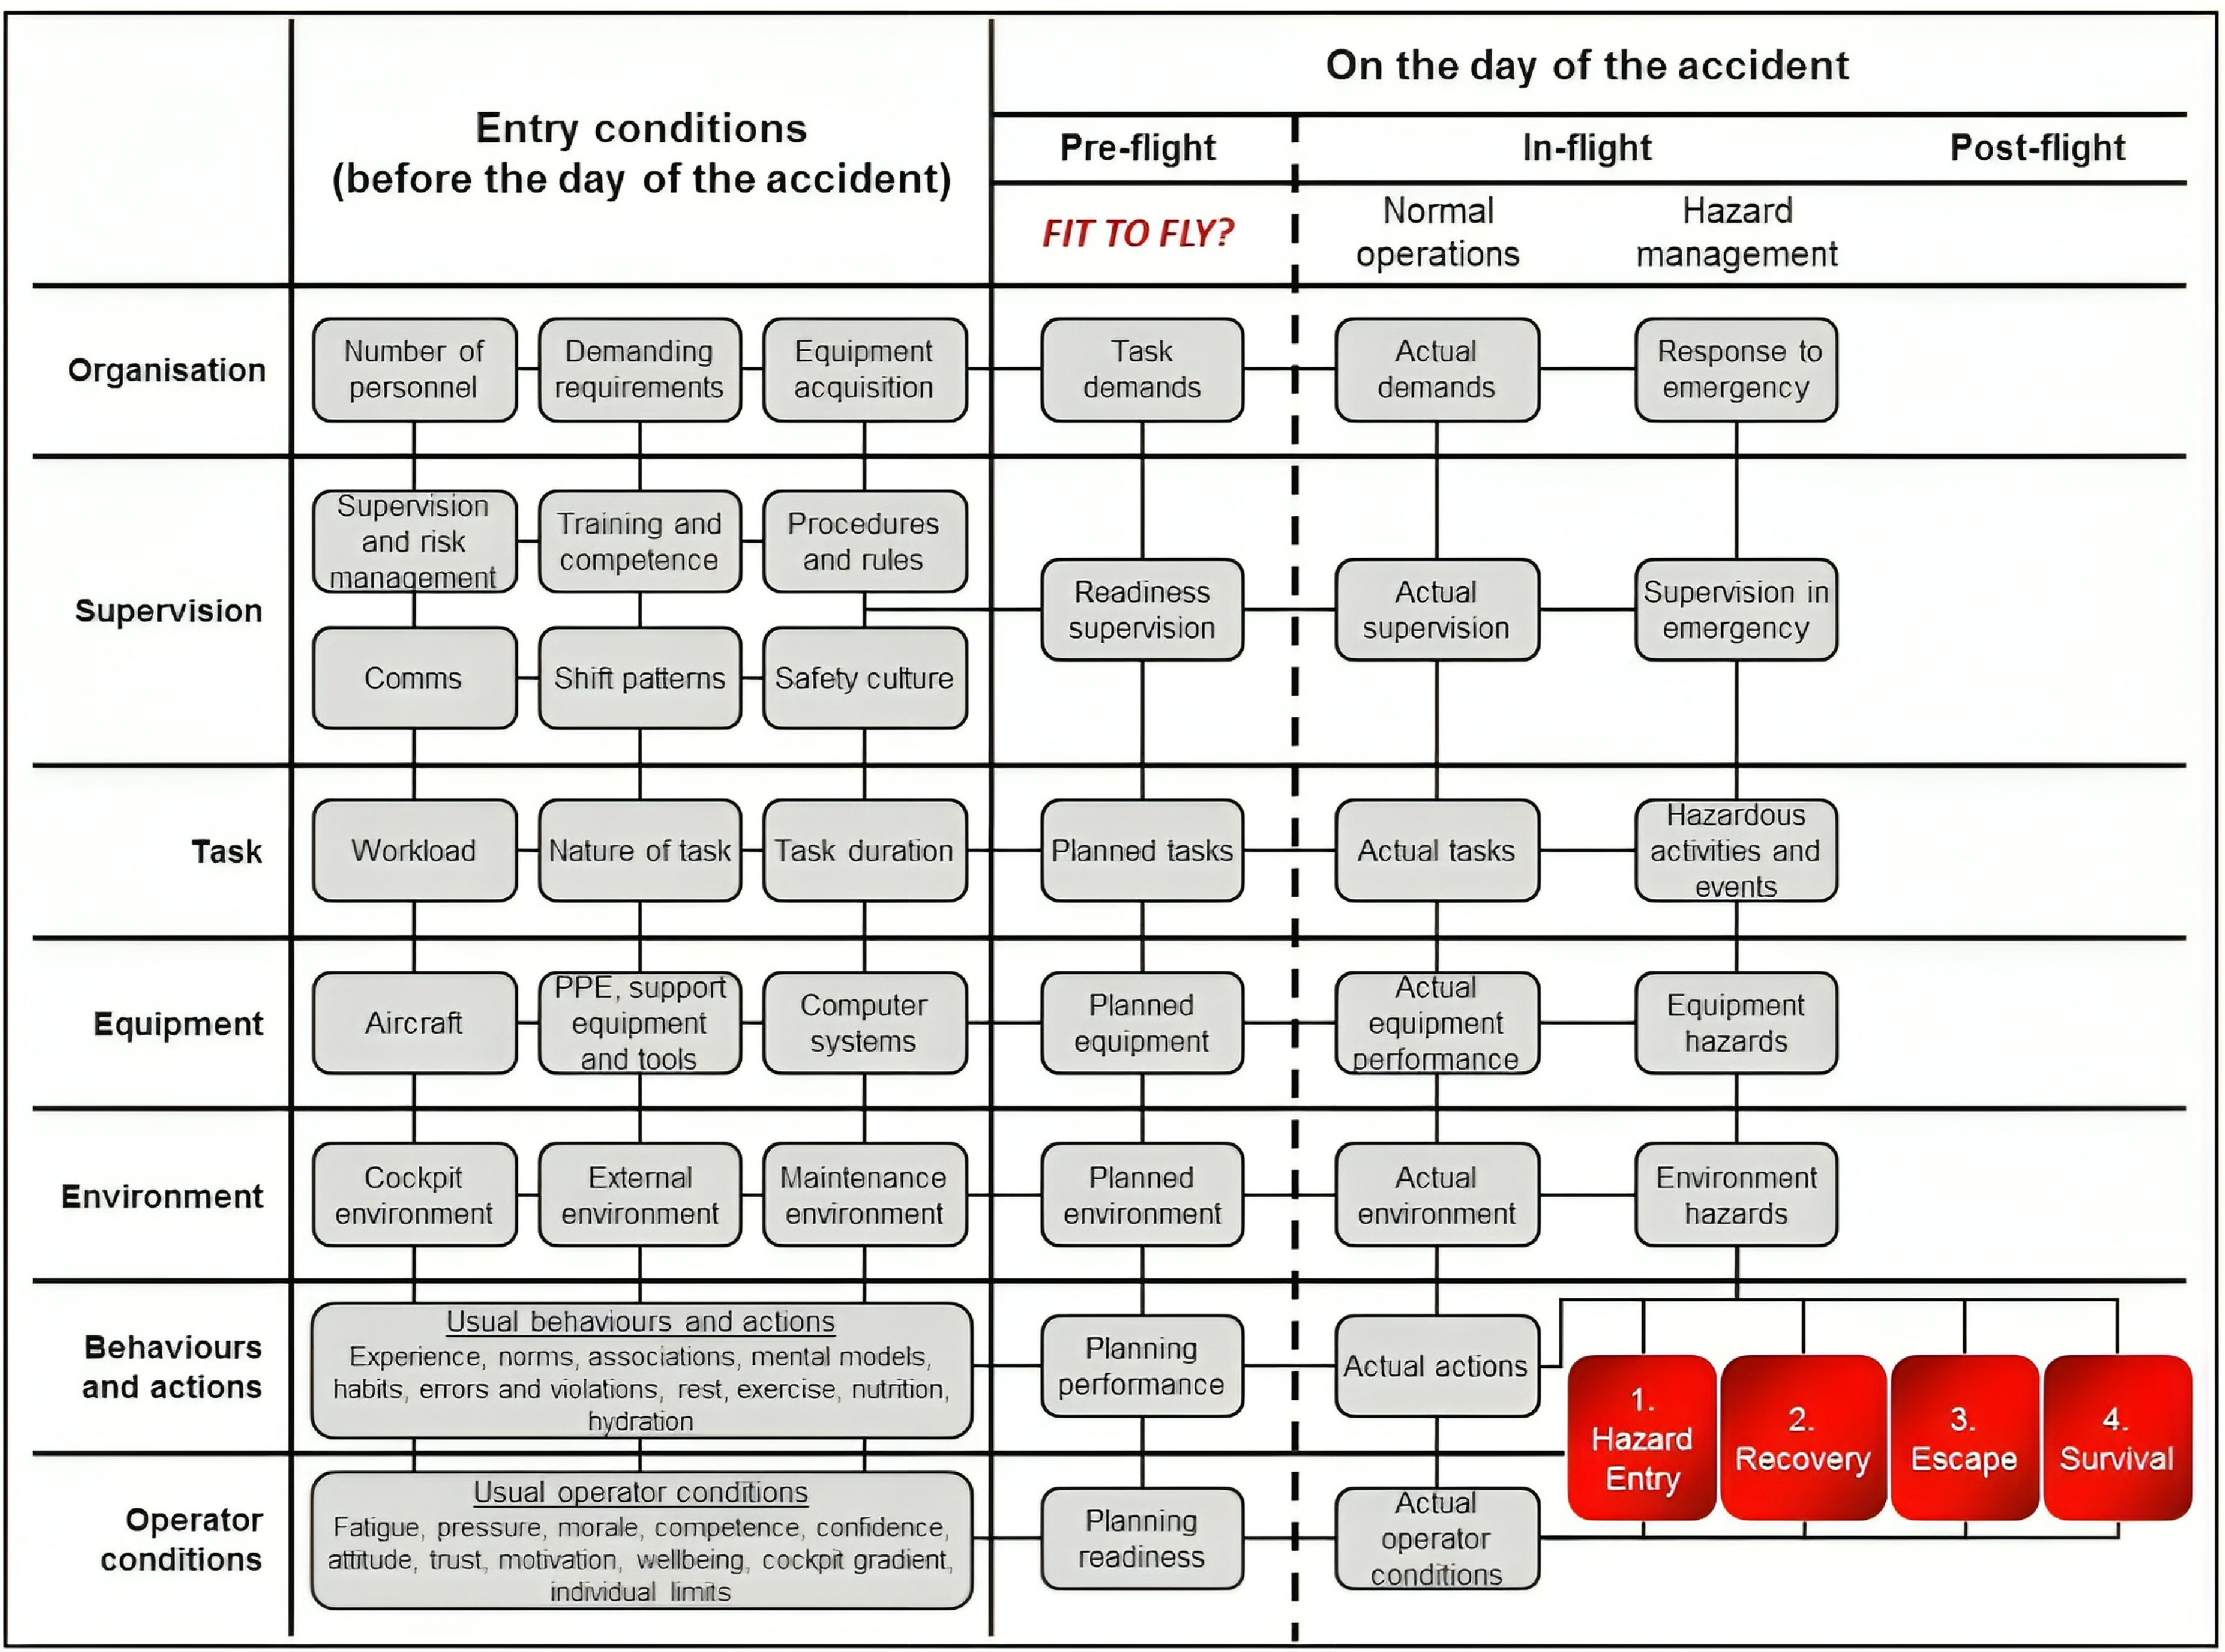
Figure 4. Generic framework for Accident Route Matrix [Reference Weedon, Cutler and Revell28].
The hazard management section shows the recovery outcome of an accident and pilot’s response to LOC-I. The ARM is a qualitative, flexible approach to analysing accidents [Reference Weedon, Cutler and Revell28] which enables the adaptation of the matrix to the nature of the accidents and the evidence gathered by adding or removing any unnecessary part of the diagram [Reference Weedon, Cutler and Revell28].
3.0 Results
The results of the analyses of the accidents (Phase 1) and framework review and development (Phase 2) are presented in the following sections, respectively.
3.1 Results of the accident analysis (Phase 1)
Sixty loss of control in flight accident reports were analysed (Appendix A2). The distribution of reported accidents by year of occurrence (Fig. 5) showed that accidents declined from 24 (37.5 %) in 2019 to 8 (12.5%) in 2021 following the introduction of UK CAA regulatory changes in June 2019.
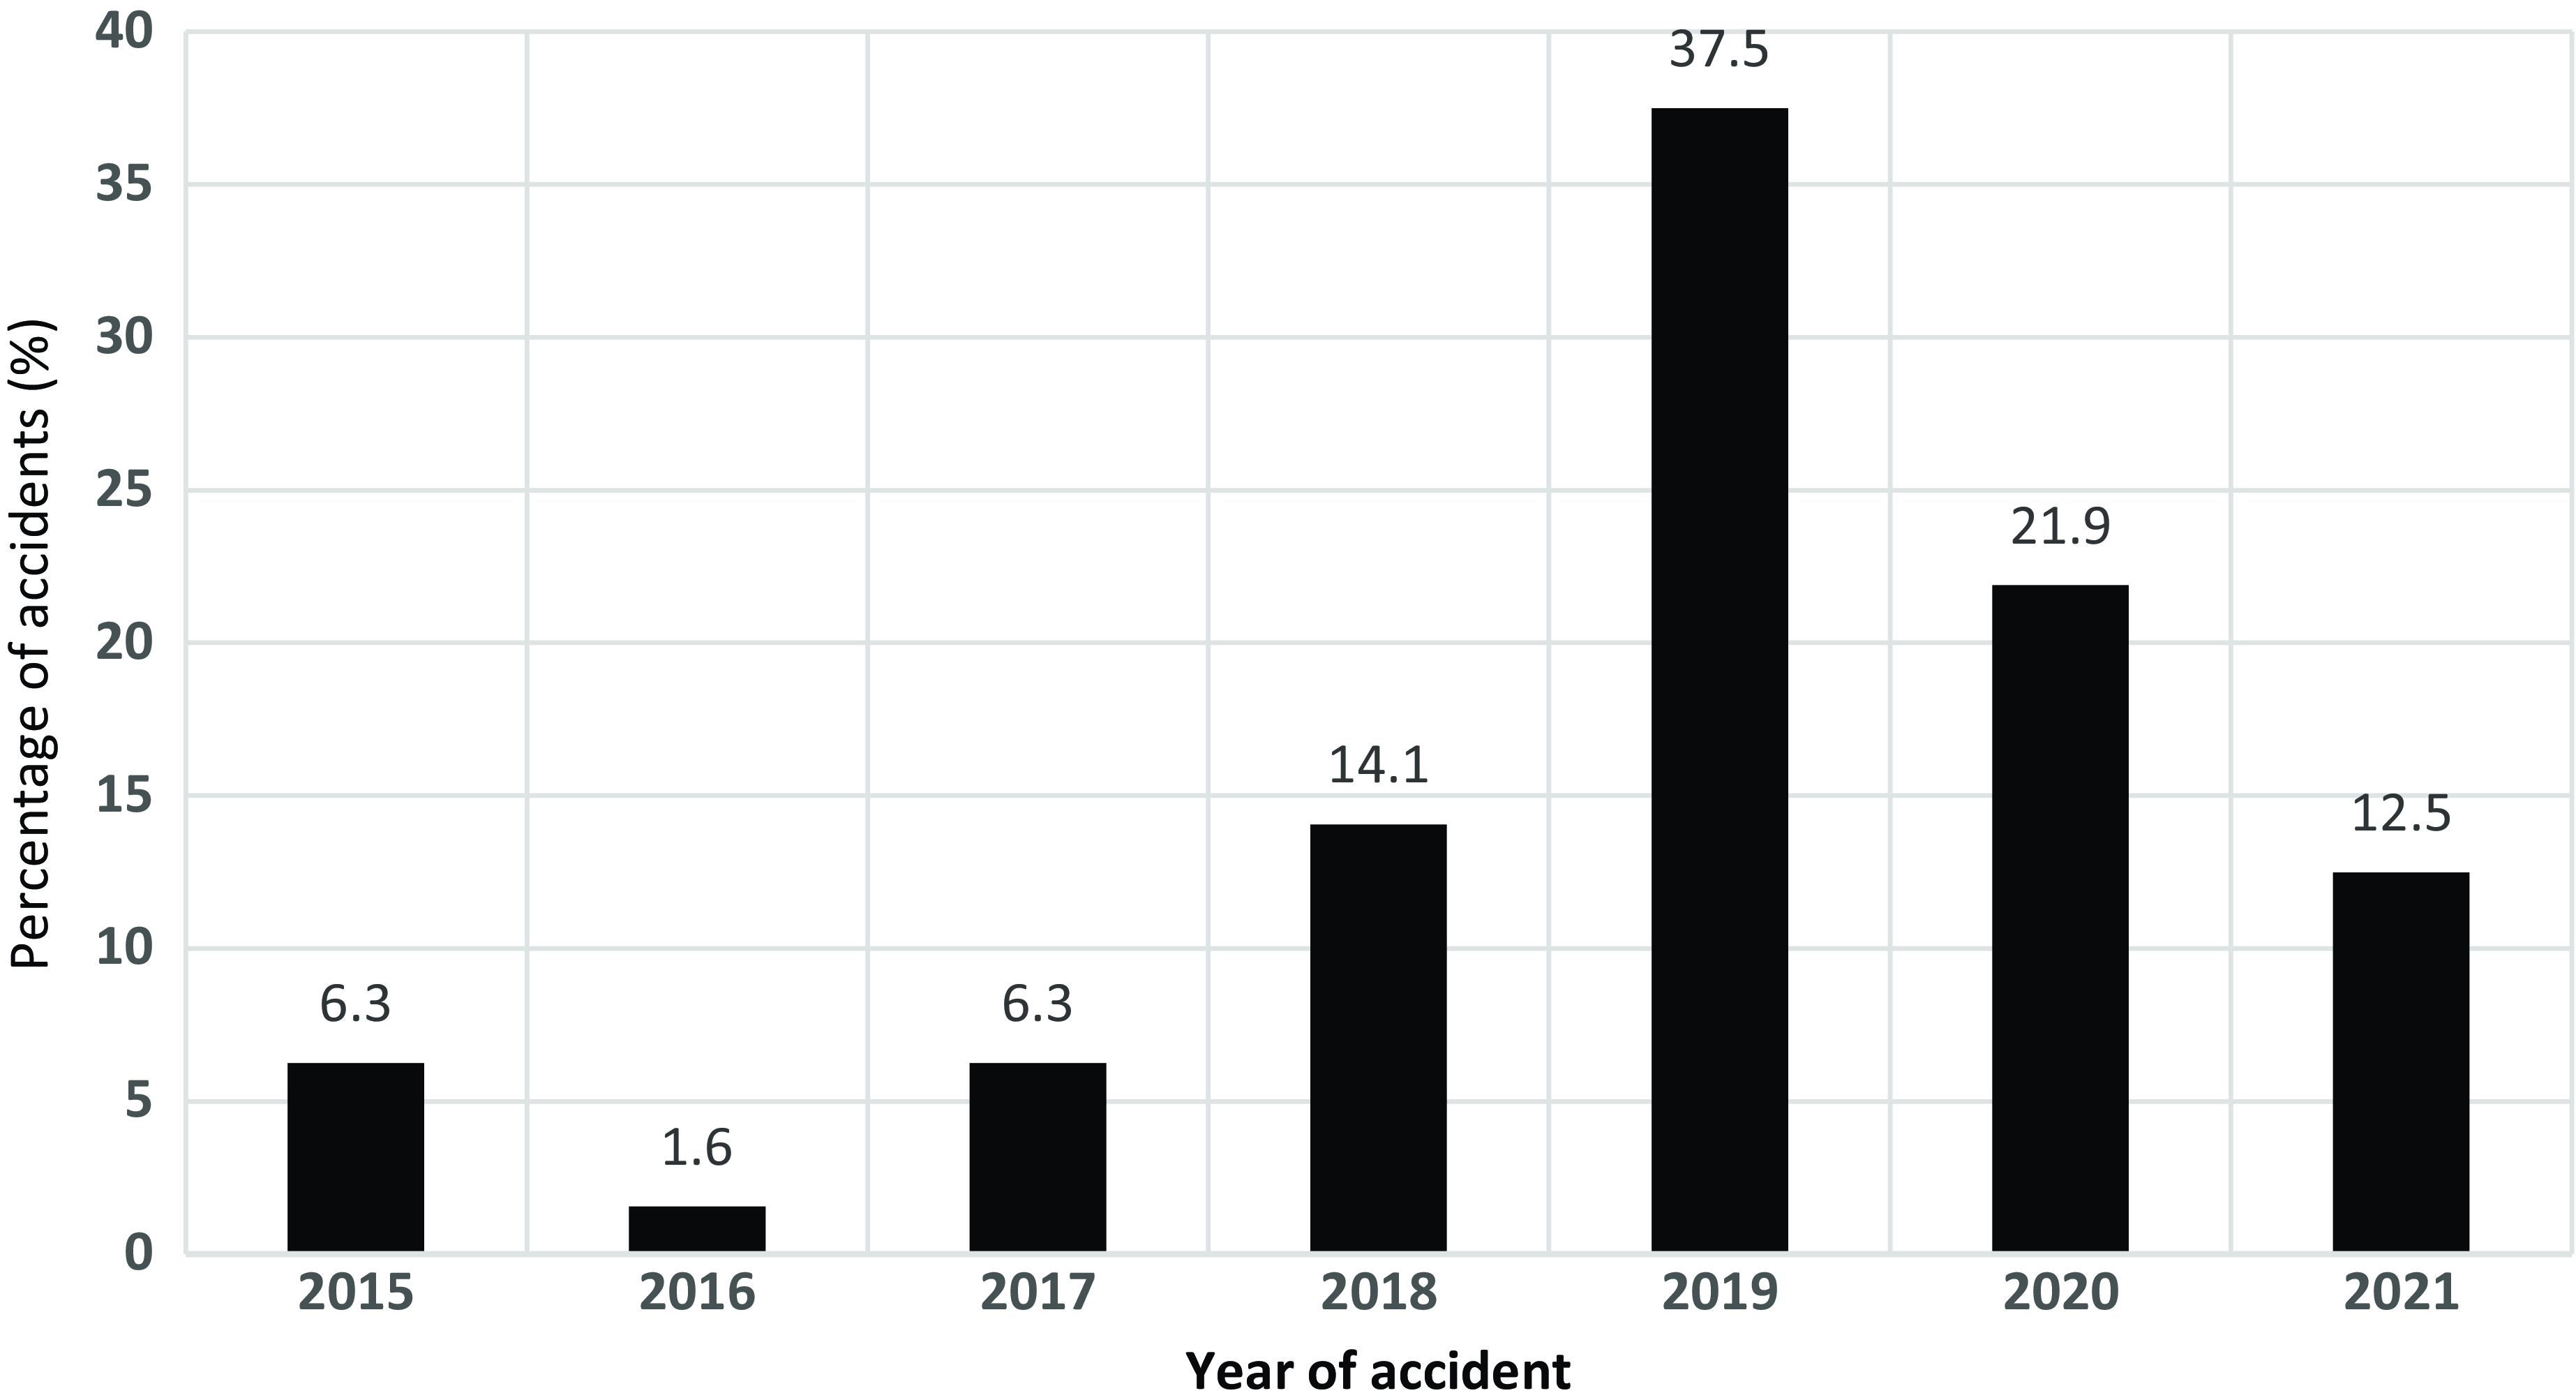
Figure 5. Reported accidents by year of occurrence.
For all accidents, the number of percentage of accidents with respect to drone mass (Fig. 6) and occurrence before or after June 2019 (Fig. 7) when UK CAA regulations were changed.
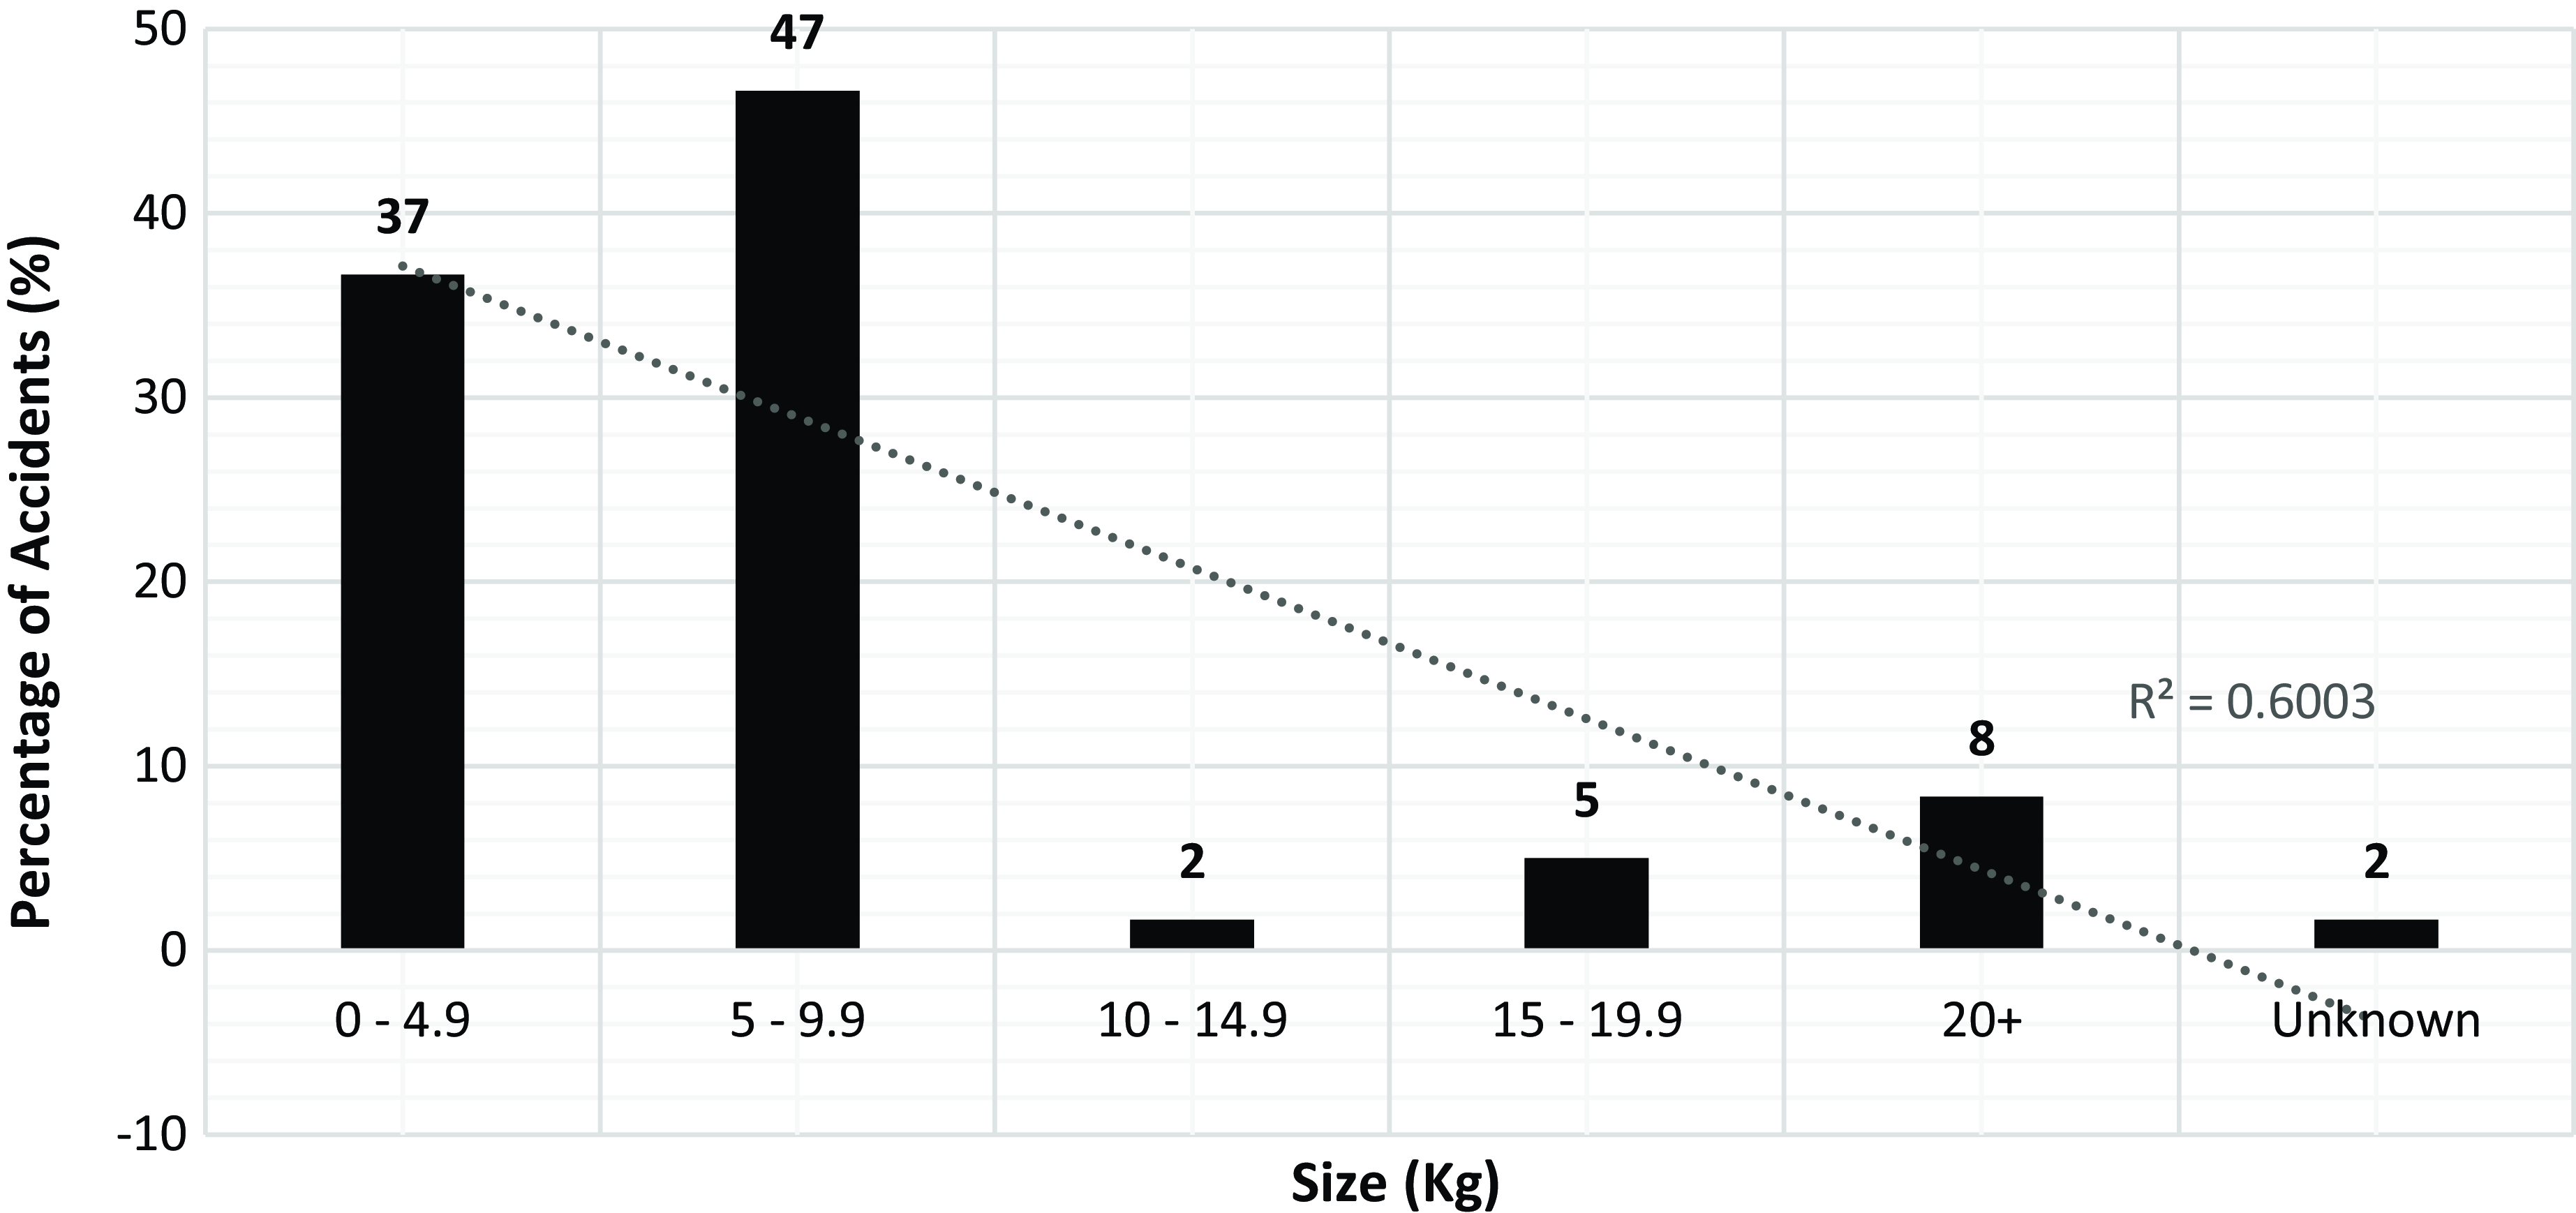
Figure 6. Percentage of accidents by UAV mass (kg).
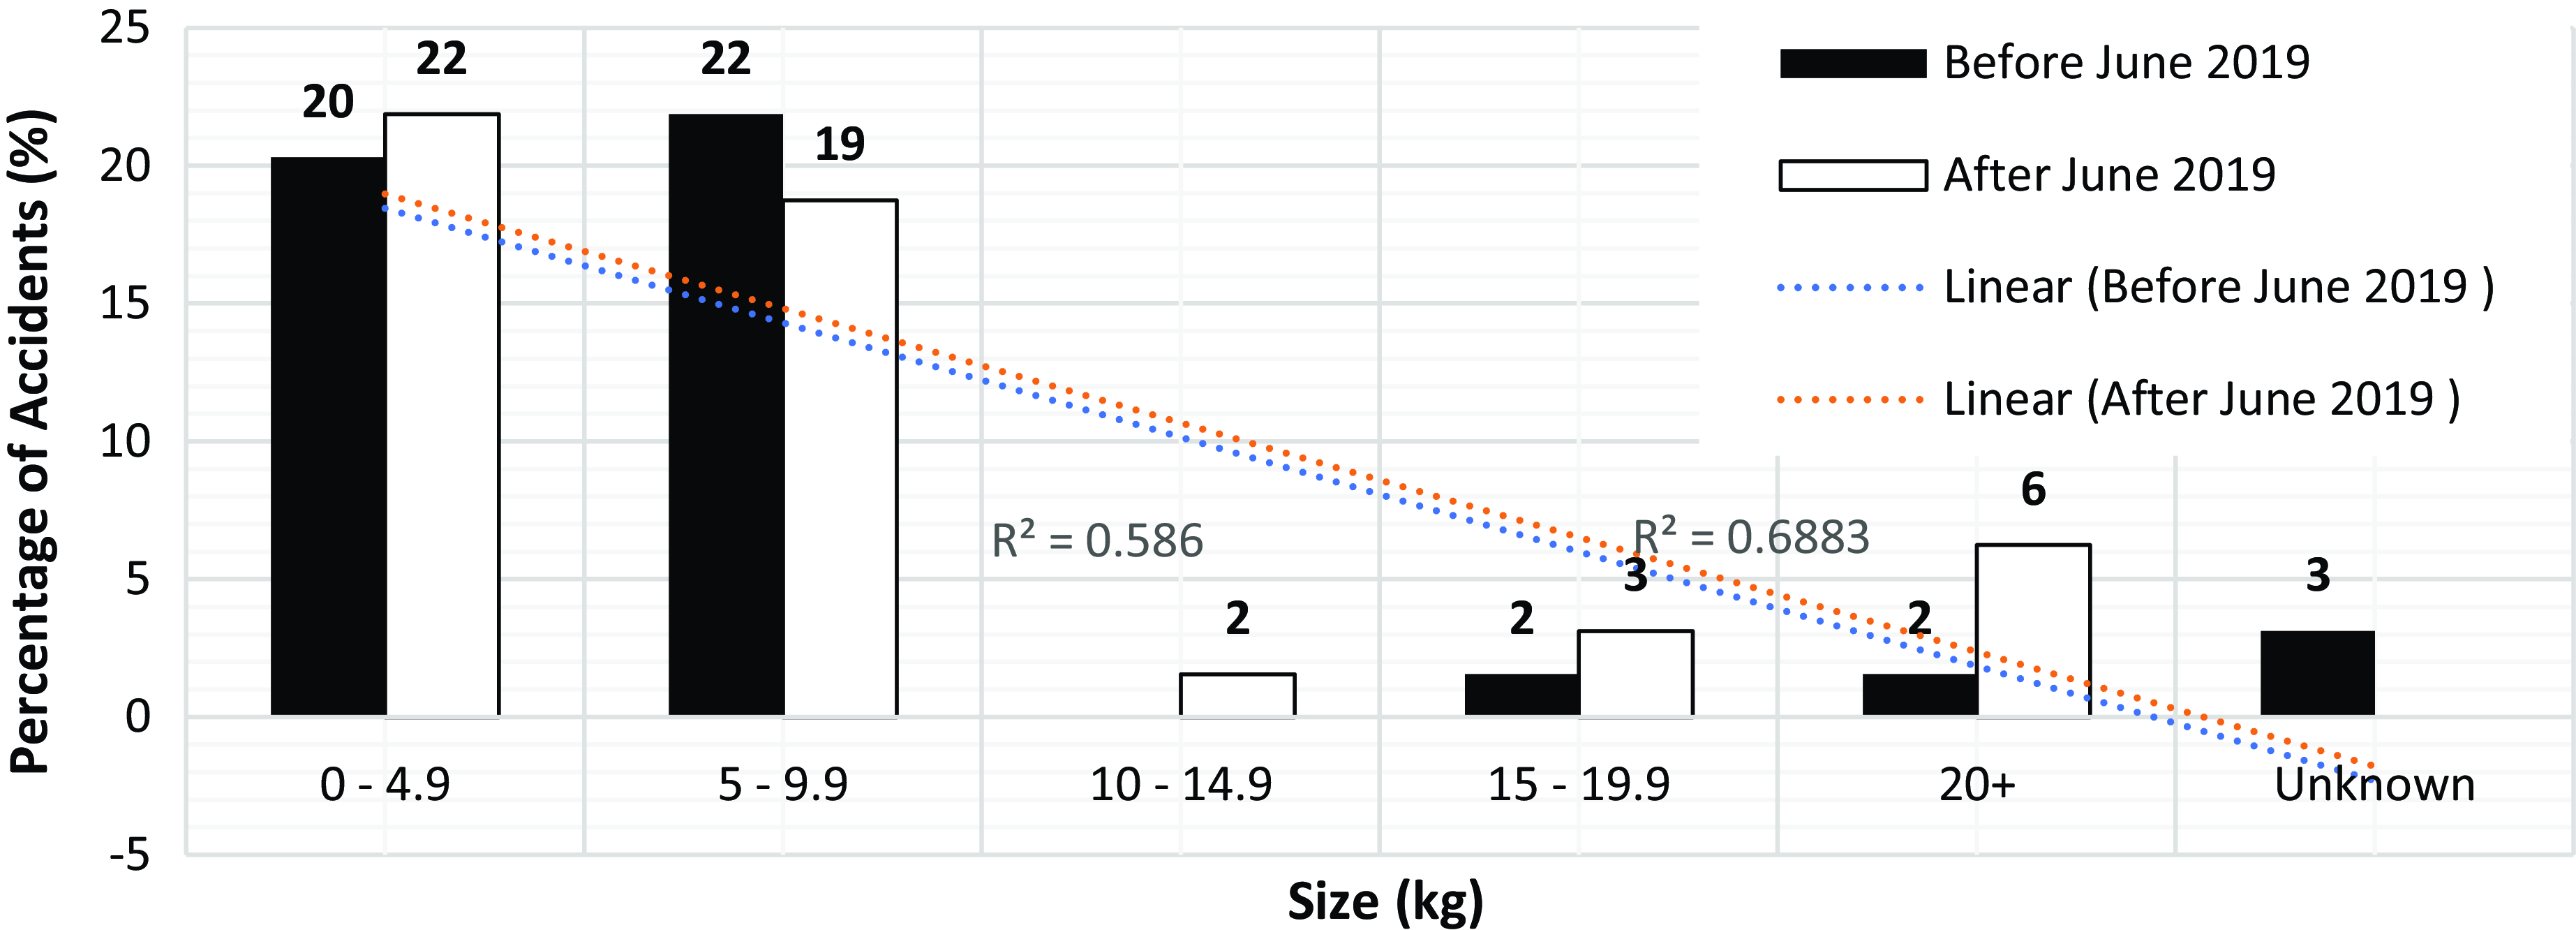
Figure 7. Percentage of accidents with respect to UAV mass (kg) before and after June 2019.
A review of accidents by UAV mass showed that the largest percentage of accidents occurred for drones between 5 and 9.9 kg (44%) and the lowest number of accidents occurred for the 10–14.9 kg drones.(2%) (Fig. 6). Accidents generally decreased as mass increased (R 2 = 0.6003).
The largest number of accidents occurring before regulatory changes in June 2019 (22%) was for drones between 5 and 9.9 kg and largest number of accidents occurring after 2019, is of 22% for the 0–4.9 kg category (Fig. 7). Accidents generally decreased as mass increased both before and after regulatory changes (R 2 = 0.586 and 0.688, respectively).
For accidents by utilisation (Fig. 8) the largest percentage of accidents (37%) occurred for commercial flights with demonstration flights have the lowest percentage (2%).
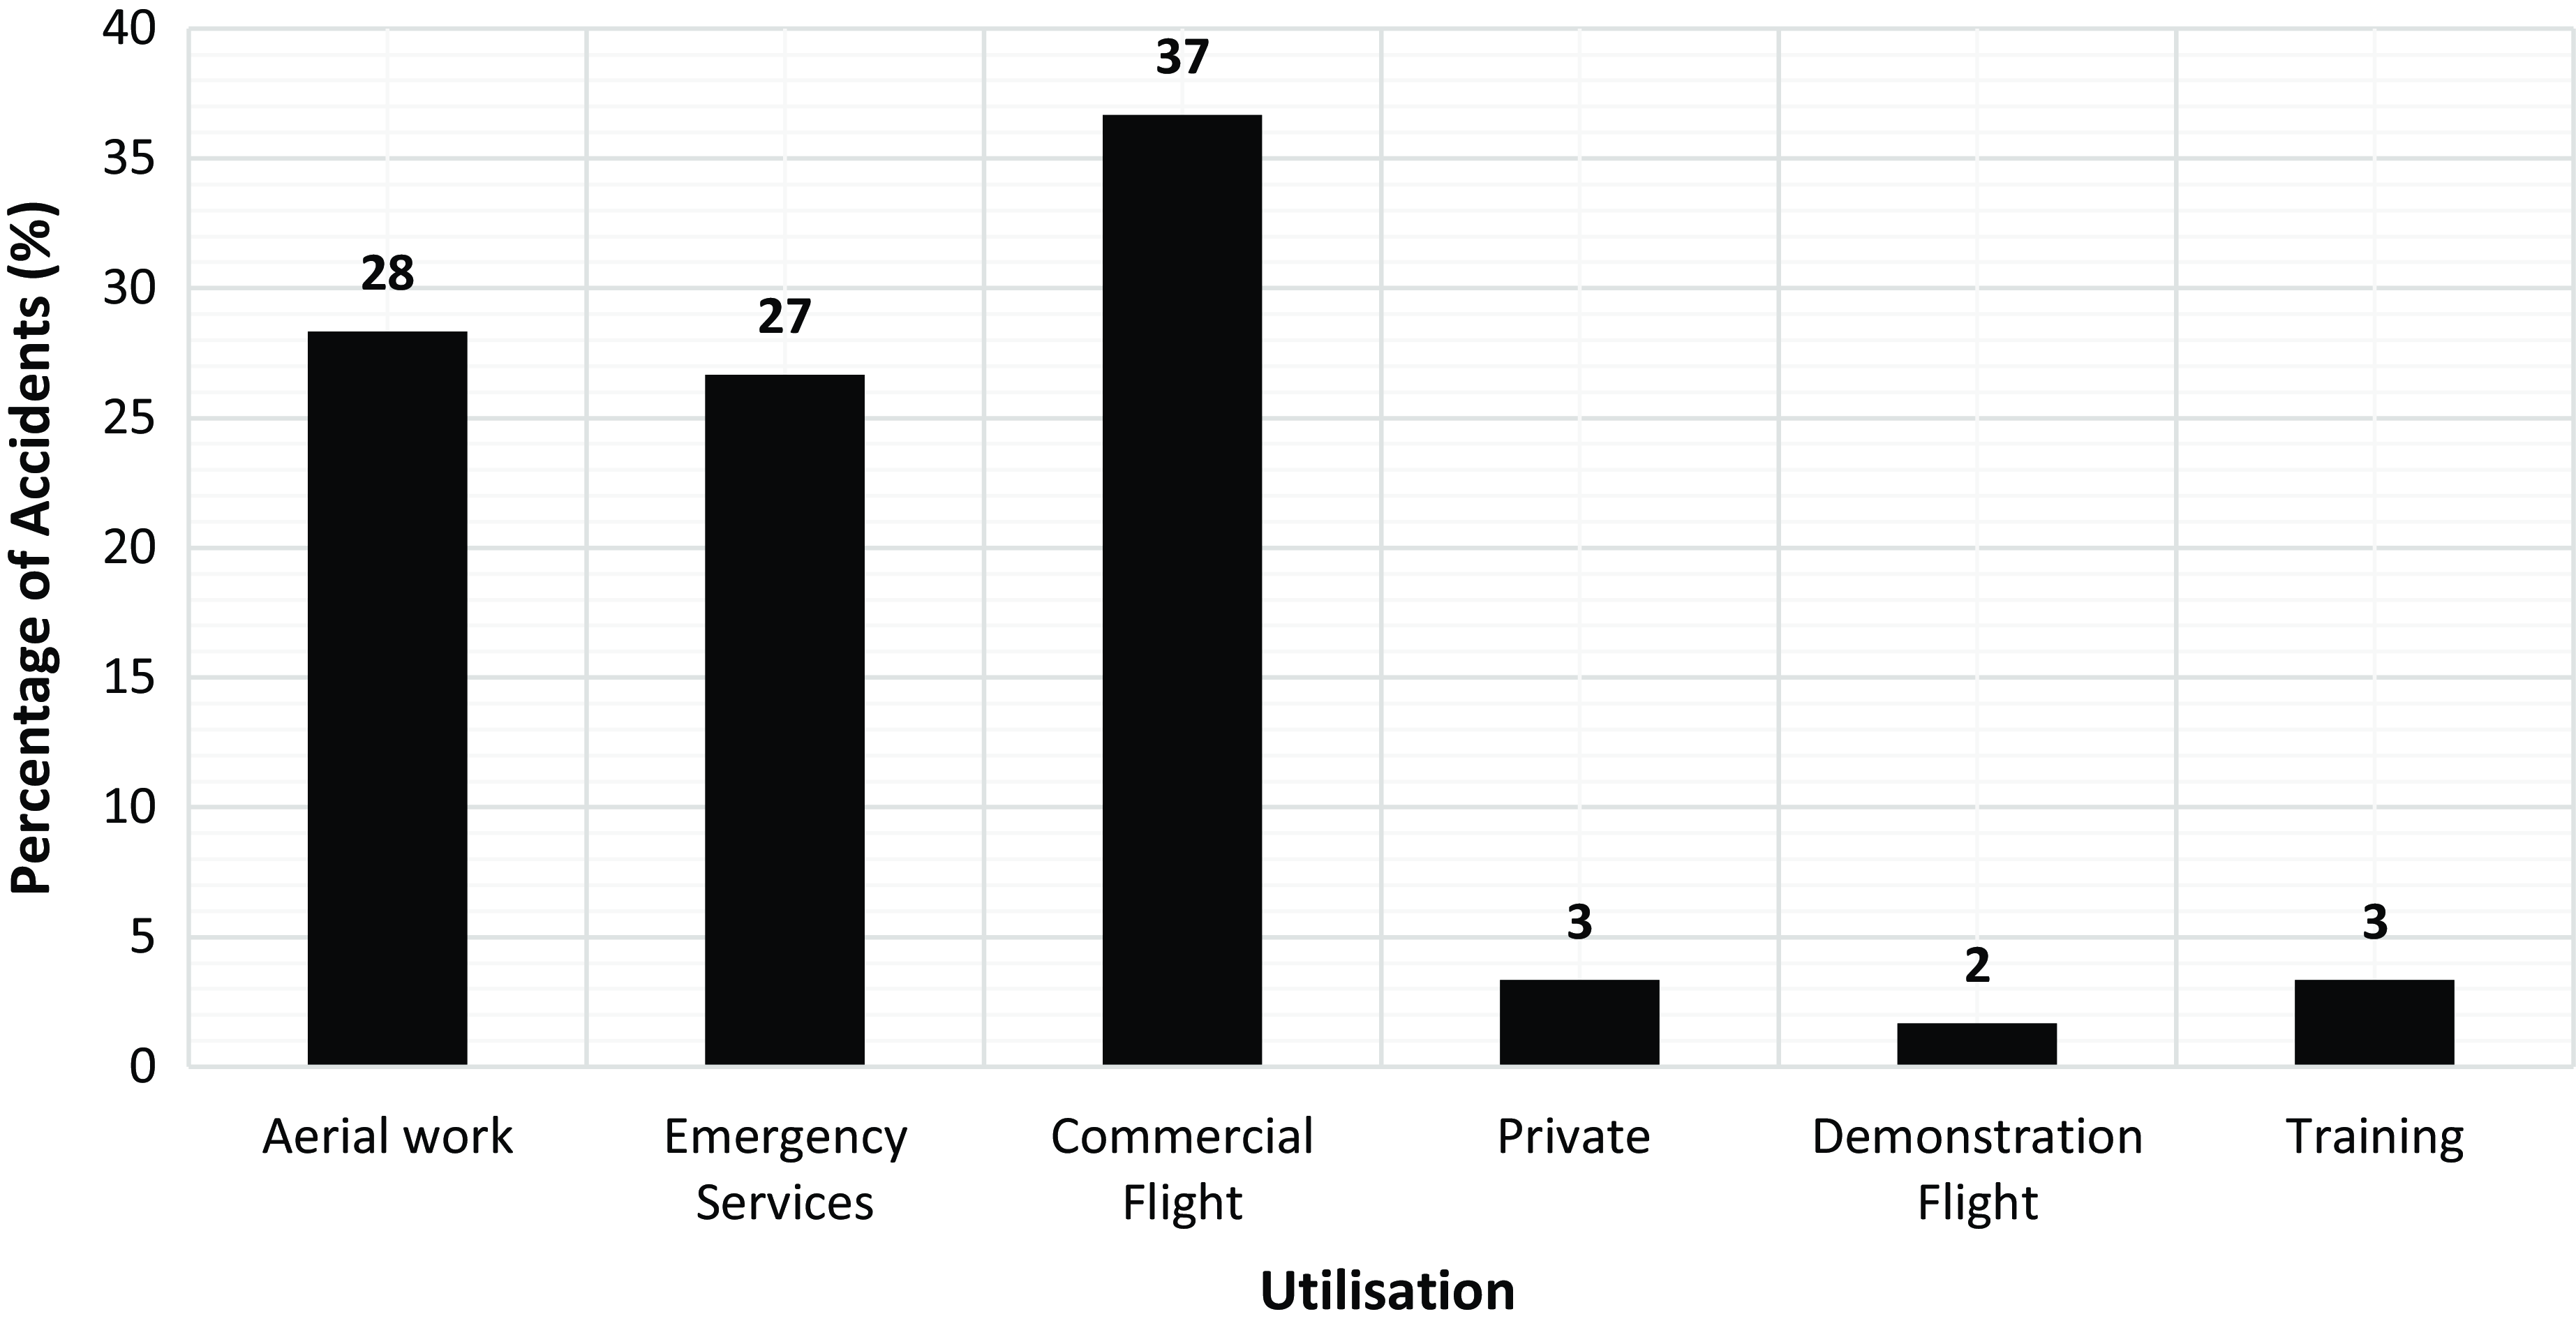
Figure 8. Percentage of accidents by utilisation.
Analysis of pilot demographics showed that the median for total experience was 38 hours and experience on type 10.5 hours. When considering operator’s age (Fig. 9) the largest number of accidents was observed for the 30–39 age group (38%) and the lowest number of accidents for operators in the 60+ age group (5%). Analysis of pilot demographics showed that the mean age of pilots involved in the reported accidents was 40 years (SD = 9.9).
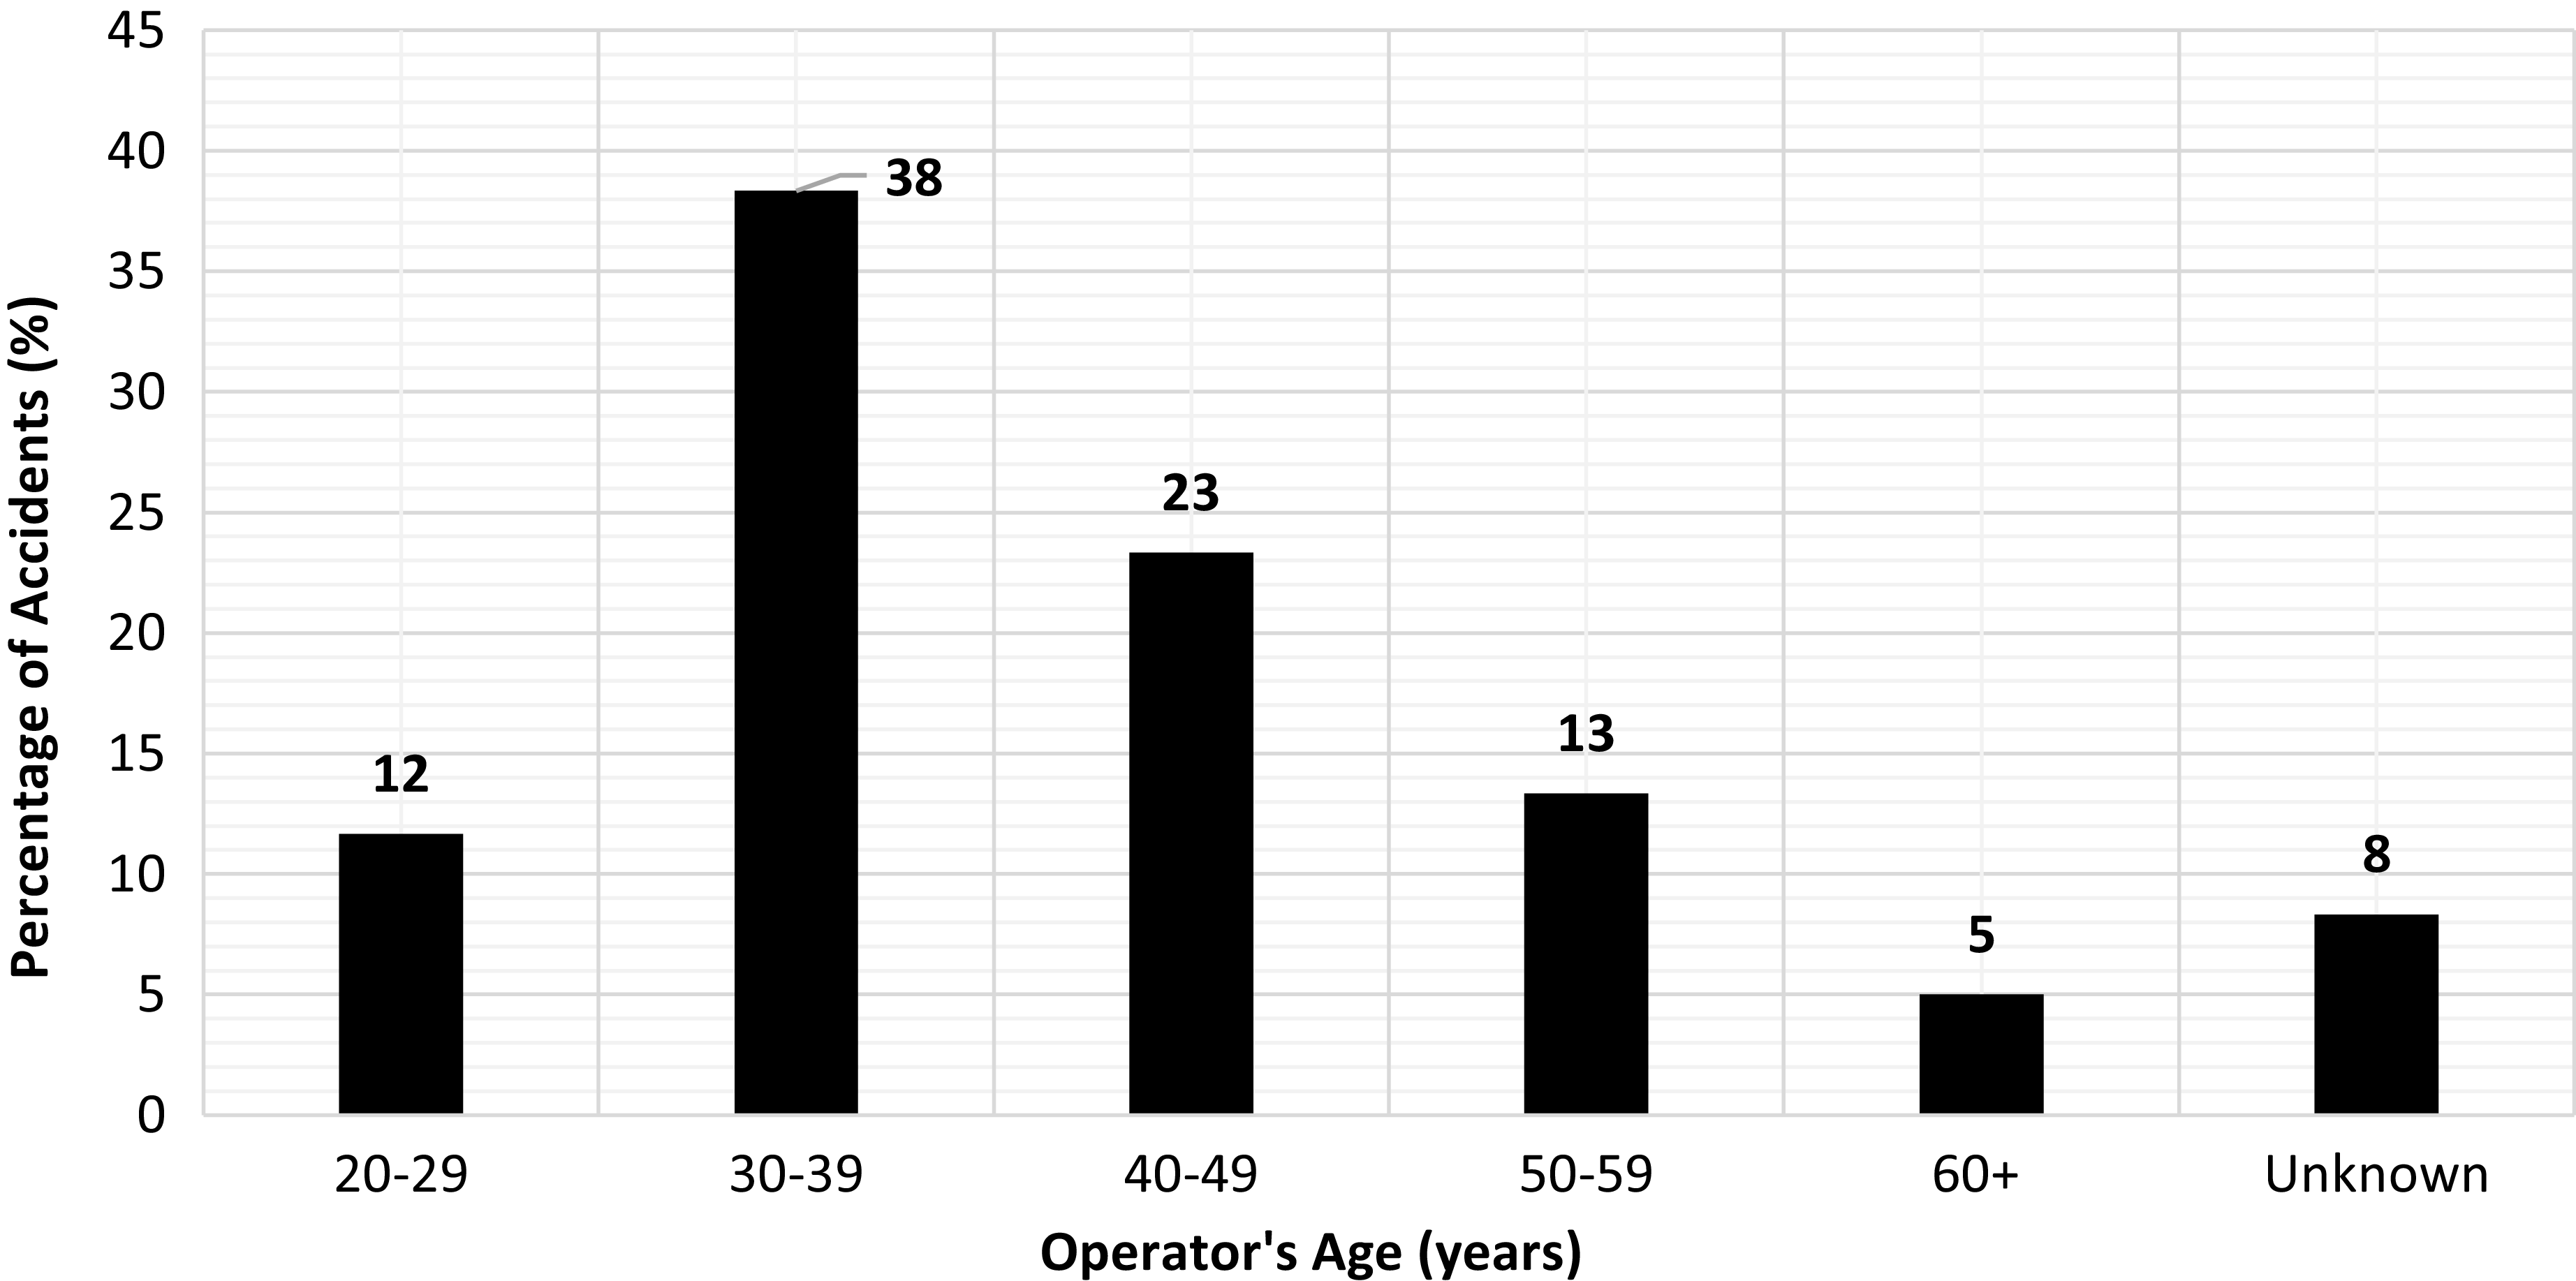
Figure 9. Percentage of accidents by operator’s age.
With respect to commander’s total experience and experience on type (Fig. 10) the largest number of accidents occurred to operators with the lowest experience on type of 0–19 hours (62%) and the highest number of accidents for total flying experience occurred for 20–99 hours (35%). The lowest number of accidents for experience on type and total experience were for 1,000+ hours (3%) and 700–999 hours (2%), respectively. The number of accidents decreased as pilot’s experience on type and total flying experience increased (R 2 = 0.5123 and 0.6708, respectively). The variation of pilot’s total flying experience with age (Fig. 11) showed no direct correlation (R 2 = 0.0091). There was a similar lack of correlation (R 2 = 0.0134) between pilot’s experience on type with age (Fig. 12).
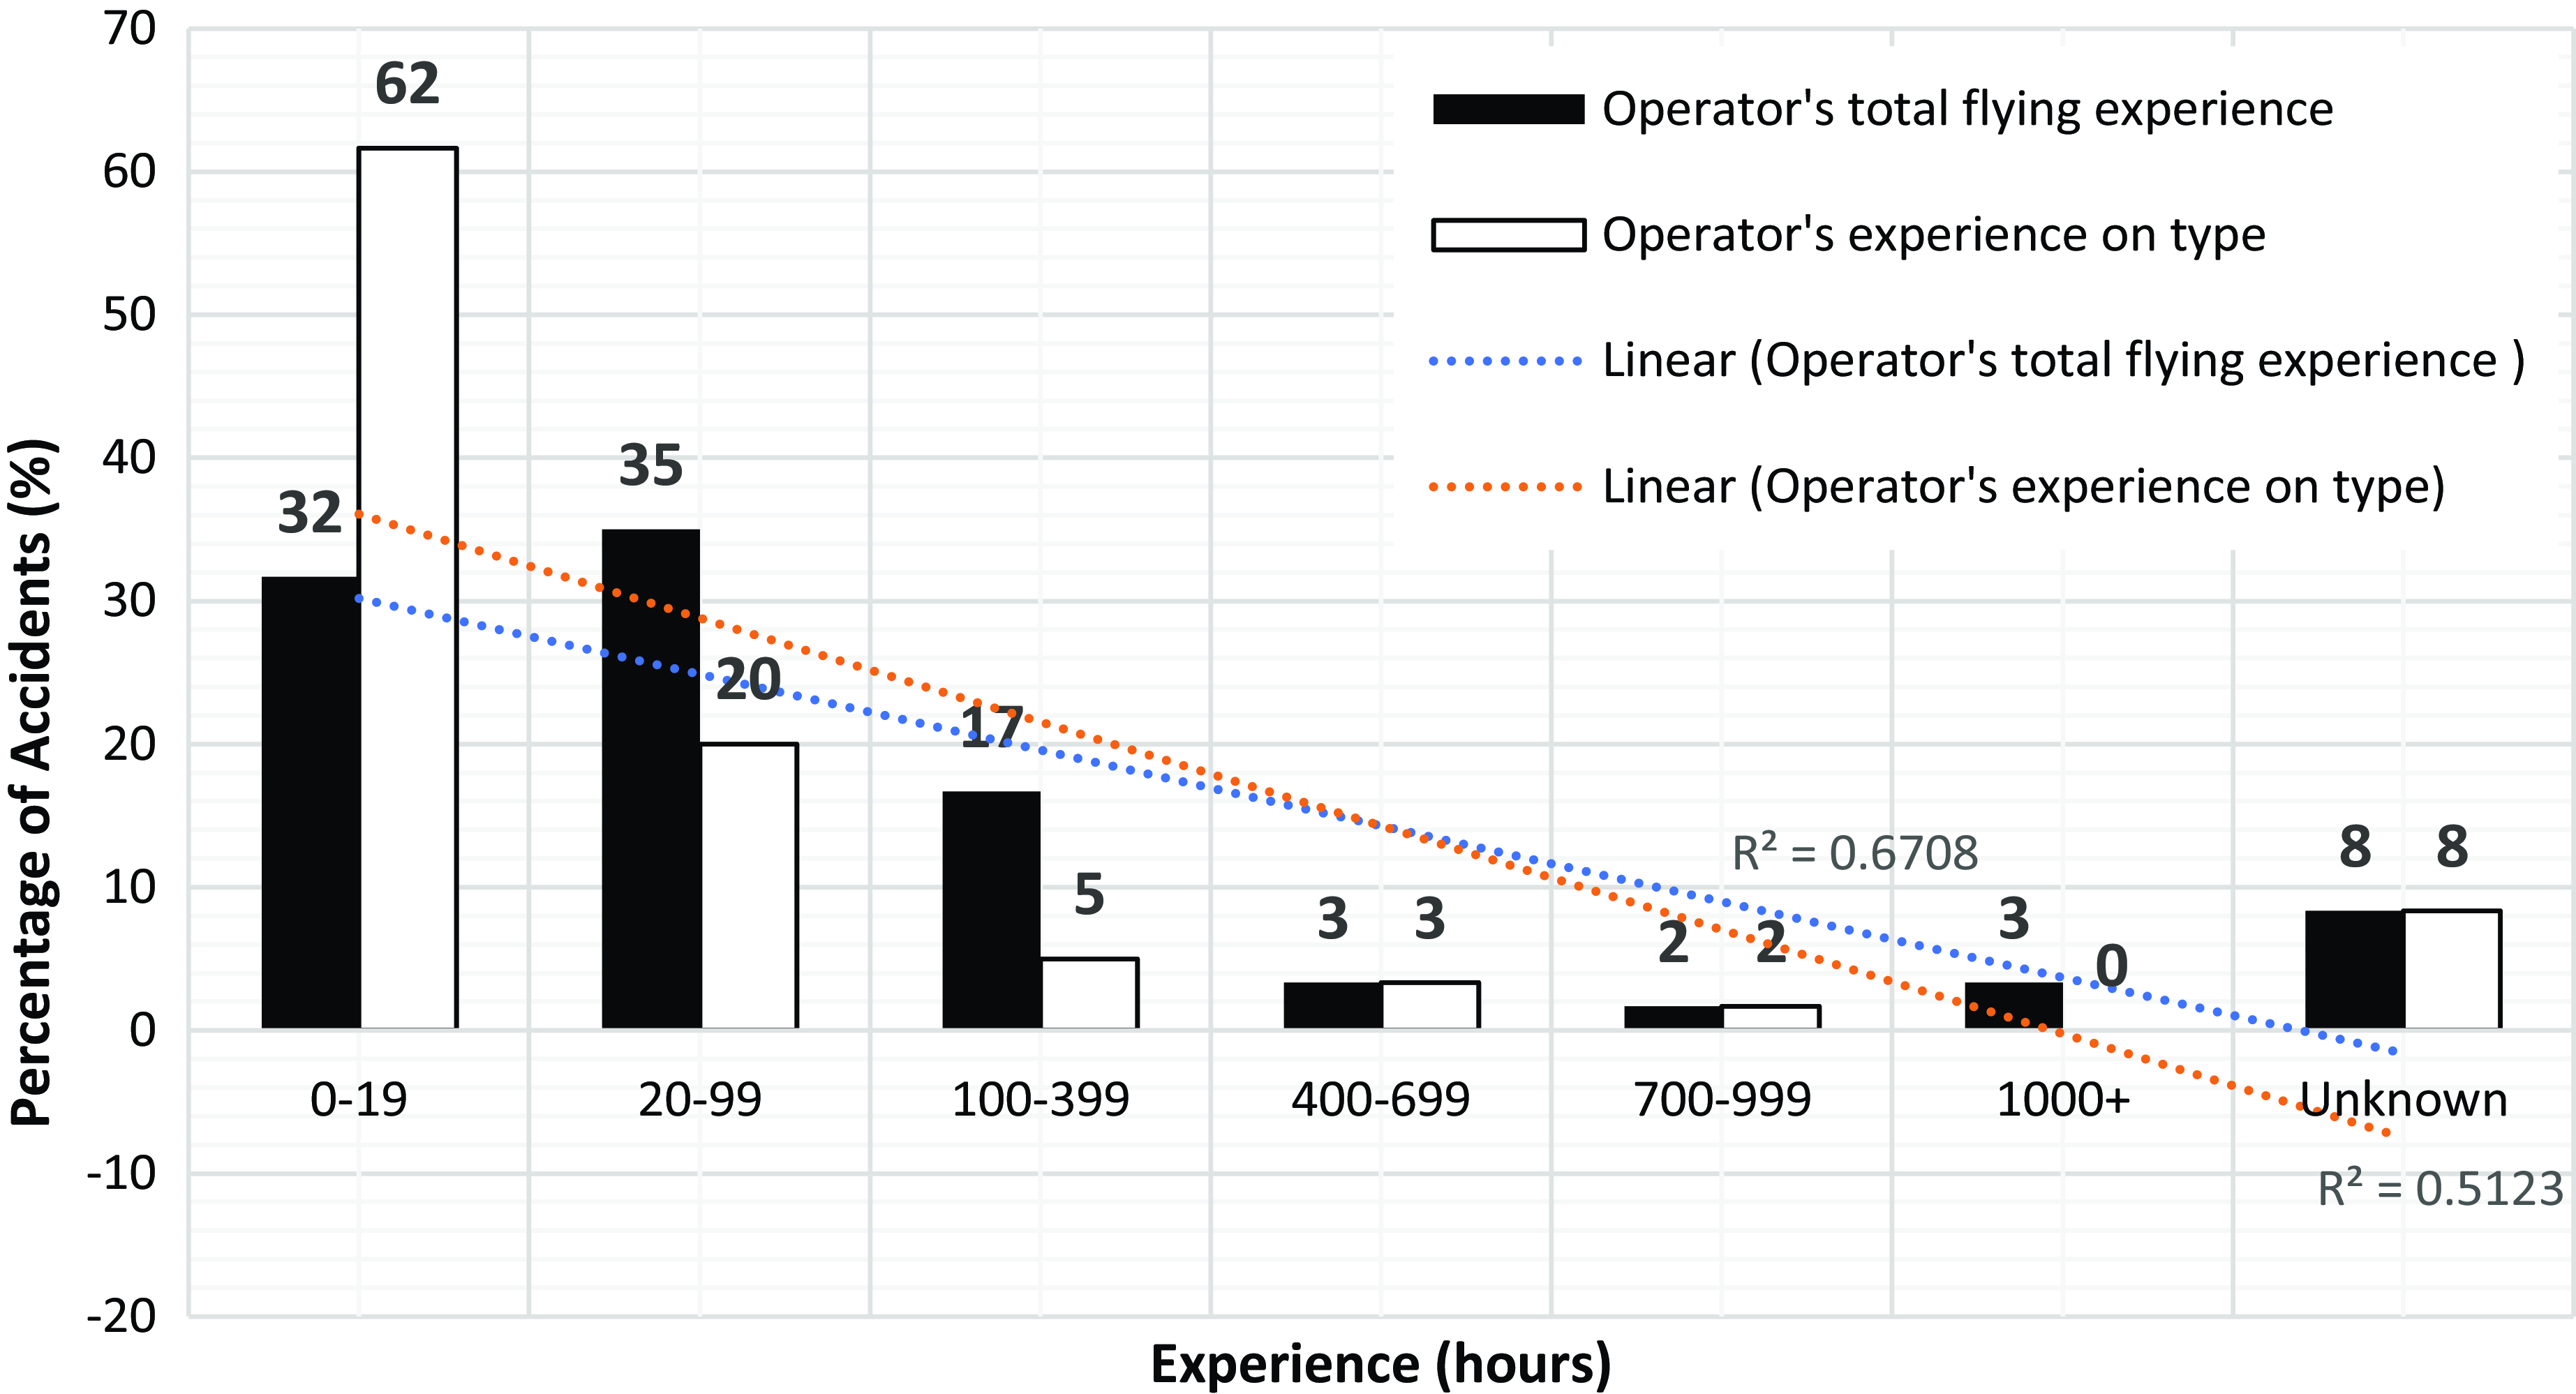
Figure 10. Percentage of accidents by total flying experience and experience on type.
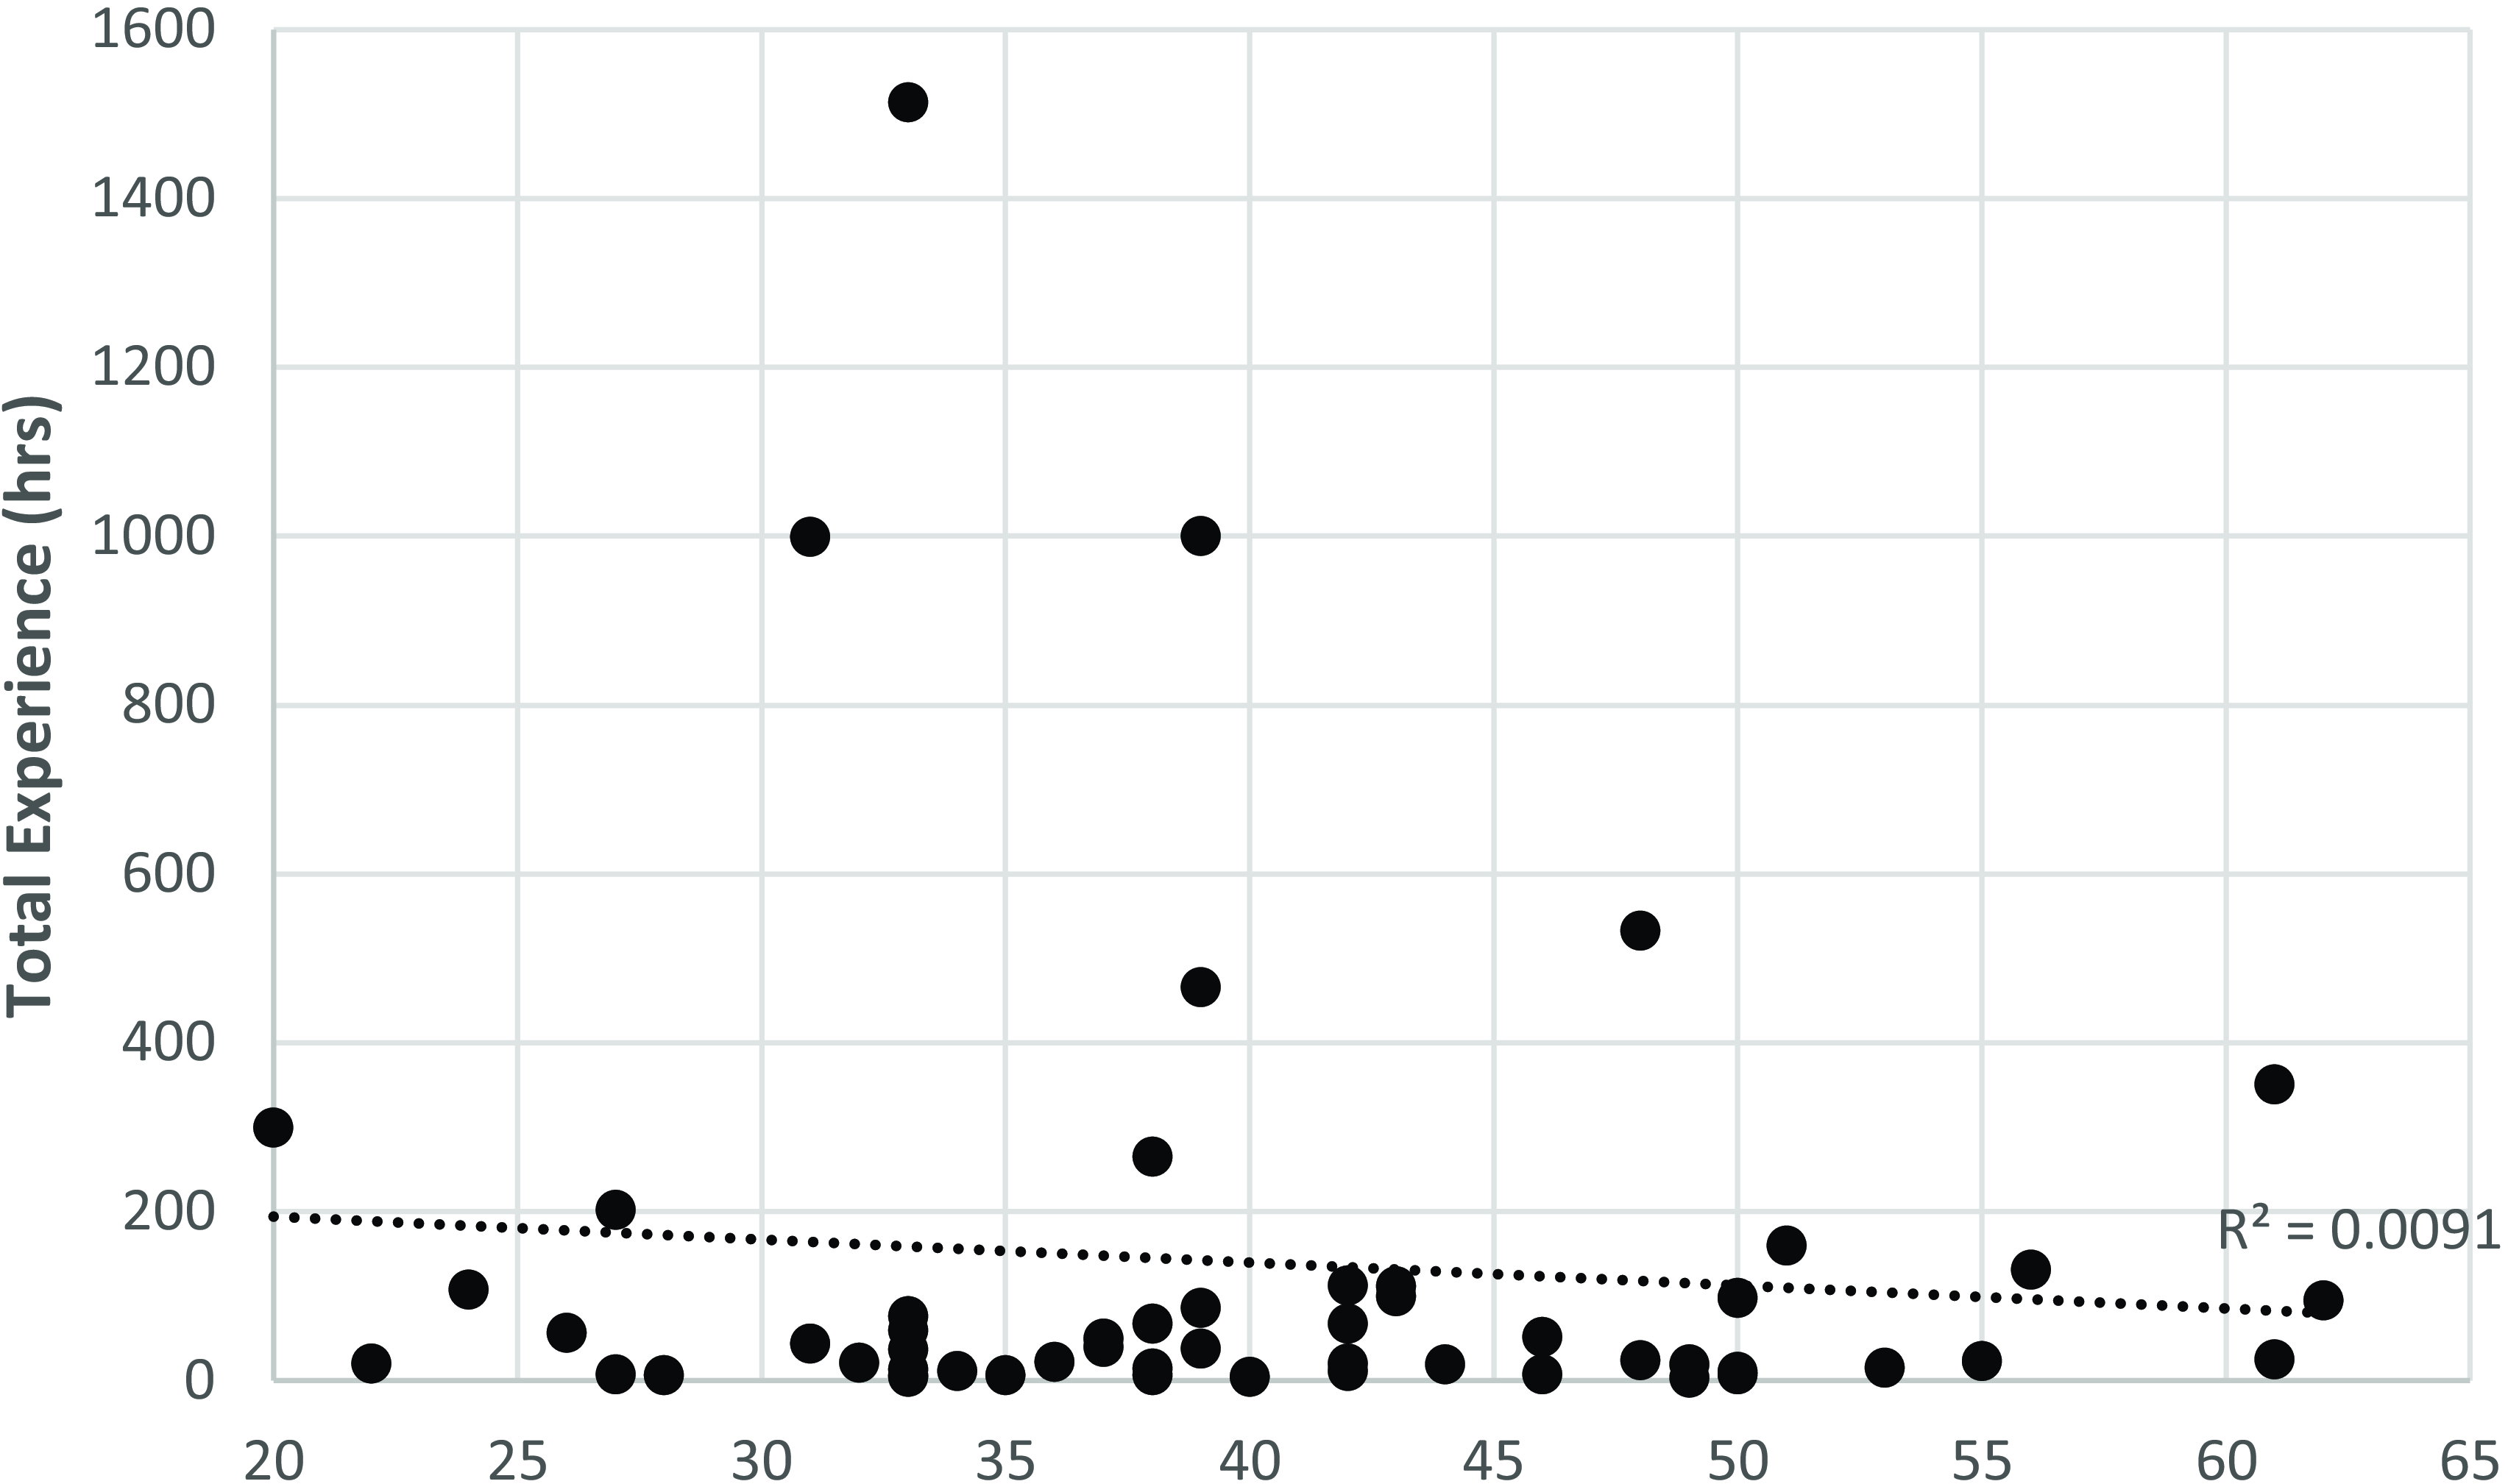
Figure 11. Total operator flying experience versus age (all LOC-I accidents).
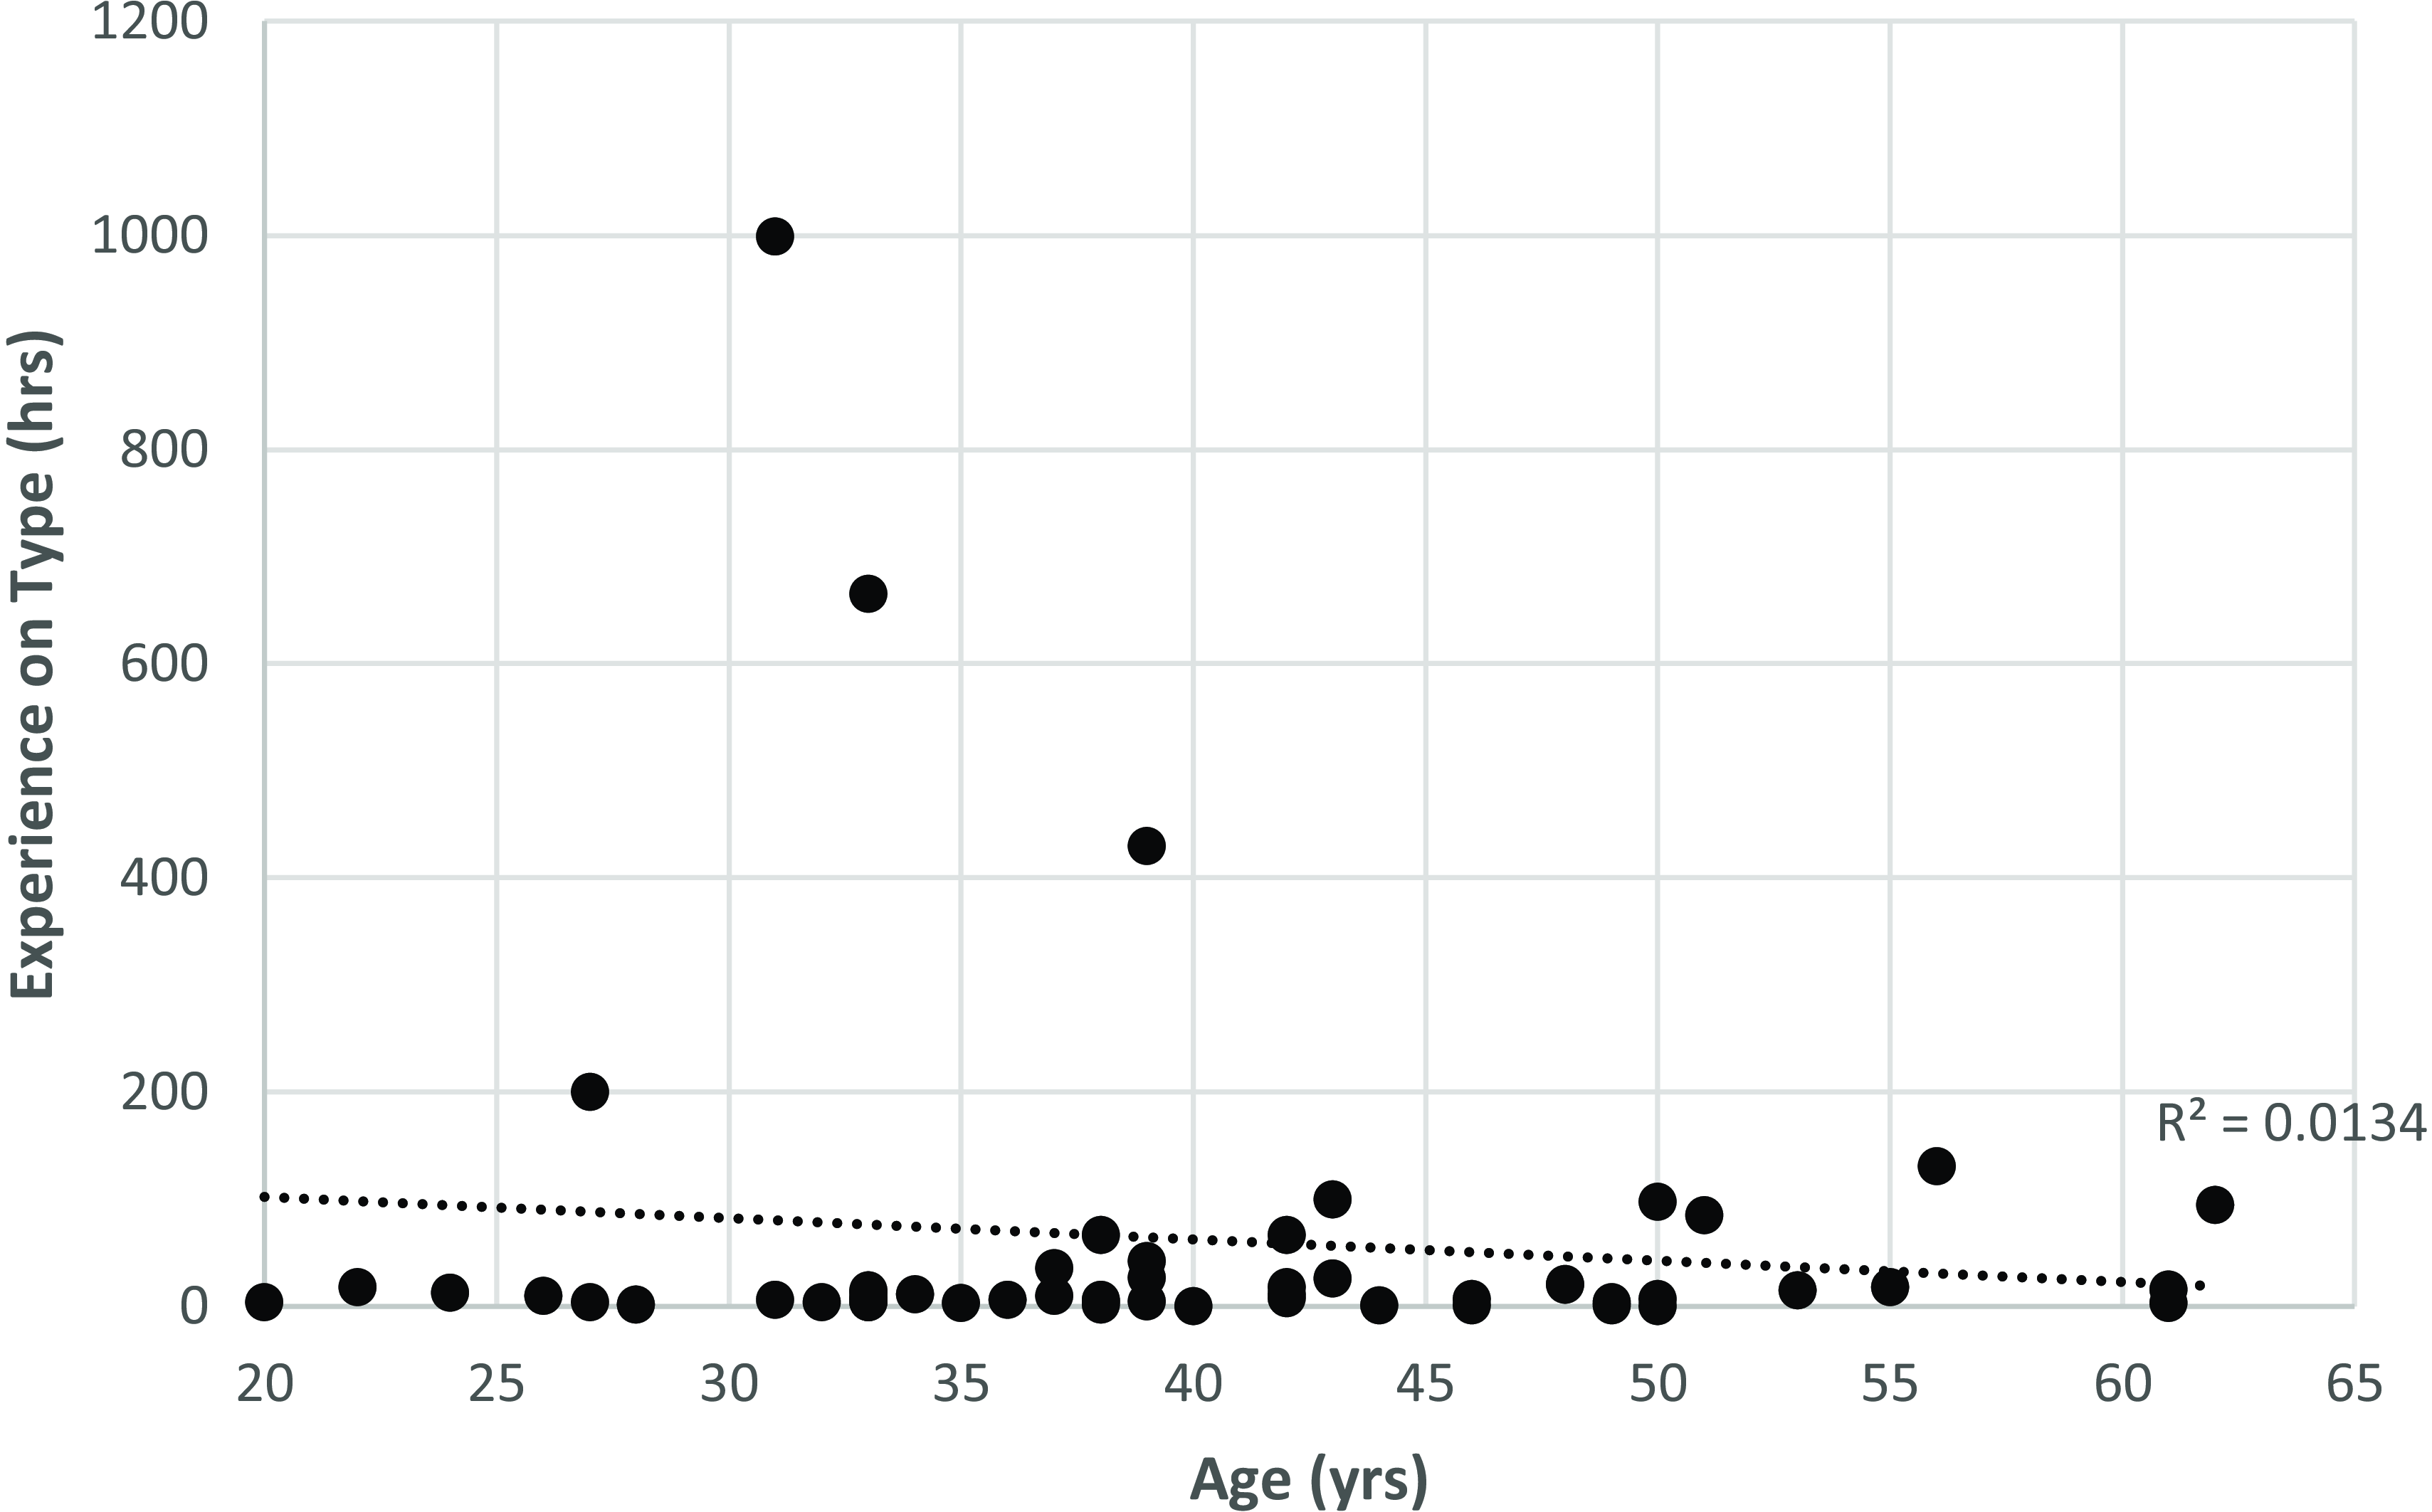
Figure 12. Operator experience on type versus age (all LOC-I accidents).
In relation to accidents varying with operator’s age group (Fig. 13), the highest number of accidents occurred in the age groups 30–39 and 40–49 and with the lowest operator experience groups of 0–19 and 20–99 hours. There was also a greater distribution of age groups between 0 and 99 hours of experience when compared to higher experience groups.
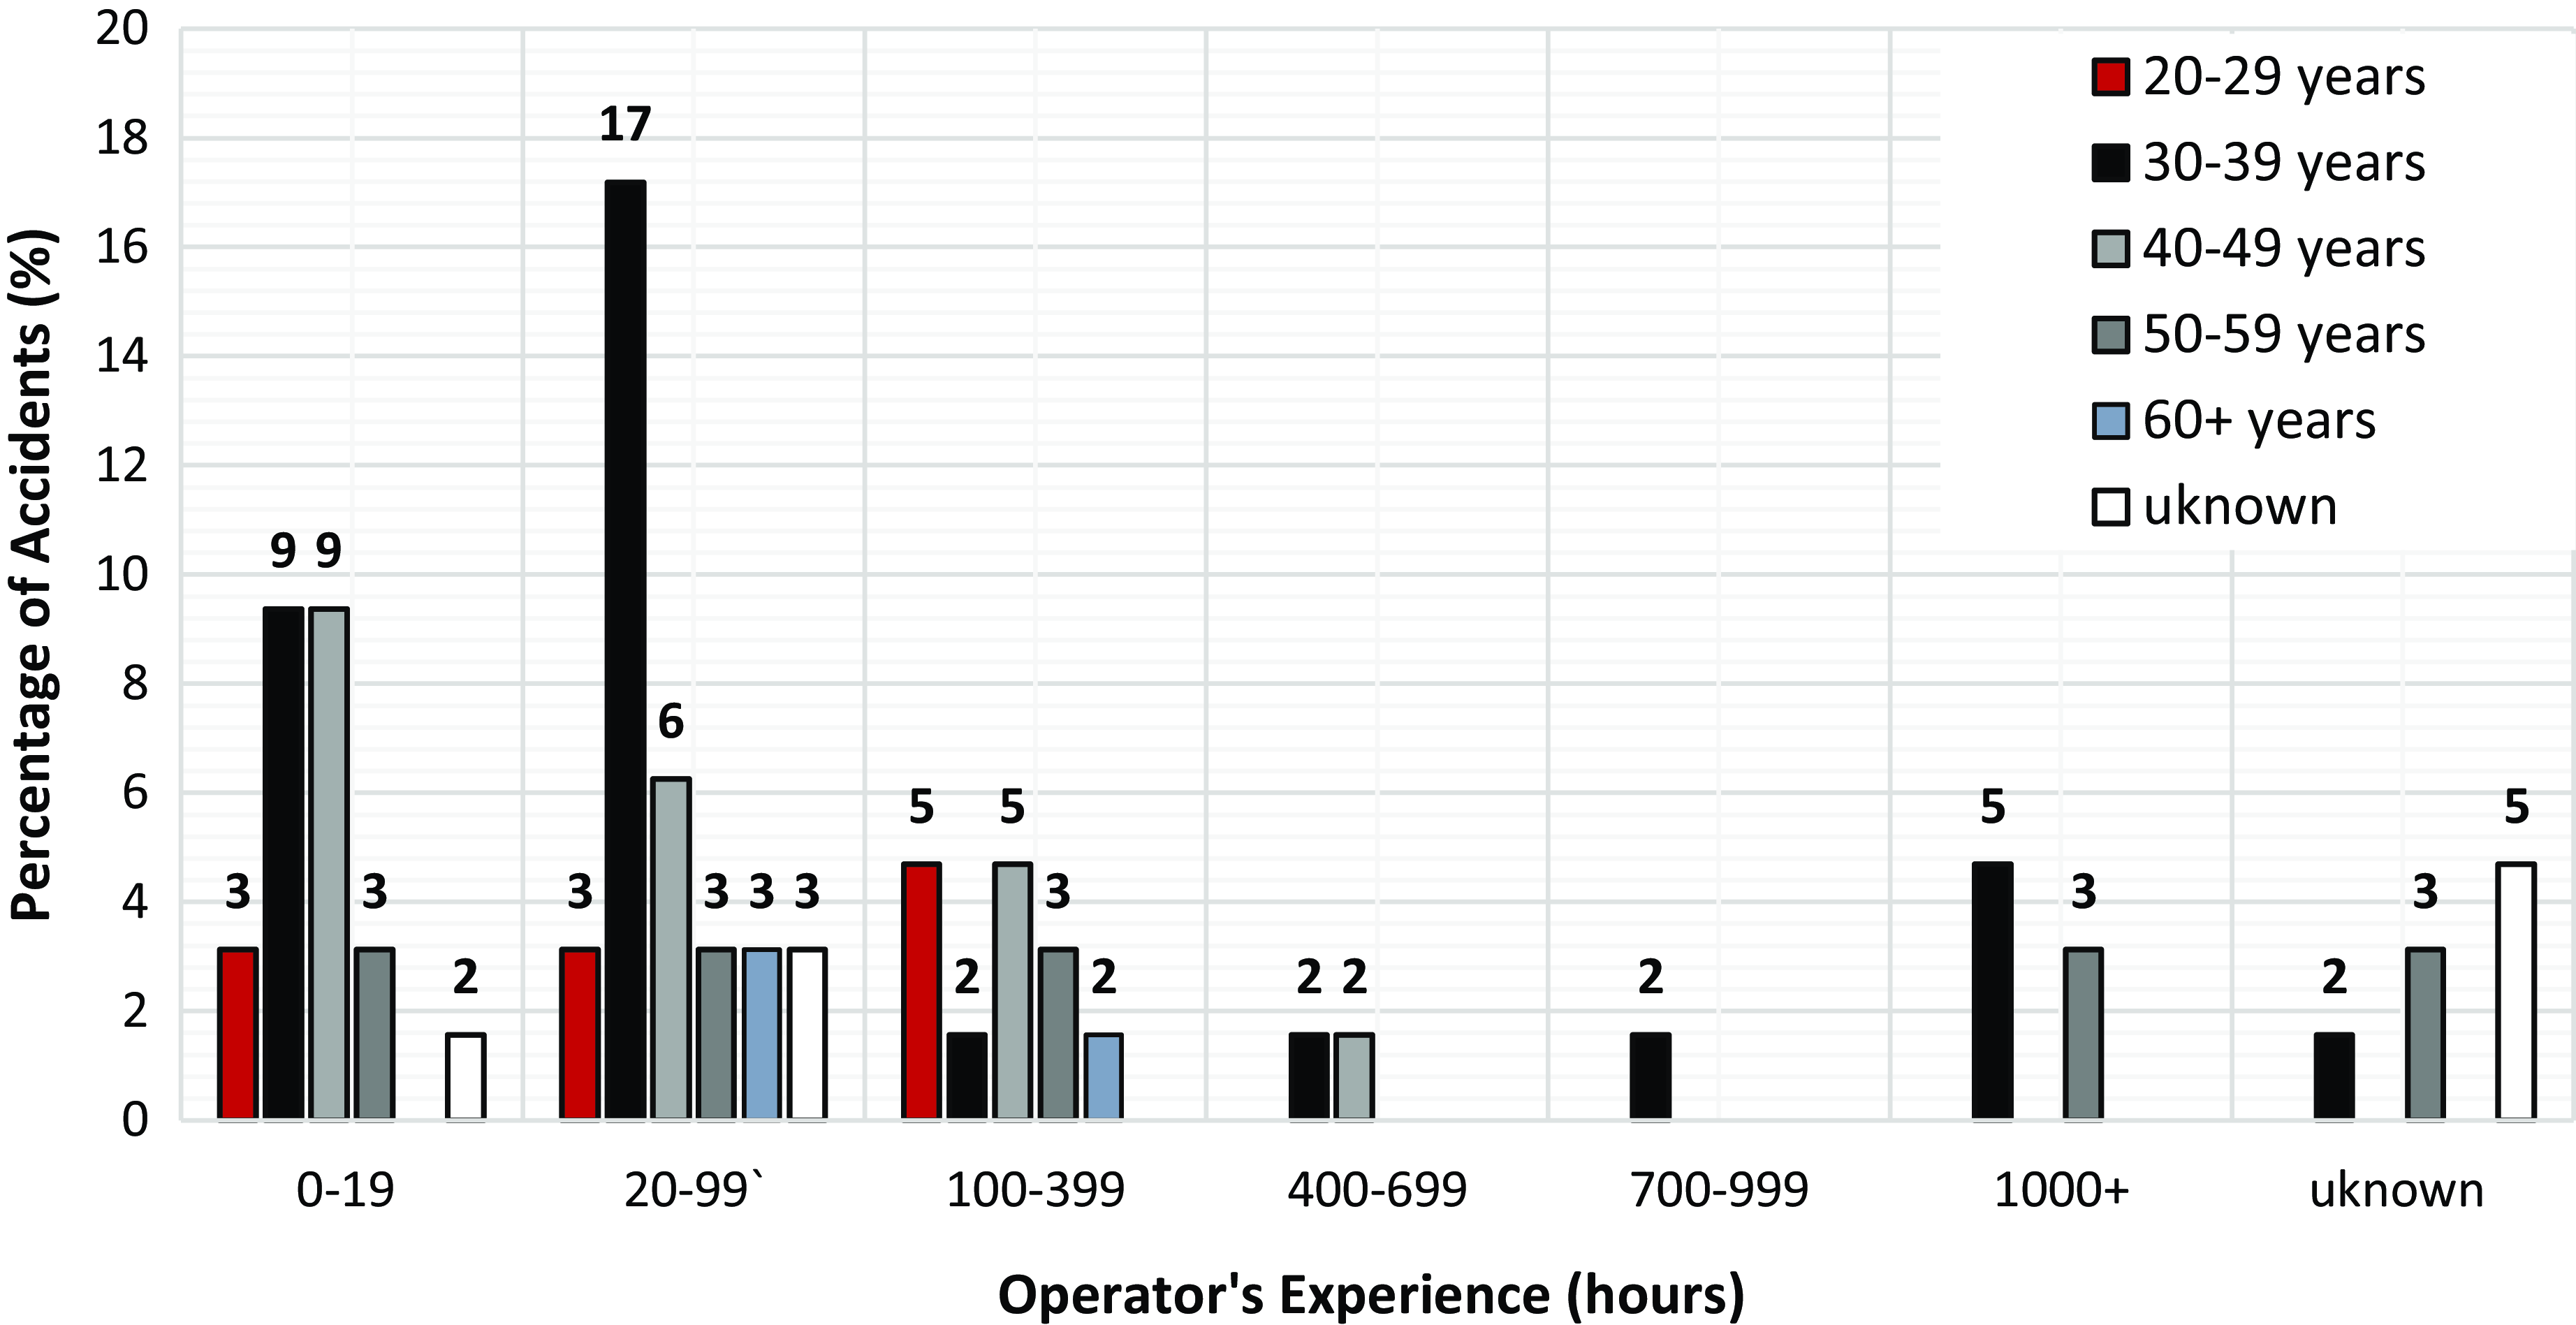
Figure 13. Percentage of accidents according to operator’s age with respect to operator’s total experience.
For recovery response to LOC-I (Fig. 14) the failed recovery mechanisms attempted to regain control. For 55% of accidents recovery was not attempted being the largest recovery response, and the lowest number of accidents occurred for change of controller/position with only 3% of accidents.
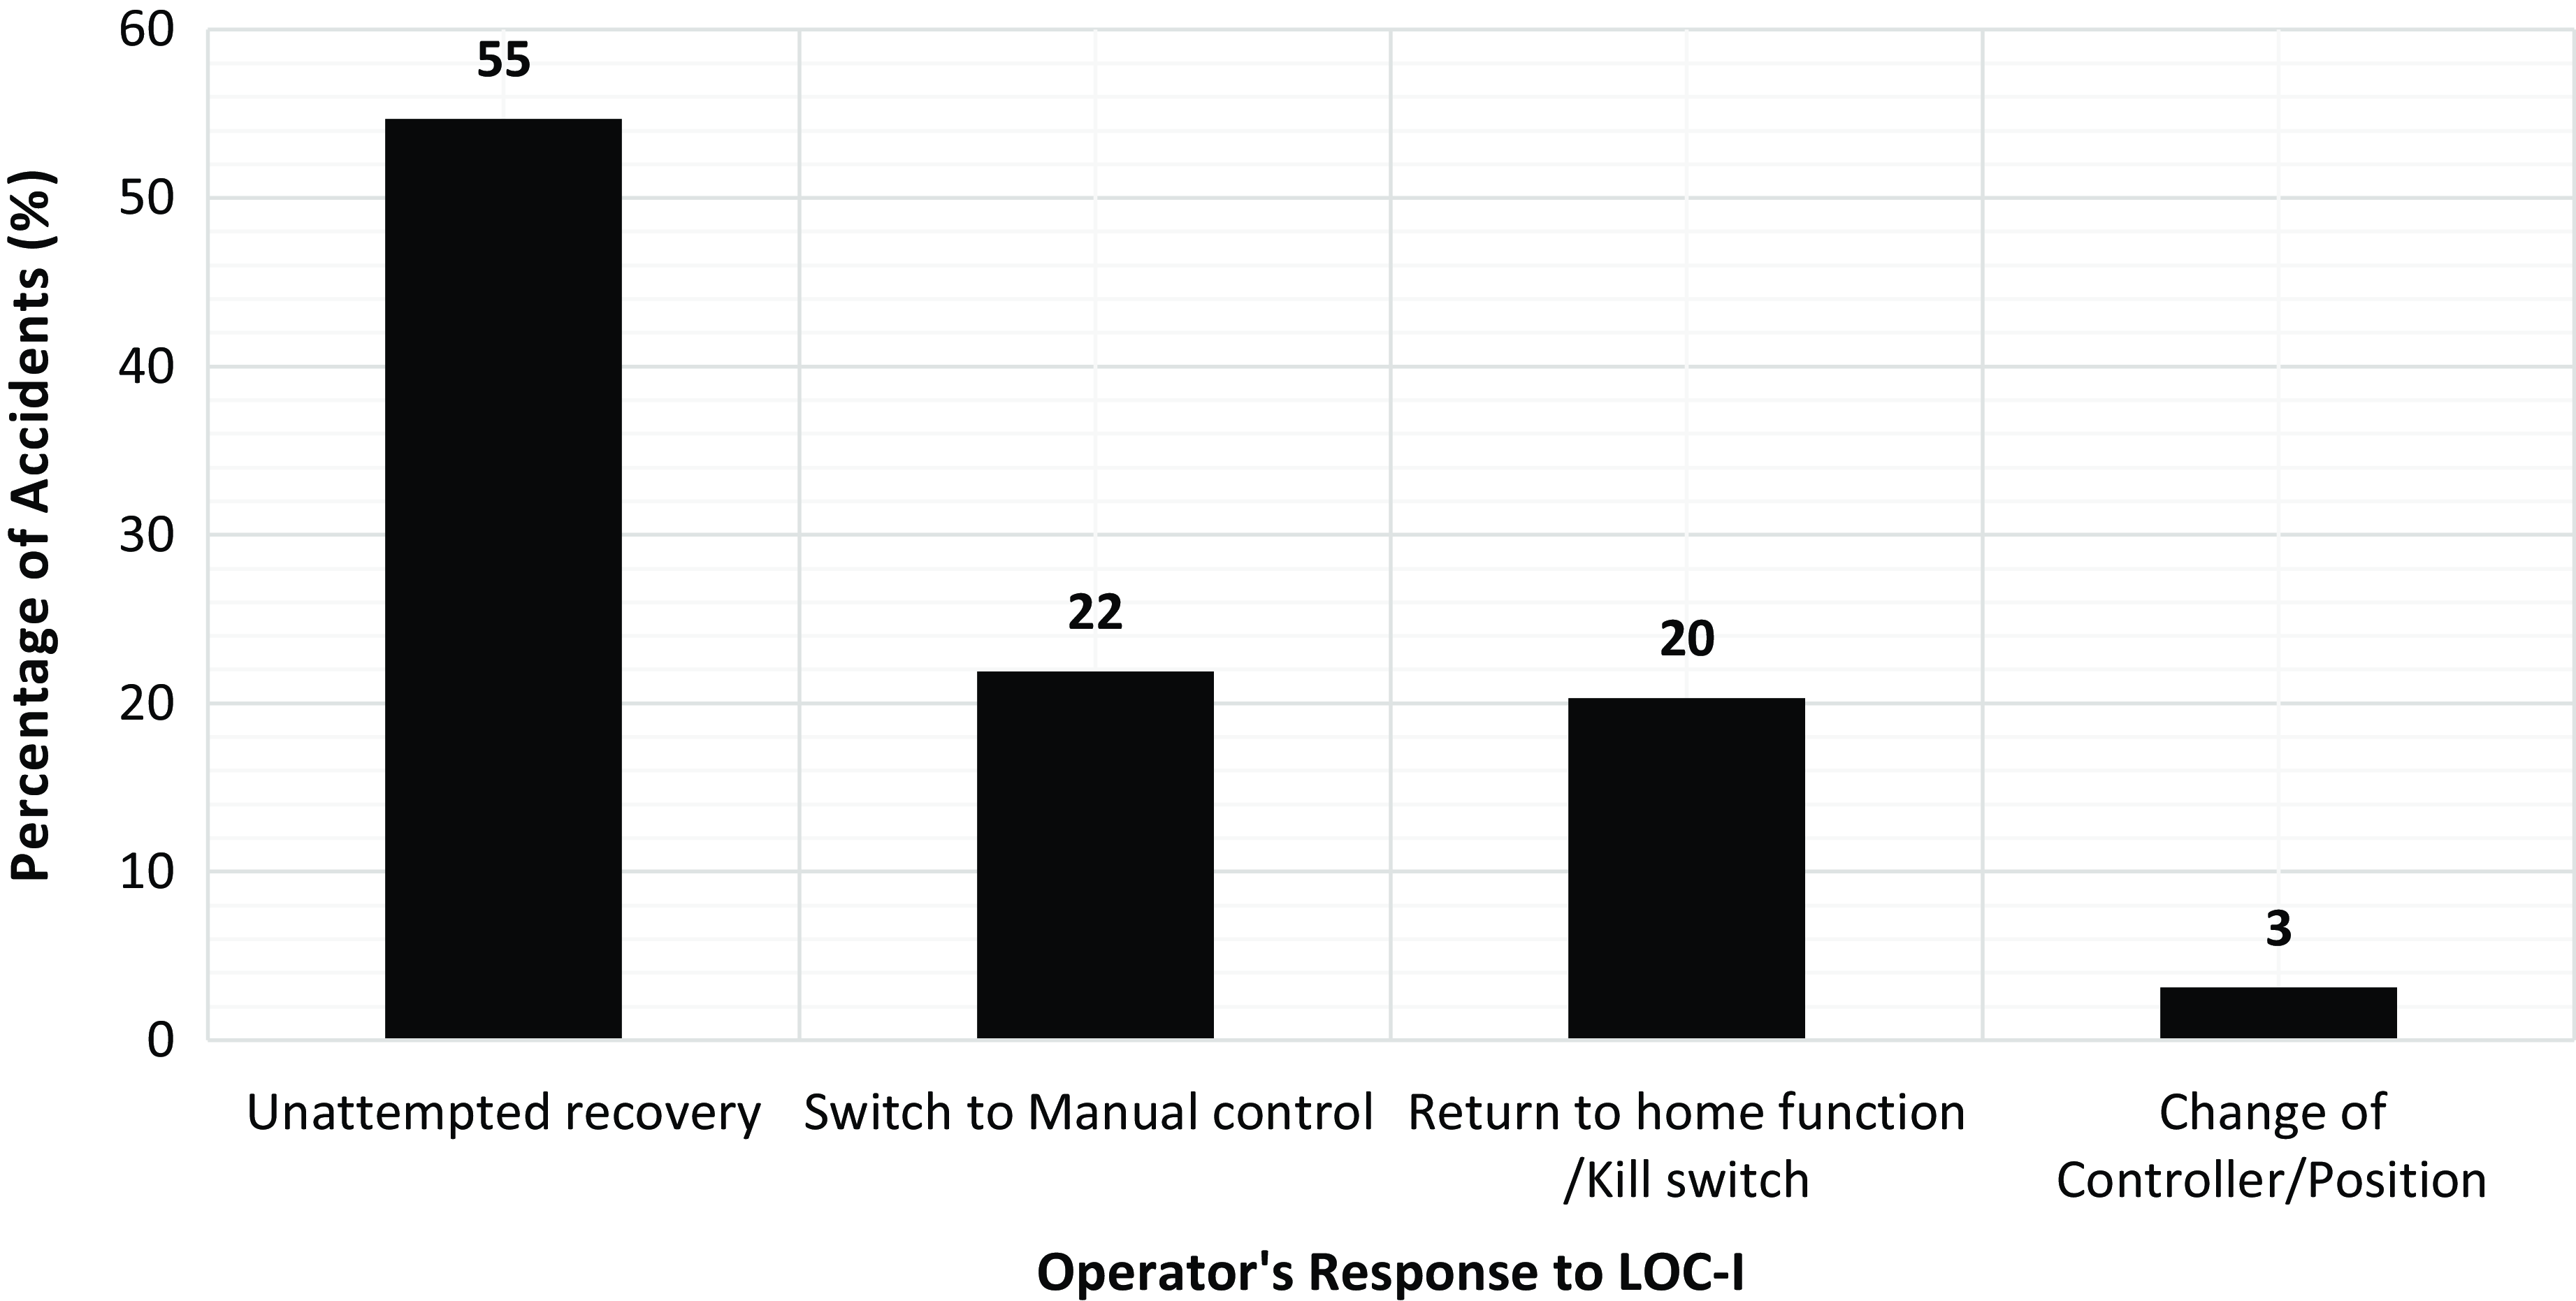
Figure 14. Percentage of accidents by recovery response to LOC-I.
Considering the relationship between operator’s age and the applied recovery method (Fig. 15), in the 40–49 year group recovery was attempted for only 8% of accidents and for the 50–59 age group for only 2% of accidents. In the 60+ age group category recovery was attempted in all accidents. For the 30–39 age group, 20% of all accidents – including all different recovery responses – were attempted and in 18% of accidents not attempted.
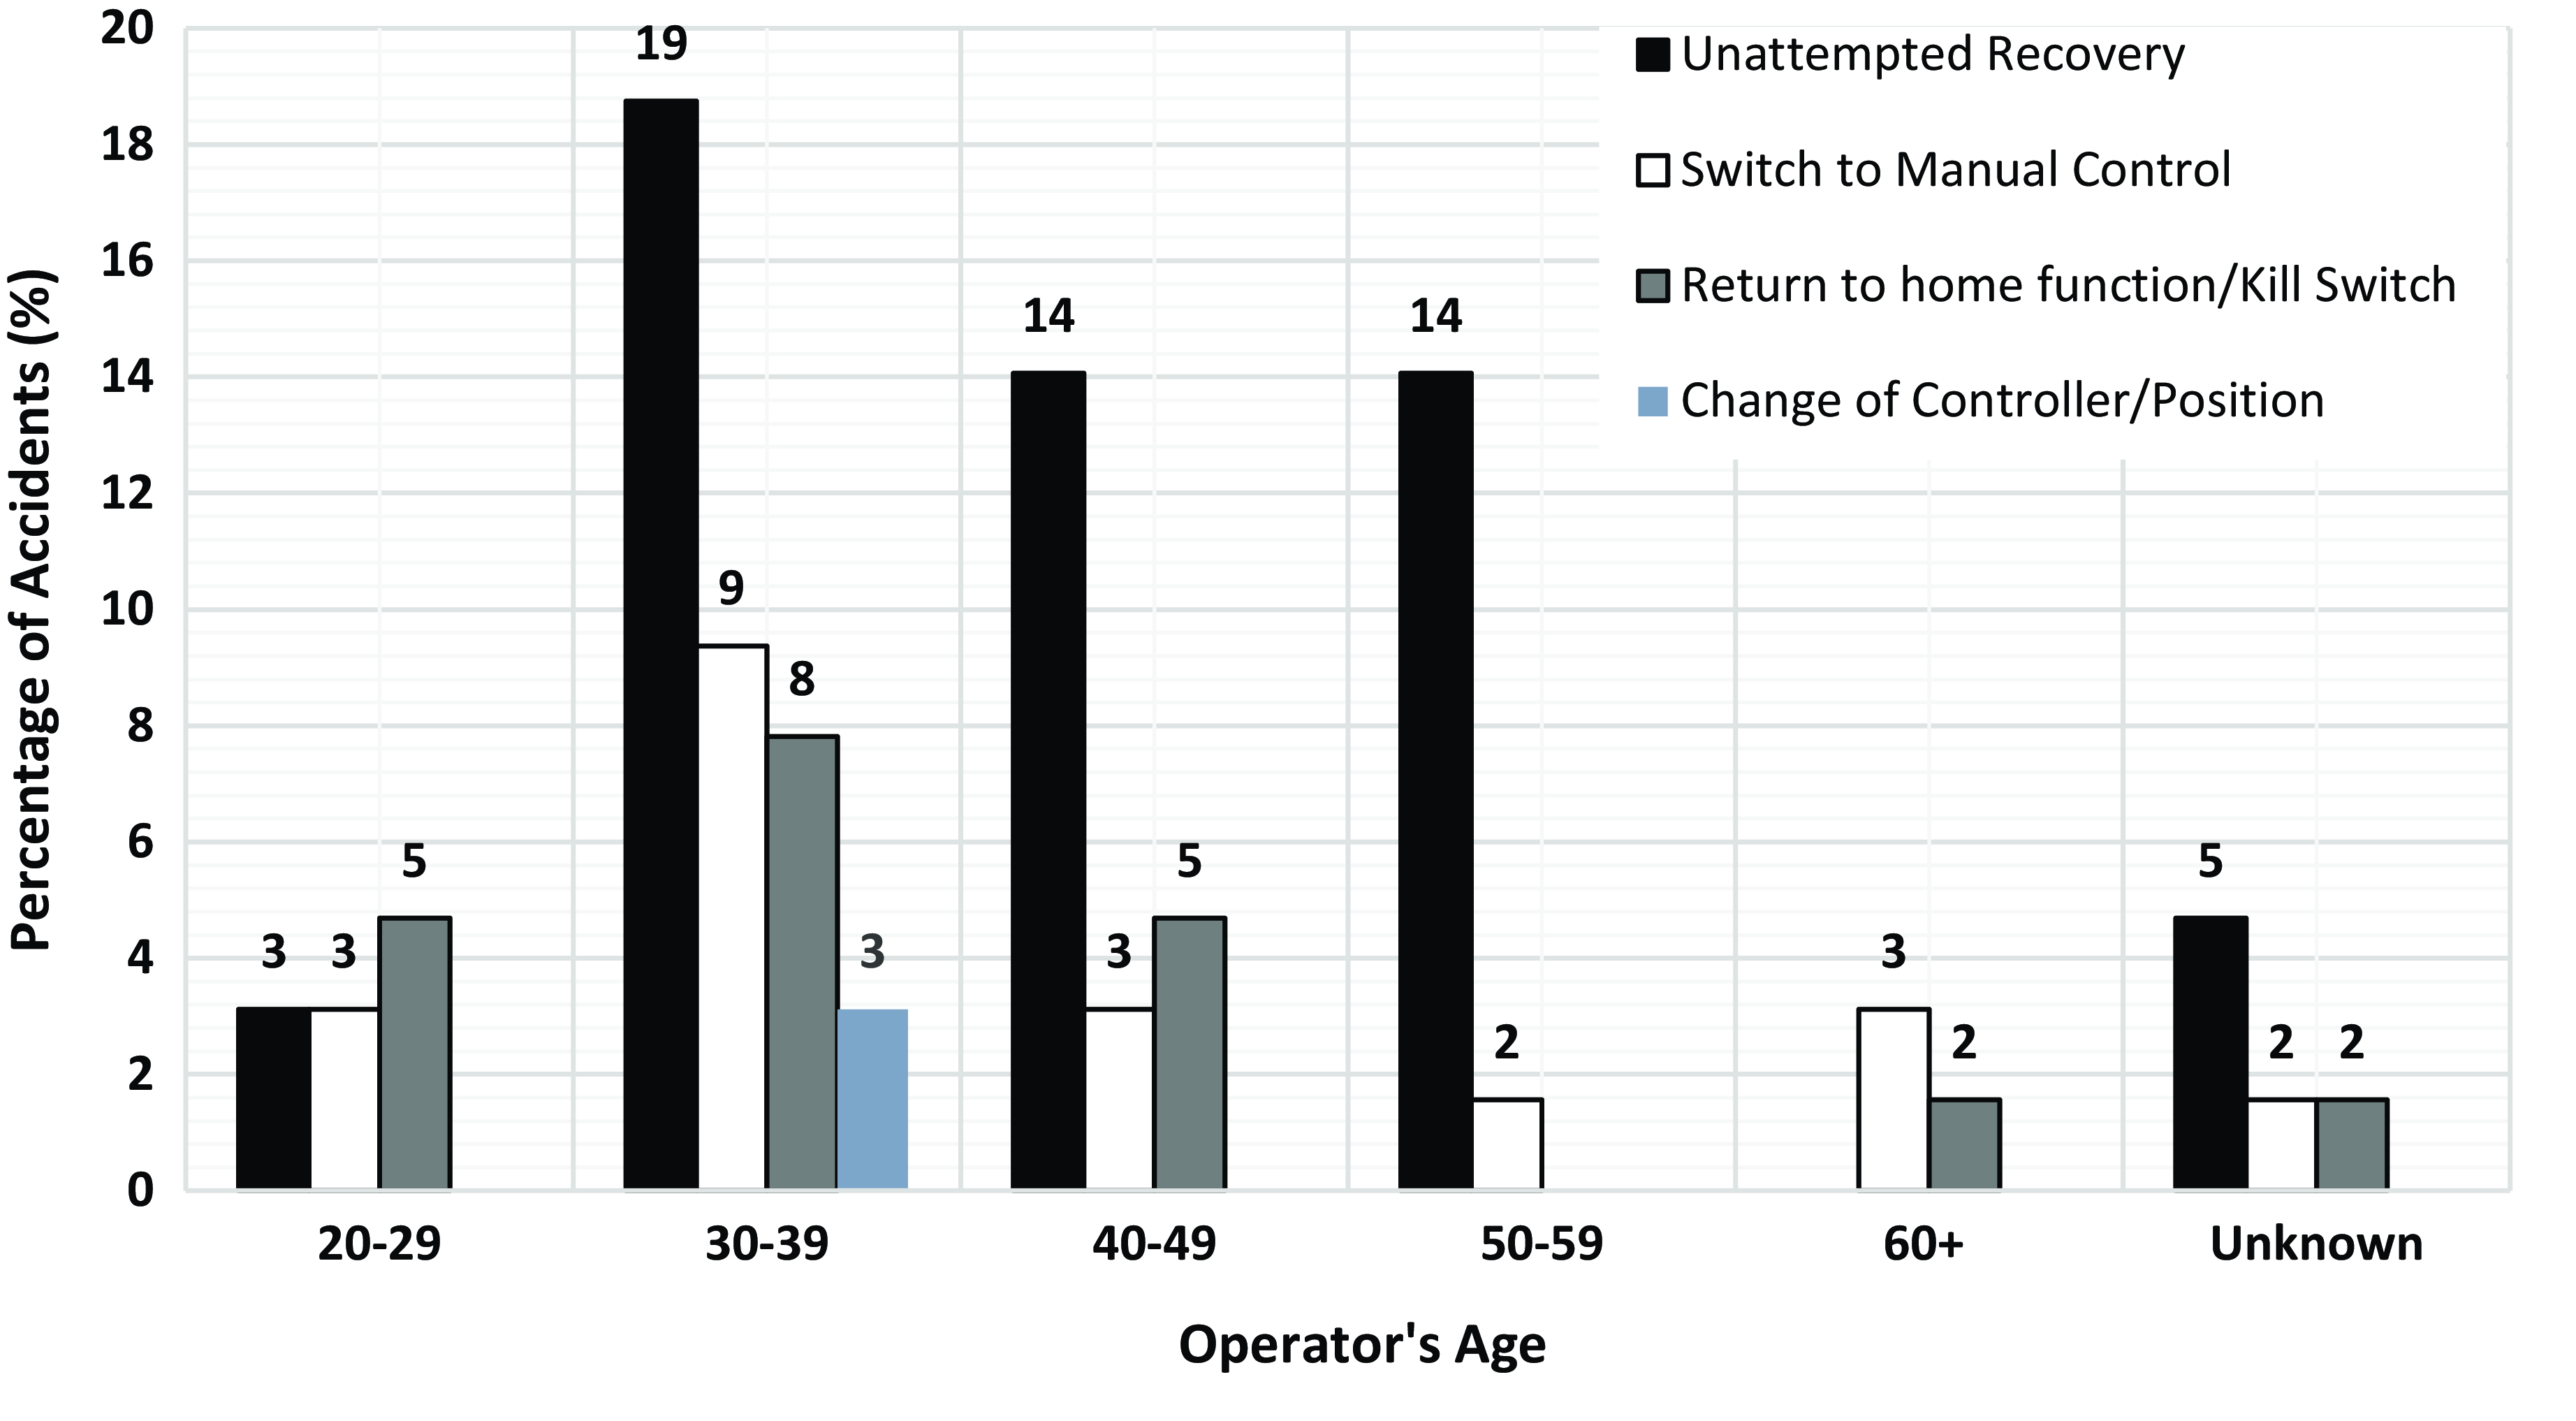
Figure 15. Distribution of percentage of accidents by recovery response and operator’s age.
Regarding the relationship between operator’s total hours of flying experience and the recovery method used (Fig. 16), the largest percentage for unattempted recovery occurred for operators with 99 hours or less. However, as the number of total hours of flying experience increased the number of unattempted recoveries decreased, being 8% for 100–399 hours and 0% for 400–999 hours. There is a moderate correlation between increased operators total flying experience and attempts at recovery (R 2 = 0.6134). Exceptions were noted for operators with greater than 1,000 total hours of flying experience.
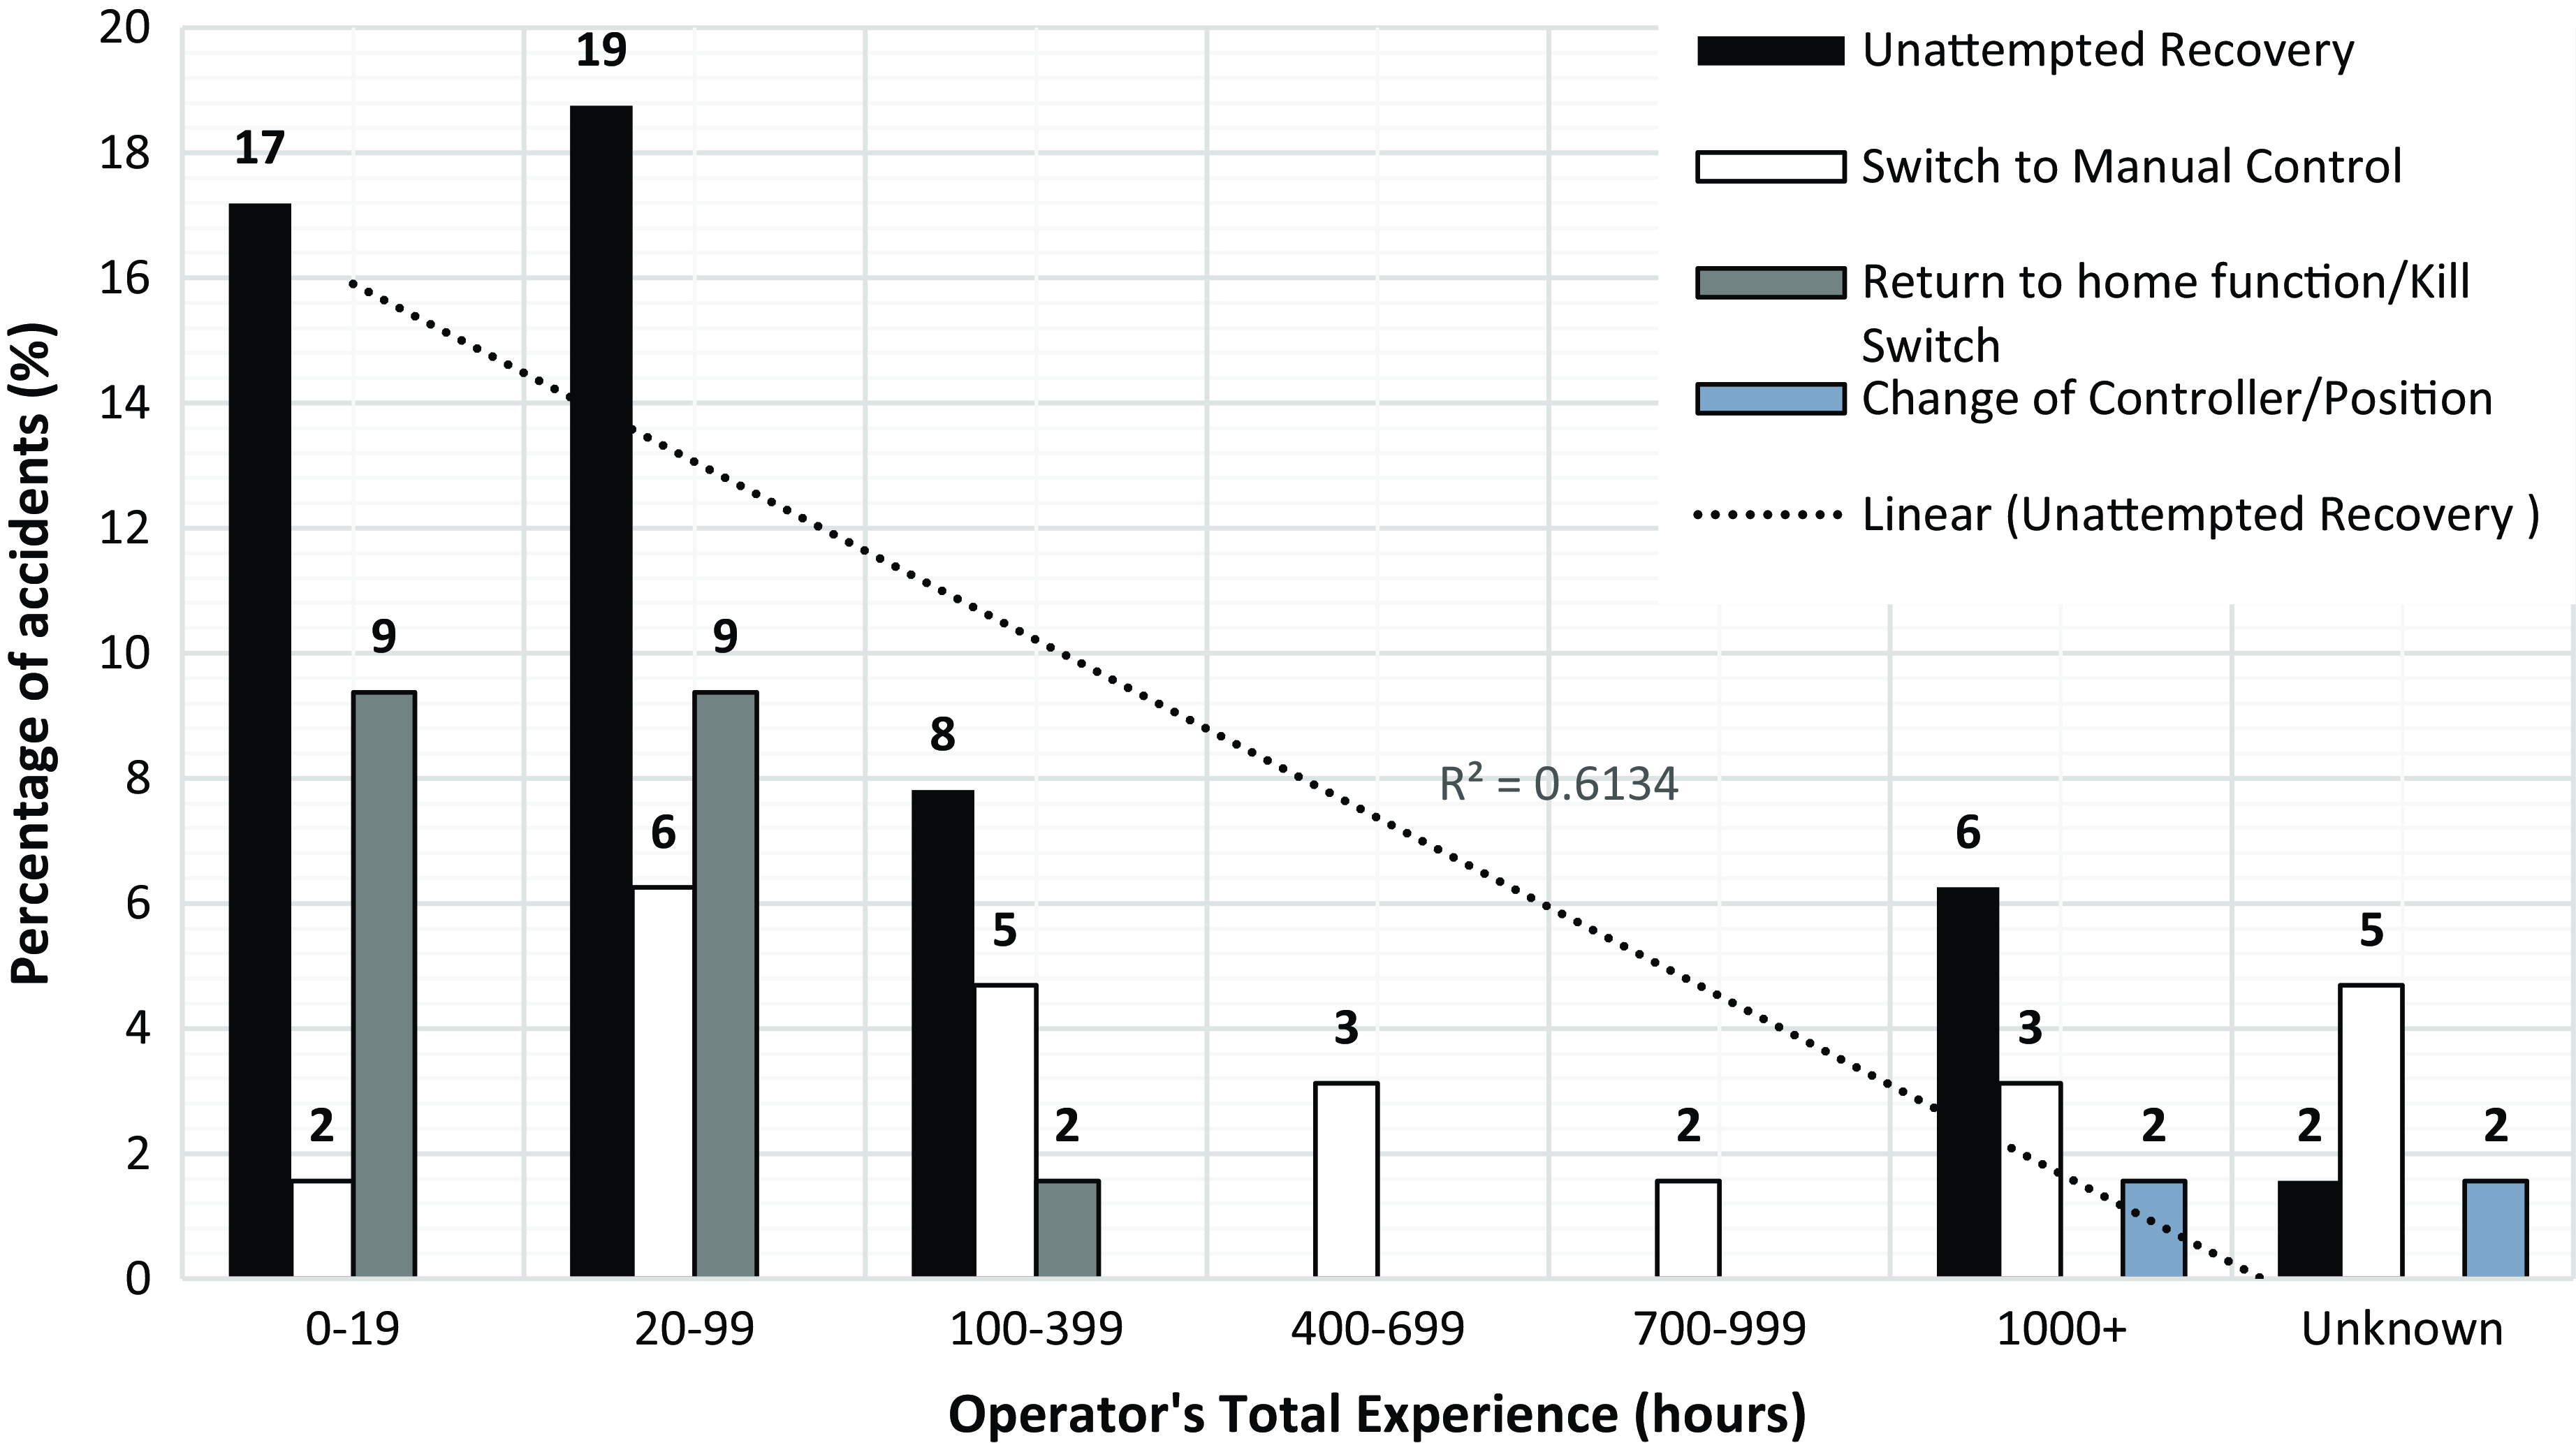
Figure 16. Percentage of accidents by recovery response and total hours of flying experience.
For causal and contributory factors leading to LOC-I with respect to the number of accidents (Fig. 17) the highest causal factor leading to LOC-I was manufacturing failure (34%) and the lowest environmental (5%) and change of operating environment (5%). In terms of contributory factors, the largest contributory factor was manufacturing issues (22%) and the lowest communication (2%) and change of operating environment (2%).
3.2 Results of the comparison of analysis methods
The identified causal, contributory factors and recovery methods were used to create a framework, graphically showing how they lead to LOC-I. Three frameworks were considered: HFACS, AcciMap and ARM. The strengths and weaknesses of each framework were analysed to identify the most appropriate accident investigation framework to use as a basis for LOC-I involving UAVs (Table 7).
Table 7. Comparison of analysis methods and suitability for UAV accident analysis
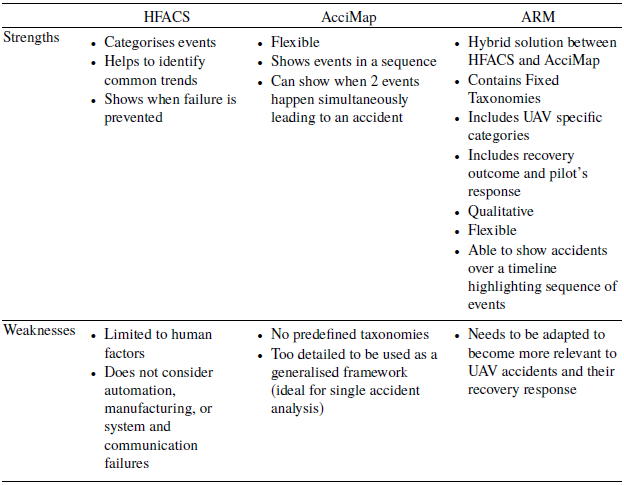
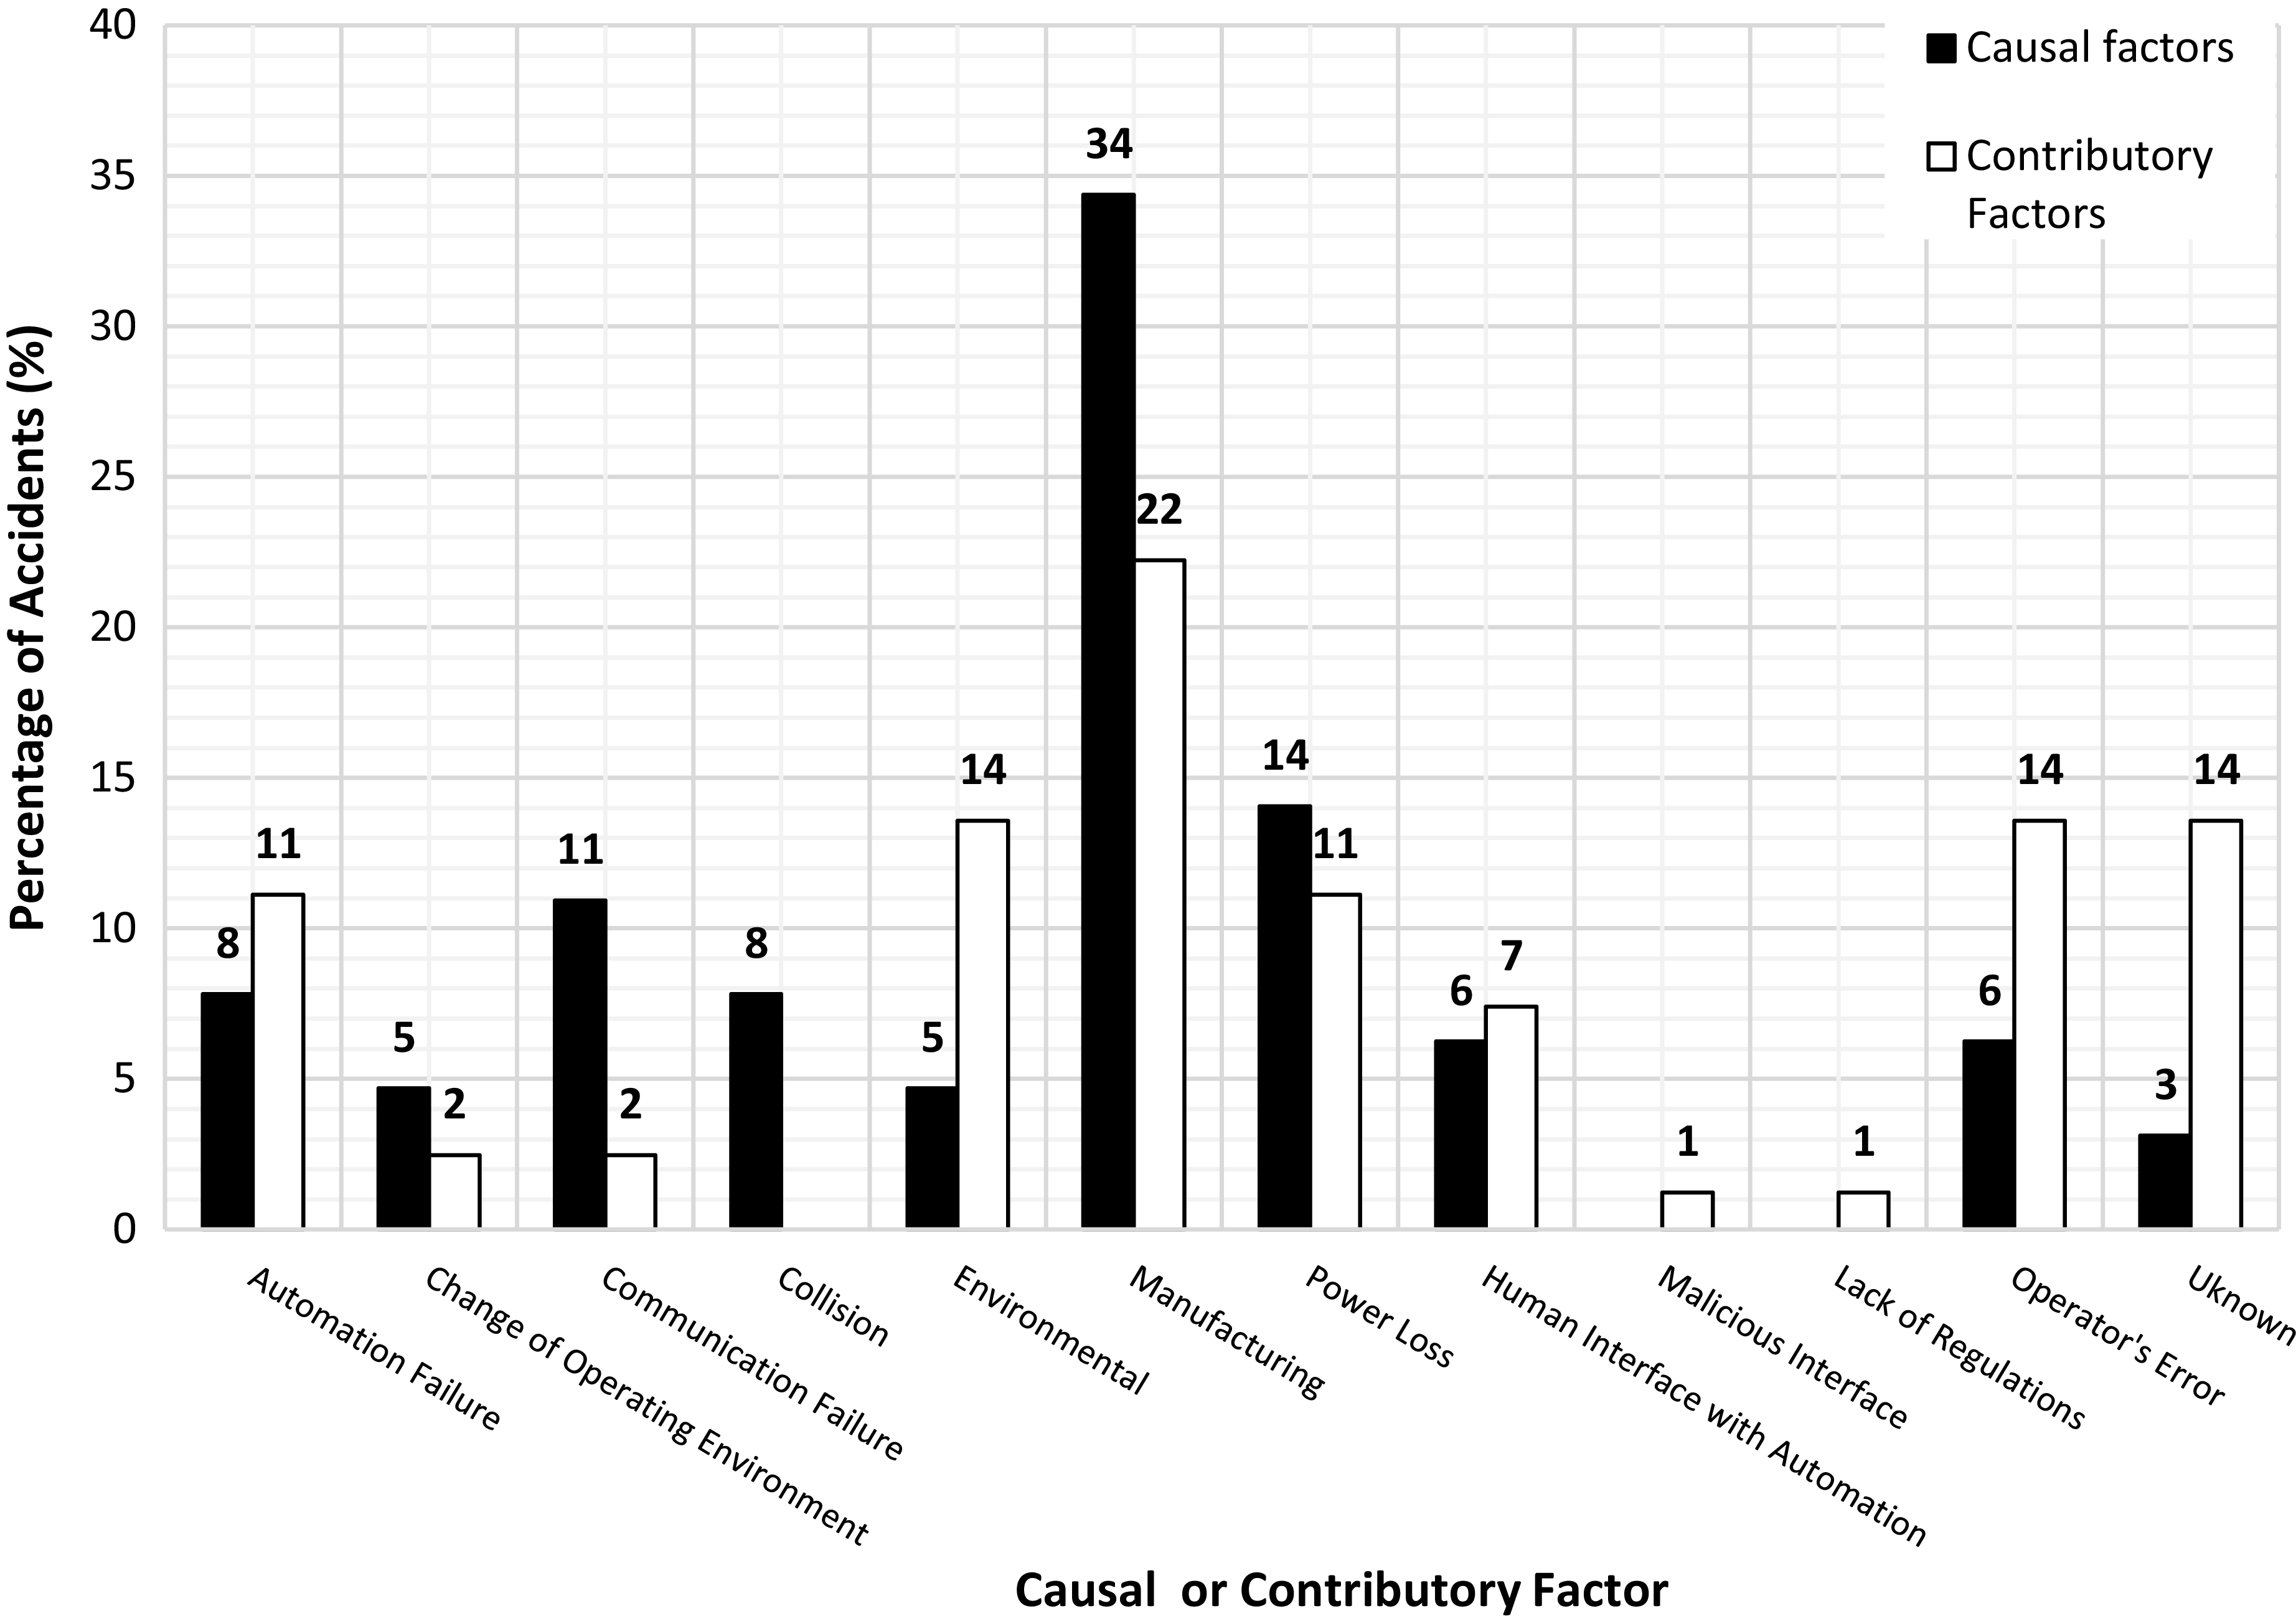
Figure 17. Percentage of accidents by causal and contributory factors leading to LOC-I.
ARM was selected since it combines the strengths of HFACS and AcciMap with a more flexible approach better suited to varied nature of UAV accidents.
3.3 An ARM for UAVs
Following this ARM was adapted to reflect primary and secondary categories and UAV characteristics. ARM-UAV – a finalised framework was then defined, for general application to any UAV accident. The framework was therefore adapted to UAV accidents by adding or removing events that were repeatedly found to be leading to LOC-I (Table 8).
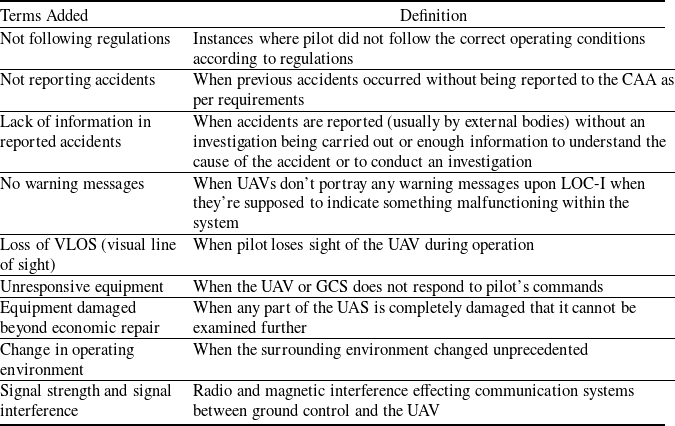
Table 8. Terms added to ARM and definitions
The main terms removed from the diagram were ‘escape and survival’ as they are not representative of UAV accidents and were replaced by more suitable terms (Table 9).
Table 9. Terms added to ARM in place of ‘escape and survival’ and definitions
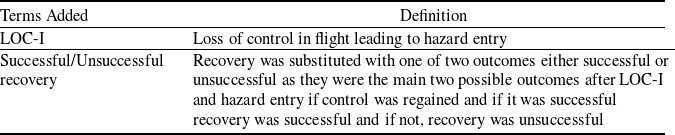
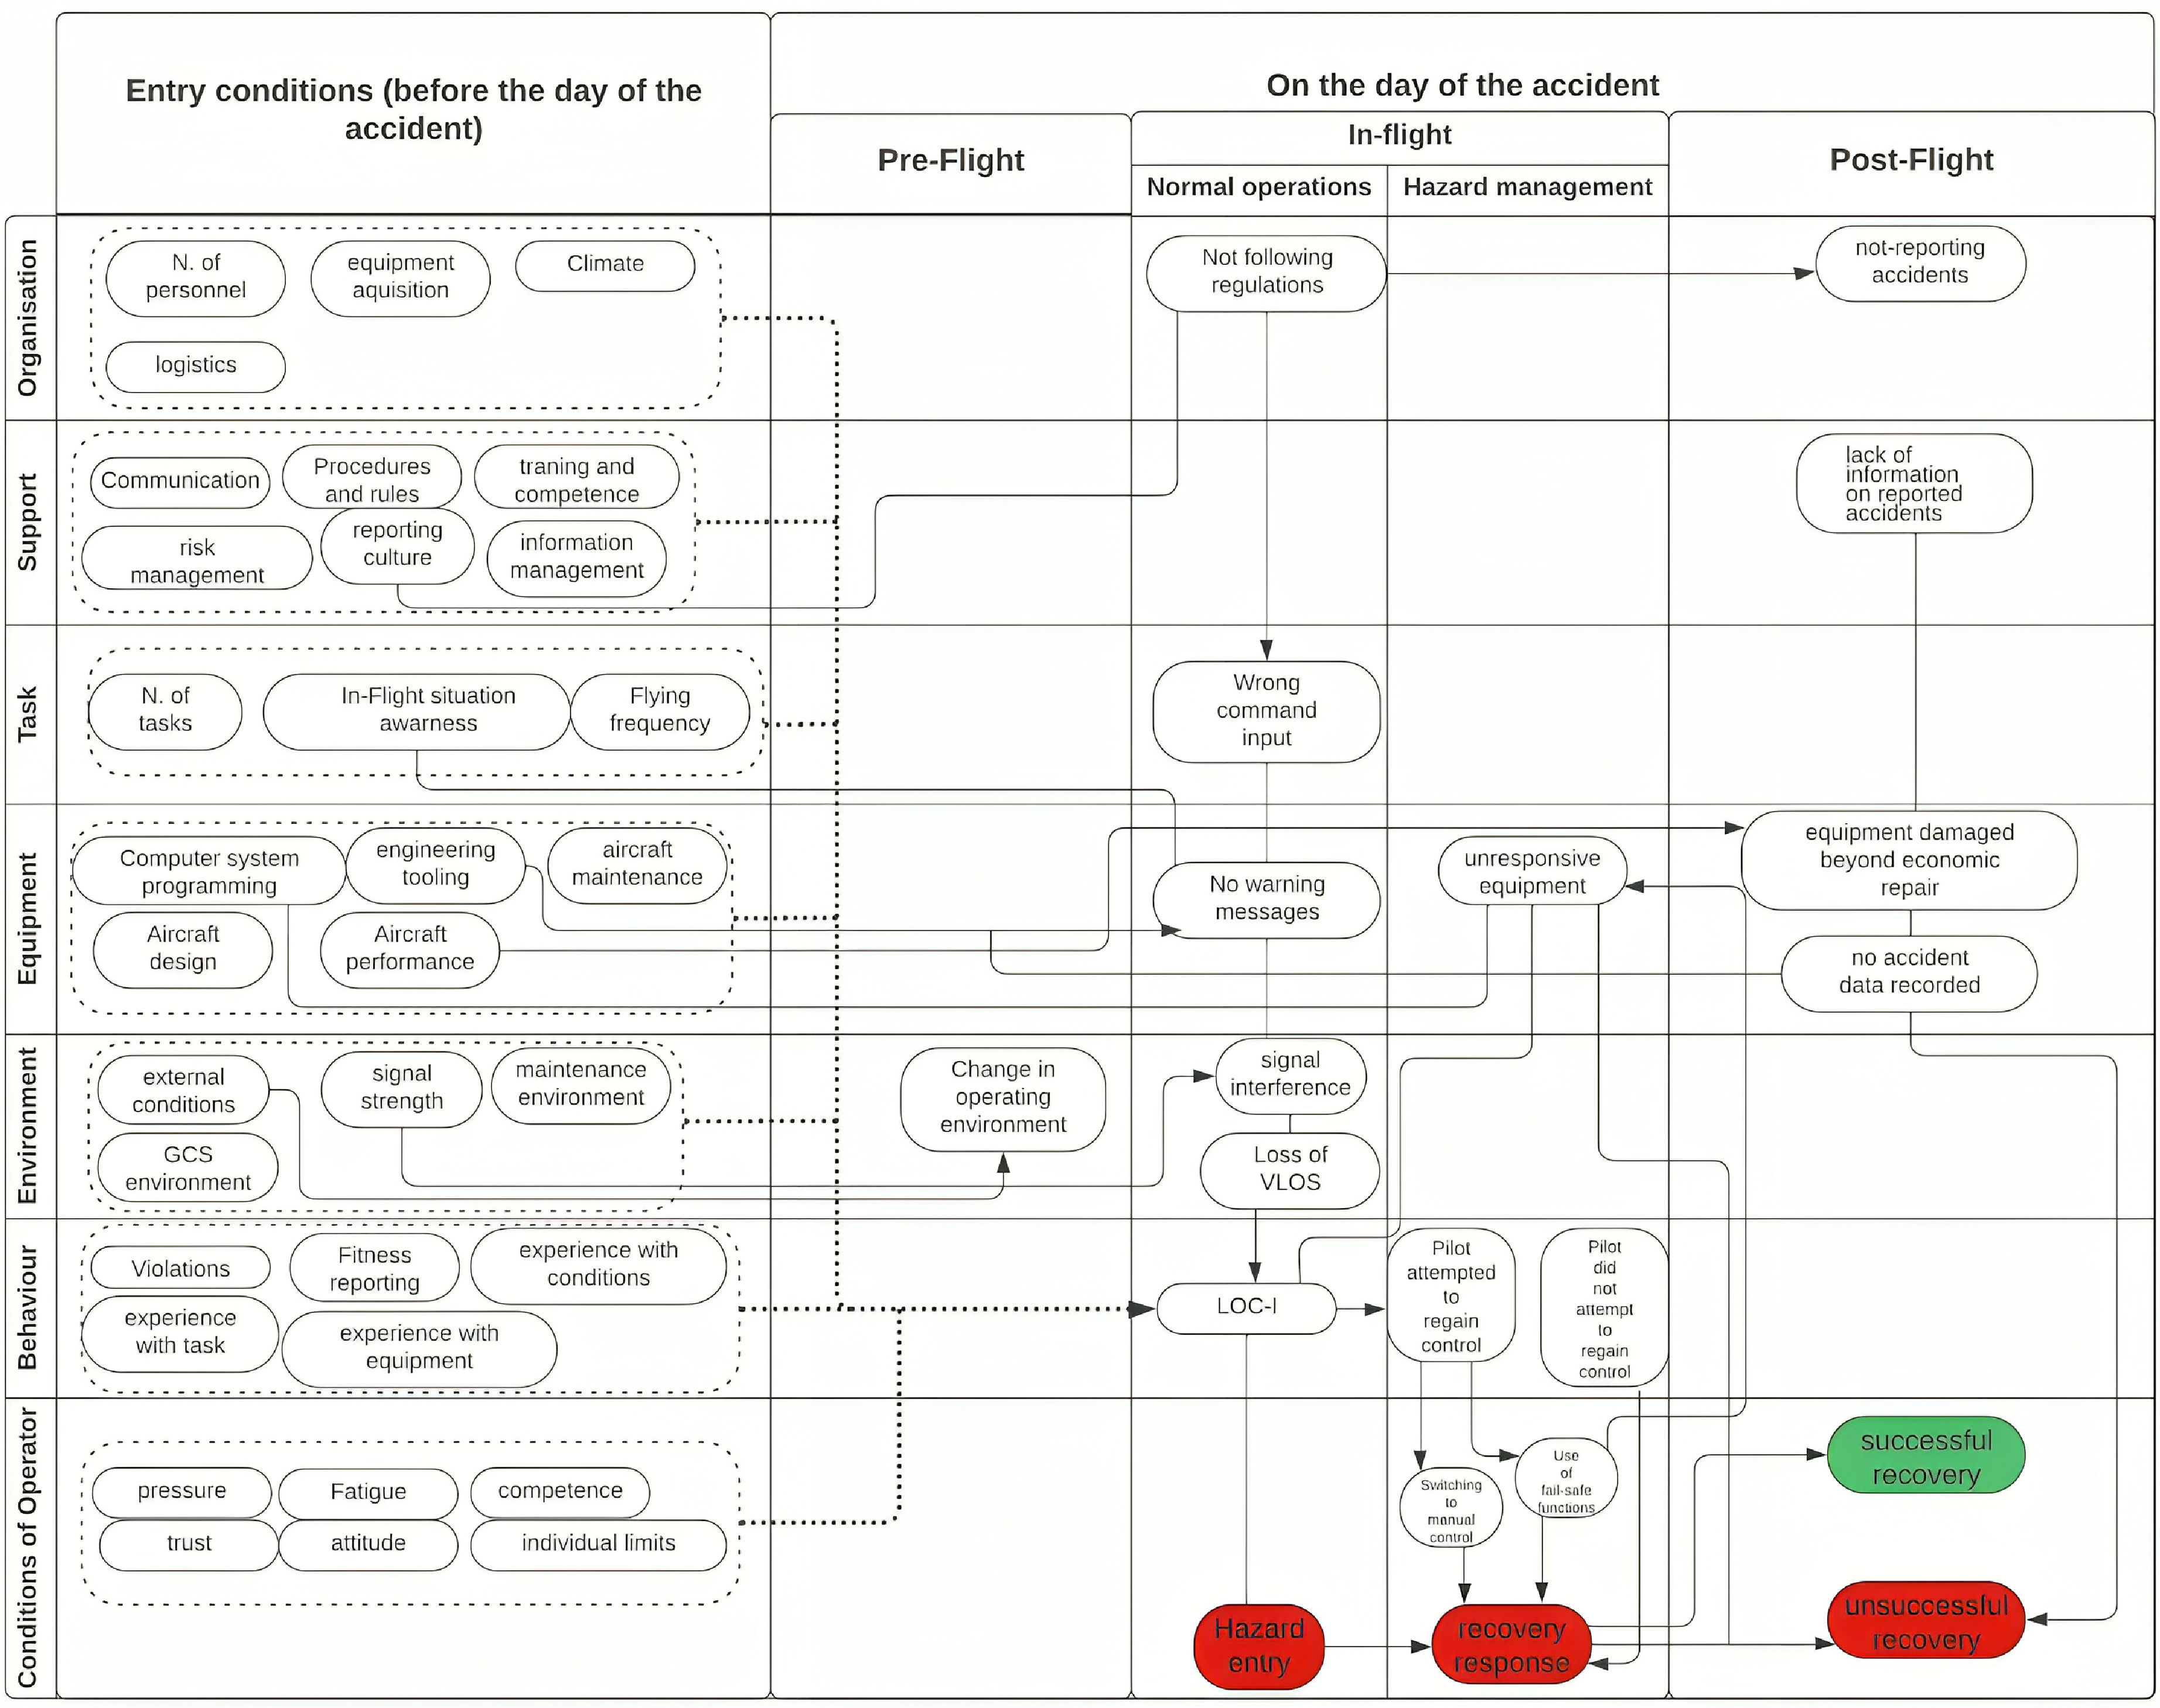
Figure 18. Modified ARM for UAV LOC-I framework containing all causal and contributory factors and how they lead to LOC-I.
The ARM was adapted and used to represent the causal and contributory factors leading to LOC-I and the possible recovery methods used. In the ‘Entry conditions (before day of the accident)’ section most causal and contributory factors are included. These could operate singularly or in combination of other factors leading to the events in the ‘On the day of the accident’ section. These events could lead to LOC-I, unattempted recovery or an attempted recovery method that could either lead to successful or unsuccessful recovery in the ‘Post-Flight’ column.
The adapted LOC-I framework was created to include all causal and contributory factors represented as a sequence of events leading to LOC-I as well as whether recovery was successful or not (Fig.18).
4.0 Discussion of results
The results of the UAV accident analysis and development of an adapted version of ARM more suited to UAVs (‘ARM-UAV’) are discussed in the following sections.
4.1 UAV accident analysis
4.1.1 Year
For the 60 accident reports analysed (Fig.5) the apparent decline in accidents post-2019 (37.5 % to 12.5%) may have been due to relaxed regulation introduced in June 2019 and lower number of flights during the Covid-19 pandemic from March 2020 to July 2021.
4.1.2 Mass
The majority of UAVs involved in the accidents analysed (83%) were below 10 kg, in line with the EASA/UK CAA ‘Open’ category as defined in June 2019 (Fig. 6). Only 8% of UAVs involved were above the 20 kg upper limit, suggesting that even if accidents occurred prior to 2019, most would not be required to follow the full set of regulations from the UK CAA. For UAVs between 5 and 10 kg after June 2019 (Fig.7) the number of accidents was 3% lower suggesting that the detail in EASA’s regulations for the open category may have contributed to reducing the number of reported accidents. Furthermore, the number of accidents involving UAVs above 20kg was significantly higher after 2019 which could be due to EASA’s standard scenarios being released in November 2019 [29] hence, without enough details for operators to conduct safe operations prior to that date. The aim of EASA’s standard scenarios was to facilitate some UAS operations including scenarios of Urban VLOS (visual line of sight) and Rural BVLOS (Beyond Visual line of sight) for aircraft in the ‘Specific’ category [Reference Agency30]. If the aircraft were included in this category, the operators were not required to wait for an authorisation, only needing to send a declaration to their respective authority [Reference Agency30]. The increase in accidents above 20Kg after 2019 may be an indication to EASA’s standard scenarios facilitating operations increased the risk of accidents.
4.1.3 Utilisation
Six types of UAV utilisation were identified within the reported accidents with commercial flights accounting for 37% of accidents, followed by aerial work (28%) and emergency services (27%) (Fig.8). Private operations accounted for only 3% of reported accidents despite the larger number of UAVs operated within the sector. With the introduction of stricter regulations, it is possible that many accidents were not reported within private operations since authorisation was not required within the revised regulatory framework for ‘Open’ and ‘Specific’ categories.
4.1.4 Age and experience
With regard to the reported operator age, 86% of accidents occurred for operators below 60 years of age with the highest percentage of accidents (38%) occurring within the 30–39 age group (Fig.9). Only 5 % of accidents involved operators in the 60+ years age group.
When considering the operator’s total flying experience and experience on type (Fig.10), the largest percentage of accidents occurred for operators with low levels of experience on type (less than 20 hrs) and as the total number of hours of total flying experience increased the percentage of accidents reduced (R 2 = 0.6708).
It is likely that situation awareness and readiness of the pilot increases as total flying experience and experience on type increases. This has potential to reduce the number of accidents in the future. The highest number of accidents occurred for operators with low total hours of experience, 0–19 hours (32%) and 20–100 hours (35%). These results suggest that the inclusion of a minimum number of flying hours on type included in regulations may reduce the number accidents in the future.
No direct correlation between pilot’s total flying experience with age (Fig.11) (R 2 = 0.0091) or with experience on type (Fig.12) (R 2 = 0.0134) with was found. UAV operators take up flying activities at different ages from 18 to 60+ and have a mean age of 40 years (SD = 9.9). Operators therefore build up their experience from different ages.
In relation to accidents according to operator’s experience and age group (Fig.13), the highest number of accidents is for operators occurred in the age group 30–49 with the lowest amount of experience hours between 0 and 99 hours. There is also a greater distribution of age groups between 0 and 99 hours of experience compared to higher experience groups.
This suggests that less experienced operators are more likely to experience LOC-I. This could be due to lack of situation awareness, unfamiliarity with equipment or higher reliance on autonomous features of UAVs. This further emphasises the need for minimum flying hours prior to operating UAVs as well as regulations to design and manufacture UAVs with the necessary automation features such as safe failure modes when used by inexperienced operators.
4.1.5 Recovery methods
For all reported accidents, the recovery methods were analysed whether recovery was attempted or not and if so, how this was achieved (Fig.14). In 55% of accidents, recovery was not attempted by the operator due to insufficient time to attempt recovery, losing sight of the UAV or not recognising LOC-I as a result of warning messages not being displayed. These issues suggest the operator’s high dependence upon automation, relying on fail-safe functions of UAVs and only on warning messages to recognise LOC-I. The findings are in agreement with previous studies suggesting that most human (operator) errors are caused by inconsistency of the GCS [Reference Nilsson18] and failure in autonomous devices to predict or respond to all scenarios [Reference Nilsson18]. It should be noted that in the event of a total power loss neither manual or automated recovery methods are effective.
Where recovery was attempted (45% of accidents), three different methods of recovery were observed. The main recovery mechanisms were switching to ‘manual control’ (21%) and relying on the ‘return to home function/kill switch’ (20%) and ‘change of controller position’ (3%) to obtain a better signal or VLOS. These unsuccessful recovery methods suggest unresponsive equipment to operator’s input when relying on automation and when switching to manual control.
Analysing age and total flying experience with respect to recovery response was done to understand the impact of these parameters on situation awareness. Only 15% of total accidents occur with operators in the age group 50–59 years (Fig. 15), and despite it being lower than most other age groups, it includes 14% of total accidents where recovery was not attempted (Fig.15). This is an indication of the reduction of situation awareness with age as proposed by the literature [Reference Barr17]. On the other hand, for the 20–29 years category, the largest recovery method attempted was the return to home function and kill switch, which implies the higher reliability on automation from younger operators. This could be interpreted as due to less hours of experience it is easier for operators to rely on automation rather than switching to manual control.
Most accidents where recovery was not attempted, as expected, are for less than 100 hours of experience with a significant 15% of accidents between 0 and 19 hours of experience (Fig.16). Furthermore, the largest reliability on return to home and kill switch functions are also between 0 and 99 hours with 9% for 0–19% and 9% for 20–99. Both these results are an indication for strong reliability on automation due to lack of situation awareness and lack of knowledge on how to use the equipment provided. Currently the CAA reduced the number of flying hours to one hour before any operation [31], however, according to these figures it might be necessary to implement more information on a minimum number of total flying hours before any operation. To increase the rate of attempted recovery and successful recovery for future operations, increased training for different failure scenarios, could be proposed when obtaining UAV flying licences or prior to any commercial operation.
4.1.6 Causal and contributory factors
A statistical analysis of the 60 accident reports identifying the main causal and contributory factors’ categories leading to LOC-I was completed (Fig.17). The total number of contributory factors is 81 compared to 64 total accidents (Table A1) implying that more than one contributory factor occurred simultaneously. The largest percentage of accidents occurred due to manufacturing failures (Fig.17 ) and this is true for both causes (34%) and contributory factors (22%). Due to the increasing number of manufacturing accidents the CAA released a list of specific requirements to reduce the frequency of propeller detachments for RPAS [31]. Subsequently, the largest cause and contributory factors to LOC-I are battery power loss (14%) and environmental factors (13.5%), respectively. A large percentage of accidents occurred due to battery malfunctions and water ingress. These causes could be an indication to the lower quality of production of UAVs, lack of redundancy mechanisms on board, and the strength of materials used to achieve lighter and lower cost products making them accessible to as many people as possible. Automation (14%) and communication systems (8%) failures were also significant causes to LOC-I as they are correlated. Communication systems’ failures such as radio or magnetic interference and loss of link do not appear as warnings resulting in automation failures in detecting these causes. Furthermore, automation failures indicate failed automated recovery mechanisms as previously discussed. Unresponsive equipment and lack of warning messages lead to further contributory factors such as operator’s errors (14%). This category being a significant contributory factor, it is one of the least causes (6%) to LOC-I, implying that most accidents are not caused by operator’s error but by the response of the operator to the UAV reaction, which could be an indication to lack of training for different failure scenarios of UAVs.
4.2 ARM-UAV – an ARM for UAVs
The ARM was adapted to include all accidents causal and contributory factors and how they occurred in a sequence of events leading to LOC-I, including operator’s response, the main post-flight procedures, and recovery response either being successful or not (Fig.18). All the events included before the day of the accident would not be altered in-flight implying that they are all conditions that the operator relies upon. As observed, some of these events lead to further causal and contributory factors during flight or post flight. This is representative of any unprecedented condition that occurred in-flight, because of operator’s decisions or other causes, leading to LOC-I.
The ARM was chosen as it has the flexibility of AcciMap and the structure of HFACs implying that if applied to more data or future events in the case of a required term to be added or removed it can easily be adapted. It is structured so that any future accident can be identified through a sequence of events to aid in avoiding failure of the UAV by recognising LOC-I as well as identify the main issues with current commercial UAVs preventing future accidents. Hence for example if a contributory factor such as unresponsive equipment was to be resolved or manufacturing issue this could lead to the terms being removed from the matrix showing that it aided in solving those features for UAVs. It isn’t representative however of the percentage of accidents occurring for each reason hence which characteristics to look out for the most.
The main drawback of using this framework is that some details from the accidents are not included but rather considered as a subcategory of which a taxonomy was previously defined as per how the framework was built. For example, when considering flying frequency under tasks it does not include the exact number of total flying hours experience or if the accident occurred due to the lack of number of flying hours on type, but rather it is a generalised subcategory indicating that the number of flying hours, with other contributing factors, led to loss of control in flight. Using pre-set subcategories that include every accident analysed was helpful in creating the framework as it gives a general indication to the main causes of LOC-I for all operations, hence it wouldn’t be specific to one accident or specific type of operation. This would aid in analysing and recognising a pattern where LOC-I would occur for UAVs and be able to create prevention methods for future operations avoiding the main causes to LOC-I. For example, ground control system equipment failures could be a main cause to LOC-I, hence, checking the ground control equipment more regularly might be added to pre-flight routines as a prevention method.
The LOC-I framework responds to the aim of this research as if used during training, it will highlight the main failure scenarios to operators allowing them to react correctly in case of LOC-I. Furthermore in case of an accident investigation the framework can be used to trace back what caused the accident and categorise it correctly following a more regulated investigation as opposed to the current methods.
5.0 Conclusions
5.1 UAV accident analysis
Sixty accident reports were analysed to identify the main causal and contributory factors leading to loss of control in flight (LOC-I) for UAVs. The largest number of accidents were due to in-service failures as a result of defective manufacturing (34% causal and 22% contributory). The lowest category of causal and contributory factors was due to change of operating environment (5% and 2%, respectively). Following loss of control in flight the aircraft was recovered by the operator in only 3 accidents out of a total of 60 (5%). Analysis of recovery methods showed that in 55% of accidents recovery was not attempted. The most common recovery method used was ‘switching to manual control’ (22%) and the least was ‘change of operator/controller position’ (3%). It is likely that increased training for different failure scenarios is required prior to operating UAVs to increase recovery success rates in case of LOC-I. A UAV LOC-I framework has been created to support such training to assist operators to identify possible failure modes and precursors leading to LOC-I, enabling improved recognition of LOC-I and recovery methods. When analysing age and experience, it was evident that lower age groups with less experience maybe more reliant on automation whereas older age groups were more likely to recognise LOC-I and attempt recovery. Analysis of the effects of age and experience showed the main demographic of UAV operators involved in these accidents were younger age groups with minimum flying experience. This highlights the need for requirement of a minimum number of hours of supervised flying experience on type to be added to the regulations prior to operating any drone to reduce the number of accidents and become more familiar with the equipment being used.
5.2 UAV accident framework
Using the identified causal and contributory factors and by adapting ARM a new framework was created (ARM-UAV) categorising all events and showing them as a timeline to indicate how they lead to LOC-I. The framework is representative of the applied recovery method applied and outcome. The framework shows usual patterns that lead to LOC-I enabling the recognition of LOC-I in UAV operations potentially increasing therefore the rates of successful recovery. This framework can be used to both investigate LOC-I accidents of UAVs or as a preventive method for operations and training. Using the results of the statistical analysis and the data gathered, a new definition for LOC-I for UAVs was deemed necessary considering the different operating environment of UAVs. Hence, loss of control in flight for UAVs has been defined as ‘the lack of response of a UAV to the operator or ground control system’s commands leading to the UAV deviating from the intended flight path or suddenly failing’. The operator or GCS’s commands could be either manually inputted or fully automated by being programmed prior to the operation. Loss of control in flight for UAVs is determined if the UAV is unresponsive to a command even if it fails safely due to pre-programmed features. Finally, LOC-I for UAVs may be recoverable if the UAV responds to manual inputs from the operator or if the UAV returns to its intended flight path autonomously and lands safely following an upset.
5.2 Appendix
Appendix A1
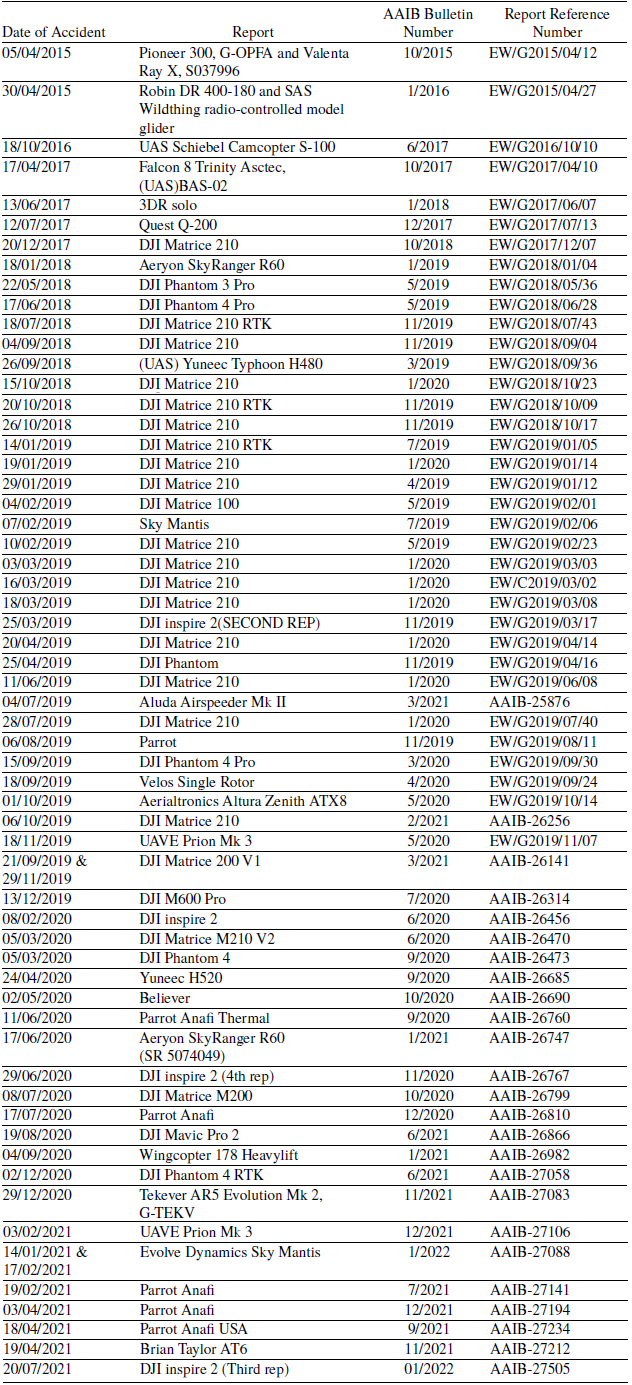
Table A1. List of UAV accidents analysed, April 2015 to July 2021 inclusive
Appendix A2
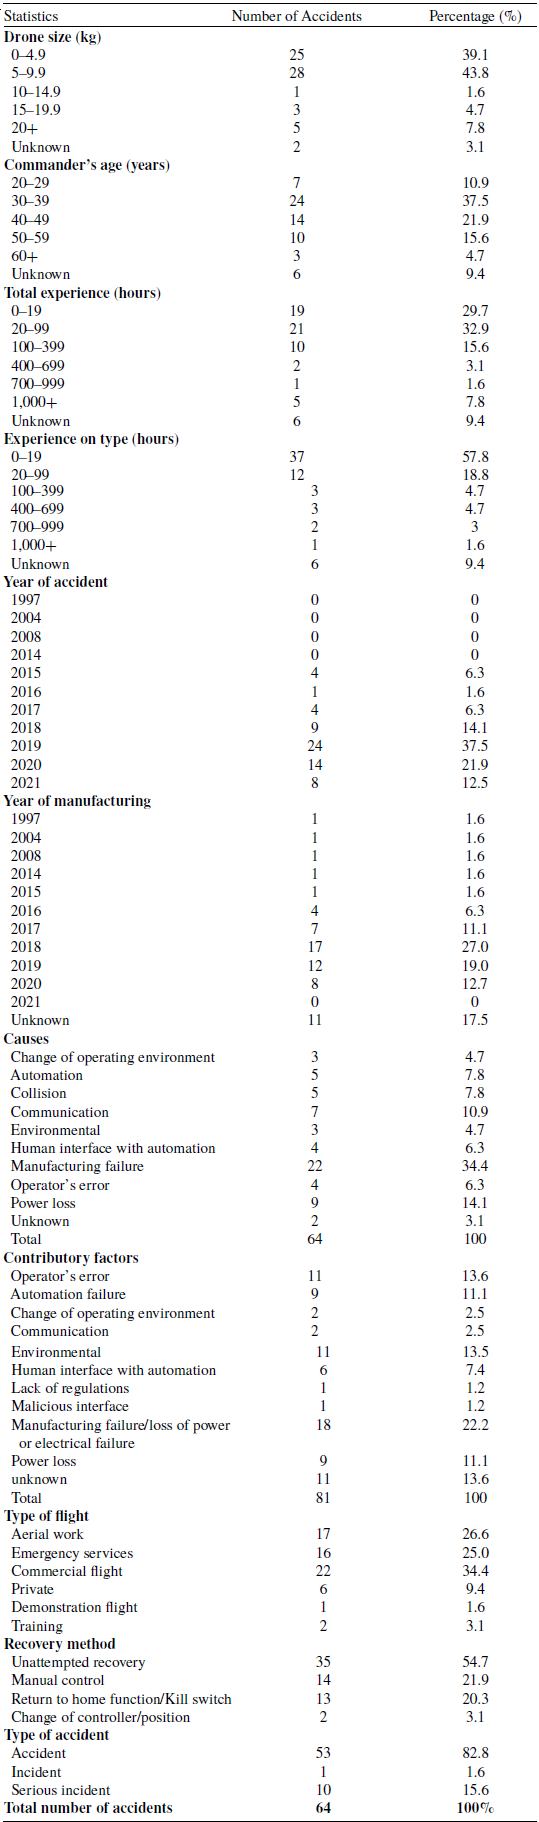
Table A2. Statistical results collected from analysing each report


 Open access